
Abstract
Infrastructure facilities are the most significant and necessary condition for the social and economic development of the people across the regions. The economy of Himachal Pradesh is widely affected by its rigorous physical topography and climatic condition, impacting its people and their lives. Where better and adequate infrastructure facilities are not only necessary but also significant for living in the state. But the inadequacy of these facilities in different regions and districts is a matter of great concern for the state. Therefore, the present study has attempted to examine the patterns of infrastructure development and inter-district disparities in Himachal Pradesh. All the districts of the state have been ranked according to their level of infrastructure development obtained with the help of relevant methods of deprivation index and development index comprising 18 indicators. The composite index and coefficient of variation have been employed for calculating the infrastructure development and its disparities, respectively. The district-wise data for all the indicators have been collected from secondary sources. The study revealed that districts Lahaul and Spiti, Solan, Hamirpur, Bilaspur, Shimla and Una were more developed, while the districts Kullu, Chamba, Kinnaur, Sirmaur, Mandi and Kangra were comparatively less developed. Also, the study has found decreasing inter-district disparities over two decades. The present study helped in identifying infrastructurally backward districts of Himachal Pradesh, which will help in policy-making and economic development of the state.
Keywords
Introduction
Infrastructure is the ‘sine-qua-non’ of an economy (Jaimurzina and Sánchez 2017). It is an umbrella term used for many activities and primarily comprises facilities such as electricity, roads, telecommunications, railways, irrigation, water supply and sanitation, ports and airports, storing facilities, and oil and gas pipelines of an economy (Asian Development Bank 2012). The concepts of growth and development of an economy are far beyond imagination without infrastructure facilities (Nakamura et al. 2019). Infrastructure is synonymous with development, and the lack of infrastructure services indicates barriers to growth as well as development (Asian Development Bank 2012). It plays a very important role in the form of physical capital investment that facilitates the foundation of the development of an economy (Jaimurzina and Sánchez 2017; Nakamura et al. 2019). Socio-economic development aims to raise the living standard of people by creating appropriate infrastructure facilities, such as roads, bridges, hospitals, schools and post offices (Rodrigue and Notteboom 2013). Adequate quantity, quality and availability of these infrastructure facilities are imperative for the development of an economy (Tripathi 2017). The availability of these facilities is more significant in the case of a developing economy like India that is engulfed with several economic problems (De 2008; Maniar 2012; Rastogi 2002). Better infrastructure raises productivity, lowers production cost, improves living standard and eradicates poverty (Chatterjee et al. 2004). In the modern economy, the availability of better infrastructure facilities is considered a milestone in a welfare state. It serves as an edifice for building the superstructure of an economy. That is why infrastructure is said to be the wheel of the economy, if not the engine (Rao and Rao 1999; World Bank 1994).
India is a country with diverse geographical variations with plains, plateaus, deserts, river basins and coastal and hilly regions particularly. Where the hilly region constitutes 21% of the entire geographical region, and 9% of the total population residing in this region of the country. This hilly area includes states and UTs such as Jammu & Kashmir, Ladakh, Himachal Pradesh, Uttarakhand, Sikkim, Arunachal Pradesh and some parts of other northeastern states, which have abundant natural resources and basic life support systems. Himachal Pradesh is observed to be the most progressive state among all the hilly states and regions; it has made remarkable achievements in the socio-economic development of its people (Tripathi 2017; Verma and Partap 1992). Due to the adverse geophysical structure, around 90% of the population of Himachal Pradesh lives in rural areas where agriculture, horticulture and farming activities are the key occupations of the people of the state (Gouri et al. 2004; Tiwari 2008).
Himachal Pradesh has made a significant achievement in the field of industrialisation, where quite a few numbers of its population are employed. Road transportation is the principal mode of transportation in Himachal Pradesh (Tripathi 2017). In hilly states, the entire progress depends primarily on the development of roads. It is not possible to provide an appreciable length of railways in these areas. No movements of any kind, of materials or person, are possible unless there is a well-developed system of roads and road transportation. Thus, the roads constitute the very lifeline of Himachal’s economy. Himachal Pradesh has a vast hydroelectric potential that is estimated at 24,000 MW (Government of Himachal Pradesh 2019–20). It is a matter of satisfaction that despite very difficult and mountainous terrains, almost all the inhabited villages in the state have been electrified. Special attention has also been paid to the provision of educational and healthcare infrastructure in the remotest rural area of the state (Government of Himachal Pradesh 2019–20). Also, the state has better penetration of higher education than the national average, where 82.80% of the population is literate as per the national census of 2011. Despite this high growth and splendid development in all these sectors and the intensive plans, development is not consistent for all the regions as well as districts of the state. The extremely hilly regions of the state are still far from road connectivity, bank services and better healthcare facilities. Most of the infrastructural facilities are mainly concentrated in lower landscapes of the state than the upper mountainous terrains. Also, these infrastructural facilities are not proportionate to the population inhabited in these regions of the state. As a result, the state is characterised by physical topography and wide regional disparities in resource endowment (Tiwari 2008; Tripathi 2017). Therefore, keeping in view the above distinctions, the study needs to examine the patterns of infrastructure development and its disparities in the state over a period of time.
Review of Literature
Related to the concerned research problem, some pertinent and significant studies have been reviewed, such as Sahoo and Saxena (1999) who examined the relationship between infrastructure facilities and economic development in India and found that infrastructure facilities are responsible for economic growth and recognised the importance of infrastructure for the economy as a whole. Tiwari (2000) found a positive correlation between infrastructure and economic development in Himachal Pradesh, a hill state of India, and described that adequate infrastructural facilities act as a catalytic agent in promoting economic activities and minimising the setbacks to the economy. In another study, Tiwari (2003) found that Himachal Pradesh is a much better place in respect to rural infrastructure facilities than other hill states, but the availability of infrastructure is uneven according to the demand of rural masses. Also, Ghosh and De (2004) studied the impact of different categories of infrastructure development among Indian states and found that inter-state disparities are at an acute level in physical, social and economic infrastructure facilities among states. They concluded that such disparities are responsible for growing regional income disparities among states in the country.
Further, Narain et al. (2005) studied the 39 socio-economic indicators utilised for all the 14 districts of the state of Kerala. The study found wide disparities in the level of development among different districts, and infrastructural facilities were positively associated with the socio-economic development of the state of Kerala, India. Majumder (2005) examined the interlinkage between infrastructure and regional development in India and observed that there was a noticeable rise in the level of infrastructure and development, but regional disparities also increased during the study period. However, Patra and Acharya (2011) analysed the spatial disparities in infrastructure facilities across 16 major states of India and found that there was a positive relationship between the infrastructure development index and per capita net state domestic product and a negative relation between the infrastructure development index and poverty among states in India.
Similarly, Thakur (2012) inter-linked rural infrastructure and poverty eradication in rural areas and suggested that public investment in physical infrastructure is essential to raise productivity and achieve long-term economic growth, which can lead to higher farm and non-farm productivity, employment and income opportunities, reducing poverty by raising mean income, raising consumption, etc. in rural areas. Recently, Tripathi (2017) analysed the disparities in socio-economic infrastructure, agriculture and economic development of Himachal Pradesh and found that districts such as Lahaul and Spiti, Kinnaur, Bilaspur and Hamirpur are relatively less developed than the developed districts such as Kangra, Mandi, Sirmaur and Shimla. Also, Singh (2020) found that there is a cause-and-effect relationship between infrastructure and economic development, and infrastructure is positively related to numerous socio-economic factors in Himachal Pradesh.
It has been perceived from the above studies that there are disparities in infrastructure facilities and their development among inter- and intra-states also. Many similar studies on infrastructure development have been conducted throughout the world, but a few studies have been found on the infrastructure development and its disparities in Himachal Pradesh. Also, these studies did not provide any changing patterns of infrastructural facilities and their distribution over time in the state. More importantly, these studies lack the evaluation of the changing patterns of disparities in infrastructural facilities in different settings and districts of the state. A few important indicators have also been ignored in the previous studies, which compelled us to examine the infrastructural development and disparities in Himachal Pradesh in a detailed manner. The present study has analysed data on infrastructure facilities till 2019–20, which show the current state of infrastructure development and its disparities in Himachal Pradesh. Hence, it is anticipated that the outcome of the study will provide a deep insight into the infrastructure facilities and their development in Himachal Pradesh for further policy analysis.
Objectives of the Study
The present study aims to analyse the growth and development of infrastructural facilities, their distribution among different districts, disparities among districts and their ranking according to their level of infrastructure development by employing the composite index of development in Himachal Pradesh.
Hypothesis
Ha: Inter-district disparities are decreasing in infrastructural facilities in Himachal Pradesh over a period of time due to concerted planned efforts.
Database and Methodology
The most crucial task was to identify the infrastructure variables. For this purpose, 18 indicators of infrastructure development were rationally selected by developing insights from the review of literature and as per the objectives of the study. Three indicators for roads and transportation facilities, area- and population-wise; six indicators for general educational infrastructure; three indicators for medical and health infrastructure; two indicators for communication facilities and four indicators for banking facilities were considered in the study. The present study used secondary data, taken from various issues of the Statistical Abstract of Himachal Pradesh, Government of Himachal Pradesh (2001–02, 2011–12 and 2019–20).
The list of indicators (modified) used to construct Infrastructural Development Index is given as under:
I1: Total roads length per 1,000 sq. km of the area I2: Length of road per lakh of the population I3: Number of registered motor vehicles per lakh of the population I4: Number of primary schools per 100 sq. km of the area I5: Number of primary schools per lakh of the population I6: Number of middle schools per 100 sq. km of the area I7: Number of middle schools per lakh of the population I8: Number of secondary schools per lakh of the population I9: Number of colleges per lakh of the population I10: Total number of medical institutions per 100 sq. km of the area I11: Total number of medical institutions per lakh of the population I12: Number of beds in hospitals per lakh of the population I13: Number of post offices per 1,000 sq. km I14: Number of post offices per lakh of the population I15: Number of banks per 100 sq. km I16: Number of banks per lakh of the population I17: Number of ATMs per 100 sq. km of the area I18: Number of ATMs per lakh of the population
Indicators were modified to assess the availability of resources in real sense, that is, to obtain a true relative picture as there were huge inter-district differences in the population and area of different districts of Himachal Pradesh. All the indicators were modified using data for the projected population and area of concerned districts over the study period (Kumar and Singh 2020).
To modify an indicator, with the total road length per 1,000 sq. km of the area (I1) in the district ‘i’ at a time period ‘t’, the following modification procedure was applied:

where Iit is the total length of road and Ait is the area of district in district ‘i’ at the time period ‘t’. This formula was applied to modify the indicator I13 as well.
While to modify the indicators I4, I6, I10, I15 and I17, with per 100 sq. km of the area, the following modification procedure was used:

In the case of an indicator, with the length of road per lakh population (I2) in district ‘i’ at a time period ‘t’, the following modification procedure was applied:

where Iit is the total length of road in district ‘i’ at a time period ‘t’, Pit is the mid-year projected population of district ‘i’ at a time period ‘t’.
In the same manner, the indicators I2, I3, I5, I7, I8, I9, I11, I12, I14, I16 and I18 were dealt with to modify their forms, that is, ‘per 100,000’ in parity with the indicator I2.
Due to the unavailability of data for the indicators I17 and I18, zero values were used for the years 2001–02 and 2011–12, while for the years 2019–20, all 18 indicators were used for index construction in the study.
Measurement of Composite Development Index
To measure the composite index of development, deprivation and development index was worked out using the technique of the United Nations Institute of Social Research (Murray, 1991). The index was derived using the following formula:

The deprivation score ranges between 0 and 1, with 1 denoting the maximum deprivation and 0 the least deprivation. Subtracting the deprivation score from 1, the development index is derived as:

This method was applied in the present study for the calculation of the infrastructure development index of all indicators taken in the study. And using the development score, the composite index of development was calculated for all the districts:

where ‘Ii’ represents the development score of all indicators in a particular district and ‘N’ is the total number of indicators taken in the study.
Similarly, the composite index of development was worked out for all 12 districts of Himachal Pradesh, and based on the composite index, ranking of districts was done.
To measure inter-district disparities, the statistical tool coefficient of variation has been used (Tiwari 2002). The coefficient of variation is a statistical measure of the relative dispersion of data points around the mean in a data series.

where C.V. is the coefficient of variation, ‘σ’ is the standard deviation and ‘x̄’ is the arithmetic mean.
To calculate the coefficient of variation, standard deviation has been used that measures the amount of variation of a set of values:
where ‘σ’ is the standard deviation, ‘X’ is one item in a series, ‘x̅’ is the arithmetic mean and ‘n’ is the total number of items in a series.
Results of the Study
Growth of Infrastructure Facilities in Himachal Pradesh
Table 1 illustrates the growth of infrastructure facilities in Himachal Pradesh at three points of time, that is, 2001–02, 2011–12 and 2019–20. Where six major physical infrastructure variables and their subparts have been included in the study. These variables are the length of roads in kilometres, number of motor vehicles registered during the years, number of post offices, number of schools and colleges, number of medical institutions and number of banks in rural and urban areas of Himachal Pradesh. The percentage growth at three points of time has also been calculated in the analysis.
Percentage Growth of Physical Infrastructure Facilities from 2001–02 to 2011–12 and 2011–12 to 2019–20 in Himachal Pradesh.
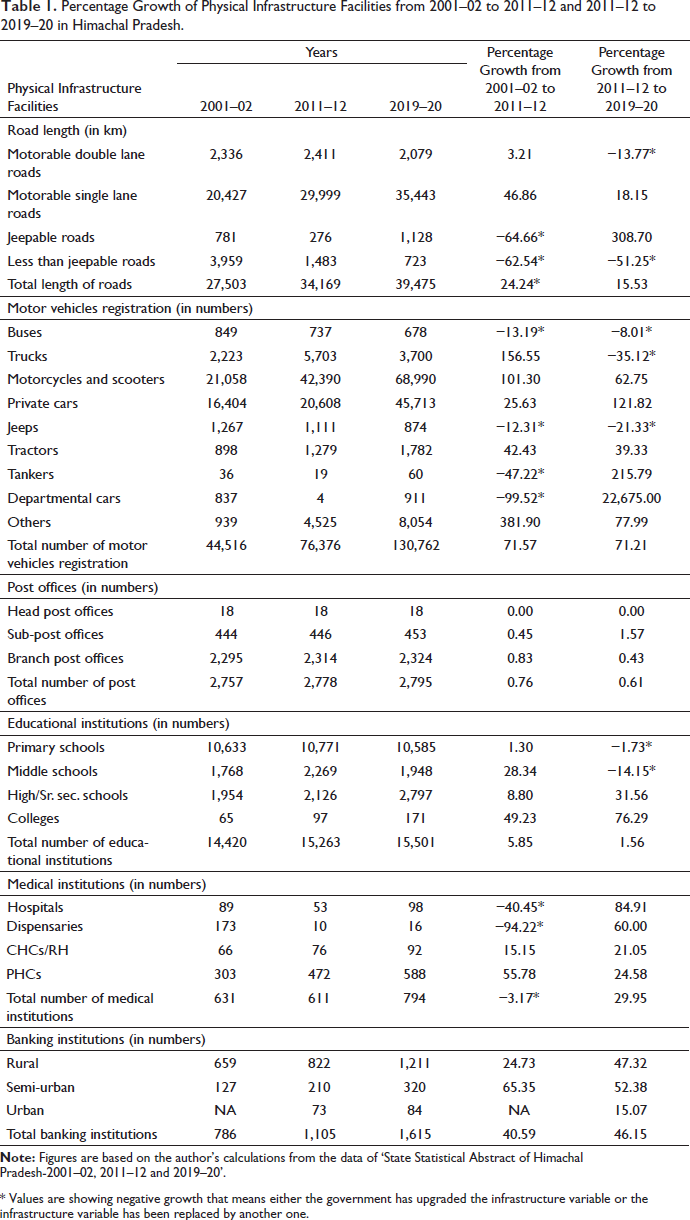
* Values are showing negative growth that means either the government has upgraded the infrastructure variable or the infrastructure variable has been replaced by another one.
The absolute figures are given in Table 1. It is observed that the many infrastructure facilities increased significantly between the period from 2001 to 2020. Also, some indicators, such as jeepable road length and less than jeepable road length, showed negative growth rates. Total road length increased by 24.24% between 2001–02 and 2011–12 and 15.53% between 2011–12 and 2019–20 in the state. Although motorable double lane road length increased between the period 2001 and 2011, it showed a negative growth rate of 13.77% between the period 2011 and 2020. The registration of buses, jeeps, water and petrol tankers declined in 2011–12 as compared to 2001–02. Also, the registration of buses, trucks and jeeps declined in 2019–20 compared to 2011–12. While the growth rate of total vehicle registration was almost equal in the two decades. The growth rate of post offices declined from 0.76% in 2011–12 to 0.61% in 2019–20.
The growth rate of educational institutions declined from 5.85% in 2011–12 to 1.56% in 2019–20. The highest growth rate was observed in the colleges, which was 76.29% in 2019–20. The number of dispensaries showed a negative growth rate in 2011, while the growth rate of the total number of medical institutions increased from –3.17% in 2011–12 to 29.95% in 2019–20. The growth rate of banks has slightly increased from 40.59% in 2011–12 to 46.15% in 2019–20. Thus, it is clear from Table 1 that in 2011–12, the highest growth rate was observed in the number of vehicles (71.57%), followed by banking institutions (40.59%), roads length (24.24%), educational institutions (5.85%), post offices (0.76%) and medical institutions (–3.17%), while in 2019–20, the highest growth rate was observed in motor vehicle registration (71.21%), followed by banking institutions (46.15%), medical institutions (29.95%), roads length (15.53%), educational institutions (1.56%) and post offices (0.61%) in Himachal Pradesh.
Composite Index of Infrastructure Development
The values of composite indices are shown in Table 2, where districts have been ranked according to their level of infrastructural development during the three selected points of time, that is, 2001–02, 2011–12 and 2019–20. The range of variation of indices for the years 2001–02, 2011–12 and 2019–20 is 0.72, 0.30 and 0.40, respectively. It is observed from the values of range and coefficient of variations that inter-district disparities have decreased during 2001–20.
Comparative Analysis and Ranking of Districts Based on Infrastructure Development in Himachal Pradesh at Three Points of Time, Namely 2001–02, 2011–12 and 2019–20.
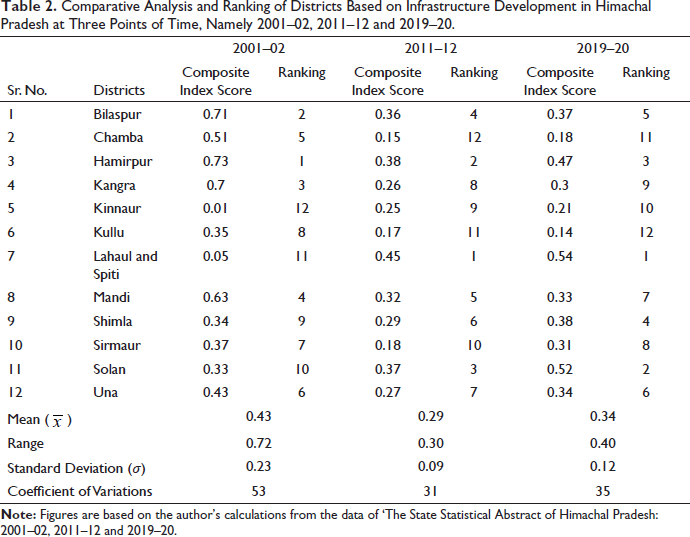
It has been observed from Table 2 that in 2001–02, Hamirpur (CI = 0.73) ranked at the top position, followed by Bilaspur (CI = 0.71), Kangra (CI = 0.70), Mandi (CI = 0.63), Chamba (CI = 0.51) and Una (CI = 0.43), while Kinnaur district (CI = 0.01) was the least developed district proceeded by Lahaul and Spiti district (CI = 0.05), Solan (CI = 0.33), Shimla (CI = 0.34) and Kullu (CI = 0.35), respectively.
In 2011–12, the aggregate composite index for the entire state decreased from 0.43 to 0.29. In 2011–12, the highly developed district was Lahaul and Spiti (CI = 0.45), followed by Hamirpur (CI = 0.38), Solan (CI = 0.37), Bilaspur (CI = 0.36), Mandi (CI = 0.32) and Shimla (CI = 0.29), while Chamba district (CI = 0.15) was the least developed, proceeded by Kullu (CI = 0.17), Sirmaur (CI = 0.18), Kinnaur (CI = 0.25), Kangra (CI = 0.26) and Una (CI = 0.27). It is clear from the analysis that only Lahaul and Spiti showed a rapid positive transformation in infrastructure development, while Chamba was the least developed in infrastructure development during 2001–11.
In 2019–20, again Lahaul and Spiti (CI = 0.54) retained its position in the composite index, followed by Solan (CI = 0.52), Hamirpur (CI = 0.52), Shimla (CI = 0.38), Bilaspur (CI = 0.37) and Una (CI = 0.34), while Kullu (CI = 0.14) was the least developed, followed by Chamba (CI = 0.18), Kinnaur (CI = 0.21), Kangra (CI = 0.30), Sirmaur (CI = 0.31) and Mandi (CI = 0.33).
Thus, it is evident from this comparative analysis that districts such as Lahaul and Spiti, Solan, Hamirpur, Bilaspur, Shimla, Mandi and Una improved their position of infrastructure facilities from 2001 to 2020, while, Chamba, Kinnaur, Sirmaur, Kullu and Kangra remained in the backward category during the study period.
The value of the coefficient of variation decreased from 53% to 31% from 2001–02 to 2011–12 and slightly increased to 35% from 2011–12 to 2019–20. This indicates that from 2001–02 to 2011–12 and 2019–20, there were disparities in infrastructure distribution in the state, but in comparison to 2001–02, the extent of disparities declined.
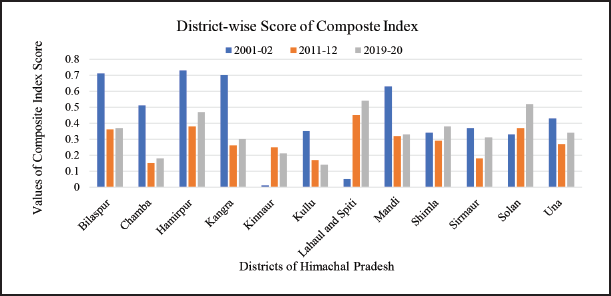
The graphic presentation indicates that the growth pattern of all the indices of infrastructural development of entire districts of Himachal Pradesh at three points of time, that is, 2001–02, 2011–12 and 2019–20 is changing, and inter-district variations in respect of infrastructural development have considerably declined.
Categorisation of Districts
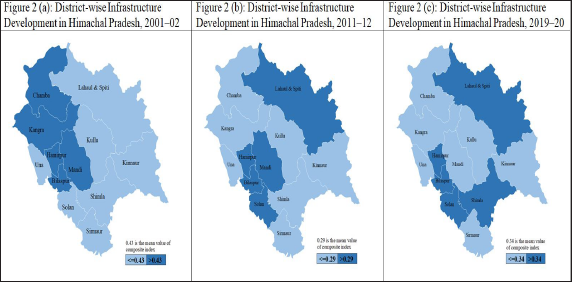
Districts have been categorised based on the state average of the composite index of infrastructure development. The districts having more value than the state average composite index are considered to be relatively developed, and other districts having less value than the state average composite index are considered to be relatively less developed. In 2001–02, the average composite index was 0.43, and districts of Hamirpur, Bilaspur, Kangra, Mandi and Chamba were having higher composite indices than this average composite index, so these districts were considered developed districts. On the other hand, districts of Una, Sirmaur, Shimla, Solan, Lahaul and Spiti, and Kinnaur were having the average composite index of less than 0.43 and hence they were in the less developed category. In 2011–12, the value of the average composite index was 0.29, and districts of Lahaul and Spiti, Hamirpur, Solan, Bilaspur and Mandi were having the average composite index value higher than 0.29, and hence they were considered the developed districts, while districts of Shimla, Una, Kangra, Kinnaur, Sirmaur, Kullu and Chamba were considered less developed as the average composite index value of them was less than that. In 2019–20, the average composite index of infrastructure development was 0.34, and districts of Lahaul and Spiti, Solan, Hamirpur, Shimla, Bilaspur and Una were developed as their average composite index was higher than that, while with less than 0.34 composite index, districts of Kullu, Kinnaur, Chamba, Sirmaur, Kangra and Mandi were placed in less developed categories. Thus, it is clear from the analysis of the categorisation of the districts that Lahaul and Spiti, Solan, Hamirpur, Shimla, Bilaspur, Una and Mandi showed an increasing trend of development of infrastructure, while districts of Chamba, Sirmaur, Kinnaur, Kullu and Kangra showed a decreasing trend of infrastructure development in the state.
Figures 2(a)–(c) show the categorisation of districts based on an average composite index of development for three different points of time. It is observed from the study that districts that have a composite index less than average are considered to be less developed and the districts having a higher value than average composite index are considered to be comparatively more developed districts. The maps in Figure 2 also show the changing patterns of infrastructure development among districts in different points of time.
Comparative Analysis of District-wise Infrastructure Development in Himachal Pradesh (2001–02, 2011–12 and 2019–20).
Categorisation of Districts Based on the Mean Value of the Composite Index of the Infrastructure Development in Himachal Pradesh at Three Points of Time, Namely 2001–02, 2011–12 and 2019–20.
Discussions
In the changing scenario of the world, not even a single economy can grow at a faster pace in the absence of infrastructural facilities. Each state of India is moving to have adequate and efficient infrastructural facilities to attain a trajectory of economic growth. Himachal Pradesh is one of the states that has shown remarkable achievement in the matter of social and economic infrastructural facilities. On the eve of planning, this state was fundamentally backward in terms of the majority of indicators of infrastructural facilities. There were only 352 km of roads and 209 km of rail routes available in 1950–51. Merely 3.17 km of roads per 10,000 of population were available, and most of the villages were inaccessible. Only 2.68 post offices were available for 10,000 of the population. The electricity generation was limited, and per capita consumption of electricity was only 0.90 kW in 1950–51, whereas for all of India, it was 17.8 kwh. On the other hand, social infrastructural facilities were also very poor (Tiwari 2010).
During the planning period, Himachal Pradesh got tremendous success in its socio-economic scenario. Roads and bridges were given top priority till the fifth Five-Year Plan. Similarly, the power sector was accorded the highest priority since the fifth Five-Year Plan. During the first Five-Year Plan, about one-fifth of the total plan expenditure was incurred for social infrastructure. During the ninth Five-Year Plan, social infrastructure was given a relatively higher share than economic infrastructure to achieve the objective of universalisation of elementary education, safe drinking water and primary healthcare facilities to the entire population of the villages (Tiwari 2010). The present study has aimed to trace the growth of infrastructural facilities from 2001 to 2020. In Table 1, some infrastructural facilities have shown a negative growth rate that indicates that the upgradation of these particular infrastructure facilities is better or larger by the government.
In the present scenario, for the development and upgradation of the roads in Himachal Pradesh, various governmental schemes are working, such as Pradhan Mantri Gram Sadak Yojna (PMGSY), Rural Infrastructure Development Fund (RIDF) and Central Road Fund (CRF) (Government of India 2019). The upgradation of educational institutions is being executed under the expenditure through Serve Shiksha Abhiyan (SSA), which is a flagship programme in the educational sector of Himachal Pradesh. In Table 1, the least growth rate was observed in the number of post offices; it was mainly due to the rapid telephone connectivity in the state under the Bharat Nirman Scheme. The health institutions are being upgraded under the National Rural Health Mission (NRHM) which is a centrally sponsored scheme. Thus, these flagship schemes have given a massive boost to infrastructure development in key sectors of the state (Government of India 2019). It may be observed from the study that in the district-wise composite index, Lahaul and Spiti has achieved the highest place in infrastructure development at both points of time, that is, in 2011–12 and 2019–20. While in 2001–02, it was the least developed district, this improvement in the infrastructure development may be due to the lowest density of population (two people per sq. km). Further in tribal areas, several infrastructure development programmes, such as Hill Area Development Program (HADP), Tribal Area Development Program (TADP) and Desert Area Development Program (DADP), are being implemented by the central and state governments from time to time (Tiwari 2010).
It is also observed from the present study that Chamba, Kinnaur, Kullu, Kangra and Sirmaur could not improve the level of infrastructure development concerning population and area during the study period. Table 2 shows the changing patterns of infrastructural development and declining disparities in infrastructure development in Himachal Pradesh. It is pertinent to mention here that due to categorisation as a special category state, various funds for the creation and maintenance of infrastructural facilities have been provided by the state and central governments under liberal finance for the creation of effective and quality infrastructure, which is one of the reasons for the reduction in inter-district variation in the state (Tiwari 2010).
Hypothesis Verification
It has been observed from the study that various central and state government schemes and plans are operational in the state, so the positive impact of infrastructure development programmes is visible after the commencement of full-fledged statehood in 1971. Hence, the hypothesis of declining inter-district disparities in infrastructure development in Himachal Pradesh has been accepted. The governmental efforts for reducing inter-district disparities are visible when compared to similarly placed states of the Indian Union. Due to the expansion of education, the rate of people’s participation in materialising various development programmes is quite high in Himachal Pradesh (Tiwari 2010).
Summary and Conclusion
The present study was an attempt to examine the growth of infrastructural facilities in Himachal Pradesh, changing patterns of infrastructural development and inter-district disparities in infrastructural development in Himachal Pradesh. Districts were ranked on the basis of the composite index of development, and inter-district disparities were examined by using the coefficient of variation.
Thus, the study identified the least developed or infrastructurally backward districts in the state from 2000–01 to 2019–20. Almost half of the districts of the state were found in deteriorating or less developed categories, which is a matter of serious concern for the state. On the one hand, Kangra was found to be the most populated district, while Chamba, Sirmaur, Kinnaur and Kullu were the most mountainous districts of the state which was placed under the less developed category. Therefore, these districts require the proper attention of policy-makers to frame area- and population-specific policies for better and equal infrastructure development through which such regional imbalances must be eliminated from the state. On the basis of the above findings, it was concluded that the inter-district disparities in infrastructure development were declining in Himachal Pradesh due to appropriate policy implementation by the government authorities.
The implication of this study is manifold. At the district level, the study provides an empirical foundation for an argument in the favour of more infrastructural facilities in respective districts. This study provides insights into infrastructural facilities of districts. Thus, this can help in policy-making based on regional requirements. Finally, it can be concluded that the initiated provisions of development are not sufficient to yield better infrastructure development outcomes. It also requires maintenance as well as operational efficiency in the least developed districts particularly.
Footnotes
Declaration of Conflicting Interests
The authors declared no potential conflicts of interest with respect to the research, authorship and/or publication of this article.
Ethical Approval
The authors have not conducted any experiments on human or animal subjects in this study.
Funding
The authors received no financial support for the research, authorship and/or publication of this article.
Informed Consent
No separate informed consent was needed as the study is based on secondary data obtained from from various issues of the Statistical Abstract of Himachal Pradesh, Government of Himachal Pradesh (2001–02, 2011–12 and 2019–20), which are already available in the public domain.