
Abstract
Urban flooding is growing as a serious development challenge for cities. Urbanization demands the conversion of pervious land to impervious land by pushing the transformation of water bodies, flood plains, wetlands and green spaces into built-up spaces. This affects the hydrological setting of the city’s geographic area. Bhubaneswar, one of the first planned cities of independent India, has expanded rapidly with an increase in the settlement land use cover from 41 km2 to 81 km2 in the last two decades. Non-consideration of disaster risk assessment in the land use plan has placed the city at high disaster risk. Hence, this article explores various avenues for making a flood resilient city through spatial planning. To understand the flood and its consequences, a flood hazard and vulnerability map was prepared by overlaying the existing social and infrastructure networks, and flood risk zones were generated through analytical spatial modelling in GIS. This accounts for the areas in which flood hazards are expected to occur, as well as the area whose socio-economic and infrastructure susceptibility to the disaster is more. The key outcome is to ensure urban development that can work concurrently with nature by integrating disaster risk reduction strategies into land use planning.
Introduction
According to the United Nations report (2019), more than 50% of the world population lived in urban areas by 2018. Half of the world’s population is contributed by only five countries, including India. India is estimated to contribute world’s maximum number of urban dweller of 416 million in the coming 30 years (United Nations, 2019). As per the 2011 census, 31% of India’s population was living in cities. Today, more people are shifting to urban centres than ever before because cities offer better opportunities and quality of life. While the total population of India has doubled in the last 50 years, its urban population has grown by five times (Taubenböck et al., 2009). This rapid urbanization has led to the unplanned growth of the urban area, which has introduced complex ecological, economic and social changes (DeFries & Pandey, 2010).
Globally, the implications of climate change in cities remain an urgent concern. Addressing this, sustainable development goal number 11 (United Nations, 2015) concentrates on building sustainable cities, which it specifically defines as cities that are resilient to disaster and adaptive to climate change. The fifth assessment report of IPCC identifies urban areas with a ‘very high confidence’ level of risks from increased storms and extreme precipitation, inland and coastal flooding, drought and water scarcity (IPCC, 2014). Cities are the first responders in a crisis and are also the first to experience the threats. Rapidly growing cities, along with their imminent threats, require an immediate intervention in terms of redesigning the urban system, policies and governance for sustainable development. Sustainable and inclusive growth is the key to unravel the true potential of urbanization. A resilient city considers both the above-mentioned factors.
Flood is one of the most frequent and extensive natural disasters. About one-third of the world’s population was affected by floods during 1985–2003 (World Bank, 2005). India leads the table among the most flood-affected countries in the world (Winsemius & Ward, 2015). Urban areas are likely to be more affected by floods because of the sheer number of resources and people exposed to them. Among the various types of floods, urban flooding is a frequent disaster affecting many cities worldwide. It is becoming more dangerous and costly to manage as the city grows (Jha et al., 2012). As climate change, urbanization, increase in population growth and land use change takes place, it is an urgent need to understand the urban flood risk and make flood-resilient cities (Cheng & AghaKouchak, 2014).
Traditionally, urban flooding is assumed to be an infrastructural problem and thought to be solved with engineering solutions. Sometimes such interventions cause more problems as opposed to resolving them. Moreover, these are cost-intensive, especially for developing countries (Soz et al., 2016). However, conventional engineering does not consider the dynamic of land use change. For long-term sustainability, a good land use plan is required, which will consider the forthcoming disaster risks and balance both the present and future needs. Land use planning is a powerful tool in disaster risk reduction, thereby increasing the city’s resilience (Burby et al., 2000).
Bhubaneswar, one of the first planned cities of Independent India, has developed rapidly over the decades, making the planning process clumsy (Das Chatterjee et al., 2015). Because of its topography, Bhubaneswar is more prone to waterlogging when natural courses are disturbed. Rapid urbanization has disrupted the hydrological environment of the city’s geographic area. This research article tries to find the rift in the current practice of land use planning in Bhubaneswar and explores the plausibility of formulating a flood resilient spatial plan. There are two objectives of this study. The first objective is to analyse the existing natural drainage systems in the city with respect to its immediate land use and its changes over the recent years of urbanization. The second objective is to assess the urban flood hazard, risk and socio-economic vulnerability of the city. These two objectives would collectively help to understand the lacuna in the present methodology and pave the path to plan a city that can take care of flood risk.
Study Area
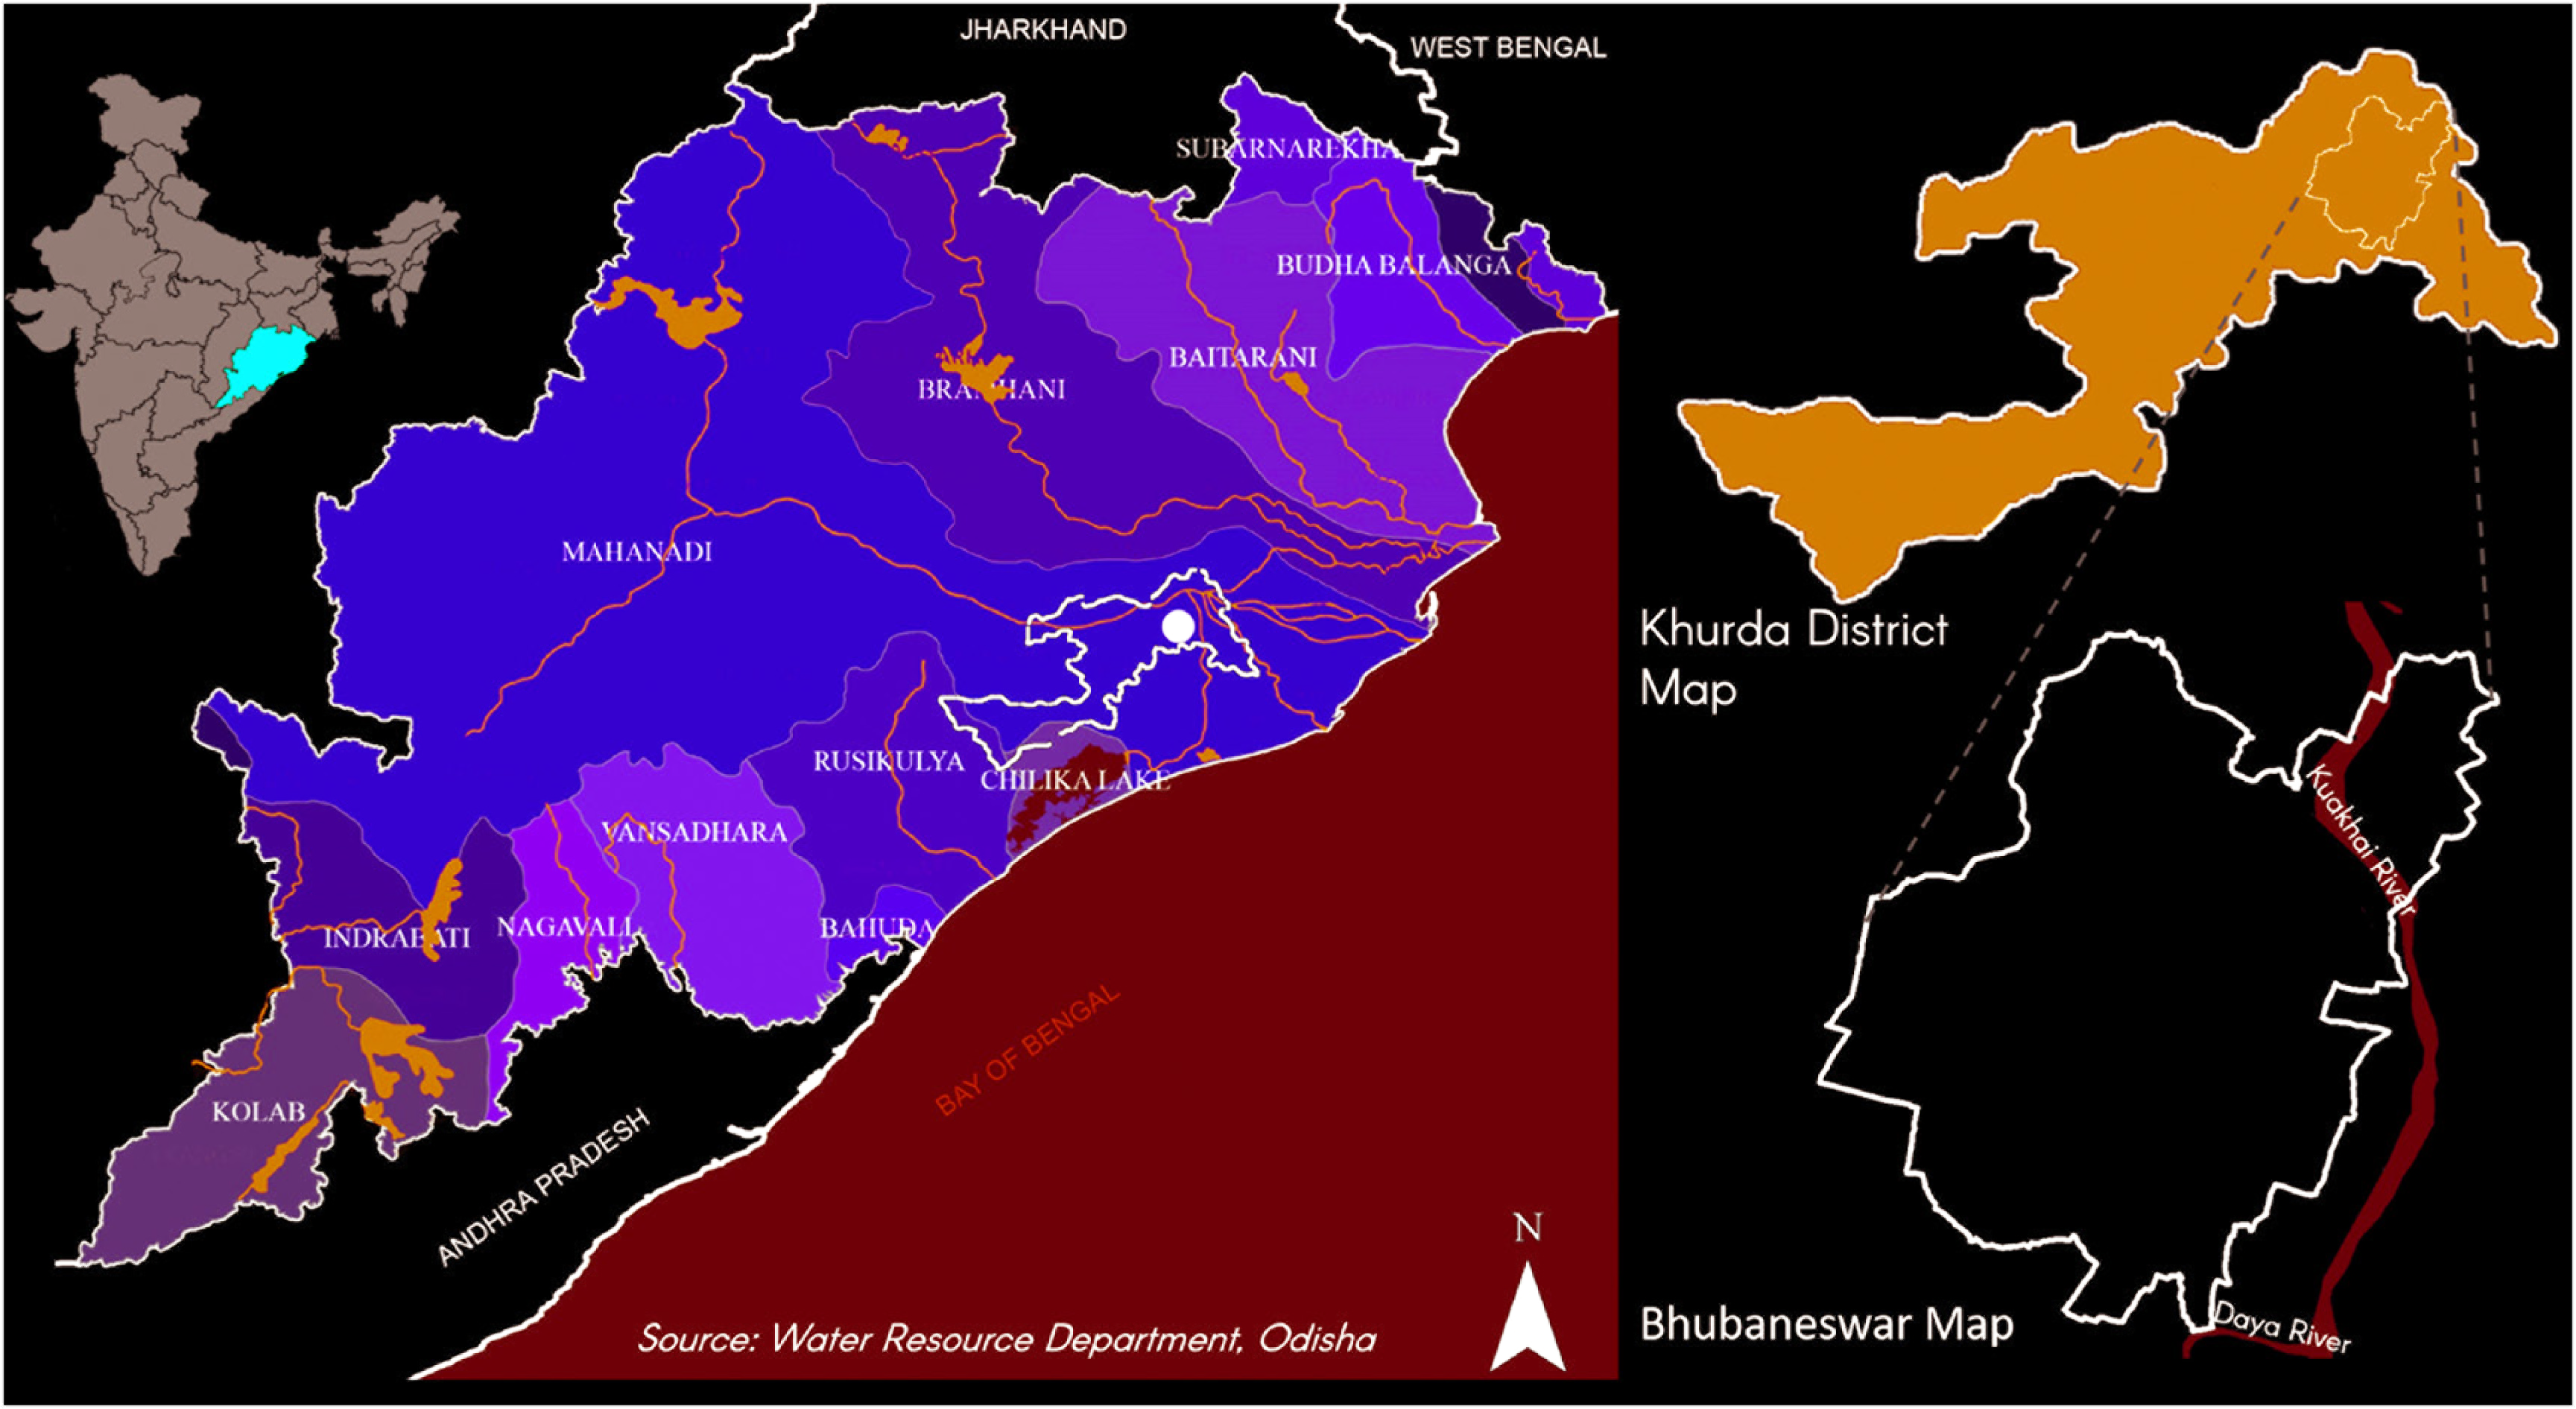
Bhubaneswar is located in the lower catchment of Mahanadi River basin, on the coastal plain of Odisha at 20°17’45’’N and 85°49’28’’E (Figure 1). The city is engulfed between Chandaka reserve forest to its west, the river Khuakhai to its east and river Daya to its southeast. It falls under four micro water basins with a prevalent slope running from the west towards east. Ten natural streams flow in the city, covering 71 km (Department of Architecture and Regional Planning, 2010). However, all the natural streams are now converted into nallas that carry sewage and stormwater. Guangua nalla in the east acts as the main drain that carries all wastewater, stormwater, industrial wastewater and pollutants and spills it into river Daya in the south.
The city’s mean annual precipitation is 1,497mm, with a wet season from May to October. The average rainy day by 2004 was 87 days, which has reduced to 75 days by 2011 (Department of Architecture and Regional Planning, 2010). Also, Bhubaneswar is categorized as a ‘very high damage risk zone-B (Vb = 50m/s)’, as per the wind and cyclone zone in Vulnerability Atlas of India, 2019 published by BMTPC Government of India (BMTPC, 2019). Cyclones are generally accompanied by heavy rainfall, making the post-cyclone phase also arduous to recover.
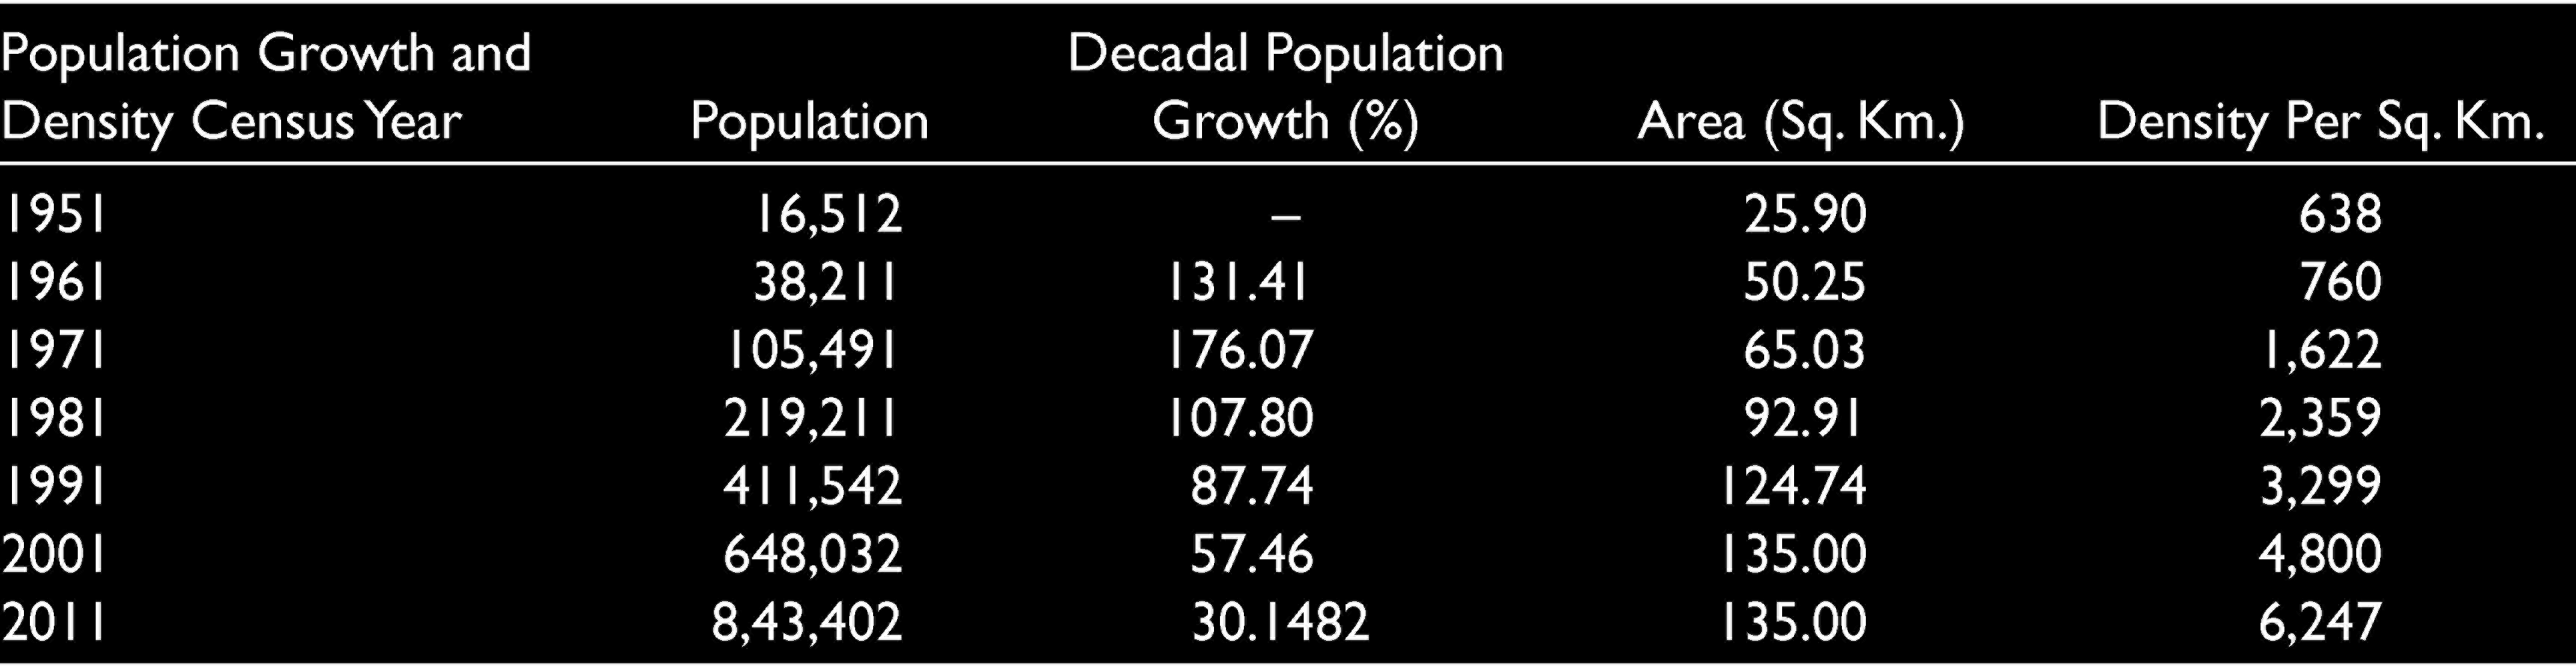
The first land use master plan for modern Bhubaneswar was formulated in the year 1968. Its population has increased significantly from 16,512 in 1951 to 881,988 in 2011 (Census of India, 1951, 2011). During 1961–1971 the growth rate was 176.07%, which was the highest growth rate of the country during that period (Department of Architecture and Regional Planning, 2010) (refer Table 1). By 2030, it is expected to accommodate 2 million people (Department of Architecture and Regional Planning, 2010).
Decadal Population, Area and Density Growth
Data and Methodology
This article explores how the city of Bhubaneswar can be made urban flood resilient by integrating disaster risk assessment into its land use plan. The research is structured in 3 phases which are as follows.
In the first phase, changes in land use and land use policy are studied to understand the history of urbanization patterns around the vicinity of water bodies. The assessment focuses on analysing how the city’s land use master plan has addressed the water bodies, natural drainage and urban flood hazard. GIS and Remote sensing (DEM-Landsat 8, Landsat 3,4) were used to prepare maps, and analyse land use and land cover (LULC) changes over two decades through supervised classification. The LULC change pattern around the water body is examined to understand the land use pattern in the riparian and floodplain area. All the master plan maps of the city for research were collected from the Bhubaneswar Development Authority.
In the second phase, the article assesses the urban flood risk. To assess the flood risk, the flood hazard and flood vulnerability assessment are carried out. The parameters of disaster hazard, vulnerability and risk are very different. Therefore, a spatial multi-criteria index is prepared using ArcGIS to combine and compare various natural, social and anthropogenic criteria. All parameters are processed within the GIS using the overlay method (Heywood et al., 1993). GIS and Remote Sensing has always been an integral component for risk assessment and mapping natural hazards like flooding (Lawal et al., 2014; Pradhan et al., 2008). It is considered a complementary approach to flood modelling (Lecca et al., 2011). A wide range of data from various sources is collected for creating spatial criterion layers using geospatial techniques. For determining the relative importance of each factor of flood hazard and risk assessment, an analytical hierarchy process (AHP) technique is adopted (Kazakis et al., 2015; Saaty, 1990). The sections below describe the methodology in detail.
Flood Hazards
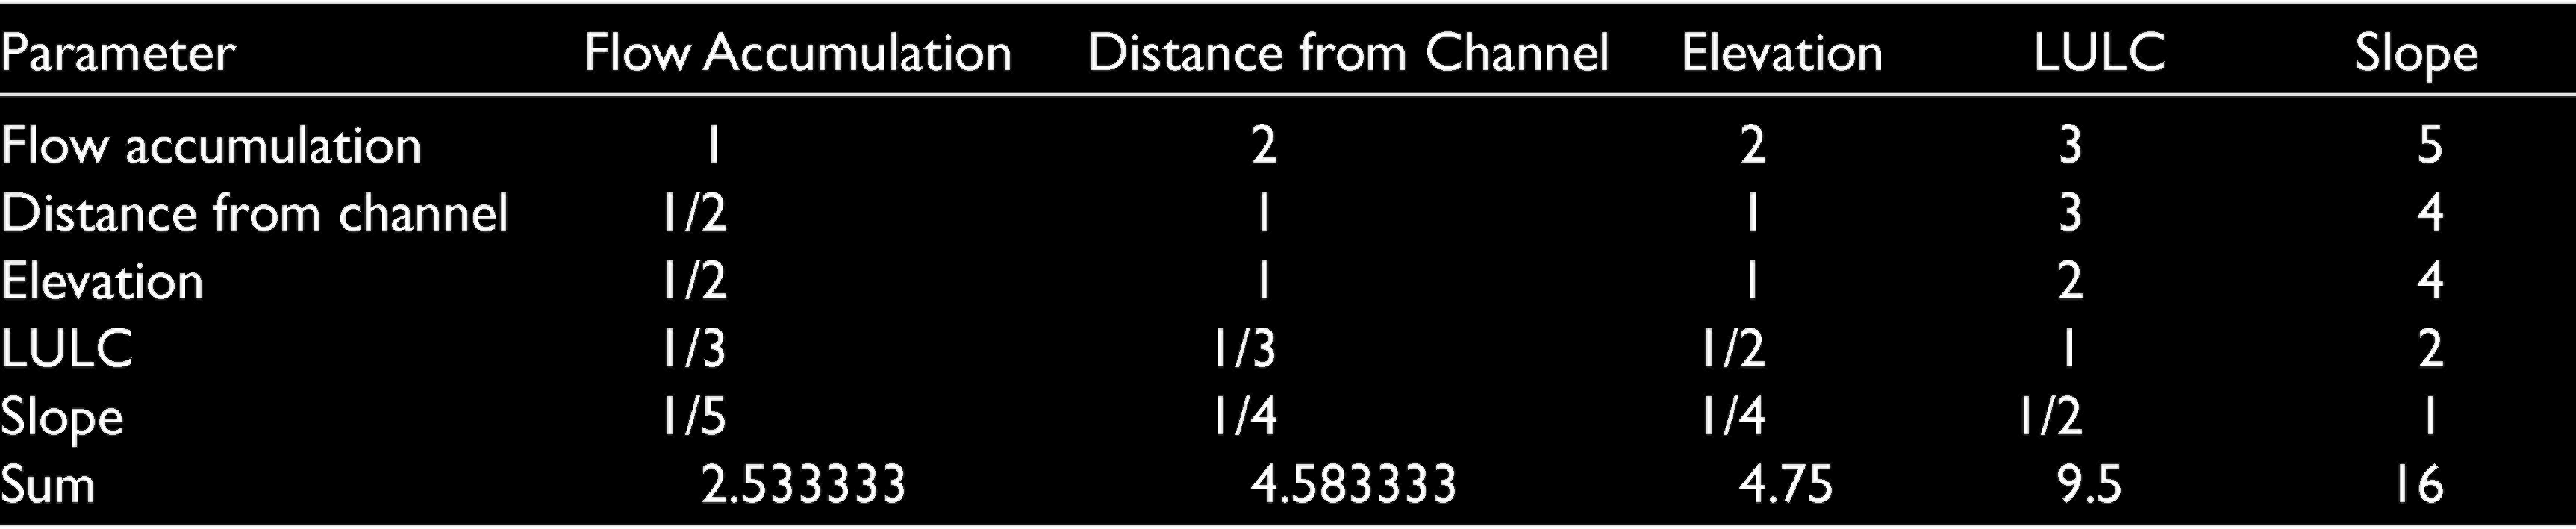
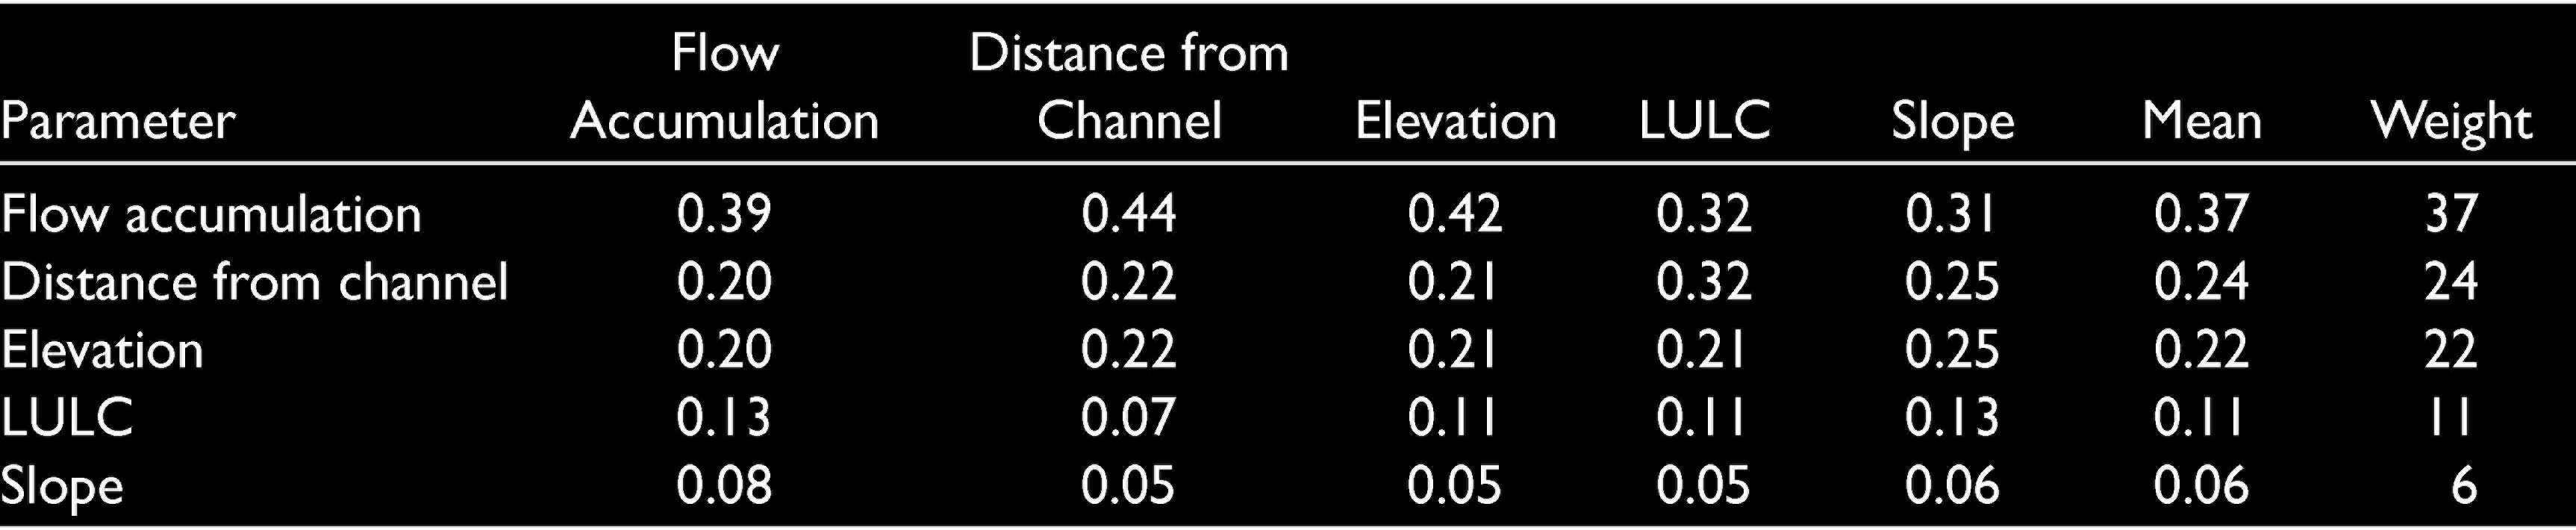
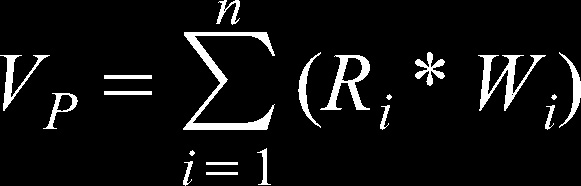
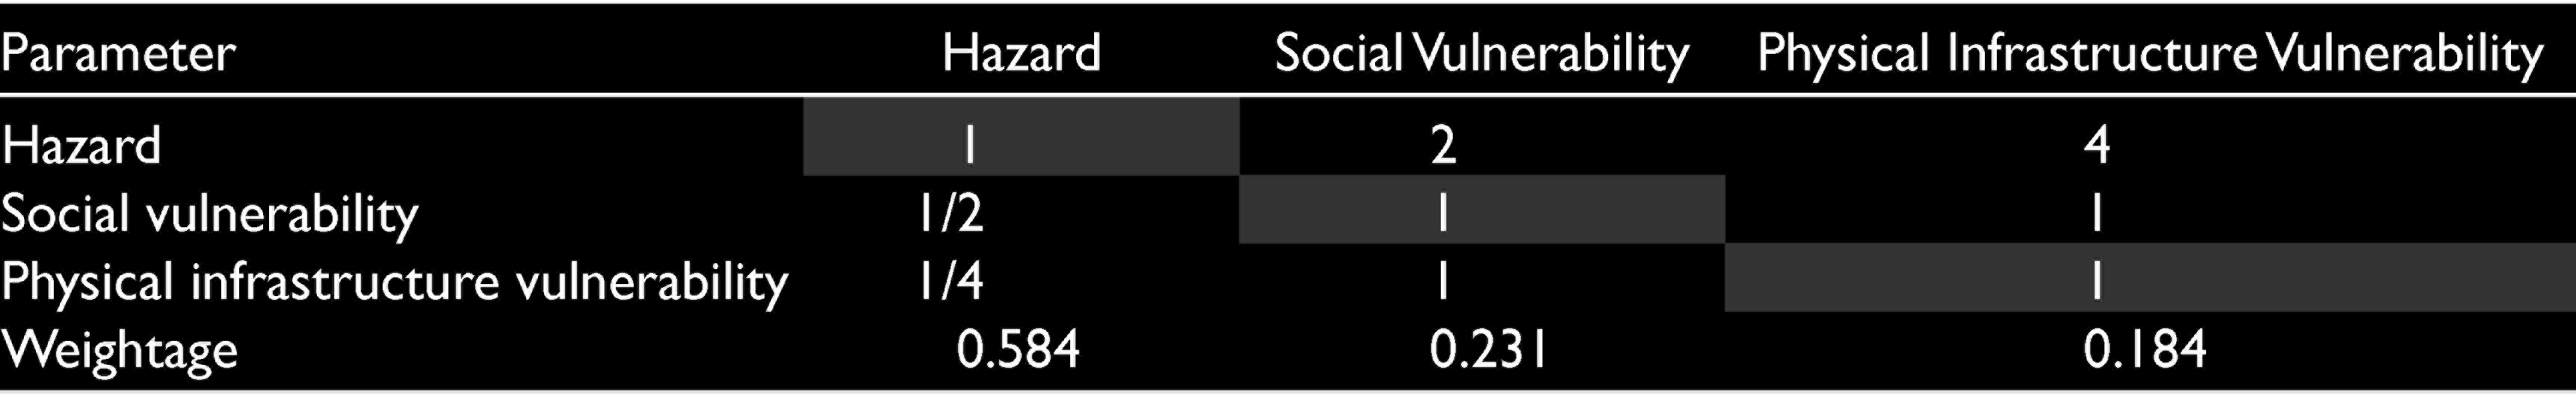
An assessment of flood hazards is necessary for understanding the area that can be affected by the disaster. This gives a better rationale for managing the watershed area and consequently preparing for forthcoming disasters. After an extensive literature review, Kazakis’s methodology for the assessment of flood hazard (Kazakis et al., 2015) is adopted in this study. Five parameters are used to assess flood hazards based on anthropogenic and natural factors: elevation, slope, flow accumulation, land use and land cover, and distance from the channel (Stefanidis & Stathis, 2013). These parameters are extracted from SRTM DEM and Landsat8 from USGS. The parameters are reclassified into five classes from one to five, where one is the least prone to flood hazard and five is the most prone to flood hazard. The weights to these parameters are given by analytical hierarchy process (AHP). A pairwise matrix comparison made in AHP is created by assigning a one to nine rating score to generate the weightage of each factor (Table 2 and 3). Finally, various parameters with their weights are processed (Kazakis et al., 2015). The flood hazard index was calculated using the following formula.
Parameter of Flood Hazard: AHP
Normalized Flood Hazard Parameters: AHP
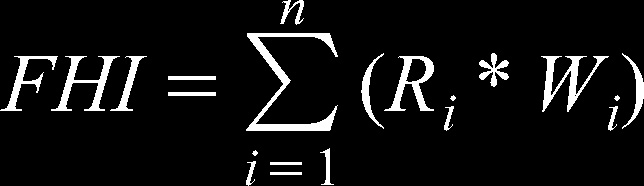
Where
Ri is the rating of the parameter in each point Wi is the weight of each parameter n is the number of criteria.
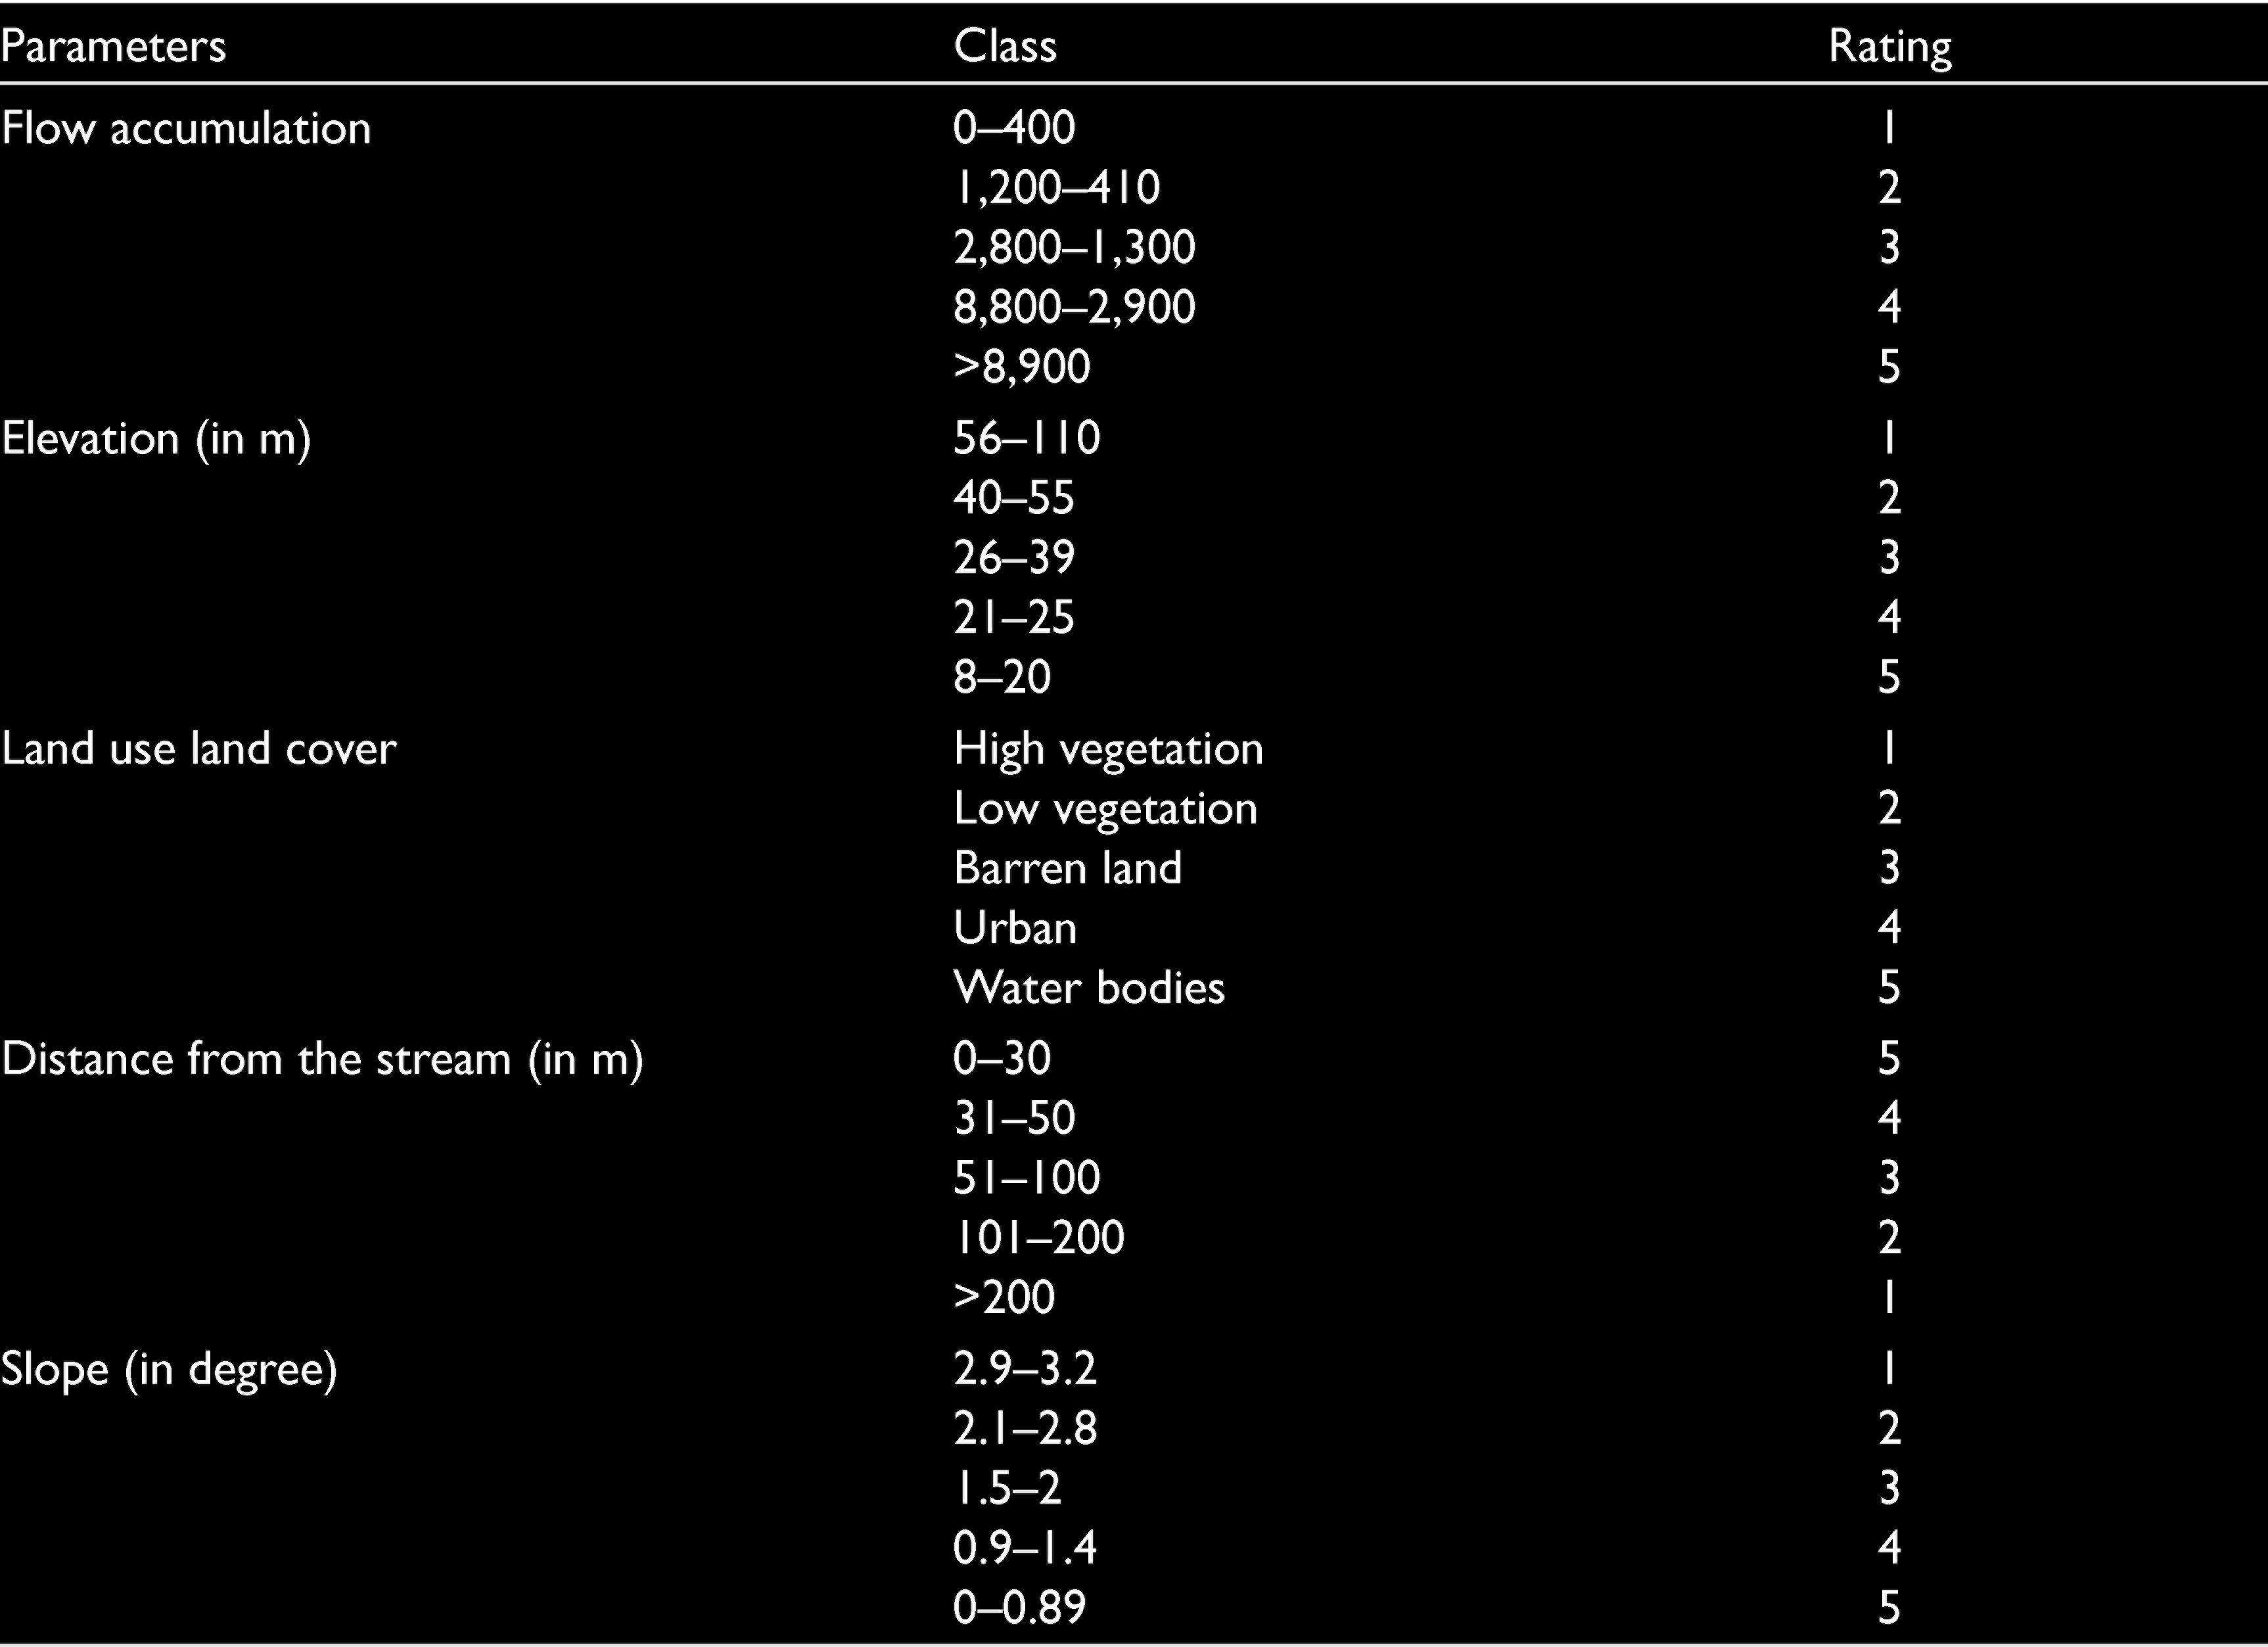
The index is based on the specific geological and land use characteristics of the study area. Flow accumulation has been considered as the most crucial parameter (Kazakis et al., 2015). Flow accumulation increases with an increase in stream order and drainage density. It is an indirect way of measuring the area of drainage (Schäuble et al., 2008). Likewise, flooding often occurs in low elevations (Botzen et al., 2013) and near the drainage network. Therefore, distance from stream and elevation are given equal importance. LULC influences the infiltration rate. Land use is considered the third most important parameter. Areas with low slopes and low elevations have more chances of waterlogging than the areas with high slopes. A steeper slope decreases the chance of infiltration and increases surface runoff (Hoque et al., 2019; Lawal et. al., 2012). In urban areas, the slope value gets modified because of anthropogenic intervention and has, thus, been assigned a lower importance value. Rainfall intensity is an important factor of flood hazard and is considered within the literature study for the assessment. In this research, the study area is comparatively small for rainfall intensity variation and data on this is not available. Therefore, the rainfall intensity factor has not been considered. All the parameters, except LULC, were classified using quantile classification (Table 4). LULC was classified based on the Kazakis et al.’s (2015) study, which is similar to Pradhan (2009) and Forkuo (2010).
Ratings of Flood Hazard Parameter
Tables 2 and 3 show the pairwise comparison of the criteria.
Social Vulnerability
United Nations International Strategy for Disaster Reduction (UNISDR) (United Nations Office for Disaster Reduction, 2009) defines the term vulnerability as ‘the characteristics and circumstances of a community, system or asset that make it susceptible to the damaging effects of a hazard’. It is an interrelation of the exposure, susceptibility and coping capacity of a system. Vulnerability is a combination of both social and physical processes (Brooks, 2003). Social vulnerability is the potential to be hampered by natural hazards because of the lack of capacity to resist (United Nations Office for Disaster Reduction, 2009). Presently, there is no standard methodology to carry out a spatial vulnerability assessment (Brooks, 2003; Kienberger et al., 2009, 2013; Villagrán de León et al., 2006), but some studies and scientific literature are available. Social vulnerability comprises socio-economic and demographic indicators, which are affected by floods. It represents the lack of resources to mitigate, resist or recover from disasters. Based on literature studies, eight parameters have been selected for the present study: population density, female population, rented house, schedule cast (SC) and schedule tribe (ST) population, population less than 6 years old, house condition, illiterate population, unemployed population (Armenakis, et al., 2017; Hoque, et al., 2019; Katic, 2017; Rufat et al., 2015; Sharma, et al., 2018). All the data has been collected from the Census of India, 2011. These vulnerability indicators represent an element’s susceptibility and resilience to disaster hazards (Birkmann, 2006). Armenakis and Nirupama’s (2013) approach is followed in this study. All eight parameters were of different types. To standardize it, the percentage of each of the parameters, except for population density, is calculated based on the total population. Population density is directly used in the final rating summation. The rating was given according to the quantile method of classification. The total normalized weighted vulnerability for each census ward is:
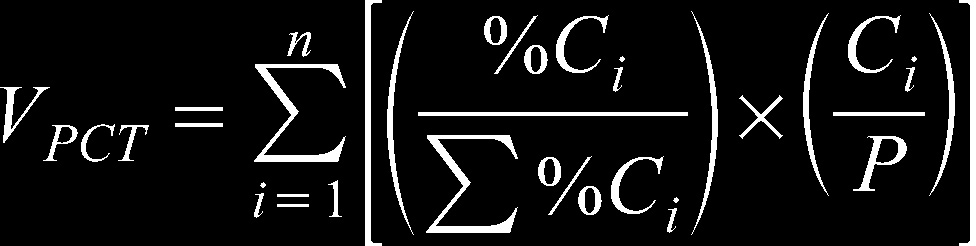
Where VPCT is total vulnerability per each census ward
Ci is category attribute %Ci is category attribute percentage with respect to population in the census ward P is total census population.
Evacuation activities before and after flood become complicated in a high-density location. Hence, low population density is lesser vulnerable than the high population density area (Hoque et al., 2019). Due to social and physical structures that already disadvantage women, for example, care responsibilities at home, lower wages in the informal sector and specific employment, recovering from a catastrophe becomes even more difficult for women (Cutter et al., 2003). Further, during pregnancy or menstruation, mobility is limited and evacuation procedures become difficult. In a disaster, women are 14 times more likely to die than men (Peterson, 2007). Similarly, Schedule caste (SC) and Schedule Tribe (ST) people tend to be more vulnerable to disaster, as the chances to intrude into the floodplain area due to land unavailability is more for SC and ST people (Sharma et al., 2018). It is also difficult to evacuate children less than 6 years old during an emergency as they are a dependent population (Sharma et al., 2018). Low education levels can constrain one’s ability to understand the warning and recovery information. It becomes a major hindrance in the preparedness, mitigation and recovery stage (Cutter et al., 2003). Literacy is also linked with socio-economic status, unemployment, economic inequality and marginalization (Sharma et al., 2018). Housing conditions reflect the potential financial losses, injuries and fatalities from natural hazards. Dilapidated houses are the ones that get affected by the disaster first, and the recovery becomes difficult after the disaster phase. Vulnerability is high when people live in a rented house as opposed to their own house (Katic, 2017). Higher unemployment levels lead to an additional number of existing unemployed workers in a community. Lastly, the pressure on the labour market in a post-disaster period tends to increase (Katic, 2017), thereby contributing to a slower recovery from the disaster (Cutter et al., 2003).
Infrastructure Vulnerability
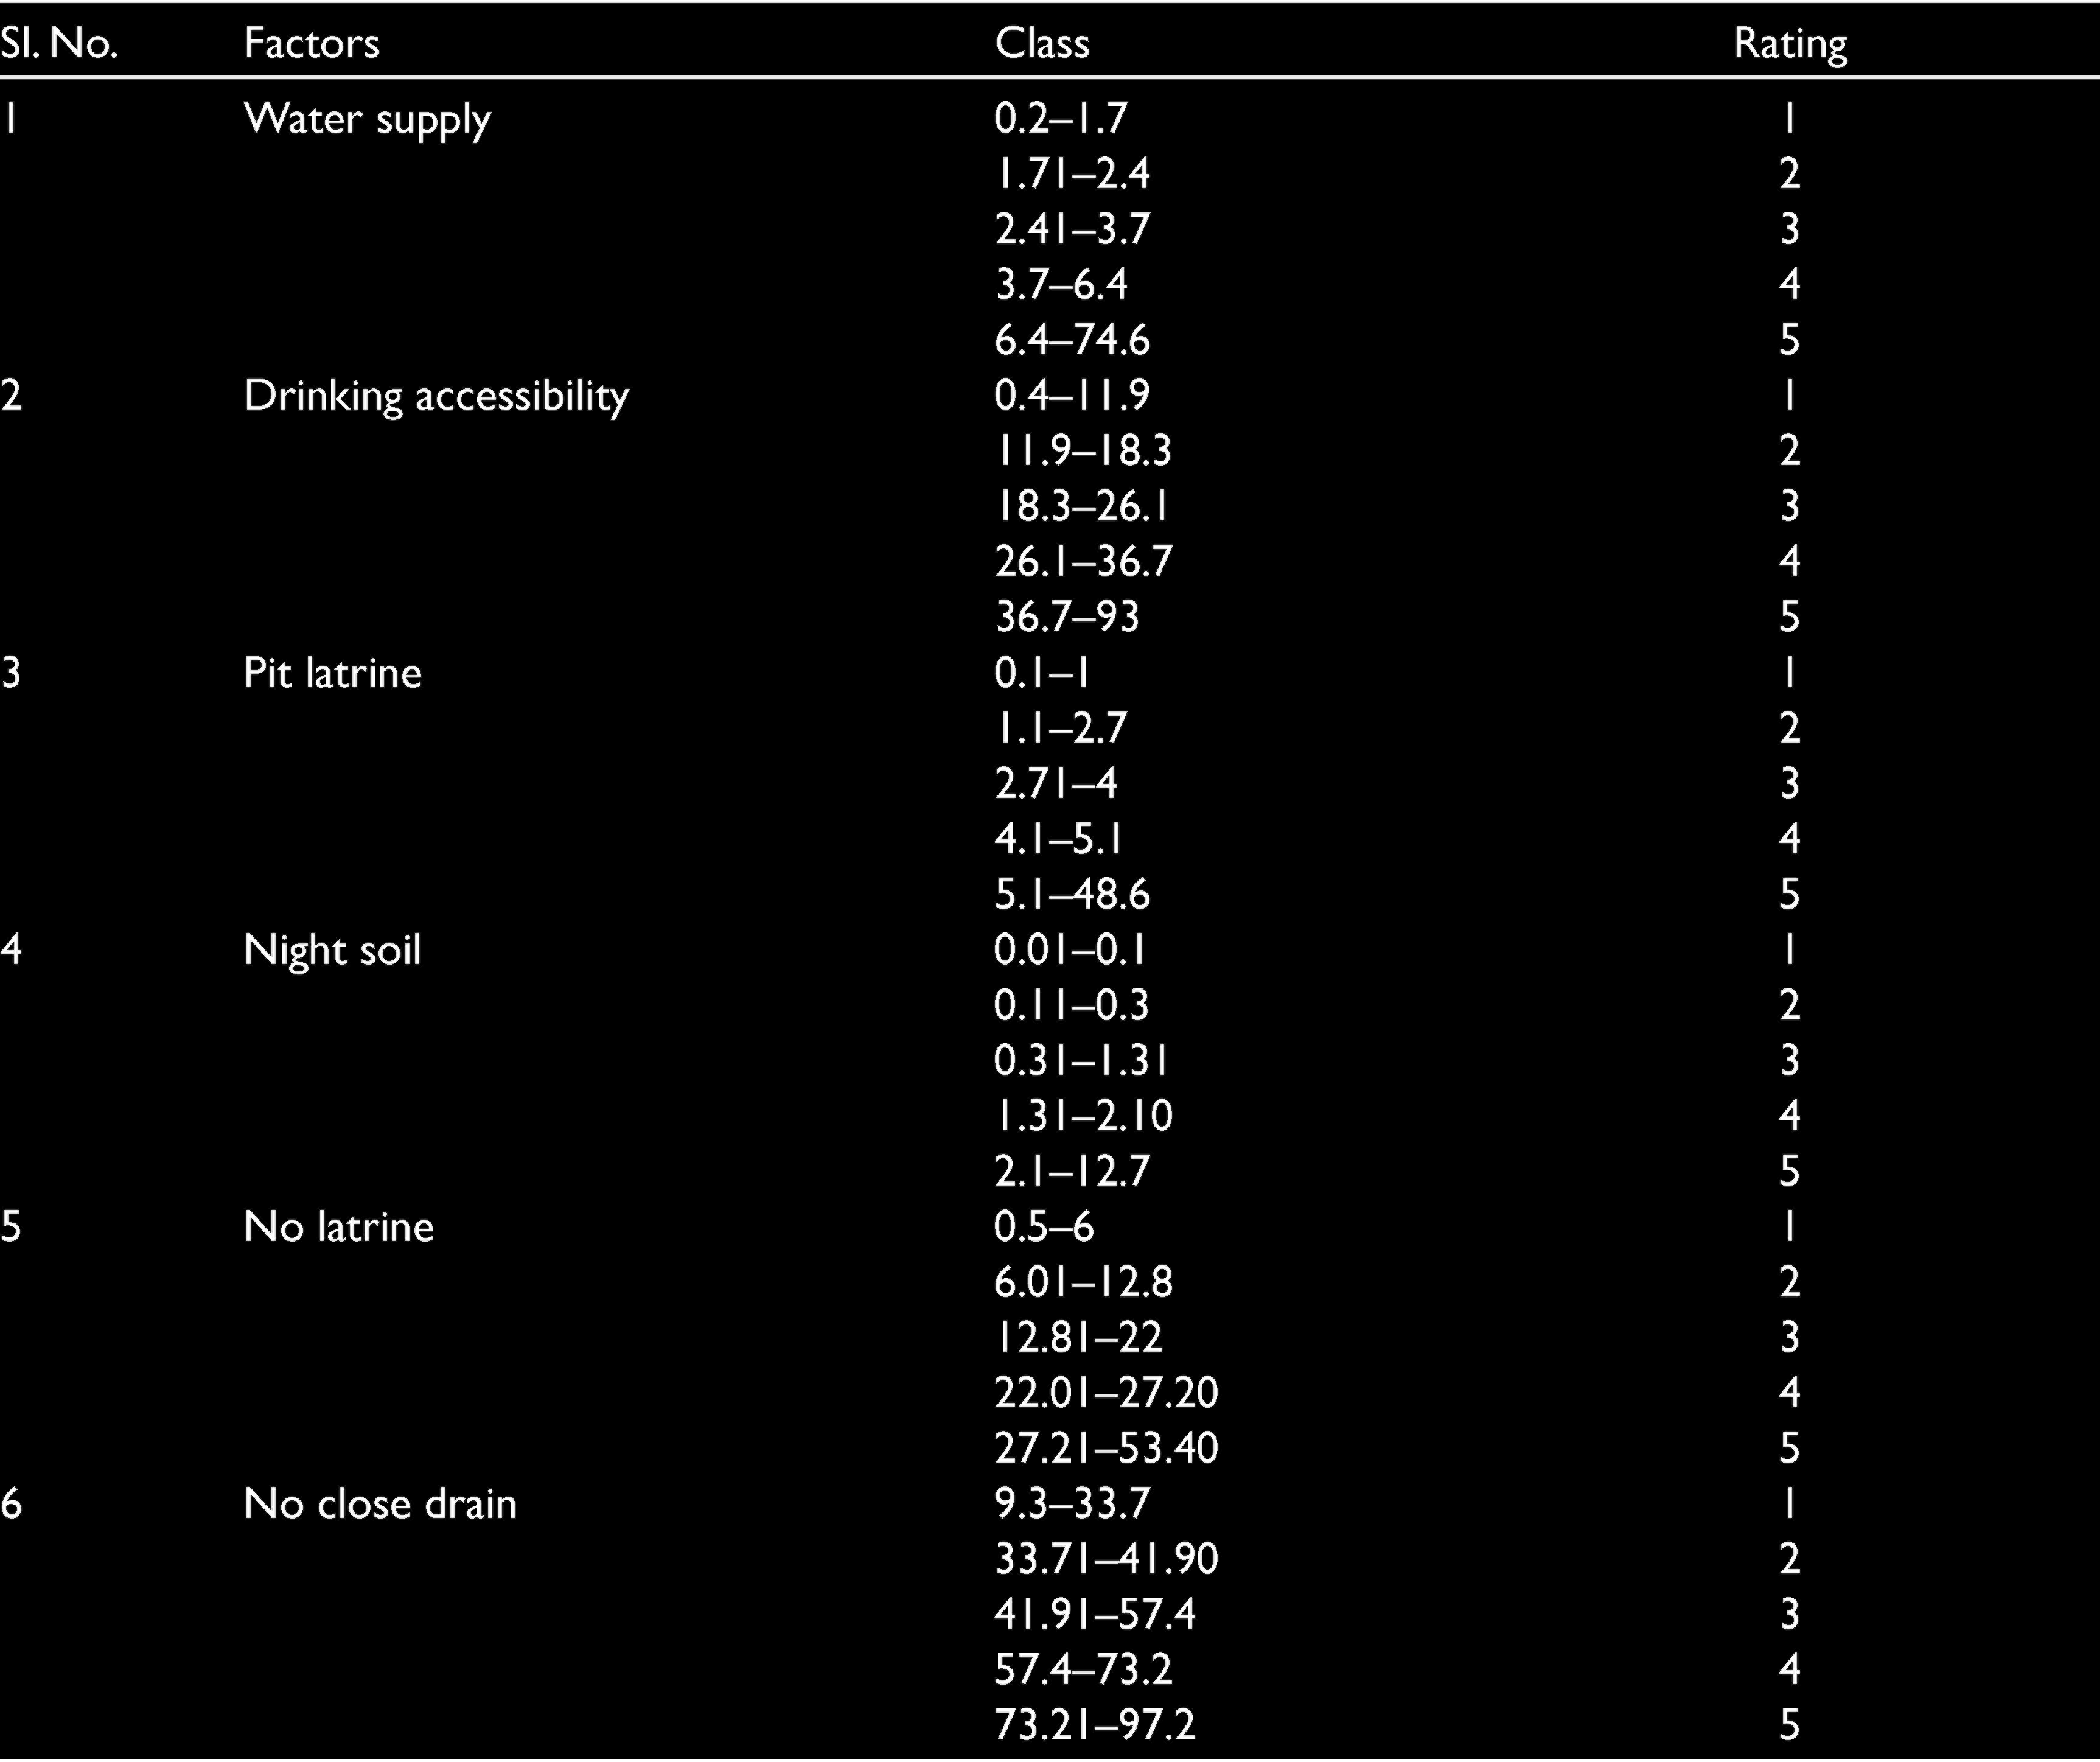
Infrastructures whose presence or absence can leave people in a more vulnerable condition during or after a disaster are drivers of socio-physical vulnerability. The following six parameters have been selected to locate socio-physical vulnerability: water source, drinking water accessibility, availability of latrine, pit latrine, night soil and presence of close drain. All the parameters are picked after a thorough study in the context of Bhubaneswar and urban flood disasters. Each parameter is standardized by giving ratings using the quantile method (Table 5). Then equal weightage is given to all parameters. Physical vulnerability map is obtained by using the following formula:
Infrastructural Vulnerability Parameter Rating
Where Ri is the rating of the parameter in each point
Wi is the weight of each parameter
The available data was at ward level, which is very coarse. The desired finer resolution of the grid data set for socio-economic indicators is not available. An improved resolution is better for risk and vulnerability assessment for spatial planning, preparedness and crisis management (Aubrecht et al., 2013).
Flood Risk Assessment
UNISDR (United Nations Office for Disaster Reduction, 2009) defines disaster risk as the potential loss due to disaster hazards and people’s vulnerable conditions for coping with it. A risk assessment digs beyond just the magnitude and potential loss. It reflects the cause and impact of all the losses from a disaster. The present article assesses the urban flood risk to evaluate the risk caused by the flood hazard and the vulnerability of the people affected by it, with the understanding that it is a combination of both (Apel et al., 2009; IPCC 2014; Vojinović & Abbott, 2012). For the flood risk map, all the three layers of hazard, social vulnerability and socio-physical vulnerability are ranked, weighted using AHP (Table 6) and overlapped in GIS. The flood risk map is verified by overlaying the past flooding point data collected from Bhubaneswar Municipal Corporation (BMC).
Parameter of Flood Risk: AHP

Where, R is the Disaster Risk,
HF is the Flood disaster hazard, VP is Physical infrastructure vulnerability, and VS is social vulnerability.
In the last phase, the article evaluates and integrates all the different layers of hazard, vulnerability, and risk to prepare an urban flood resilient spatial plan to make the city a resilient city. Every bit of the land use map is amplified with the risk map to formulate risk-sensitive land use planning.
Results
Land Use Assessment
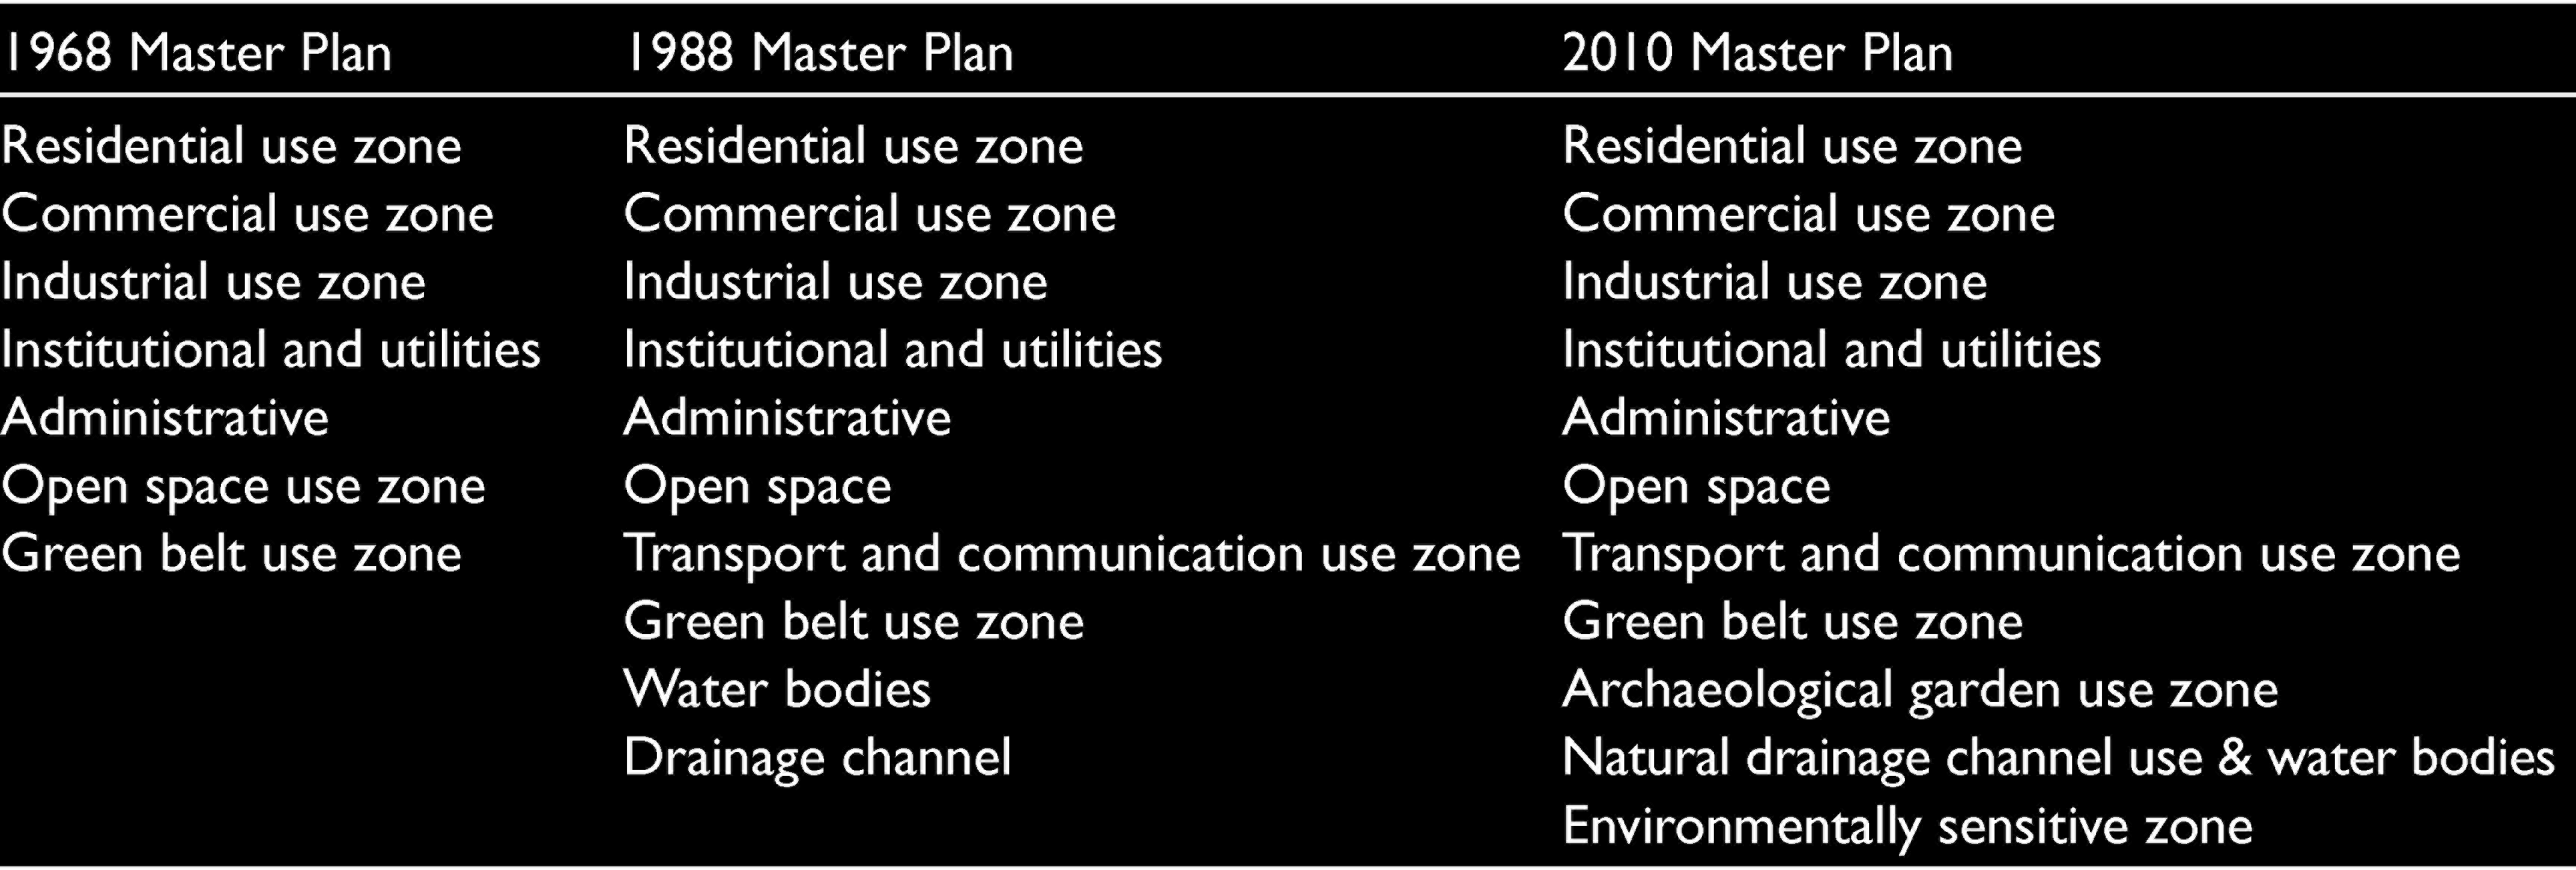
The first land use master plan of Bhubaneswar had seven primary functional land use, and the master plan was based on neighbourhood planning (Appendix A). The land use classification had no separate category for water bodies. Instead, water bodies were included in the green belt zone, which also includes vacant land and agricultural land. However, the water body was demarked in the land use plan and green buffer zones were provided around it. To facilitate the rapid population growth and changing socio-economic scenario of the city, the 1988 master plan came into action. In this plan, water bodies and drainage channels were recognized as a separate land use zone and classified in the master plan. Agriculture was permitted in the drainage channel zone and construction activities were restricted, though the normal expansion of the existing settlements was permitted in this zone. In the latest 2010 master plan, water bodies and environmentally sensitive zone are classified in the land use zone (Table 7), but no green spaces around the water bodies are drafted. The riparian corridor was missing in the land use map and building codes. The comprehensive development plan (Department of Architecture and Regional Planning, 2010) flags the issue of drainage systems in the city. It quotes, ‘Earlier it used to take 25 minutes after the shower for the rainwater to drain with these channels but nowadays the water remains clogged in these areas for nearly 24 hours’ (Department of Architecture and Regional Planning, 2010).
Land use Zone Classification in Different Master Plan
Land Use and Land Cover Change
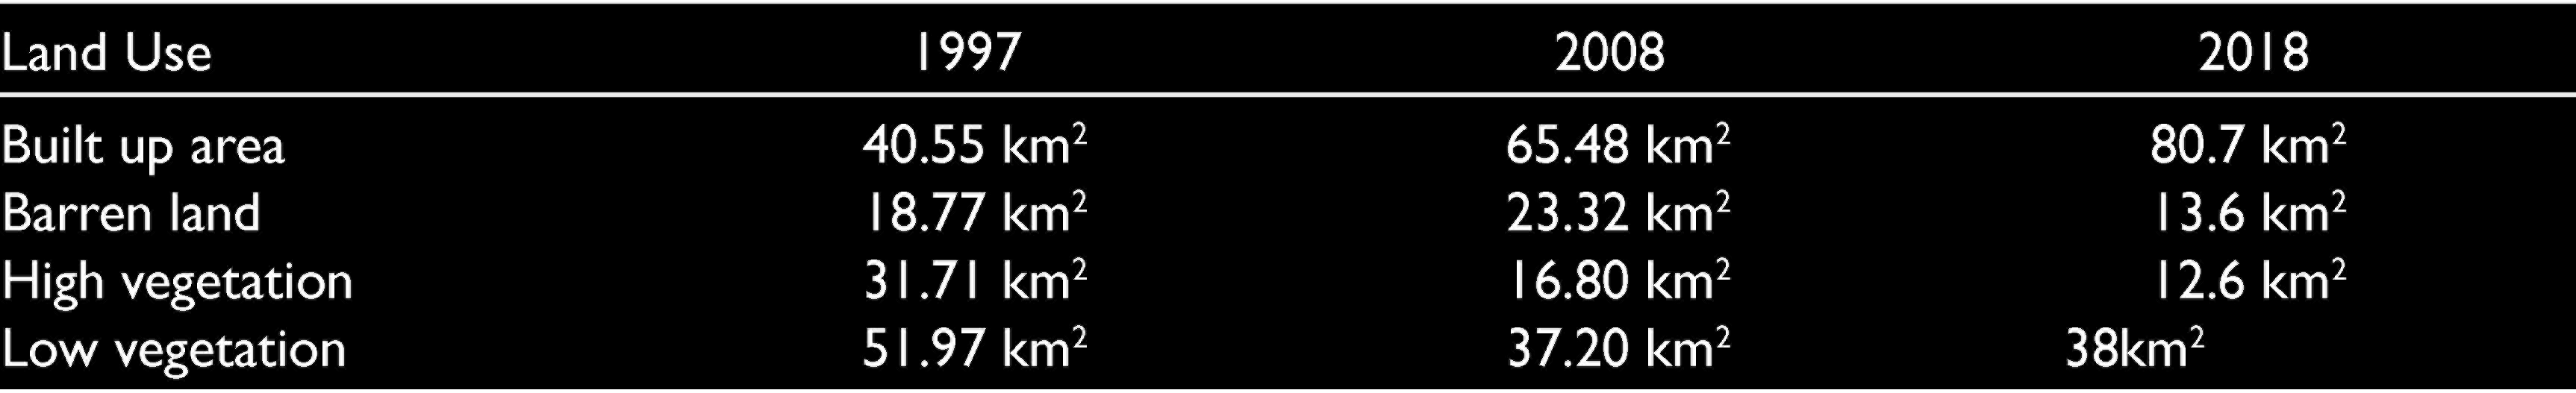
The generated LULC map of Bhubaneswar (Figure 2) shows that urban areas have increased from 41 km2 to 81 km2 in two decades (Table 8). With the change of pervious surface to impervious, the percolation of water into the ground decreases. When water does not percolate during rainfall, it becomes overland water and flows downstream, leading to an increase in flood hazard. This change of impervious surfaces that urbanization is associated with, is the primary driver of a catchment’s hydrological changes (Shuster et al., 2005). It is observed that earlier settlements preferred to stay away from water bodies due to frequent floods, giving room for water bodies to expand. However, with urbanization, the demand for land increased with a decrease in affordable land availability, thereby compelling people to opt for land near water bodies. The vicinity around the water streams is very fragile to flood and plays a vital role in maintaining the balance of water through vegetation. In 1997, the paved area near the water body was 6.20 km2. By 2018, it increased to more than double to 15.03 km2 out of 37 km2 (Figure 3, Table 9).
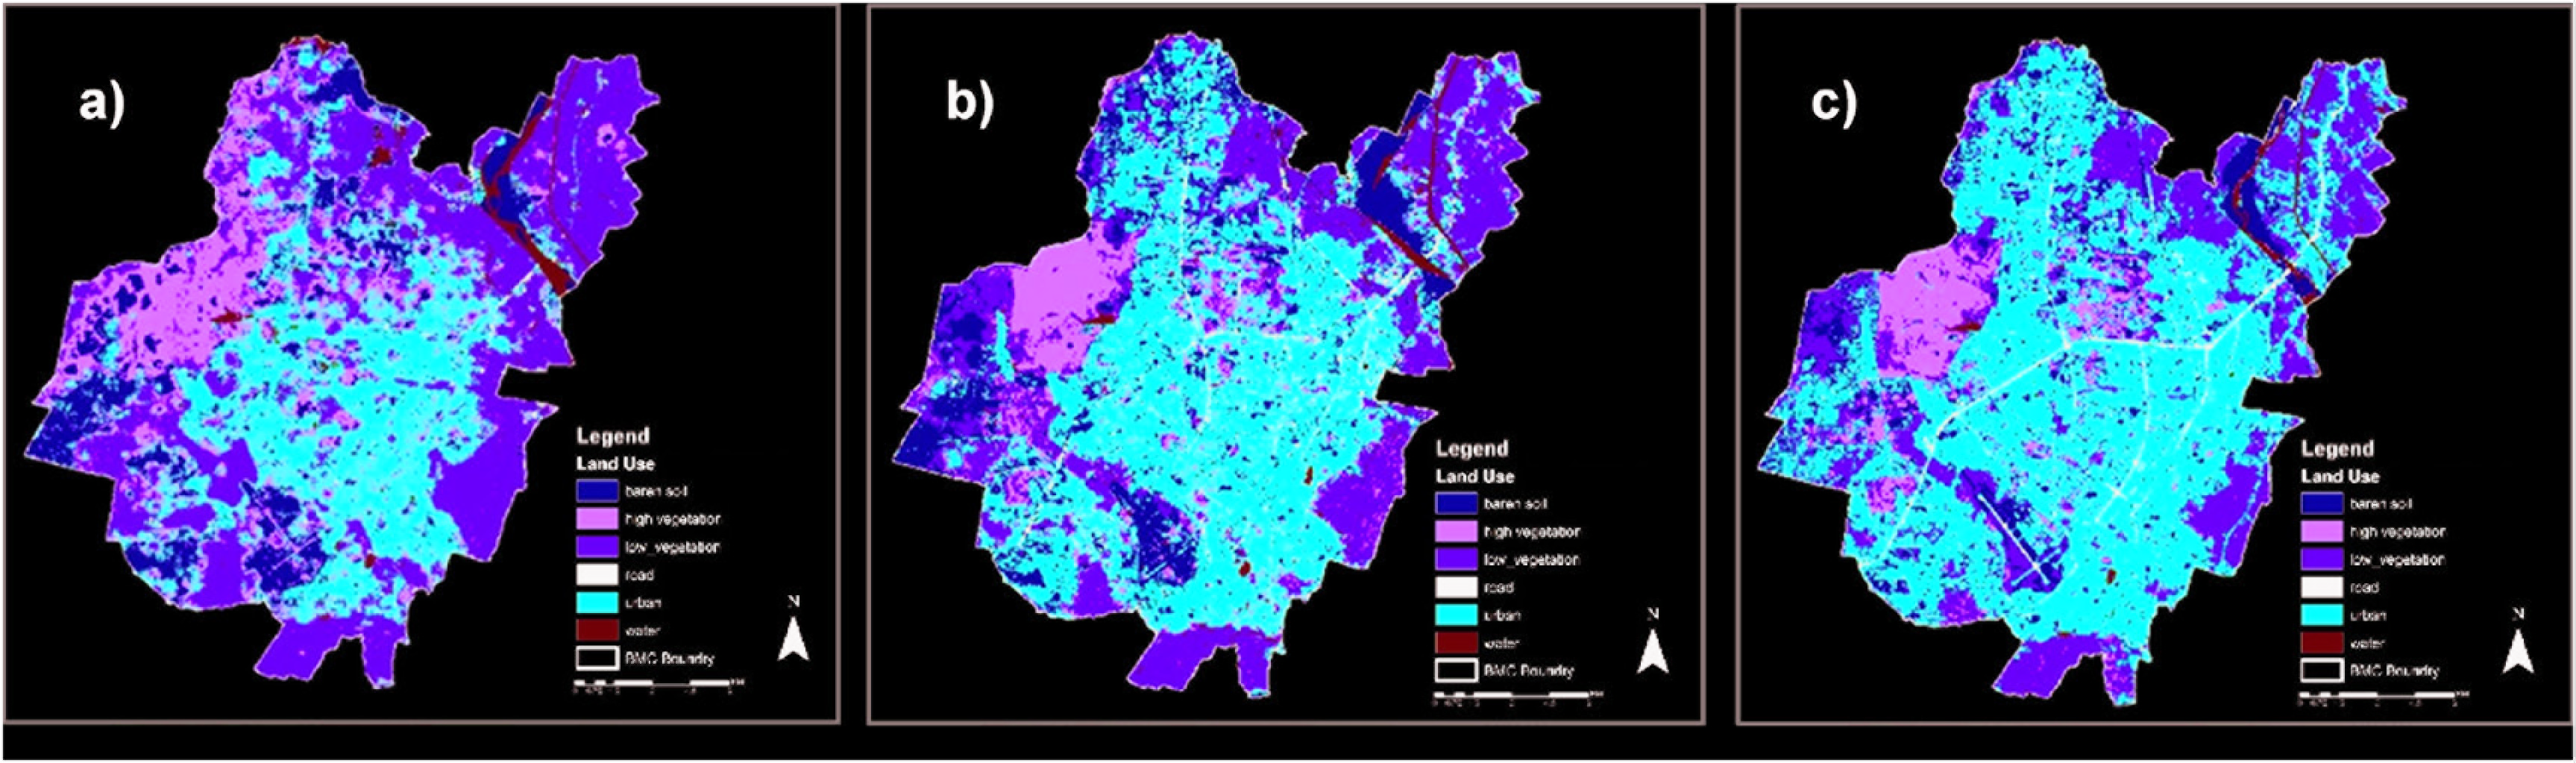
Change of Land Use and Land Cover in Past Two Decades
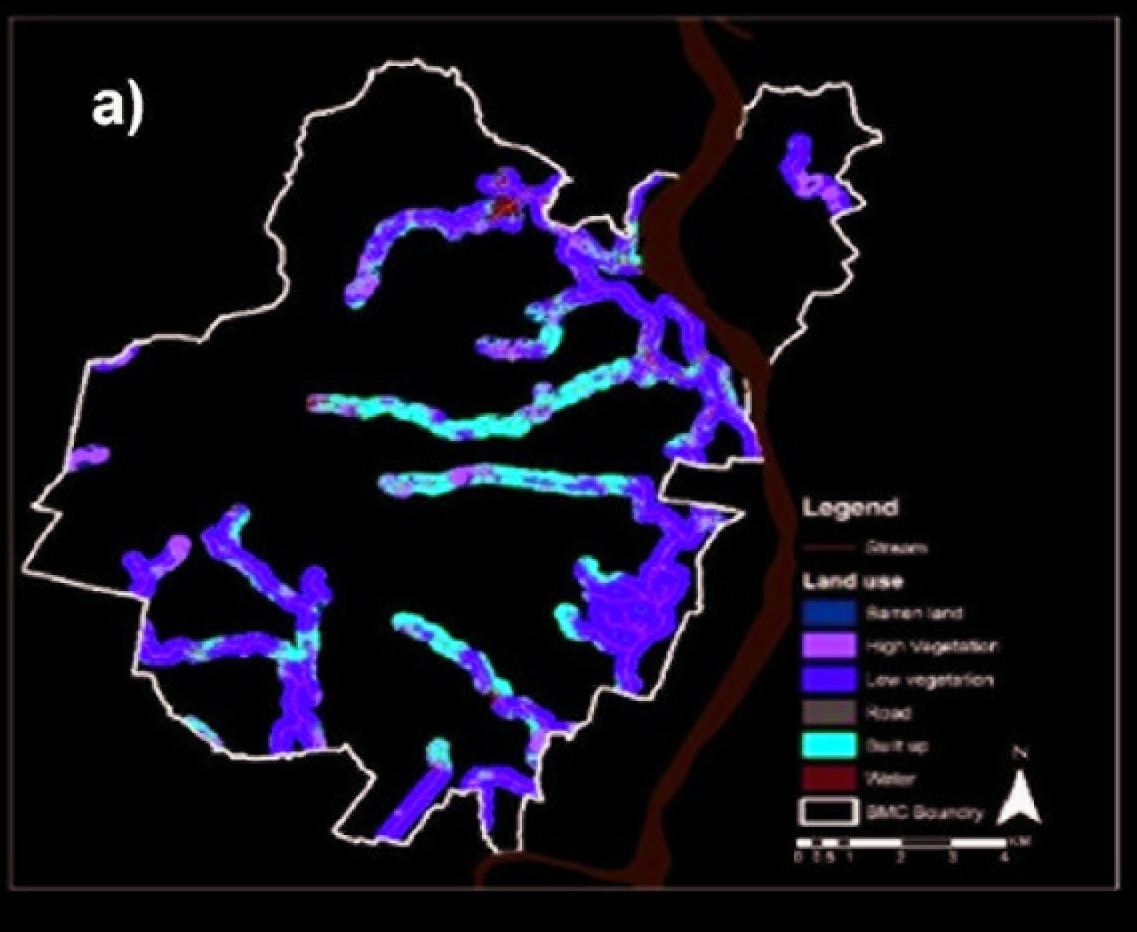
(b) 2009 LULC Map near the Stream
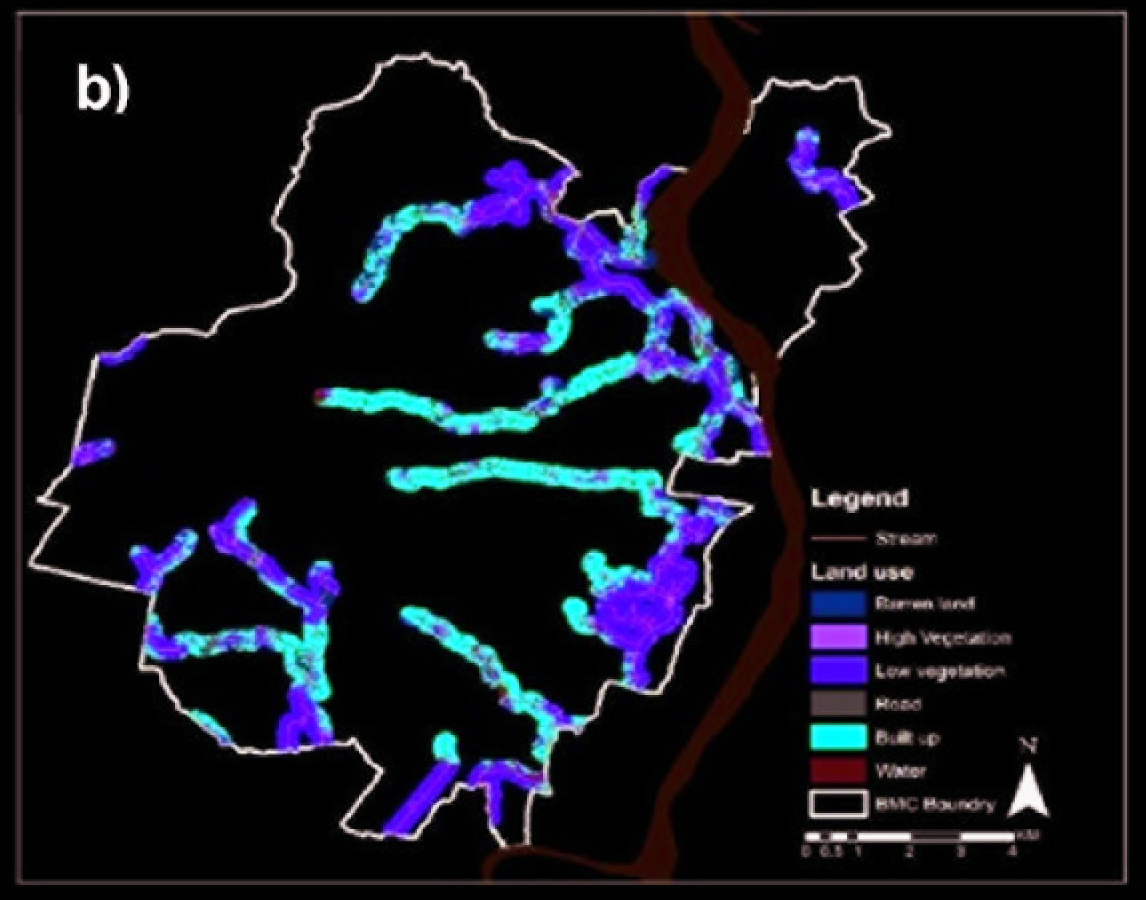
(c) 2019 LULC Map near the Stream
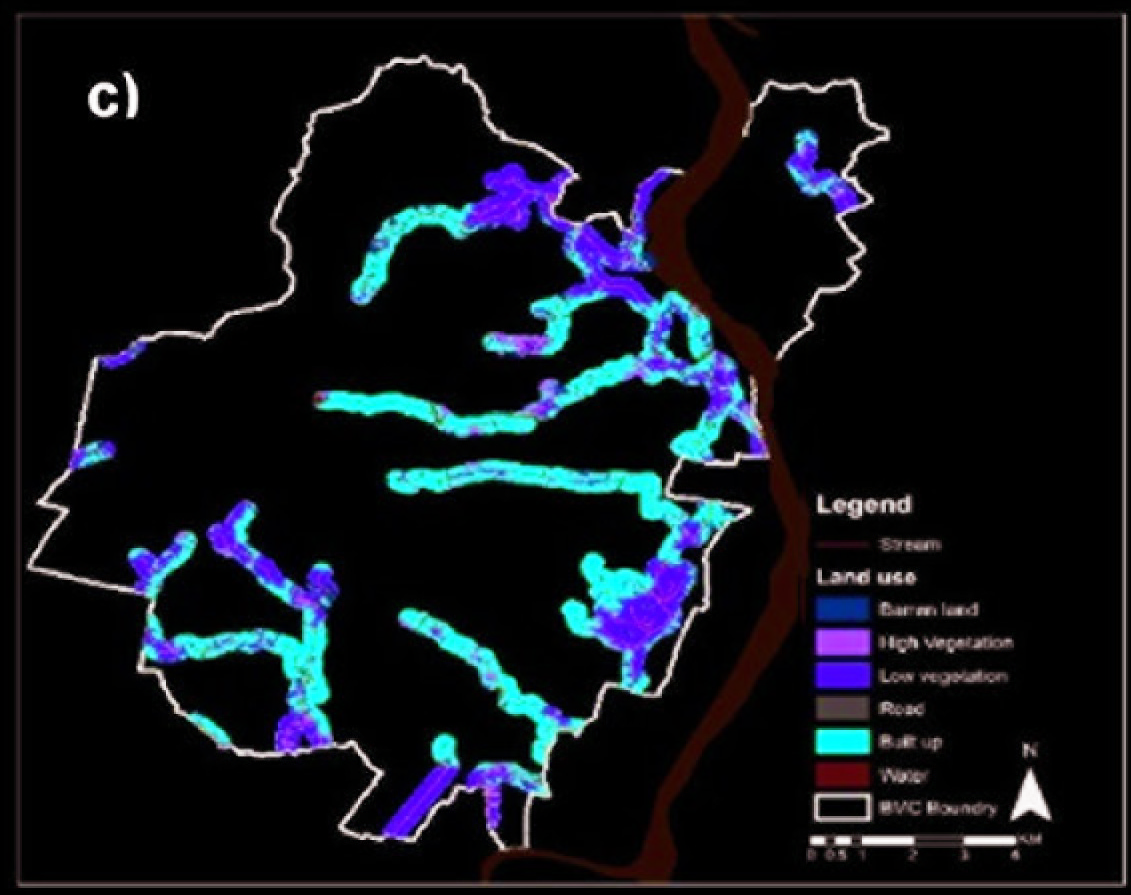
Change of Land Use and Land Cover near the Waterbodies in Past Two Decades

Land Use Regulation and by Laws
The floor area ratio (FAR) of a building as per the existing bylaws depends on the road width, irrespective of its location or disaster risk potential. The maximum permissible FAR for a residential building is 2.25 and for a commercial building is 2.75. In residential zones, a vast number of activities and amenities such as banks, post offices and health clinics are permitted in the master plan. Under certain permissions, garages and godown are also permitted in the residential zone. In the open space zone, amenities such as stadiums, maidans (public squares), holiday resorts, swimming pools, bus and railway terminals, public utilities and the like are allowed. Places of entertainment and leisure, such as cinema, circus, public assembly halls, restaurants and guest houses are allowed in this zone under specific permissions from the competent authority. Some wetland in the municipal boundary is classified as open space in the land use zone. Such areas can be developed legitimately into any of the above-specified structures with time, thereby destroying the wetland. Even the basic conversion of wetland into multi-purpose maidans would demand the clearing of low vegetation. In the water body land use zone, water-based resorts with special bylaws and water theme parks are allowed under special permission from the competent authority. In the building regulation, wetland, waterlogged and marshy areas are zoned as water bodies to avoid the emergence of activities mentioned in other land use zones. However, the master plan classifies only river, canal, streams, ponds and lakes as water bodies, irrespective of the land use zone regulation. In environmentally sensitive zone, activities like group housing, corporate type housing with special bylaws, theme park, international convention centre, five-star lake resort, hotel with special bylaws, health institutions, research institution, and similar are permissible. Environmentally sensitive areas are very fragile areas, and any form of intervention can destroy its natural setting. Some of the low-lying areas near the river Khuakhai and Daya, and downstream of the Gangua nalla have been zoned as environmentally sensitive. These areas are usually flooded every monsoon. Permissions for the structures mentioned above in these areas under any circumstances through bylaws can accelerate the flooding in Bhubaneswar. Figure 4 shows that new residential areas are also coming up in the low-lying areas near the natural stream. This means that during rainfall, residents may suffer from flooding since the areas which could have acted as a natural sponge by allowing water to percolate, would be lost because of residential development. These residential areas are legal as per the master plan.

Encroachment
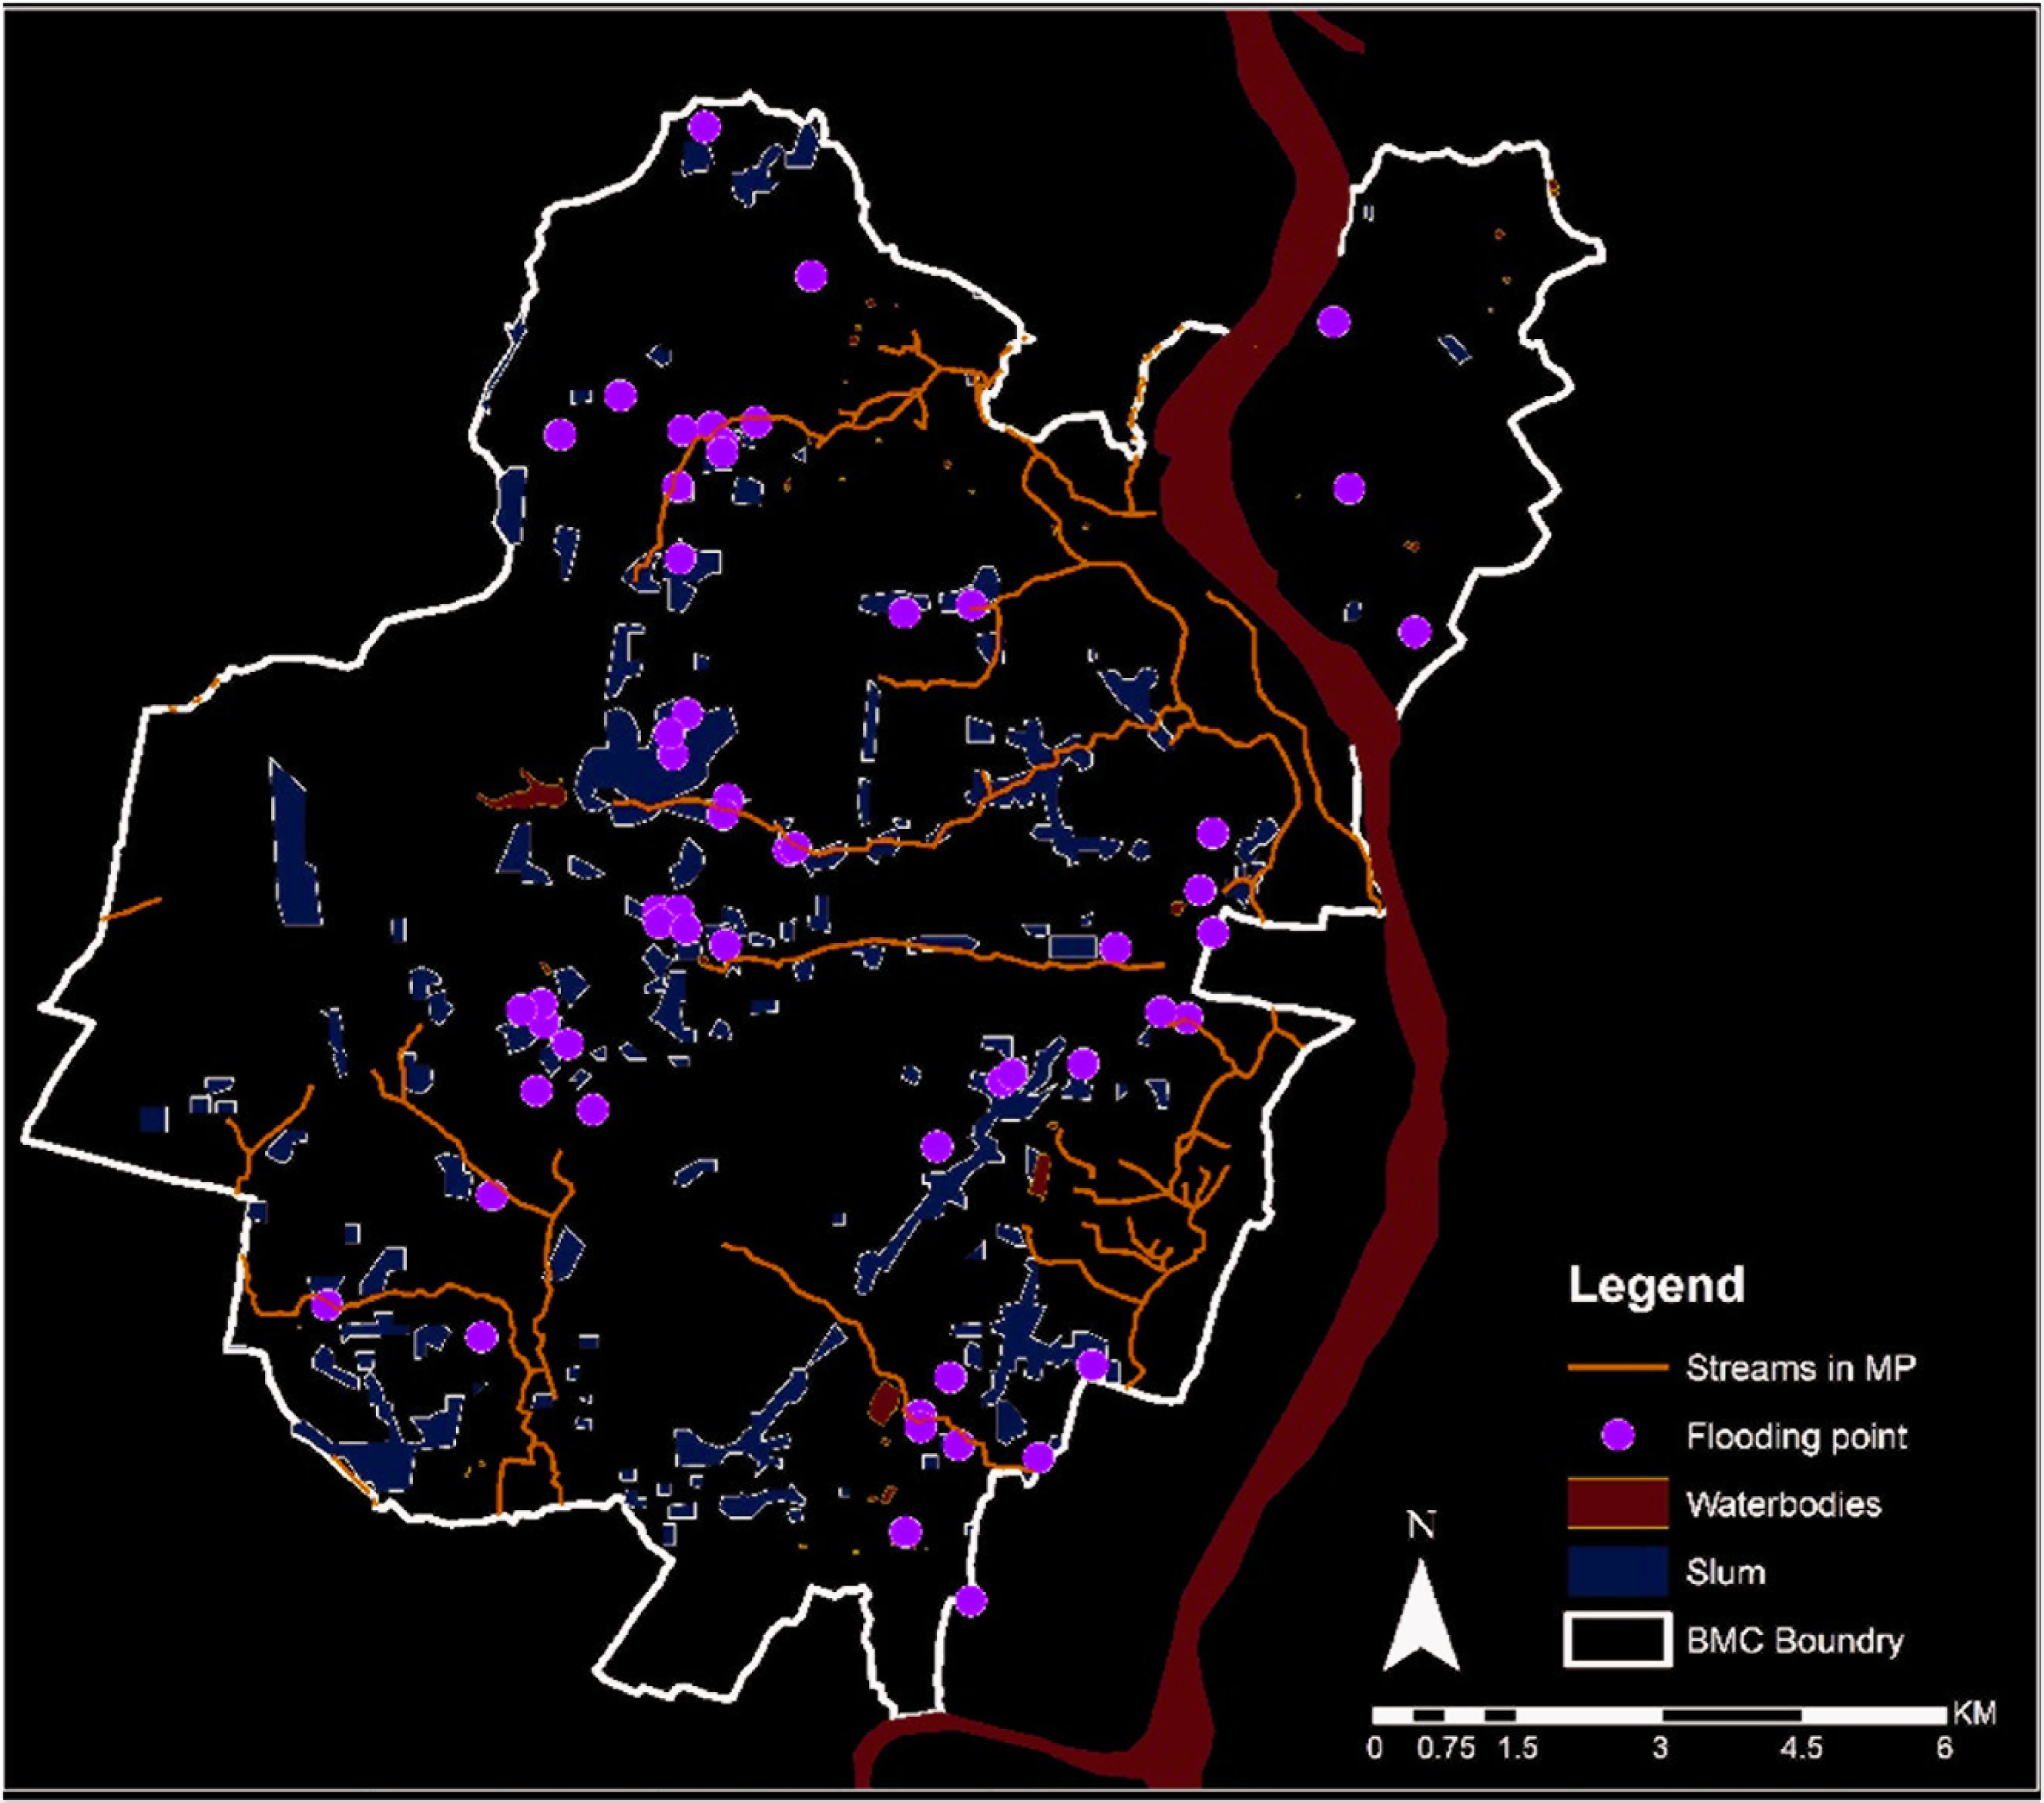
The AMRUT report presented that 14 acres of land along the streams have been encroached in Bhubaneswar; 436 slums are identified by BMC, out of which two slums are on existing forest land. Most of the slums are located near the water bodies due to the free availability of land. Four unauthorized slums are on water bodies and one in an environmentally sensitive zone. Generally, slums emerge during the non-monsoon season when these lands are vacant and dry. Such patterns of settlement disrupt the natural watercourse and habitation in such locations is disrupted by water bodies or upstream water during monsoon (Anand & Deb, 2017). An overlap map of the waterlogged points with the slum location in Bhubaneswar (Figure 5) reflects that the low-lying slum areas are one of the drivers of urban flooding and, at the same time, are the worst victims of it.
Flood Risk Map
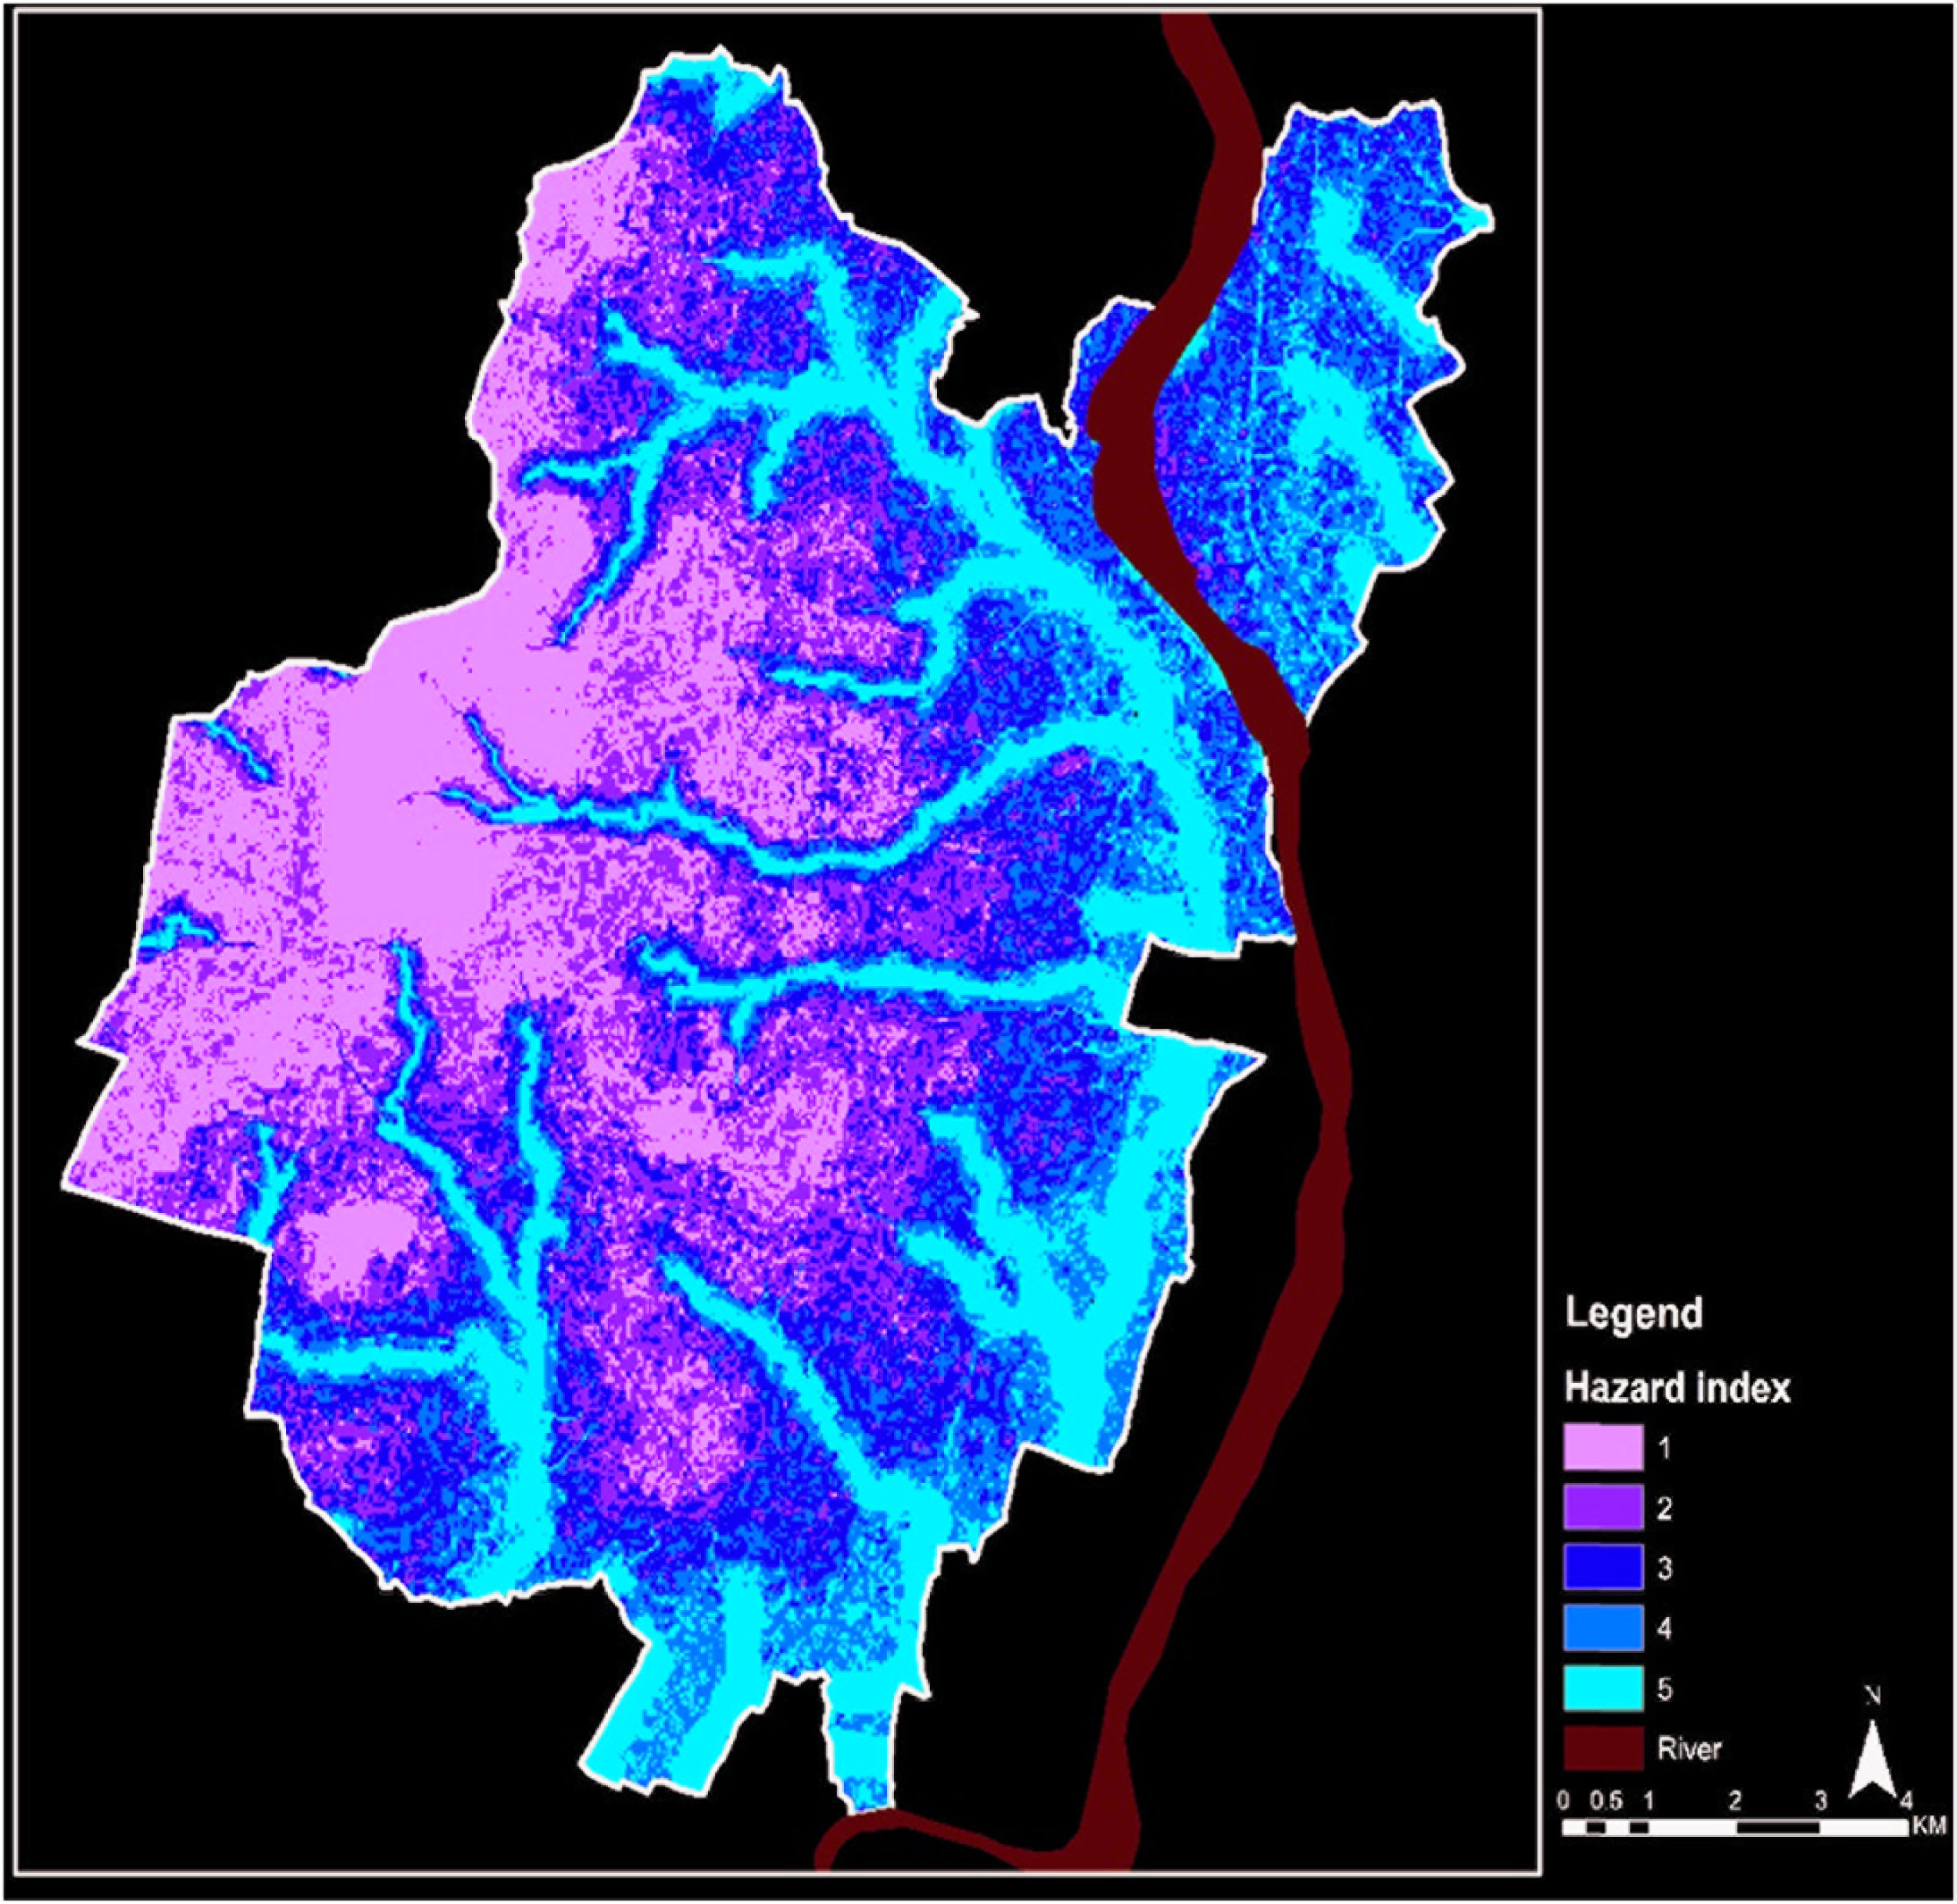
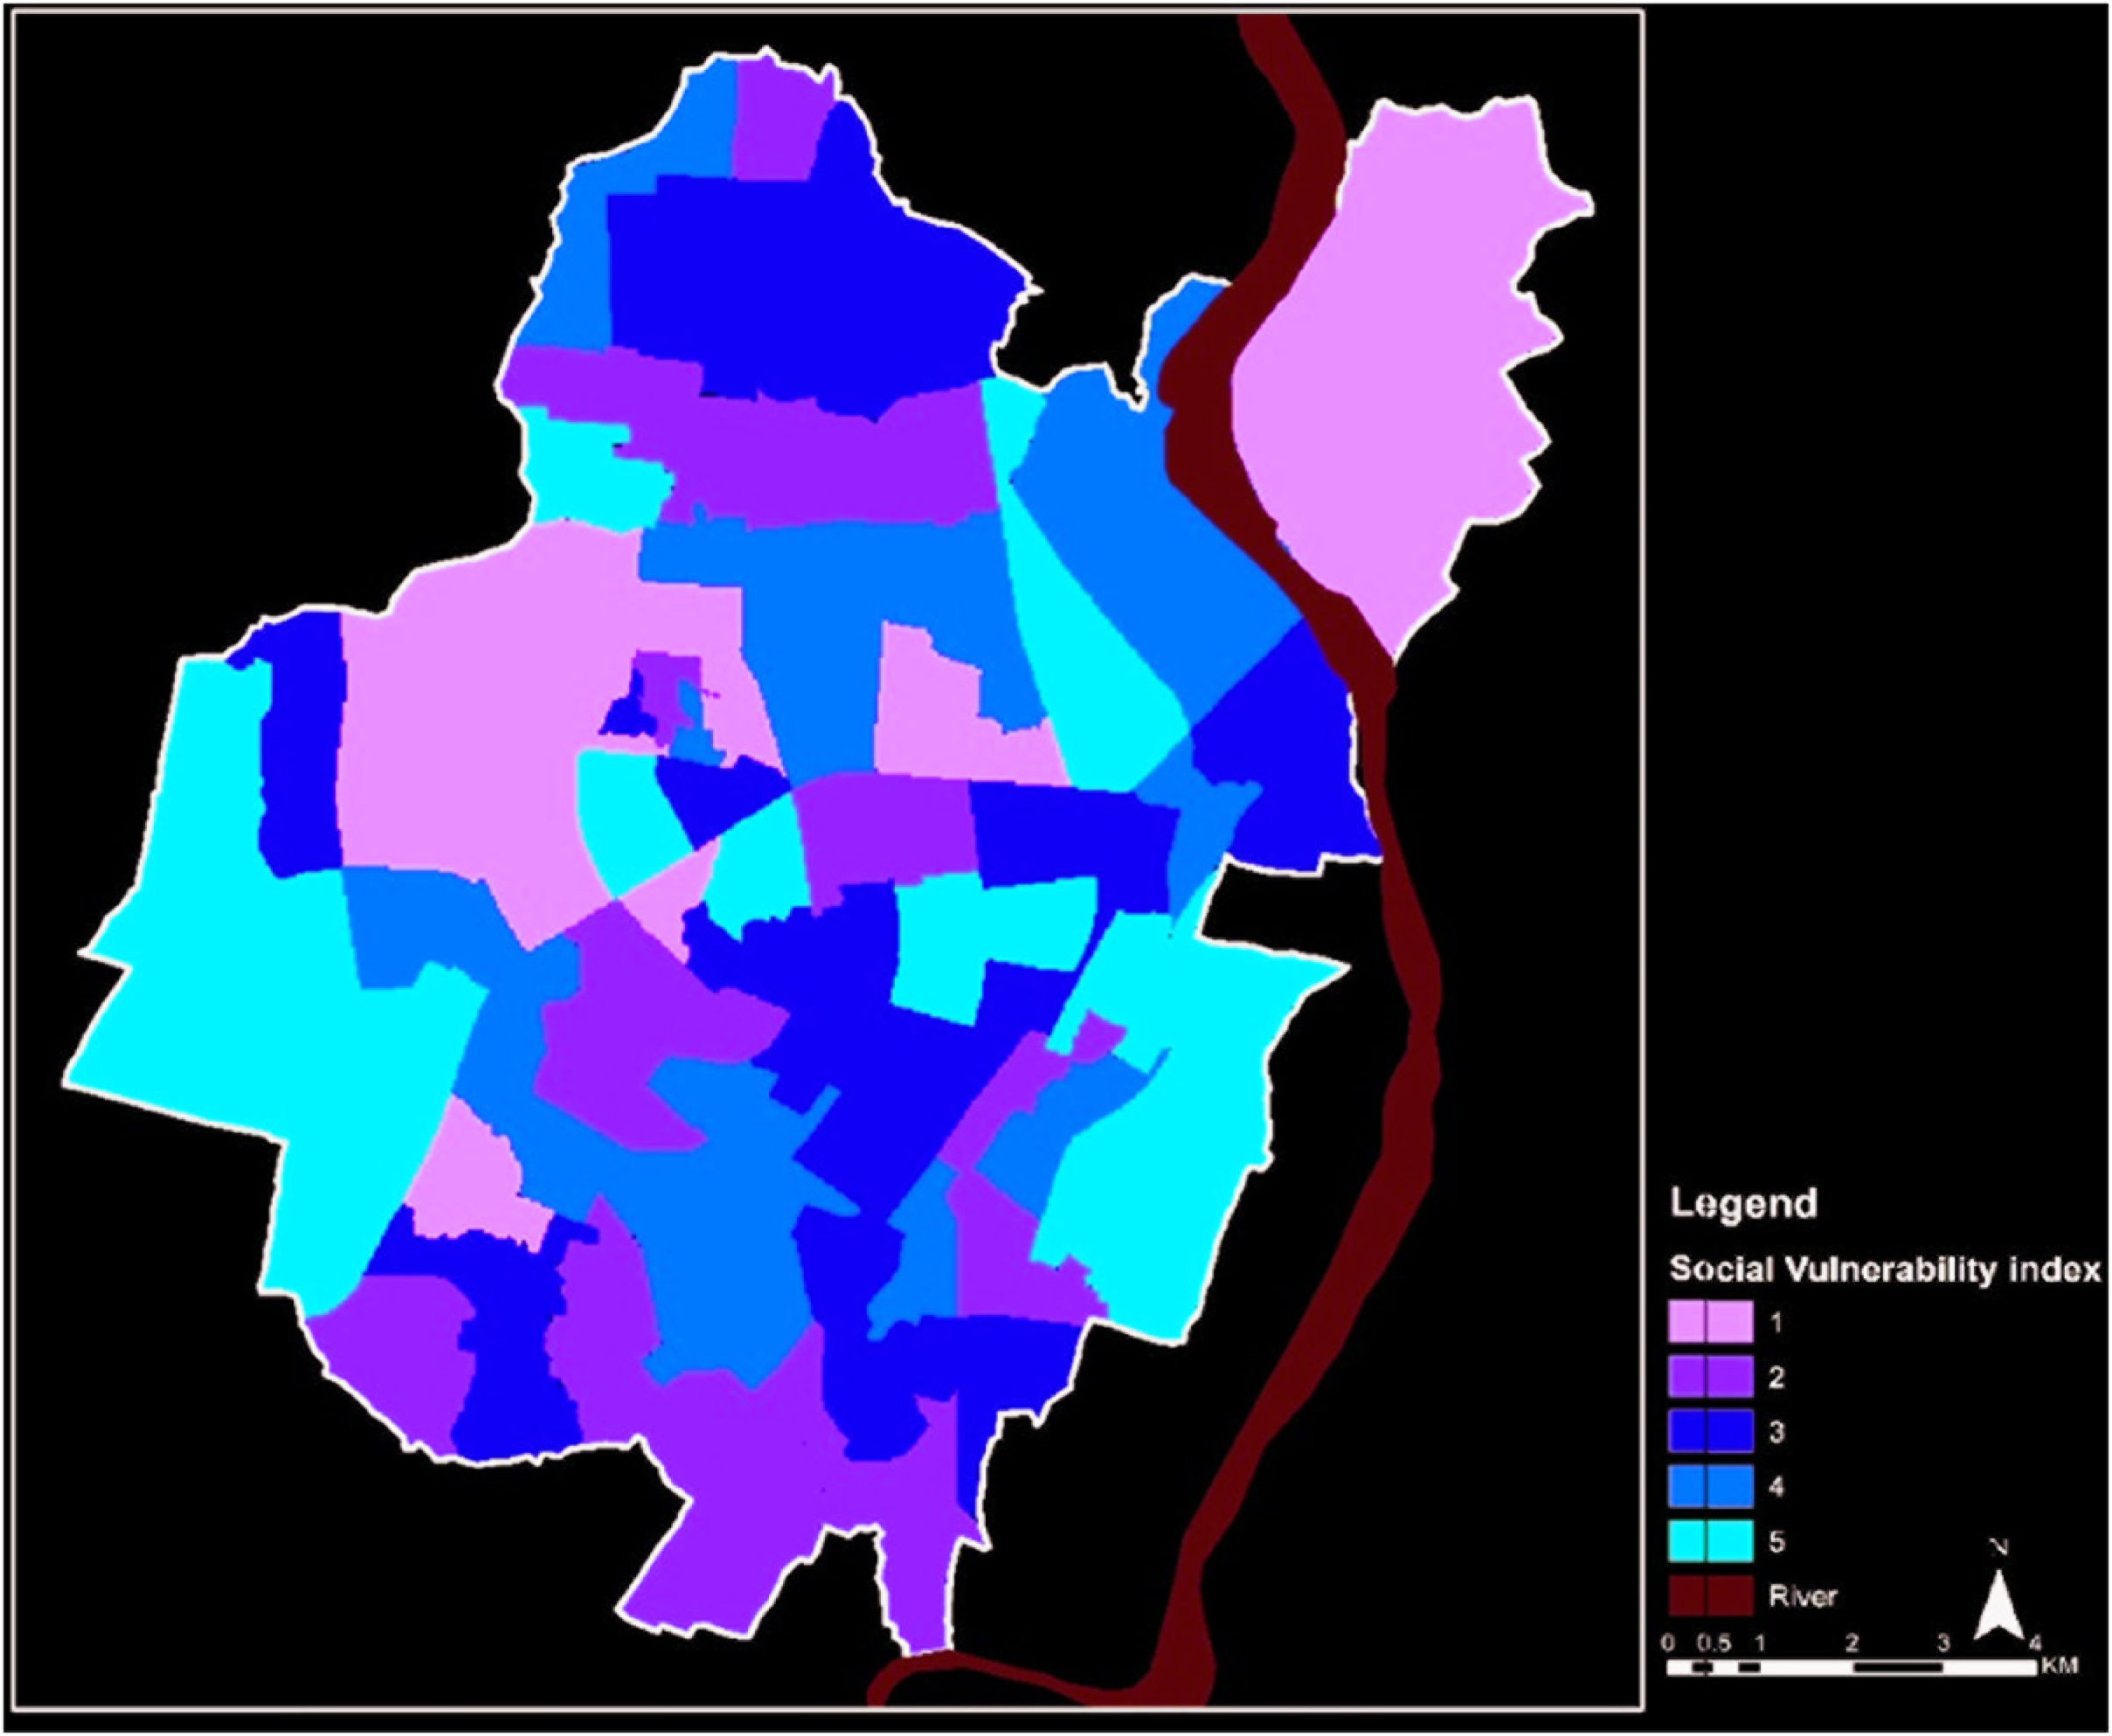
Figure 6a shows that the eastern part of Bhubaneswar is most susceptible to flood hazards due to its low elevation and low slope. Areas along the streams in the city also have a high flood hazard potential. Figure 6b shows that the social vulnerability of the city is very diverse. Wards that have more slums are found to have a higher vulnerability to disaster than other wards. This map can help in preparing a plan for disaster mitigation at the time of its occurrence. Figure 6c display the areas that need immediate infrastructural intervention. The high-vulnerability areas are the ones with a comparatively lower provision of infrastructure which causes more problems to people during or after a disaster.
(b) Social Vulnerability Map
(c) Physical Vulnerability Map
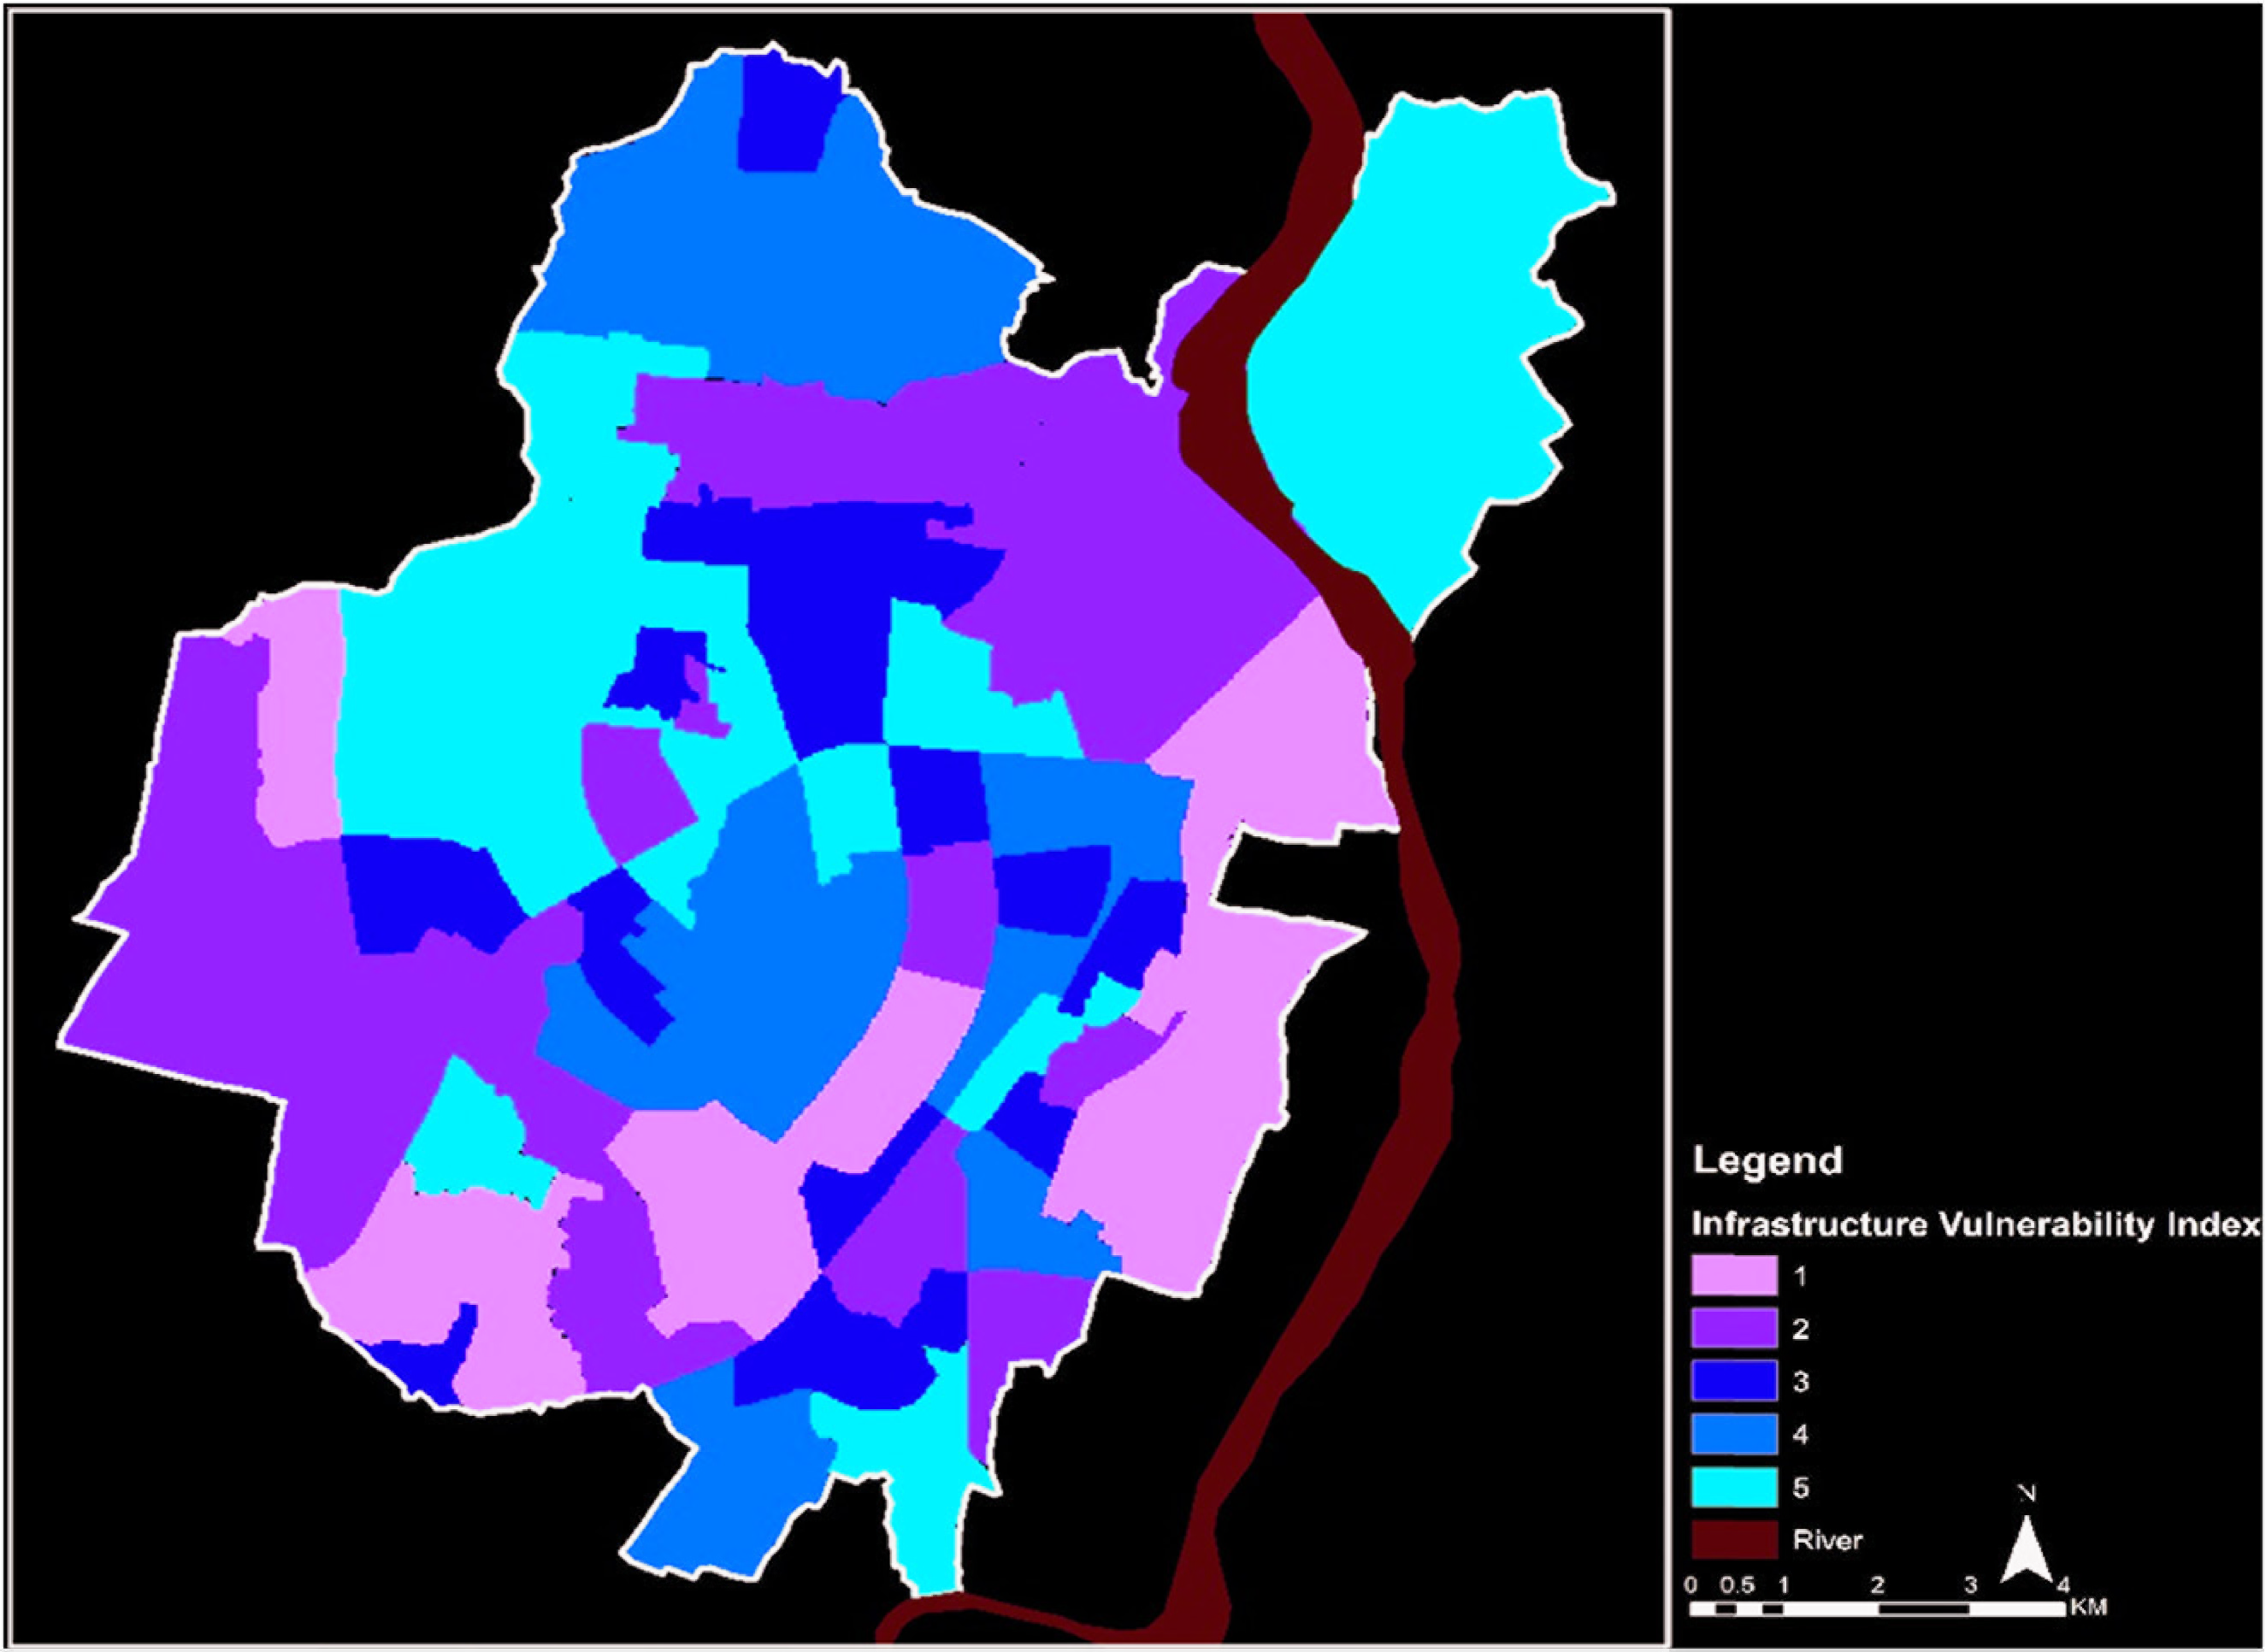
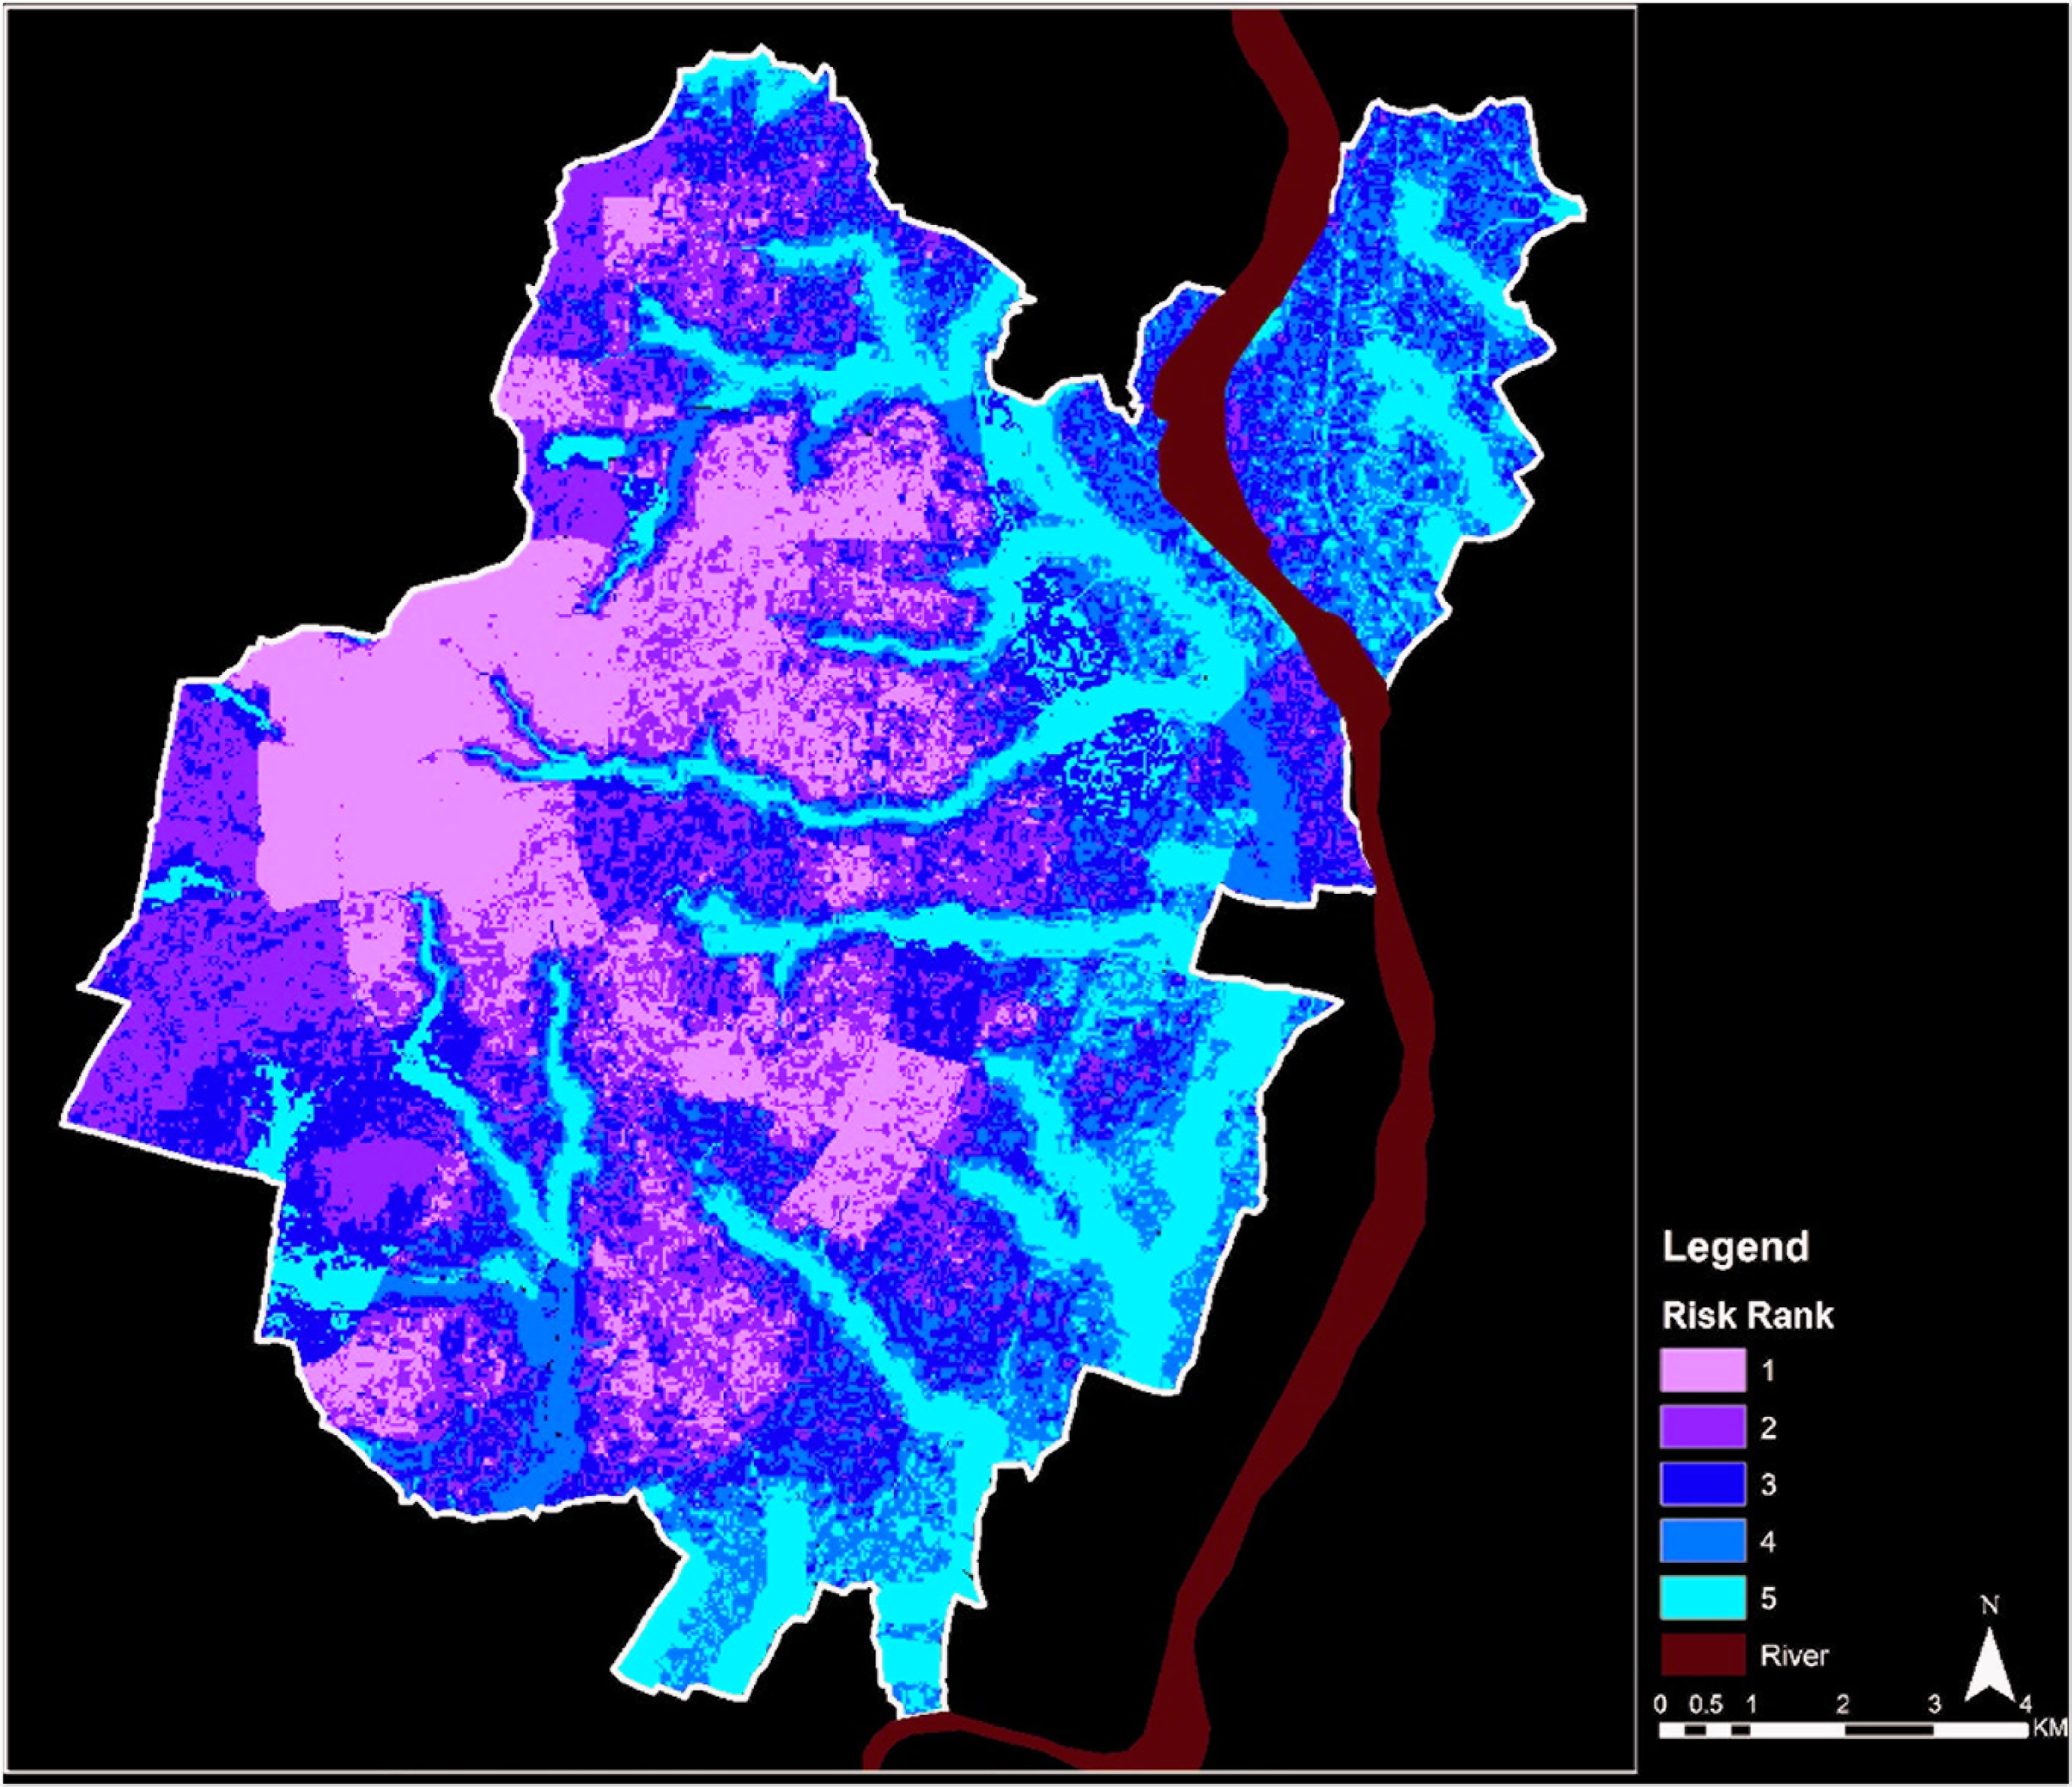
Figure 7 represents the risk map that accounts for both hazard and vulnerability. It is found that most of the very high-risk zones are near water bodies. High-risk zones are observed to be on the eastern side of the city, which is at low elevation. The central and western part of the city is in a low-risk zone, where further development can be proposed. This map can act as a base map for urban planners and the city manager to develop disaster reduction strategies and increase disaster management effectiveness.
Discussion
Proposed Master Plan
Land use planning offers several opportunities in managing floods in all the stages of the disaster risk management cycle. The existing master plan of Bhubaneswar, Comprehensive development plan, 2010, has been closely studied and has been overlapped with flood hazards, vulnerability and risk map to find critical locations and the gap in the existing master plan that can result in loss of lives and economy in case of disaster. Land use is studied along with the existing building codes and regulations for a more thorough understanding of the scenario. It is found that disaster risk was never incorporated in the master plan of the city. Any structure near the high flood risk zone follows the same rule as the low flood risk zone. Therefore, an alternative proposed land use master plan (Figure 8a) is prepared in this study, where areas under the flood risk zone have been critically examined and alternatives have been explored through different lenses. All the risk-prone areas have been enlarged to examine the plots against the risk map and individual parameters like slope and elevation, in order to propose an alternative master plan.
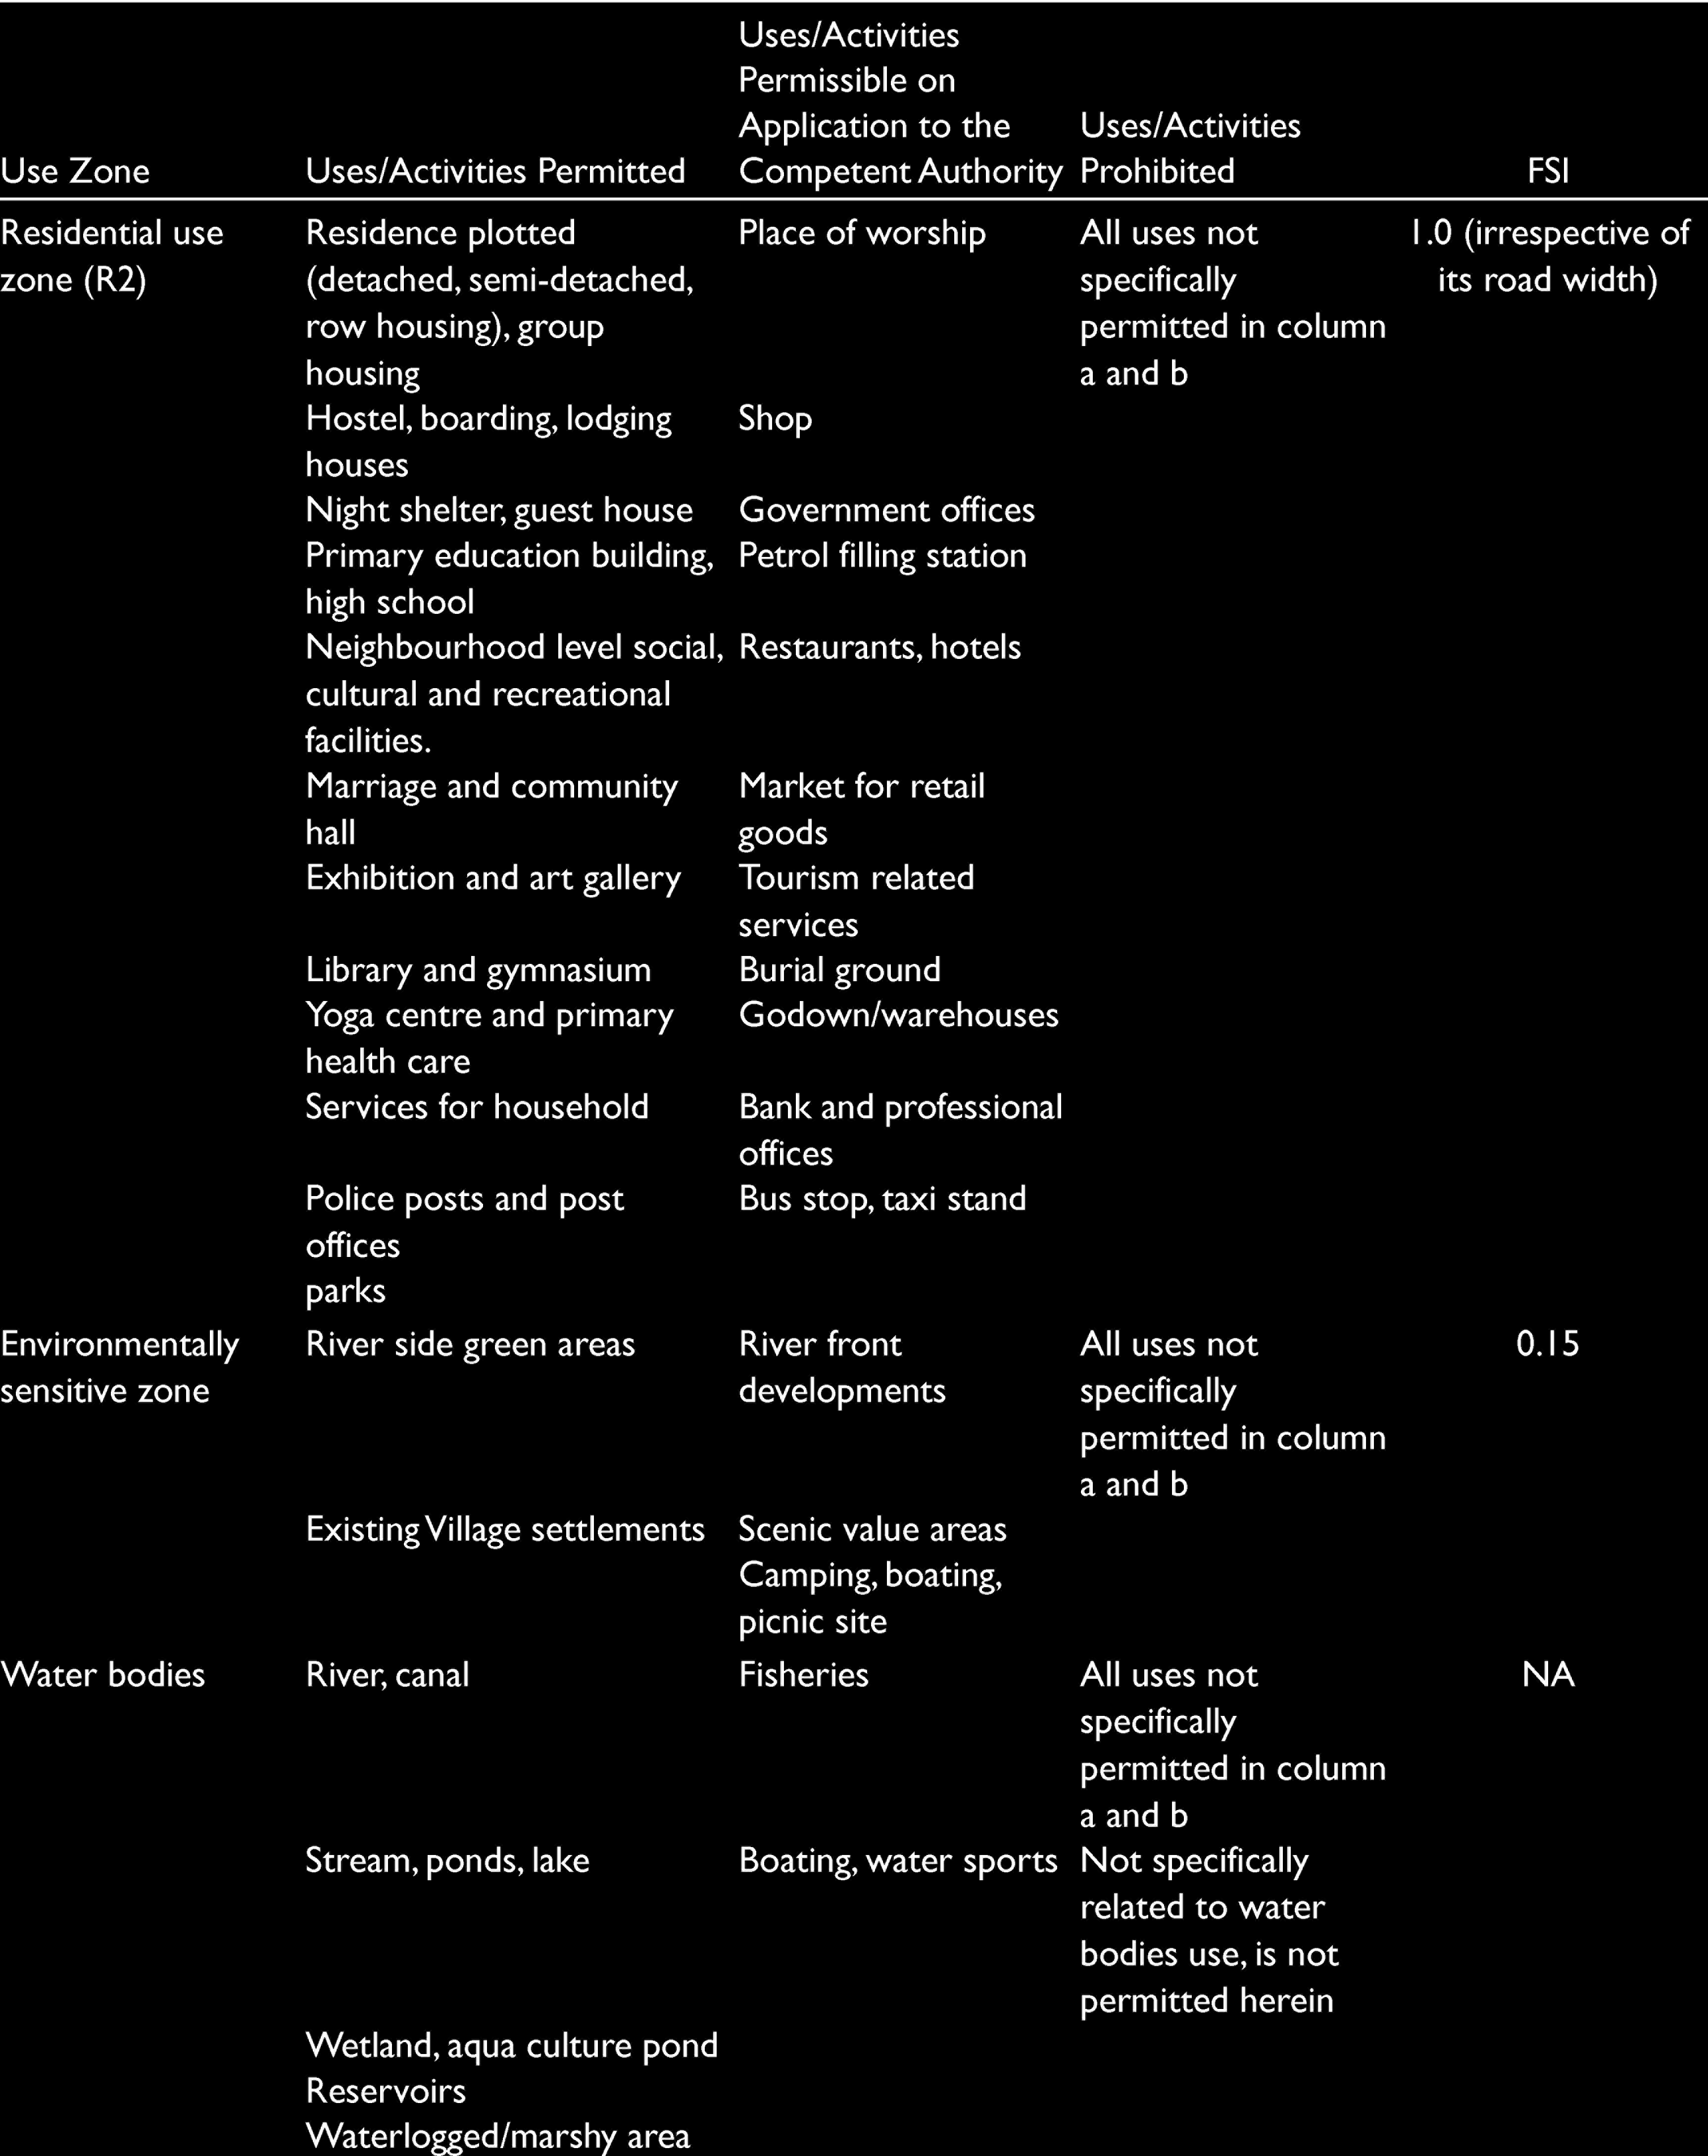
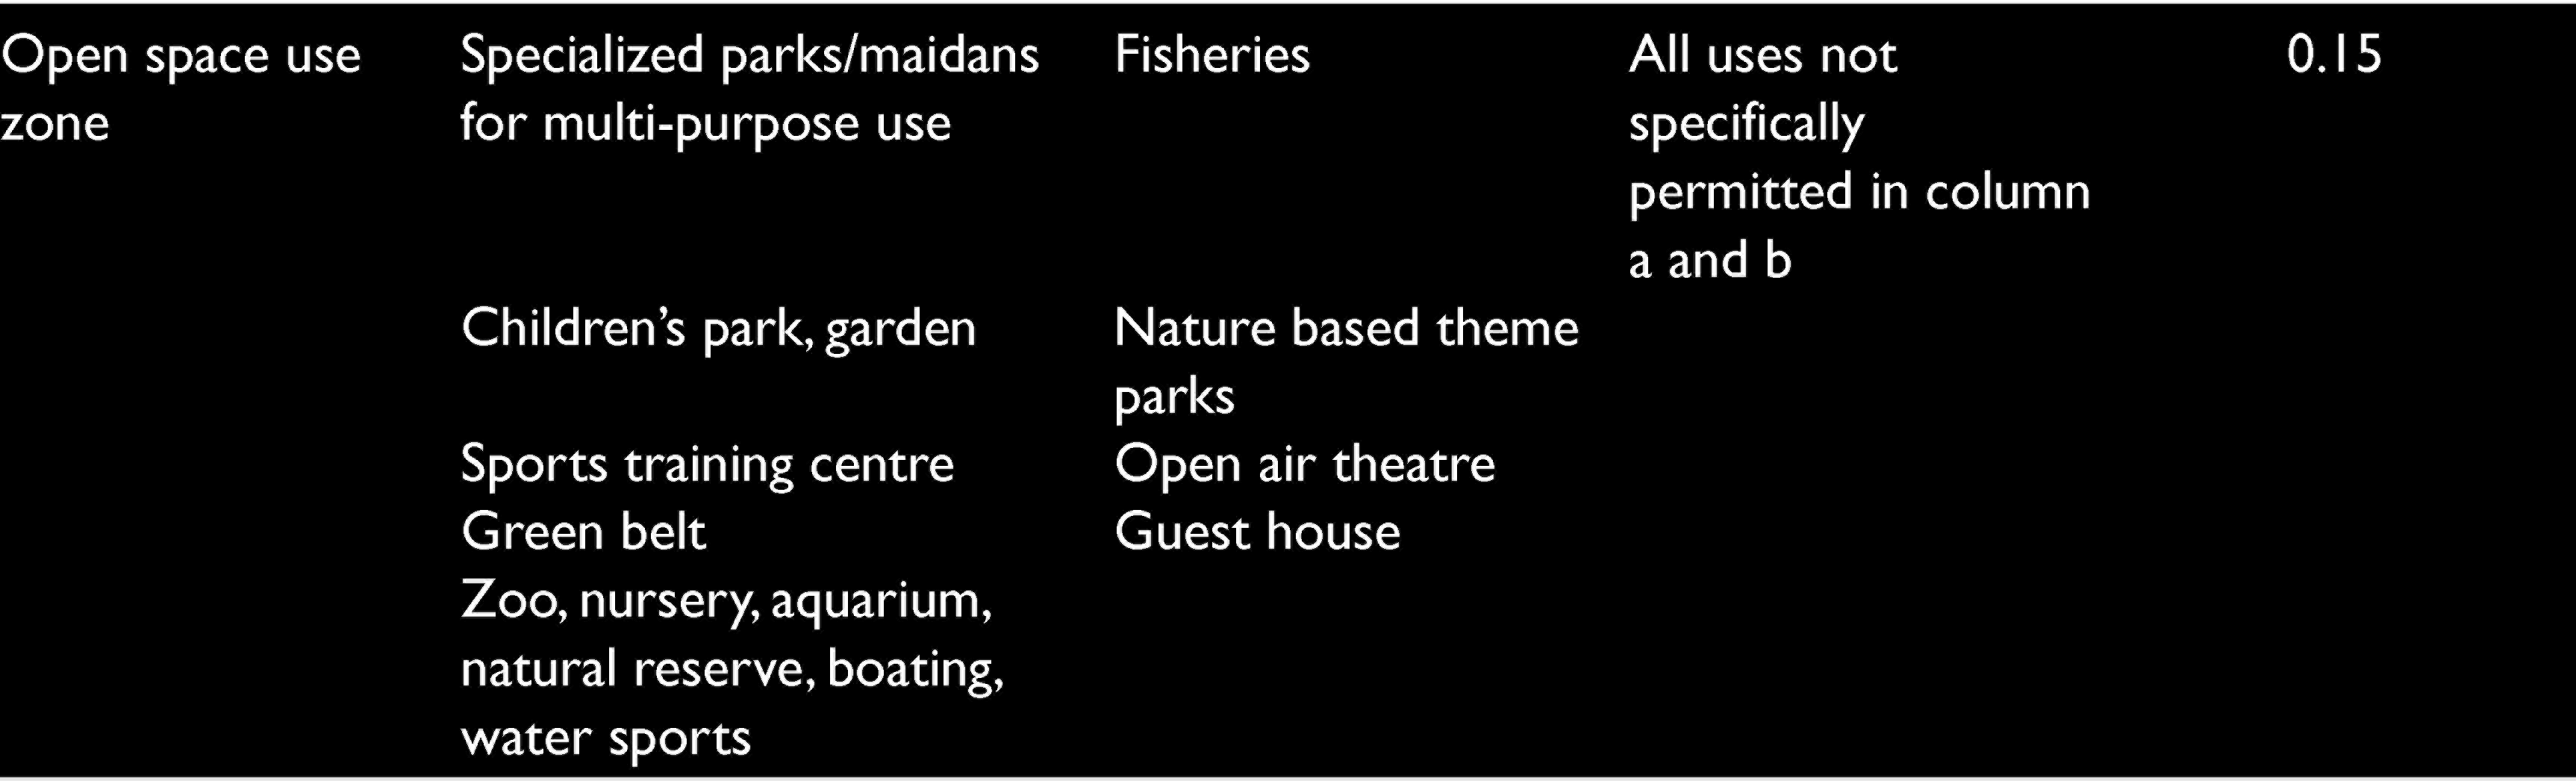
An additional land use zone called R2 residential zone is proposed, with a permissible maximum FSI one, irrespective of its road width. The R2 residential zone is marked in the high flood risk zone to keep density low. The R2 residential zone ground coverage will be a maximum of up to 40%, unlike the present permissible limit of 50%. Wetland and marshy lands are added under the water body zone in the proposed master plan. Furthermore, only fishery, boating and water sport are allowed under special permission. Some of the very high flood risk zones that were under a particular kind of development zone have been changed to environmentally sensitive zones, and only riverside green areas and existing village settlements are permissible. Riverfront development, scenic value areas, camping, boating, picnic site are permitted on application to the competent authority. Some of the very high and high flood risk zones have been categorized as green space zones in the proposed master plan. Children’s parks, gardens, sports training centres, green belts, zoos, nurseries, aquariums, natural reserves, water sports facilities, specialized parks/maidans for multi-purpose use are permissible in this zone. Fisheries, boating, open air theatre, guest house and nature-based theme parks are permissible on application to the competent authority (Table 10). The maximum FSI permitted in this zone is 0.15. Green space zone has been allotted along the streams where the immediate existing land use zones are pollutant oriented, like industries. In the draft proposed master plan, green space is mandatory in every town planning (TP) scheme. Additionally, it is guided that one green space zone should be near water bodies in every given TP scheme.
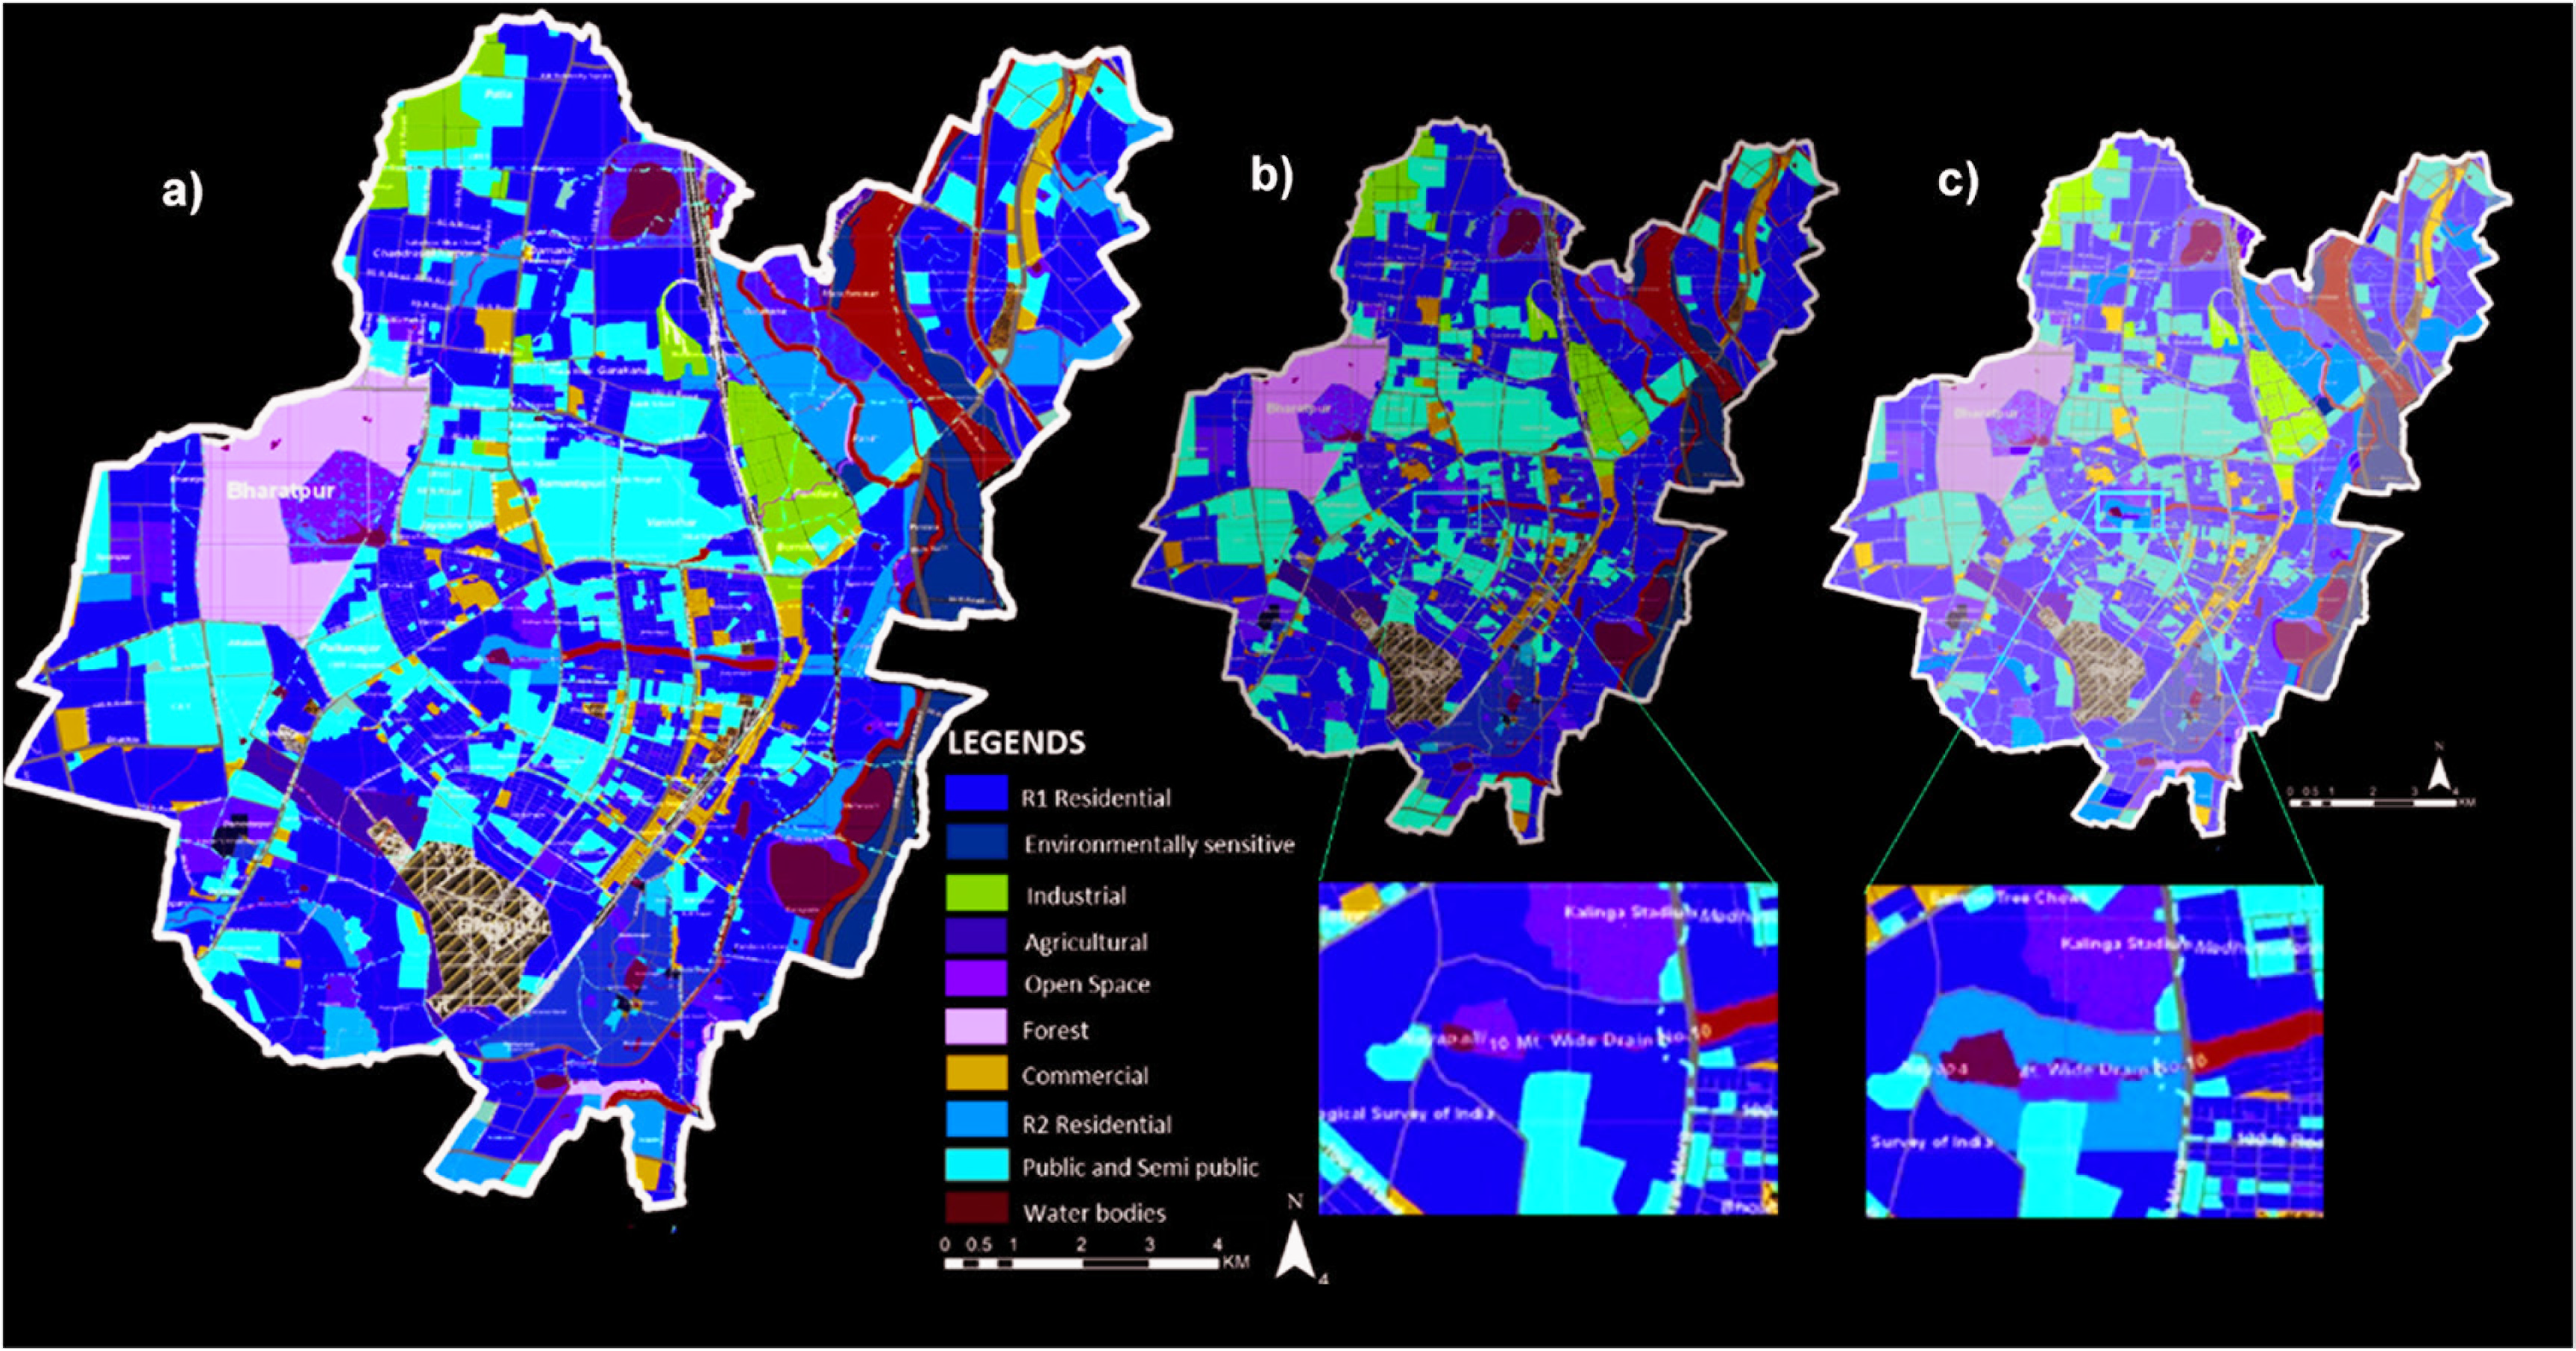
Proposed Land Use
The low-lying eastern area is mainly proposed as an environmentally sensitive zone. Adjacent to it, a low-density R2 zone is recommended and industrial and commercials are limited here to minimize anthropogenic activities and their impacts. The open spaces near the water body downstream that get waterlogged are demarcated as forest land to ensure no concretized development can come forward. One of the significant wetlands in the middle of the city (Figure 8b and 8c) has been changed from a green zone to a water body zone. The land near the wetland is proposed as a green zone where bird sanctuaries or parks can be developed. The land surrounding the wetland and open space is given as an R2 residential zone.
By supporting the spatial integration of ‘grey’ conventional hard engineering with ‘green’ infrastructure to manage water resources and protect against flooding, this proposed land use planning can help to create balance in urban water resources. A risk-based approach to land use planning has been considered to make it more resilient to floods. This proposed plan minimizes development in the flood-prone zone, reduces water runoff through development controls for flood risk mitigation and designates routes and open spaces for better response and recovery efforts. It also mitigates damage from an unavoidable flood and accommodates urban growth expansion in the flood-safe areas. The proposed land use planning encompasses the socio-vulnerability and incorporates the hazard zone to formulate a resilient urban flood spatial plan.
Riparian Corridor
The transition between the water body and land is pivotal and plays a vital role in controlling or facilitating the flood. The edge of the water body is crucial for a healthy freshwater system (Kenwick et al., 2009). The riparian corridor around the water bodies helps to control the sedimentation, contamination and peak flow runoff (Carter et al., 1979). It helps in reducing erosion by stabilizing the soil (Lee et al., 2000). Considering all the riparian corridor benefits, various urban development authorities of different cities have proposed a buffer zone between water bodies and settlements. Depending on the stream order, the buffer varies in some of the building codes. Assam has a regulation for 15m buffer around the river and 10m buffer for ponds and other notified water bodies. Nairobi, a city in Kenya, and Madhya Pradesh, a state in India, have a 30m buffer from waterbodies for the riparian zone. Similarly, states like Maharashtra, Andhra Pradesh, Telangana and Gujarat have a buffer zone around the water bodies as a no-development zone in their state-building regulation norm. Cities further have changed or modified the law to a higher buffer zone. For instance, Bangalore city in Karnataka state has assigned 50m, 35m and 25m buffer for primary, secondary and tertiary water bodies, respectively. In comparison, the Karnataka state-building regulation prescribes a buffer of 45m from the river and 25m from minor streams.
However, neither the Bhubaneswar Development Authority nor the Odisha State Urban Development Authority has any such regulation in building codes, as a result of which, development happens just beside the water bodies lawfully. Such development disrupts the watercourse at a very sensitive junction, thereby causing flooding. The primary study observed that the structure immediately next to the water body discharges solid waste and grey and black water directly into it.
Streams need their space to flow without disruption. Buffer network gives the ‘right-of-way’ to the stream and as a whole function as an integral part of the stream ecosystem. Buffer is a standardization system of giving space around the water bodies, but every topography is unique, and hence standardization may not hold in all cases. Ideally, 25 years, 50 years and 100 years of flood line should be considered before proposing a buffer zone. However, due to the unavailability of data for small water bodies, a standardized buffer of 15m, 20m, 25m, 30m and 50m from the streams is practiced world over (Beacon Environmental Ltd., 2012; Jainer & Matto, 2017; McElfish et al., 2008; Schueler, 2000).
The following are the land uses that are proposed around the water bodies:
The 15m distance from the water bodies is very critical. Therefore, it is categorized as an eco-sensitive zone, which is completely reserved for riparian use. From 15m to 30m from the water bodies is categorized as a critical-risk zone, and open and green space is allowed. From 30m to 50m, the land is categorized as a high-risk zone and an R2 residential zone is allowed. R2 zone has a lower FSI than the R1 residential zone. It is proposed for facilitating low-density development in such areas. From 50m to 100m, a medium risk zone, R2 residential zone is allowed. Under special conditions and approval from the competent authority, high-rise buildings can also come near a minor stream. From 100m to 200m, all land use is permitted, with a suggestion to allow permission only after a brief soil, slope and other basic hydrological studies of that particular area.
Conclusion
In this research, we have assessed the urban flood disaster risk and previous land use of the city with GIS and remote sensing to explore the opportunity to formulate an urban flood risk-sensitive land use plan. The research reflects the nexus between land use planning and disaster risk management. The flood risk obtained results were validated against data from past floods records.
The research article discussed the formulation of disaster risk reduction-based land use plans in detail through zoning and building regulation codes. The risk-sensitive spatial planning process is challenging, but ultimately, goes beyond providing an engineering solution with a short-term vision. It considers disaster risk reduction as an integrated part of developing an approach for sustainable long-term growth.
Urbanization is associated with concretization, which is one of the core reasons for urban flooding. A risk-sensitive land use plan can change that perspective by prohibiting development in high-risk areas and encouraging development in a low-risk area, thereby maintaining the natural environment and providing sustainable infrastructural development. The proposed master plan will support the city in the various phases of the disaster risk reduction cycle, starting from the pre-disaster prevention phase to the mitigation and preparedness phase. It will also help city administrators in the post-disaster emergency response and recovery phase. Such a resilience plan would make Bhubaneswar a better-prepared city for the future. With better availability of data, the plan can be refined further.
Footnotes
Declaration of Conflicting Interests
The authors declared no potential conflicts of interest with respect to the research, authorship and/or publication of this article.
Funding
The authors received no financial support for the research, authorship and/or publication of this article.