
Abstract
The deterioration of freshwater resources is a major global risk, highlighting the need for a comprehensive water body sustainability framework as a decision-support tool for managing water bodies, particularly in urban areas. This study introduces the Water Body Sustainability Index (WBSI) to measure the sustainability of inland surface water bodies. The WBSI uses relevant indicators identified through both top-down and bottom-up approaches, assigns weights to these indicators and aggregates them into a composite index. It rates the sustainability of water bodies on a scale of 1–100, with 0 indicating very low and 100 indicating very high sustainability. The WBSI was applied to Najafgarh Lake in northern India in the Delhi and Gurugram regions, resulting in a score of 40.42, indicating very low sustainability. The assessment involved screening and consulting experts and stakeholders to prioritize 15 significant indicators, gathering data and organizing it into a sustainability matrix. Government policies, regulations and court orders were also examined to understand their impact on the WBSI. Recalculation of the WBSI, accounting for the positive impact of court orders and regulations on five indicators, increased the score to 52.08, placing it in the low sustainability range. Further improvements in the WBSI are expected as more data become available to quantify the positive impact on the remaining indicators post-interventions. The WBSI enables policymakers to assess sustainability, prioritize interventions and monitor the effectiveness of their actions over time, leading to the sustainable management of water bodies.
Keywords
Introduction
Globally, freshwater resources and their interconnected ecosystems are under significant threat. Their deterioration is considered one of the top ten global risks (Plessis, 2022). The negative impact on water resources, particularly in urban areas, is exacerbated by rapid population growth, increased anthropogenic activities and climate change compromising their ability to provide essential services (Moggridge et al., 2014), adversely affecting the species that inhabit these waters and posing health risks to humans due to the presence of toxins and pathogens (Teurlincx et al., 2019).
Efforts to revitalize urban water bodies have largely been reactive, focusing on immediate issues. There is a need for a comprehensive sustainability assessment framework that can serve as a decision-support system for managing water bodies sustainably. This tool would help policymakers and stakeholders prioritize actions and evaluate the impact of their decisions. While sustainability assessment tools can be qualitative or quantitative, a quantitative tool provides a more precise measurement of the effects of decisions based on the water body’s sustainability score.
A review of the literature reveals that several frameworks and tools have been developed to assess sustainability in the water sector. Notable examples include the Canadian Water Sustainability Index (CWSI), the Watershed Sustainability Index, the Time-series Integrated Groundwater Sustainability Assessment and the Mashhad Basin Sustainability Assessment (Chaves & Alipaz, 2007; Policy Research Initiative, 2007; Samani et al., 2021; Shafiei et al., 2022). These frameworks contribute significantly to refining assessment practices and guiding the development of strategies and policies for long-term sustainability in the water sector. However, they also highlight gaps, suggesting areas requiring further research and development. For instance, only limited frameworks have effectively incorporated stakeholders’ perspectives (Juwana et al., 2010; Richter et al., 2018), which may be due to challenges in consensus-building and the time-consuming nature of the decision-making process. Additionally, while they address both water quality and quantity, issues such as the ecological health of water bodies, biodiversity preservation and concepts such as minimum environmental flows—crucial for human and ecosystem well-being—are often overlooked.
Research across various fields consistently emphasizes the critical role of stakeholders in shaping policy discussions. Stakeholder engagement has been vital in areas such as watershed development (Leach & Pelkey, 2001), forest planning (Buchy & Hoverman, 2000), fisheries management in Europe (Mikalsen & Jentoft, 2008), sustainable planning of niche crop systems in the Indian Himalayas (Sen & Kansal, 2019) and the development of the CWSI. Additionally, the looming impacts of climate change pose significant threats, especially to cities already facing multiple challenges. In this context, a city’s water stock (Ghosh et al., 2019), particularly its surface water bodies, plays a crucial role in building resilience to climate change-induced disasters.
Against this backdrop, the present study aims to develop a Water Body Sustainability Index (WBSI) to assess the sustainability of inland surface water bodies, particularly in urban areas. This is achieved by identifying relevant indicators through both top-down and bottom-up approaches, assigning weights to these indicators and aggregating them into a composite index. The WBSI is applied to Najafgarh Lake, an urban water body that lies across the Delhi and Gurugram regions of northern India. The study’s primary goal is to provide policymakers with a clear sustainability status of water bodies, identify key areas for intervention and track the impact of their decisions. By continuously monitoring the WBSI, policymakers can assess the resilience of water bodies and refine their strategies for more effective management. While the WBSI is applied to a sub-tropical transboundary water body in India, its methodology can be replicated for water bodies in other regions and countries.
Study Area
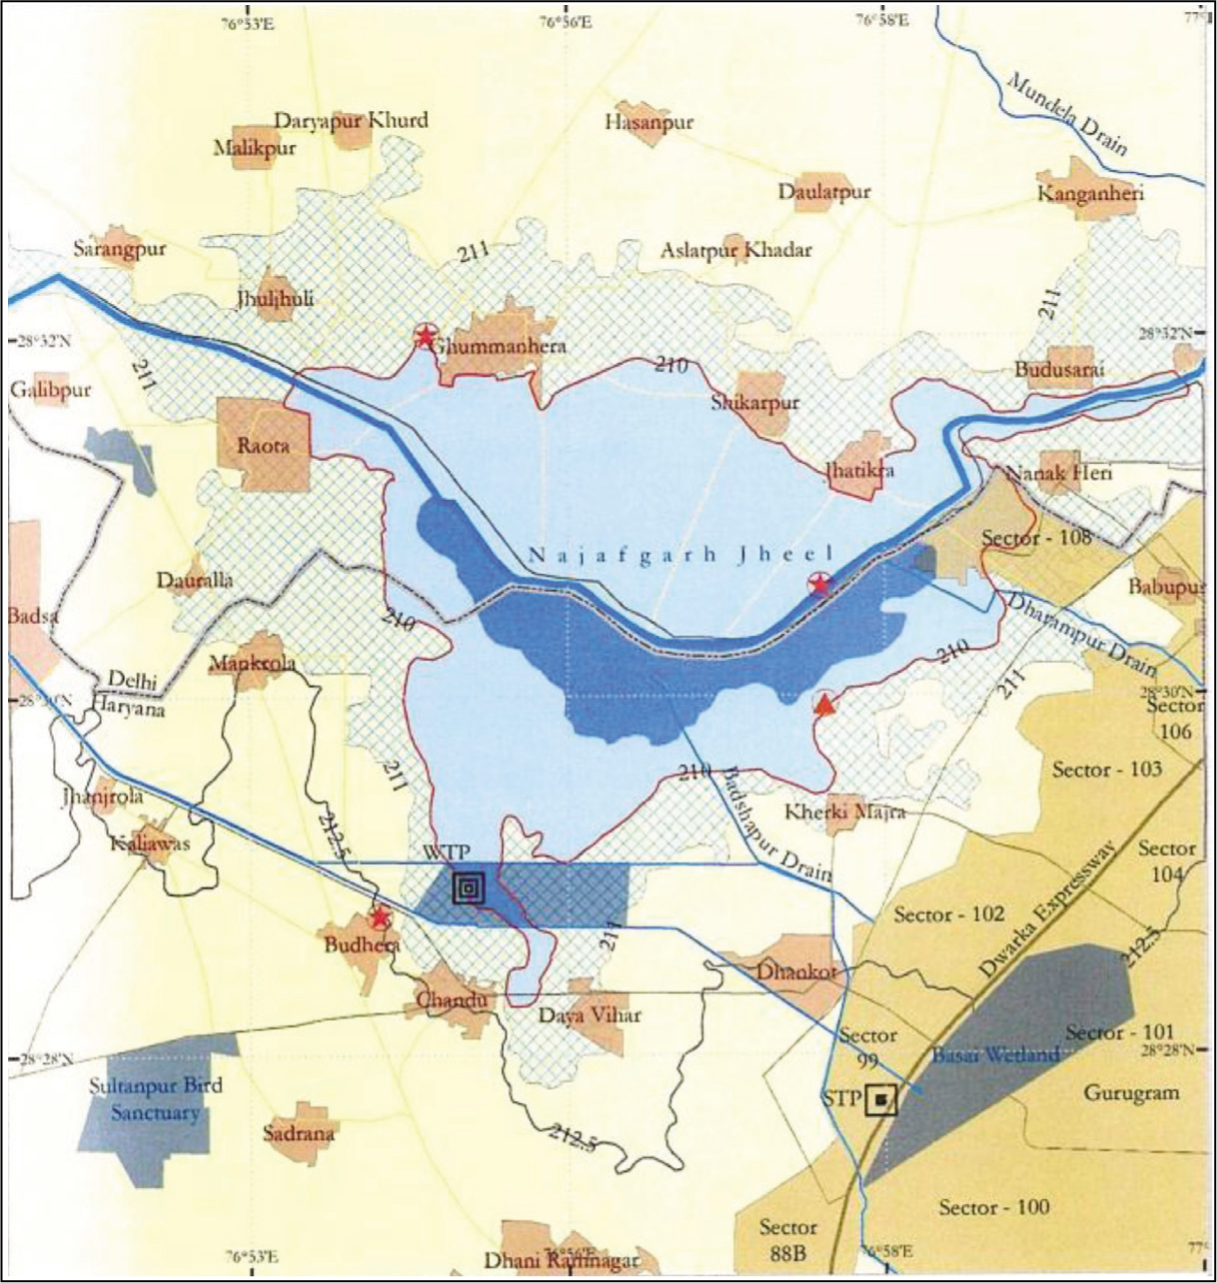
Najafgarh Lake, listed in the National Wetland Atlas (Haryana state) and situated within the Sahibi River basin spanning Delhi and Gurugram in the National Capital Region of India, is a shallow inland water body (Wetland Authority of Delhi, 2020) (Figure 1). Its governance presents a unique challenge as it falls under the jurisdiction of the state governments of Haryana and Delhi and the union government of India and is located in a region where land is highly valued. Originally spanning 226 km2 in the 1880s, the lake has now dwindled to a mere 7 km2 (Rao et al., 2024). Previously sustained by stormwater and river flow from Rajasthan, Haryana and Delhi, the lake’s primary source of nourishment has now shifted to wastewater and industrial effluents from the surrounding catchment area. The Sahibi River, once a significant water source and a tributary of the Yamuna, ceased to contribute after the construction of the Masani barrage in Rewari, Haryana, following floods in 1977. Additionally, an embankment constructed on the Delhi side, post the 1964 floods, divided the lake into northern and southern segments, disrupting natural flood cycles and leading to land-use changes, converting a substantial portion of the lake into agricultural fields and built-up areas. Despite severe degradation, characterized by poor water quality, sedimentation, eutrophication and invasive species, the lake still sustains various bird species alongside a diverse array of butterflies and dragonflies (Wetland Authority of Delhi, 2020).
Surrounded by privately owned farmlands and panchayat lands, the lake falls under Delhi Development Authority’s Zonal Plan L in Delhi for lake environment maintenance, while Gurugram’s master plan designates it as open space. Managed by multiple government agencies across Delhi and Gurugram, it involves various stakeholders like local farmers, real estate developers, residents of housing complexes within its high flood level and environmental activists, each with competing interests. Although the local community’s reliance on the lake has diminished due to its degraded state, they still utilize its water for agricultural purposes. Recognizing the lake’s dire condition, the Indian National Trust for Art and Cultural Heritage (INTACH), a non-governmental organization, petitioned the National Green Tribunal (NGT) in 2014, drawing attention to its impending extinction (execution application no. 16/2019; earlier O. A. no. 153/2014). Consequently, the NGT mandated Haryana and Delhi to prepare Environment Management Plans (EMP) for the lake, followed by implementation. One of the immediate measures outlined in the EMP is to notify the lake as a wetland, offering protection against future encroachments and enabling its management based on wetland-wise-use principles. Tools like the WBSI can prove invaluable to policymakers in assessing the lake’s sustainability and monitoring the impacts of management interventions, facilitating effective management planning and conservation efforts.
Material and Methods
The key steps for the development of WBSI include identifying indicators, assigning relative importance (weights) to the indicators and aggregating them into a composite index.
Indicator Selection and Allocation of Weights
A combination of top-down and bottom-up approaches was employed to identify and assign weights to key indicators. Figure 2 explains the process of indicator selection for this study.
Indicator Selection Process.
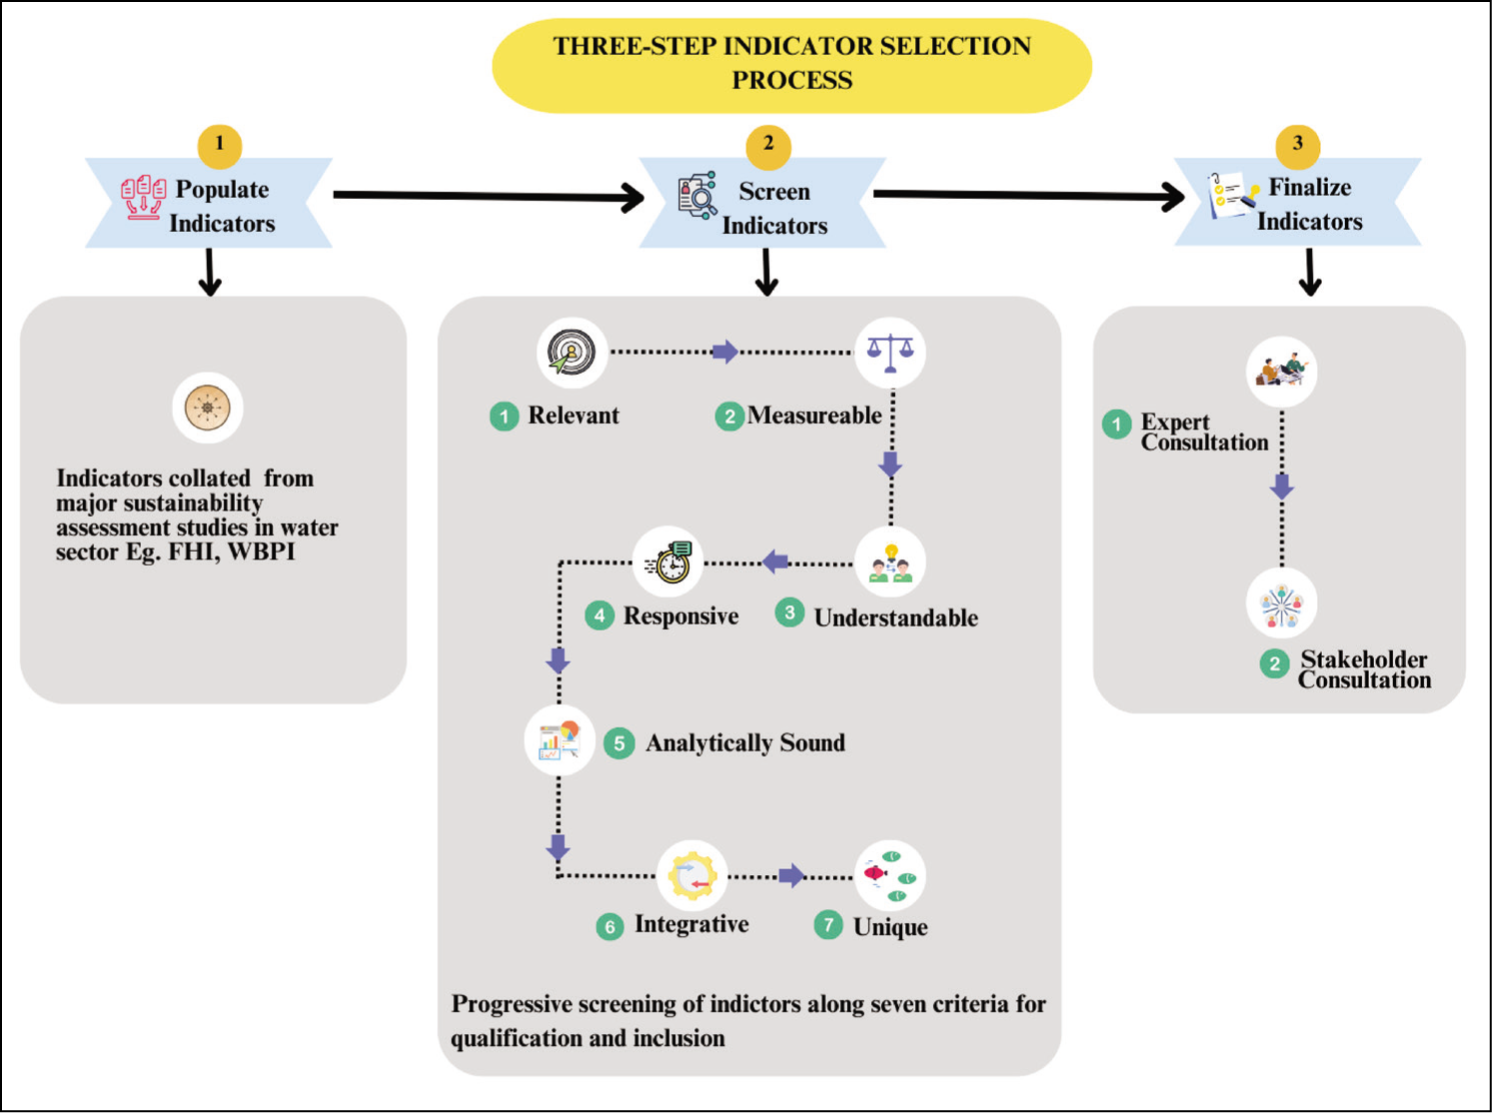
Indicator selection involved a three-step process. In the first step, the study gathered various sustainability indicators cited in the literature on water sustainability assessment frameworks. In the second step, the comprehensive collection of water sustainability indicators gathered in the first step was subjected to a multi-level screening process. This step was crucial because not all indicators are pertinent to the water body under study. The screening was conducted based on criteria such as relevance, measurability, understandability, responsiveness, analytical soundness, integrativeness and uniqueness, with indicators assessed in this specific order (OECD, 2001).
Following the screening process, the final list of indicators was determined through consultation with experts and stakeholders. Experts from various institutions and organizations were invited to evaluate and scrutinize the screened indicators, resulting in a pre-final list. This list was then subjected to detailed consultation with stakeholders, including the local community, within the context of the study region. Stakeholders were asked to assign weights to the indicators based on their relative importance concerning the sustainability of the water body.
Stakeholders (SH) for the water body were categorized as either those with greater influence and a lower stake (SH1) or those with less influence and a higher stake (SH2). Stakeholders (SH1) included individuals influential in regional policies, programme implementation and possessing knowledge related to inland surface water bodies, such as government officials and academics. Stakeholders (SH2) included individuals and groups significantly affected by water body degradation, as well as policies and programmes, such as farmers, villagers, real estate developers and residents of housing societies. Significant indicators based on their likely impact were estimated from the weights assigned to them by the stakeholders in each group (SH1 and SH2) (the weight was 0, 1 or 2: the higher the weight, the greater the significance). The value of weight, which had the highest frequency, was selected for each category of stakeholders for all indicators. The final weight (for calculating WBSI) was determined by summing the weights assigned by both categories of stakeholders. The minimum weight value thus obtained could be 0, and the maximum could be 4. Indicators securing a weight greater than 1 when the weights assigned by both groups were added (SH1 + SH2) were selected for inclusion in the development of WBSI.
Development of Sustainability Matrix for WBSI
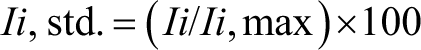
The methodology for developing the WBSI index draws from the approach proposed by Nanda et al. (2019), which aimed to construct an index for assessing vulnerability to phosphorus. Data for each prioritized indicator for Najafgarh Lake were gathered from government reports, departmental records, previous research and stakeholder consultations and organized into a matrix. The methodology involved the following three main steps: normalization of indicators to ensure they are dimensionless, as the data for indicators were expressed in different units; normalization of indicator weights using relative scores with respect to the total weights assigned to indicators; and aggregation of all normalized indicators and their weights. For easy reference, the equations defining these steps are provided below.
Or
For some indicators, lower values of Ii,std. indicate higher sustainability. In order to make such indicators unidirectional, such that higher values indicate greater sustainability, Equation (1b) subtracts the value arrived in Equation (1a) from 100.

Or
Similarly, in some indicators, the ratio in Equation (1a) is inverted and then multiplied by 100 to align them with other indicators, such that a higher value of the adjusted indicator indicates higher sustainability.
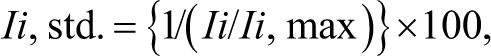
where Ii,std. is the standardized value of the ith indicator, Ii is the observed value of the ith indicator and Ii,max is the maximum threshold value of the ith indicator.
Equation (2)
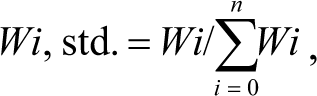
where Wi,std. is the standardized weight of the ith indicator, n is the number of indicators and Wi is the weight assigned to the ith indicator.
Equation (3)

where WBSI is the Water Body Sustainability Index, Ii,std. is the standardized value of the ith indicator, Wi,std. is the standardized weight of the ith indicator and n is the number of indicators.
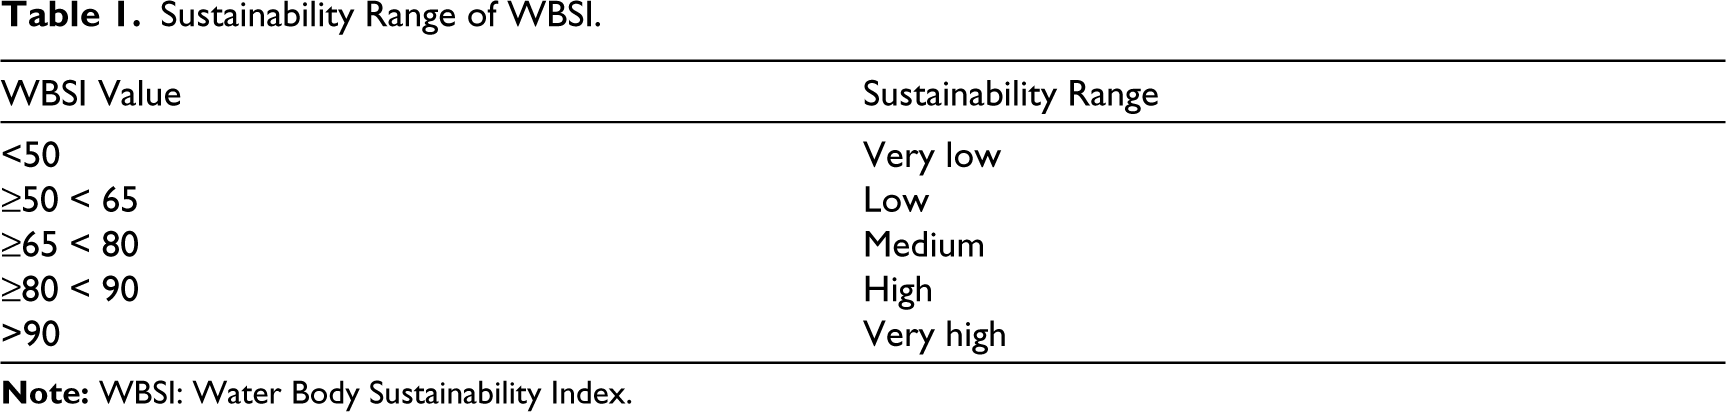
The WBSI has been categorized into different sustainability ranges based on expert opinion, as illustrated in Table 1.
Sustainability Range of WBSI.
Options for Improving the WBSI
After computing the value of WBSI, the analysis was extended to examine government policies, regulations and court orders related to water body sustainability obtained through review of literature and primary interviews in order to understand their positive impact on the indicators. Wherever possible, these positive impacts were quantified, and various options were evaluated based on their measurable effects on the indicators.
Results and Discussion
Indicator Selection and Allocation of Weights
A total of 864 indicators were initially listed from water sustainability studies (step 1). In the second step, the screening process shortlisted 53 indicators for expert and stakeholder evaluation. From these, experts and stakeholders finalized 15 indicators relevant to the water body under study, which were then used for the calculation of the WBSI. Table 2 presents the 15 indicators, along with their respective weights, classified across six sustainability dimensions, which were used to assess the sustainability of Najafgarh Lake.
Indicators for Sustainability Assessment of Najafgarh Lake.

Najafgarh Lake Sustainability Matrix
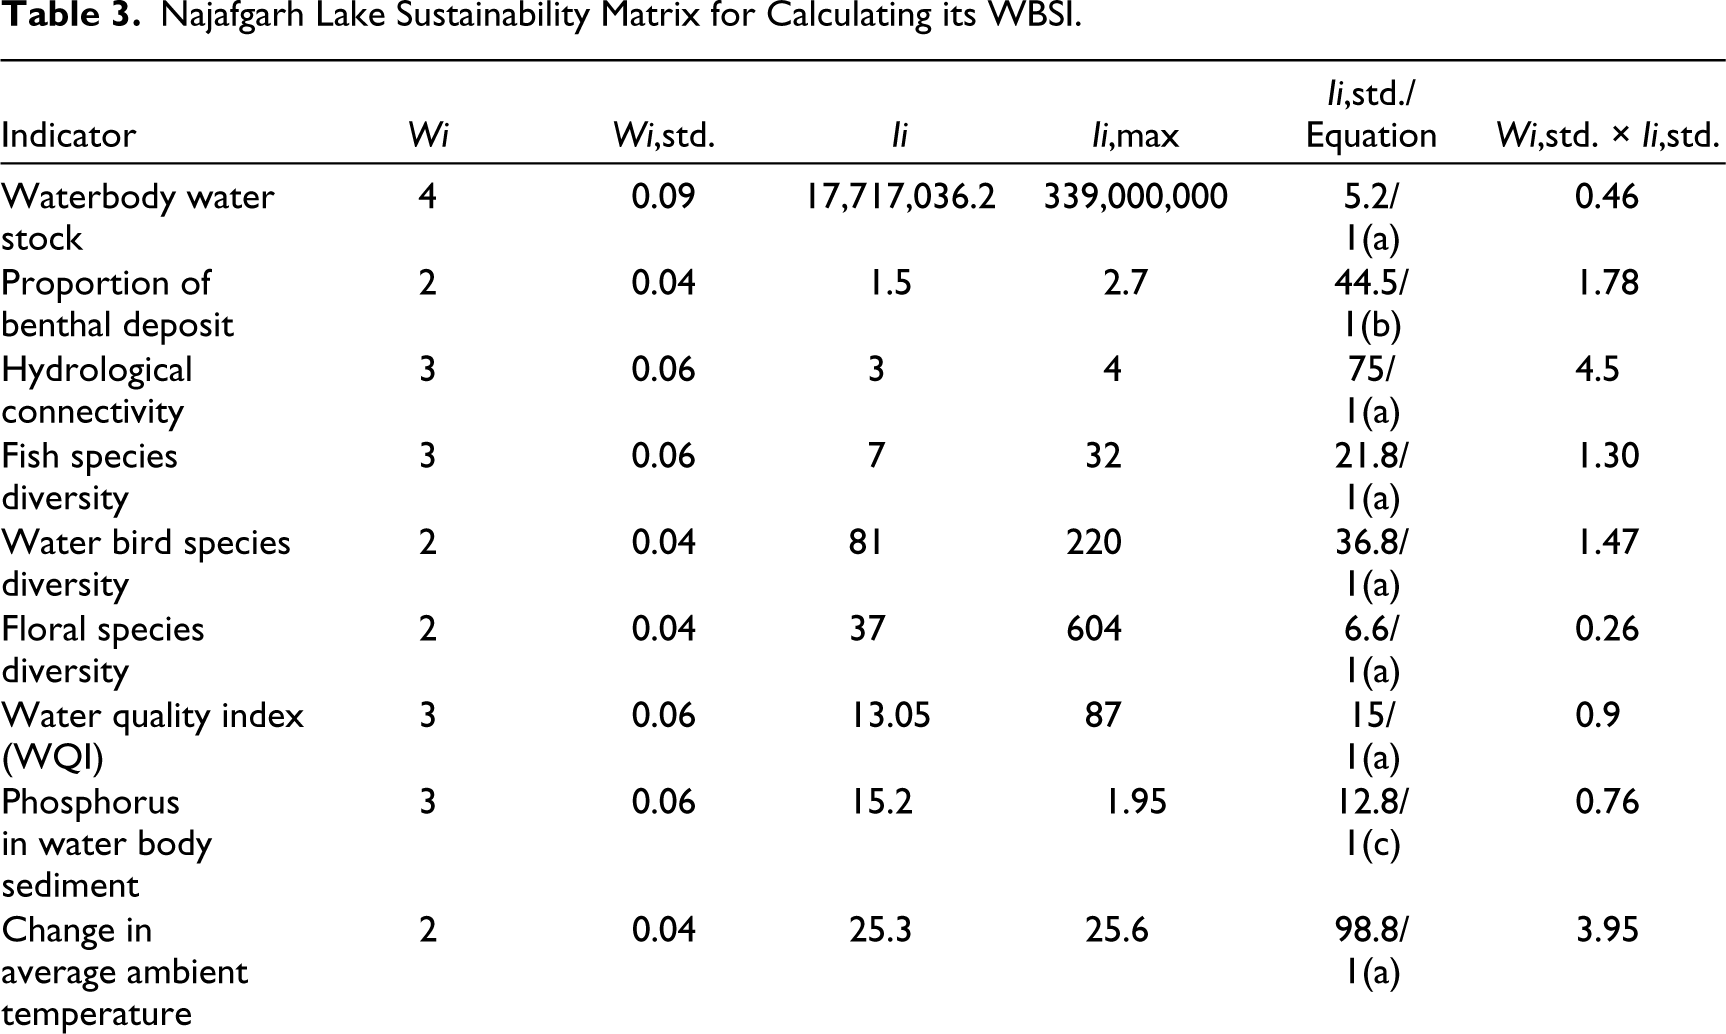
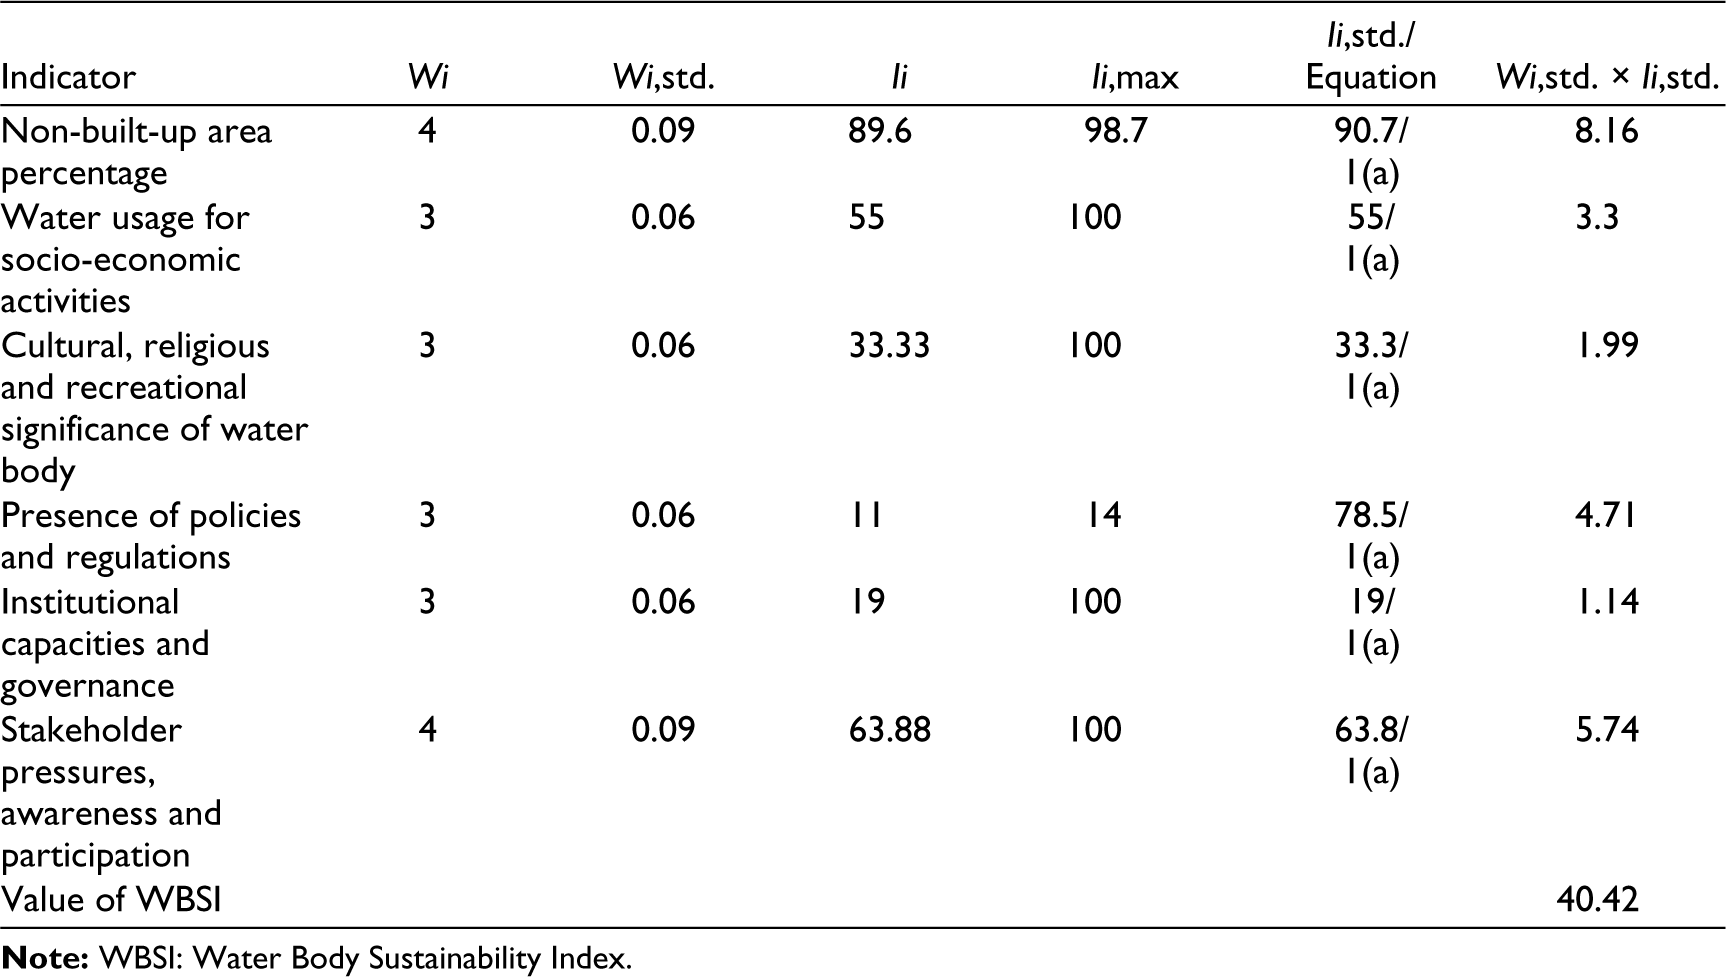
The sustainability matrix presented in Table 3 summarizes the 15 indicators alongside their respective weights, standardized weights, observed values, threshold values, standardized values and aggregate values for Najafgarh Lake. Below is a concise rationale for including all 15 indicators and the process for determining their observed and standardized values.
Waterbody water stock: The water holding capacity of a water body is a key indicator of its sustainability. A higher water volume signifies better sustainability. In India, water stock typically peaks at the end of the monsoon season. This indicator is expressed as a percentage, comparing the volume of water in the water body at the end of a recent monsoon season (September 2020 in this case) to the highest recorded volume. According to Wetland International South Asia (WISA), the volume in September 2020 or Ii was 17,717,036.2 m3 and while the maximum recorded volume, Ii,max, was 339,000,000 m3 in 1883 (Wetland Authority of Delhi, 2020).
Proportion of benthal deposits: Benthic deposits are accumulated sludge at the bottom of water bodies, resulting from soil erosion in watersheds and wastewater inflow. The decomposition of these deposits can degrade water quality by increasing oxygen demand and releasing organics and nutrients into the water. Experts recommend that at least 90% of a water body’s depth should be free from benthic deposits to maintain sustainability. If this threshold is not met, it indicates reduced sustainability. For Najafgarh Lake, the depth of benthic deposits is 1.5 m, while the total depth is 3 m (Babu, 2020; Wetland Authority of Delhi, 2020). The maximum allowable depth (Ii,max) free from benthic deposits is 2.7 m, with the observed depth (Ii) being 1.5 m.
Hydrological connectivity: This indicator evaluates the ability of run-off water to accumulate and contribute to the lake’s water storage. Low hydrological connectivity can reduce water availability, negatively impacting the lake’s sustainability. Historical records indicate four main channels, including the Sahibi River. However, the Sahibi River has since dried up, leaving three active channels to supply water (Delhi Pollution Control Committee [DPCC] status report, NGT order dated 11 July 2022). The maximum number of channels (Ii,max) is 4, based on historical data, while the current observed number of channels (Ii) is 3 (Wetland Authority of Delhi, 2020).
Fish species diversity: Fish communities are key indicators of environmental degradation in water bodies due to their sensitivity to water quality changes (Angermeier & Davideanu, 2004; Karr, 1981). This indicator is calculated as the percentage of current fish species diversity compared to historical diversity. To assess current diversity, primary data were collected by interviewing fishermen of Najafgarh Lake across different seasons. This revealed seven fish species in the lake. The maximum diversity (Ii,max) is set at 32, based on historical records from 1882 (Maconachie, 1882).
Water bird species diversity: The diversity of water bird species is a crucial indicator of the health of wetlands and aquatic ecosystems. Freshwater wetlands provide essential habitats for water birds, supporting activities such as foraging, nesting and moulting. This indicator is calculated as the percentage of water bird diversity in Najafgarh Lake in a given year compared to the diversity in a healthier Ramsar site in the same year. Data from the Asian Waterbird Census recorded 81 species in the lake in 2021 (observed value, Ii). The maximum diversity (Ii,max) is 220 species, based on data for the same year from the Nawabganj Wetland, a healthy Ramsar site (MoEFCC, 2021).
Floral species diversity: Floral biodiversity is essential for ecosystem balance, watershed protection, erosion prevention, climate regulation and habitat provision, making it a key indicator of water body sustainability. This indicator is calculated as the percentage of current floral diversity near the water body compared to the overall regional floral diversity. The current floral species diversity near Najafgarh Lake (Ii) is reported as 40, according to the Haryana EMP for Najafgarh Lake. The maximum diversity (Ii,max) is set at 604 floral species in the Delhi region, as documented in secondary literature (Mishra et al., 2015).
Water quality index (WQI): Water quality is a direct reflection of a water body’s ecological health, indicating pollution levels, types of pollutants and their sources. It is vital for assessing human use suitability and preserving aquatic diversity. The WQI for Najafgarh Lake was calculated using the formula developed by the Canadian Council of Ministers of the Environment (CCME) in 2001. Six water quality parameters—potential of hydrogen, total suspended solids, biochemical oxygen demand, dissolved oxygen, ammoniacal nitrogen and phosphate—were incorporated into this formula. Data from DPCC, which conducts regular water quality tests, indicates that the water quality is poor. The WQI indicator is calculated as the percentage of the water body’s current WQI performance compared to the desired performance. The observed value (Ii) of the WQI for Najafgarh Lake is 13.05, with the desirable performance (Ii,max) set at 87 according to CCME categories.
Phosphorus in water body sediment: Phosphorus concentration in water body sediment is a crucial parameter, with immediate effects that contribute to long-term eutrophication and the proliferation of algae and aquatic plants. Measuring phosphorus in sediment provides valuable data for predicting internal load releases, identifying hotspots for remediation, understanding distribution patterns and guiding effective strategies. This indicator is calculated as the percentage of phosphorus in the water body’s sediment compared to that in a healthy wetland, both measured in parts per million (ppm). The phosphorus concentration in Najafgarh Lake’s sediment is recorded as 15.2 ppm (Sriram Institute for Industrial Research, November 2022). The concentration in the sediment of a healthy wetland (Ii,max) is 1.95 ppm, based on data from Keoladeo National Park, Bharatpur (Kumar et al., 2016).
Change in average ambient temperatures: The temperature and its variability in the catchment area significantly impact the water body. Water temperature is in equilibrium with the ambient temperature through a transfer coefficient, meaning an increase in air temperature leads to a corresponding rise in water temperature. Higher water temperatures exacerbate water pollution issues and negatively affect aquatic habitats. This indicator is determined by calculating the long-term average temperature (1981‒2022), recorded as 25.7 °C, and the short-term average temperature (2013‒2022), which is 25.3 °C, based on meteorological data from NASA POWER. Since the change from the long-term average temperature to the short-term average temperature should not exceed 0.1 °C, the threshold value (Ii,max) is calculated as 25.6 °C (25.7 °C–0.1 °C). Using this approach, the standardized value (Ii,std.) is calculated with the observed value (Ii) being the short-term average temperature of 25.3 °C and Ii,max set at 25.6 °C.
Non-built-up area percentage: The proliferation of impervious surfaces due to urbanization obstructs rainwater infiltration into the soil, increasing surface water run-off into the water body. This elevated run-off can worsen erosion in the watershed, negatively impacting water quality and potentially causing flooding. This indicator is expressed as the percentage of non-built-up areas near the water body in 2020 compared to 1991. According to WISA data, the built-up area around Najafgarh Lake increased from 1.3% in 1991 to 10.4% in 2020. The observed value (Ii) is calculated as 89.6%, while the maximum value (Ii,max) is 98.7%, representing the unpaved area around the water body in 1991.
Water usage for socio-economic activities: When a water body contributes to social and economic welfare, it becomes an integral part of socio-economic infrastructure, often leading to public and industrial involvement in its conservation. Water services can be categorized into social and economic dimensions, with domestic water use (for human and cattle consumption) falling under the social dimension and industrial use being an economic dimension. Agriculture relies on both dimensions. This indicator combines these uses, quantified as the average percentage of current water usage for socio-economic activities compared to the desired usage. Based on primary interviews with stakeholders such as villagers, farmers and local politicians, the current average water usage (Ii) is calculated at 55, while the desirable value (Ii,max) is set at 100.
Cultural, religious and recreational significance: This indicator reflects the cultural, religious and recreational values associated with a water body, encompassing customs, religious ceremonies and activities such as bird watching, boating and water sports. These aspects are aggregated into a single indicator, representing the average percentage of the presence of these three activities in relation to their desired presence. Based on stakeholder interviews, the current presence (Ii) is calculated at 33, as only informal bird watching occurs, and the water body has no religious significance or associated customs. The desired presence (Ii,max) is set at 100.
Presence of policies and regulations: This indicator evaluates the presence of policies and regulations concerning biodiversity, environment and water bodies. It is quantified as the percentage of indicators in this study (excluding this indicator) that are covered by relevant policies and regulations to the total number of indicators in the study (excluding this indicator). An examination of current policies and regulations shows that indicators like hydrological connectivity, fluctuations in the average ambient temperature around water bodies and the cultural, religious and recreational importance of these water bodies are not explicitly addressed. Therefore, 11 out of the 14 indicators are covered by existing policies and regulations. Ii,max is determined as 14.
Institutional capacities and governance: Institutional capacities encompass a range of formal organizational structures, rules and informal norms for service provision, while governance involves the implementation of policies and legislation. This indicator comprises four sub-indicators. The first sub-indicator evaluates the presence of a system for managing water body-related grievances, including feedback, complaints and infringement notices. The second sub-indicator assesses the monitoring of the water body, encompassing hydrological assessment, bathymetric survey, water quality and sediment analysis, biodiversity assessment and catchment characteristics assessment. The third sub-indicator assesses whether a single public agency oversees water body management, as opposed to multiple government agencies, which can lead to unaccountability and inefficiencies. Finally, the fourth sub-indicator measures the presence of local governance, monitoring and sanctioning processes for water body management. This indicator is quantified as the average percentage performance of the four sub-indicators compared to their desirable percentage performance. Based on primary interviews with stakeholders and secondary literature data, the average performance of the four sub-indicators or Ii is calculated as 19. Ii,max, representing the desirable performance of the four sub-indicators, is set at 100.
Stakeholders’ pressures, awareness and participation: This indicator comprises three sub-indicators. The first sub-indicator assesses the anthropogenic pressures on the water body, which can diminish its sustainability. The second sub-indicator evaluates stakeholders’ access to water body-related information through various channels such as government or civil society-organized workshops, reports, publications, court cases, voluntary schemes and walks. The third sub-indicator measures the extent of stakeholders’ involvement in the policy, planning and decision-making processes, including their representation on water body boards and committees, stakeholder training programmes and participation in water user associations. This indicator is quantified as the average percentage of the performance of the three sub-indicators compared to the desirable percentage performance. The average performance of the three sub-indicators (Ii) is calculated as 63.88 based on secondary literature data and primary stakeholders’ interviews. Ii,max, representing the desirable performance of the three sub-indicators, is set at 100.
The WBSI value for Najafgarh Lake, calculated in Table 3 using Equation (3), is 40.42, placing it within the very low sustainability range. This low WBSI can be attributed to several factors, including the drainage of the lake by the British to create arable land, the construction of an embankment on the Delhi side after the 1964 floods and the building of the Masani barrage on the Sahibi River after the 1977 floods in Rewari. These actions reduced the lake’s area and disrupted its hydrological connectivity (INTACH, 2018).
Najafgarh Lake Sustainability Matrix for Calculating its WBSI.
Currently, the lake no longer receives water from the Sahibi River. Instead, it relies on overflow from Outfall Drain No. 8, sewage from Gurugram, industrial effluents from Manesar and sheet flow from nearby villages (Wetland Authority of Delhi, 2020). The increased wastewater generation in the catchment area, especially after Gurugram’s development in the early 1990s, and its diversion into stormwater drains like Badshahpur and Dharampur, which feed into the water body, has contaminated the lake’s surface and groundwater. Additionally, run-off from nearby agricultural lands, treated with chemical fertilizers, has worsened the pollution. As a result, the water quality has deteriorated, with increased benthic deposits and high phosphorus levels in the sediment, causing sedimentation, eutrophication and the proliferation of invasive species. This has negatively affected water birds, fish and floral diversity.
The lake’s ability to deliver ecosystem services has been diminished, and general neglect has reduced its use by the community for cultural, religious and recreational activities. Stakeholders highlight challenges such as the non-implementation of policies, lack of water body governance, governmental accountability issues, development-driven planning, the real estate-government nexus and the destruction of community-led governance as significant obstacles to effective governance (Rao et al., 2024).
Although the built-up area around the lake has not expanded dramatically in the last three decades, the Haryana government’s two-year action plan poses risks. This plan includes constructing an embankment, redirecting treated wastewater and connecting the Badshahpur and Dharampur drains to the Sahibi River course (Najafgarh drain) in Delhi (MoEFCC, 2022), which will drastically impact the lake’s size. The construction of linear infrastructure, like the Dwarka Expressway, has further increased pressure from real estate development. Although meteorological data show no significant increase in ambient temperatures, climate change-induced temperature variations could threaten the lake’s sustainability in the future.
While hydrological connectivity is maintained for three out of four water channels, water quality in these channels is very poor, negatively affecting the water body’s sustainability. The loss of the Sahibi River, once the primary water source, is a key factor. While policies and regulations exist for most WBSI indicators, the main challenge lies in their implementation. Addressing stakeholder-induced pressures such as water extraction, land reclamation for agriculture and real estate, wastewater discharge, overfishing and the presence of hydraulic and linear structures is crucial. Additionally, capacity-building programmes should be strengthened to enhance stakeholders’ access to information and their participation in water body-related decision-making.
Options for Improving WBSI
Stakeholder-driven judicial intervention and activism have heightened awareness regarding Najafgarh Lake and its former water source, the Sahibi River. This increased awareness has led to significant advancements, including legal actions to reduce pollution in the Yamuna River and rejuvenate the Sahibi River (original application no. 6 of 2012; original application no. 627/2022). The ‘Mailey se Nirmal (“from polluted to clean”) Yamuna Revitalization Plan, 2017’, approved by the NGT, encompasses a wide range of activities to revitalize the lake. Implementing its measures, such as wastewater treatment and addressing points of untreated wastewater discharge into drains, is anticipated to positively impact several indicators, notably the WQI. Additionally, regulations such as the Wetlands (Conservation and Management) Rules, 2017, and INTACH’s NGT petition support the designation of the water body as a wetland and initiate its restoration. Finally, government reports have recommended dredging the lake, which can positively impact several indicators. While the quantifiable impact of these advancements on certain indicators is evident, others remain elusive at present, highlighting the need for further efforts to generate measurable data. Table 4 lists several key interventions that positively impact the WBSI, with their effects on indicators quantified alongside improvements in the WBSI score.
Key Interventions Positively Impacting WBSI Score.
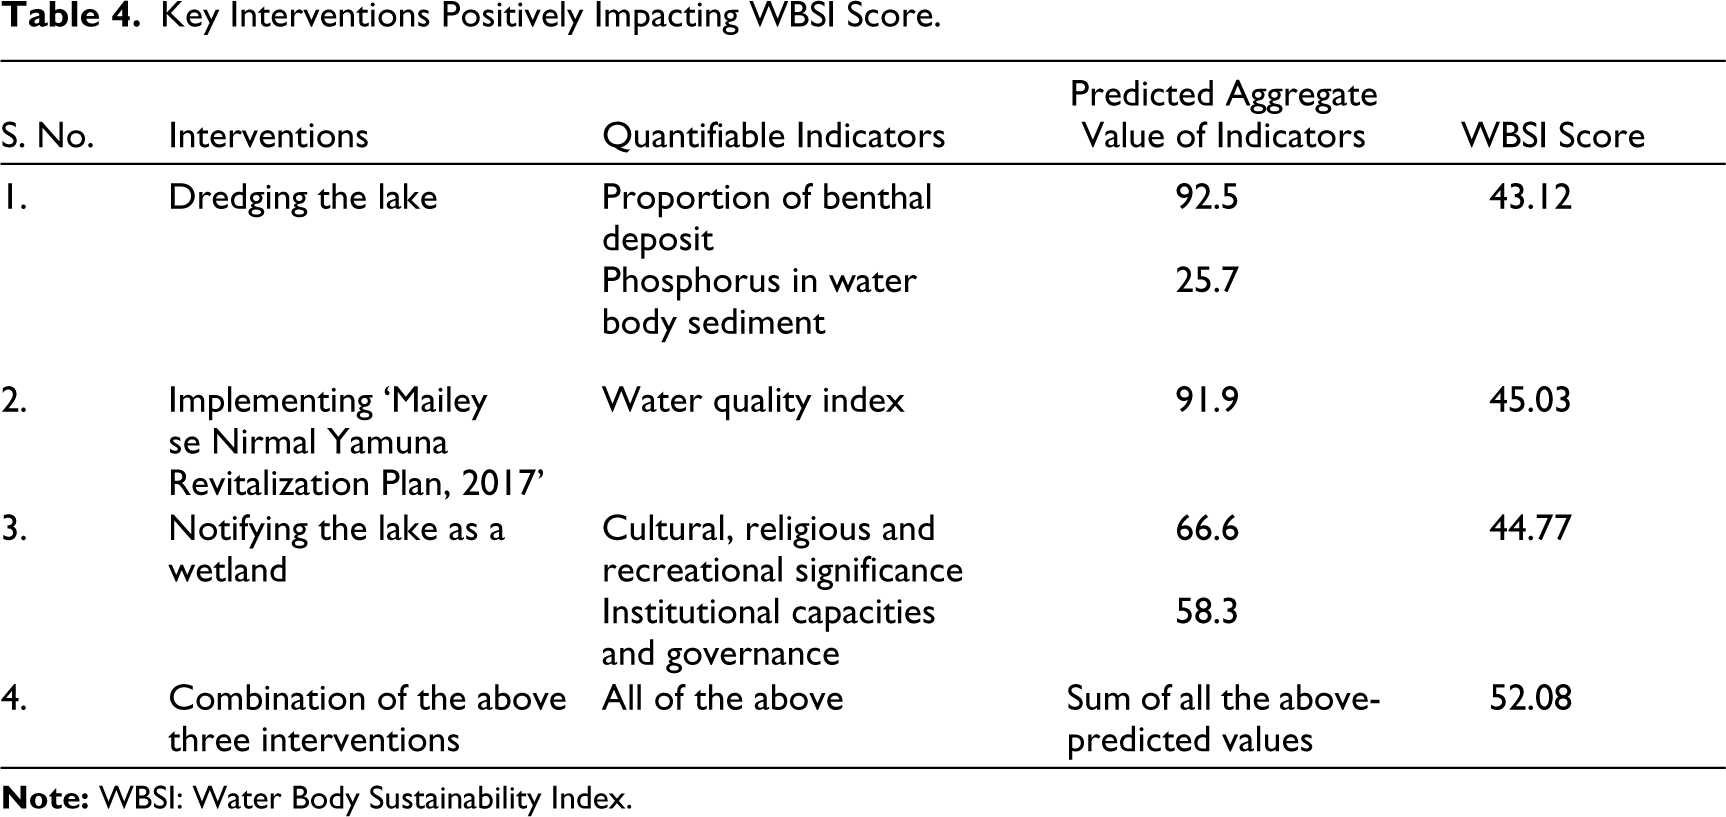
As illustrated in Table 4, each of the three interventions discussed above individually improves the WBSI score. Dredging the lake, whose impact can be quantified for two indicators, namely the proportion of benthic deposit and phosphorus in water body sediment, improves the WBSI to 43.12. Implementing the ‘Maily se Nirmal Yamuna Revitalization Plan, 2017’, having a quantifiable impact on WQI, increases the WBSI score to 45.03, and notifying the lake as a wetland increases its score to 44.77. When all three interventions are combined, the WBSI can attain a score of 52.08, reflecting an improvement from the previous 40.42. This places the WBSI value within the low sustainability range, marking an advance from the very low sustainability range recorded earlier.
Conclusion
The global degradation of freshwater sources alongside the sustainable development discourse in the early 1990s led to efforts for sustainability assessment in the water sector. Protecting and managing freshwater resources, such as inland surface water bodies, is vital for water security. A comprehensive framework for assessing the sustainability of water bodies is a crucial initial step in their conservation and management.
This study developed a WBSI to measure sustainability of inland surface water bodies, using relevant indicators within a composite index framework. The WBSI, which ranges from 0 (very low sustainability) to 100 (very high sustainability), was applied to Najafgarh Lake in northern India to evaluate its sustainability status. The indicator selection involved thorough screening and consultations with experts and stakeholders, leading to 15 prioritized indicators. Data for these indicators was collected for Najafgarh Lake and organized into a sustainability matrix to estimate the WBSI. Initially, the WBSI for the lake was 40.42, indicating very low sustainability. Upon recalculating the WBSI to account for the quantifiable positive impact expected from the implementation of court orders and existing regulations on five indicators, the value increased to 52.08. Further improvements are expected as more data becomes available to quantify the positive impact on the remaining indicators.
The development of the WBSI can empower policymakers to assess the sustainability of water bodies and prioritize interventions for improvement. However, WBSI’s effectiveness depends on high-quality data and ongoing research, which will allow for the inclusion of additional indicators that were previously omitted due to data limitations. Informed by WBSI findings, policymakers can devise strategies and formulate new policies and regulations to address areas needing improvement. Nonetheless, it is crucial for policymakers to recognize that enhancing the sustainability of water bodies also demands strict implementation of existing policies, regulations and judicial orders, along with active stakeholder engagement in decision-making processes.
Footnotes
Declaration of Conflicting Interests
The authors declared no potential conflicts of interest with respect to the research, authorship and/or publication of this article.
Funding
The authors received no financial support for the research, authorship and/or publication of this article.