






Abstract
This article attempts to take up the issue of access to modern technologies and their impact on the welfare of farmer households in the context of India. An attempt has also been made to analyze this issue for different regions of India to provide a comparative picture, which assumes its relevance for holistic policy formulation. The impact of the access of modern agricultural technologies on farmer household welfare is measured by per capita consumption expenditure in rural India. To realize this objective, we utilize farm household unit-level data collected in 2003 (59th Round) by the National Sample Survey Organisation (NSSO). Descriptive analysis suggests that nearly 59 per cent of the farmer households had not accessed any source of information on modern technology. The outcome variables in terms of per capita consumption (income) expenditure show better performance for those who adopt modern agricultural technology. The logistic regression analysis reveals that controlling for other household characteristics, the access to modern technology has a significant positive impact on consumption expenditure in rural India. From a policy point of view, there is a need to take institutional measures that help small and marginal farmers to increase their earnings through better access to modern farm technology.
Keywords
Introduction
One of the challenging problems before the planners and policy makers in the past two decades has been the relatively slow growth of agriculture (about 1.5 to 2.0 per cent per annum) when the overall economy has been recording rapid growth (about 6.0 to 8.0 per cent) in India. Notwithstanding the declining trend in agriculture’s share in the gross domestic product, agriculture has been a way of life and continues to be the single most important livelihood of the majority of the masses of the country. 1 This is true for most of the states (provinces) in India as well. There are many explanations for this slowing down of growth in agricultural sector. A number of constraints have been identified including the slowdown of public investment in agriculture, lack of technological development, low levels of input use (including the use of water) and increasing volatility and instability of prices in the post-World Trade Organization (WTO) period (see, among others, Balakrishnan et al. 2008; Bhalla and Singh 2009; Chand et al. 2007; Landes and Gulati 2004; Mathur et al. 2006; Rao 2005; Vaidyanathan 2010). The Union and the provincial governments are currently engaged in the formulation of policies and strategies for mitigating such constraints and for realizing accelerated agricultural growth.
Despite massive investments and much vaunted technological progress, growth in agricultural sector has remained more or less stagnant since 1991. In this regard, both the Union and the state governments in India have implemented a number of schemes (such as, the Mahatma Gandhi National Rural Employment Guarantee Act, 2 the Swaranjayanti Gram Swarozgar Yojana, 3 subsidies to agricultural sector and so on) in the areas of rural development to generate employment, reduce poverty and economic inequality and to improve the quality of life of the farmer households. Dev (2004) argued that to make rural development more broad-based and balanced, investment, technology, appropriate institutions and employment schemes are needed. It is also argued that a lasting solution to the problems of rural poverty and unemployment lies in hastening the shift of labour out of agriculture; by concentrating all efforts to step up the growth of non-agricultural sector to much higher levels; through larger public sector outlays on agricultural and rural development schemes combined with a larger revamped employment guarantee programme (Vaidyanathan 2010).
The focus on the welfare of farmer households is motivated by the fact that an overwhelming majority of the farmer households in the country have small and marginal holdings which raises doubt about the adoption of modern technology (both mechanical and bio-chemical technology) in most parts of the country without which it is difficult to raise agricultural productivity in the near future. It is expected that future agricultural growth would largely accrue from improvements in productivity of diversified farming systems with regional specialization and sustainable management of natural resources, especially land and water. Before elaborating on the issue undertaken for analysis in this article, let us summarize the main findings of the studies carried out with respect to technological issues in agriculture.
One set of studies argued that in spite of technological progress in agriculture, there is a widespread concern that the economic conditions of the rural population have not improved adequately. A major constraint is the lack of infrastructure facilities in the rural areas—transportation system, rural electrification and telecommunications, marketing facilities and insufficient credit support. These factors if attended would also contribute to growth in rural incomes, particularly through favourable input–output prices for farmers, development of rural non-farm activities, promoting agricultural growth linkages and generating employment opportunities for the low-income households, thereby contributing to poverty alleviation (Hazell and Haggblade 1989; Mellor 1976). However, an empirical study by de Janvery and Sadoulet (2002) found that agricultural technology had a reducing impact on poverty—both directly and indirectly. Their results show that the dominant effect of technology on poverty is through direct effects in Africa, indirect agricultural employment effects in Asia, and linkage effects through the rest of the economy in Latin America. In addition, results show that the targeting of technological change across crops and types of households can make a large difference on the effectiveness of technology in reducing poverty.
Other set of studies highlighted the role of policy and institutional factors in determining technology adoption in the light of Green Revolution. The studies found that technology adoption decisions are conditional on the farmers’ perceptions of the performance of a new technology relative to that of the technology currently being practiced. For instance, farmers may assess a new technology such as an improved variety of bio-chemical technology. If farmers perceive an improved variety to be inferior to traditional varieties in terms of one or more attributes, they are unlikely to adopt such a variety. The role of the adoption of agricultural technologies to mitigate the impact of climate change is also well highlighted. This adaption and mitigation potential in nowhere more pronounced than in developing countries where agricultural productivity remains low; poverty, vulnerability and food insecurity remain high; and the direct effects of climate change are expected to be especially harsh (see, among others, Adesina and Zinnah 1993; Feder et al. 1985; Lybbert and Sumner 2012; Traxler and Byerlee 1993).
In what follows, the findings of the studies conducted in Indian context are reviewed. First, small farmers continue to devote more labour per hectare of individual crops and the inverse relation between labour use and farm size persists. There are, however, tendencies for this relationship to disappear with the spread of the new technology. The proportion of hired labour in total labour tends to increase and that of family labour declines with the advent of the new technology. Second, the employment effects of alternative technologies and techniques in terms of unit of output are the most unequivocal: any innovation, whether biochemical or mechanical, reduces labour input per unit of output. The most drastic reduction is for mechanical innovation. Increases in agricultural output, however, do lead to higher labour input per hectare. A significant section of small and marginal farmers and landless labourers would need to be serviced by the public extension system. However, public extension system will need to be redefined with focus on knowledge-based technologies to upgrade and improve the skills of the farmers. Finally, the literature also highlighted the need to narrow down the gaps between needs and technology and creating the right conditions for large-scale diffusion of such technologies through research and development (vide, Basant 1987; Chandrasekhar and Basvarajappa 2001; Sharma 2002; among others). A study done at micro-location, a rain-fed rice village in Orissa, also highlighted the importance farmers attach to quality characteristics. Even in cases where physical environment is suitable for improved varieties, adoption may have been limited due to a range of socio-economic constraints (Kshirsagar et al. 2002).
However, we were unable to trace any empirical study which had taken up the issue of technology adoption and its impact on the welfare of farmer households in the context of India. Note that we were able to find out only one study in the context of Tanzania and Ethiopia that studied the impact of modern agricultural technologies on smallholder welfare (see Asfaw et al. 2012). To be more specific, the available studies did not look into the problems of farmer households in terms of, how their actions and access to various modern technologies result in their well-being (or ill-being).
With this background, the article attempts to provide rigorous empirical evidence on the role of adoption of modern agricultural technologies on farmer household’s welfare outcomes measured by per capita consumption expenditure in the rural regions of India. It is, however, important to note that this paper looks exclusively at the partial equilibrium effects of the technology on producer welfare. The evidence from the Green Revolution and basic intuition of given price inelastic demand for basic food items suggest that the main welfare gains from agricultural technology improvements might accrue to consumers, not producers. It might also be the case that the biggest beneficiaries of agricultural technology change are farm workers who are net crop buyers, thereby enjoying both the consumer surplus benefits of lower prices and employment benefits associated with induced expansion of farmers demand for hired labour (Asfaw et al. 2012). Although answering these questions is important to provide a more comprehensive assessment of the true welfare impact of the new modern agricultural technologies, the data to evaluate such effects are lacking and they are beyond the scope of this article. The specific questions analyzed in this article are: first, will access to technology lead to higher productivity thereby higher welfare across all farms, all regions, not just large farmers and well-endowed regions? Second, who will be the winners and losers from the technology—and how will it affect the majority of small and marginal farmers, the poor and deprived ones.
The rest of the article is organized as follows. The data sources, methodology adopted and conceptual framework are discussed in the next section. The third section interprets and discusses the findings of the study. Finally, the main findings are summarized and suggested possible policy options are outlined in the fourth section.
Conceptual Framework, Data and Methodology
This section is further divided into three sub-sections: the first sub-section explains the conceptual framework used in the article; the second sub-section deals with data sources; and, details of the methodology adopted in this article are elaborated in the third sub-section.
Conceptual Framework
Rural household resource allocation decisions are fundamentally constrained by conditions of livelihood asset endowments (such as, natural, physical, human, financial and social capital) and related socio-political and institutional factors, based on which they maximize their well-being. In other words, decisions of the farmer in a given point of time are assumed to be derived from the maximization of expected utility (or expected profit) subject to land availability, credit and other constraints. Moreover, change in technology used through new innovations and their dissemination through different mechanisms affect the farmer’s perception, expectations and preferences towards different varieties and inputs used in production. Expectedly, this would affect their consumption. Alternatively, adoption may not only affect individual crops, but it may also induce changes in cropping patterns and allocation of farmers own resources to different use. These changes may also contribute to expenditure changes. Therefore, household decisions and choice to adopt (or to not adopt) modern technology will decide the expected outcomes which will finally affect their consumption/income expenditure (welfare outcomes). As per de Janvery et al. (2010, cited in Asfaw et al. 2010), households adopt a given technology if and only if adoption is actually a choice that can be taken and at the same time adoption is expected to be profitable when viewed through the lens of optimization.
The past research shows that improving the productivity, profitability and sustainability of the smallholder farming is the main pathway to enhance the welfare of those associated with farming. This assumes more importance in the context of India where an overwhelming majority of the farmers have small and marginal holdings. Nowadays, it is argued among researchers, policy-makers, academicians and agricultural scientists that achieving agricultural productivity will not be possible without developing and disseminating yield-increasing technologies especially in the context of globalization and increasing population, given the limited supply of agricultural land (Bhalla and Singh 2009; Rao 2005; Vaidyanathan 2010 among others). Agricultural research and technological improvements are therefore crucial to increasing agricultural productivity and thereby increasing welfare. Increasingly, technology will drive future sources of growth in Indian agriculture. In order to push the frontiers of productivity, generation and harnessing the untapped resources of the country, agricultural technology becomes important.
Data Sources
To realize the above-stated objective, we utilize the Situational Assessment Survey of Farmers’ unit-level data collected in 2003 (59th Round) by National Sample Survey Organisation (NSSO) of India. It is worthwhile to mention that the Situational Assessment Survey of Farmers’ is the first and the latest round of NSSO which provides the information related to particular characteristics of farmer households such as pattern of technology used in agriculture, their perceptions about farming, level of awareness about agricultural institutions like the WTO, Minimum Support Price (MSP), etc. This round gives approximately eleven–year-old information; however, it is the only source that provides rich information especially on agricultural technology usage. Moreover, major technological breakthrough in Indian agriculture has been experienced till late 1990s, therefore there may not be a great change happened during last decade. Thus, one can exploit this information to cull out the crux of the process of technological dissemination.
To keep in mind the availability of data, our limited aim is to understand how different sources of information induce differences in the access to modern technology across regions/states of the country thereby leading to an increase (or decrease) in agricultural productivity, which further increases (or decreases) the welfare of various categories of farmer households.
Methodology
The changes in the adoption 4 of modern agricultural technologies by the farmer households across regions, size of landholdings and country as a whole were analyzed by the descriptive summary of the selected variables. In particular, summary statistics and statistical significance tests on equality of means for continuous variables and equality of proportions for binary variables for adopters and non-adopters were worked out. Some of these characteristics are the predictors of the estimated model used in this article. We employed the logit model to test the following hypothesis: technological adoption enhances per capita level of consumption among farmer households. Before getting into the details of the model employed in the article, it is useful to consider the results of empirical investigations of the adoption of agricultural innovations, which can lead to a better understanding of the interdependence among adoption decisions and thus help in determining the appropriate specification of the model.
In most studies, adoption variables are categorized simply as ‘adoption’ or ‘non-adoption’. However, with respect to the adoption of new types of fertilizers, a farmer may be applying a small amount or a large amount per hectare. Some studies have also used correlation analysis to examine the interrelationships of several factors affecting adoption. However, the simple correlations between some variables may be greatly influenced by other variables so that each correlation may include the spurious effects of the other variables. In those studies which have attempted to determine econometrically the quantitative importance of various explanatory variables, ordinary regression methods have been in most common use. However, normality of disturbances is obviously inappropriate for such regressions; and thus the estimated standard errors and t-ratios produced by an OLS regression are not appropriate for investigating hypotheses about the role and importance of various factors in the adoption process. The detailed discussion regarding the usage of various theoretical and empirical models is available in Feder et al. (1985). Turning to the econometric literature, one finds that appropriate estimation methodology has been developed for investigation of the effects of explanatory variables on dichotomous dependent variables (see, for example, Amemiya 1973). The most commonly used qualitative response models are the logit model, which corresponds to a logistic distribution function, and the probit model, which assumes an underlying normal distribution. These models specify a functional relation between the probability of adoption and various explanatory variables.
After getting insights from the literature, we have employed logit model to test the above-stated hypothesis. It should be worthwhile to mention that to run a logistic regression, basic idea and literature have been borrowed from Field (2006), Green (2009) and Train (2002). The details of logistic regression are as follows.
Logistic regression analyzes binomially distributed data of the form
where the numbers of Bernoulli trials ni are known and the probabilities of success pi are unknown.
The model proposes for each trial i there is a set of explanatory variables that might inform the final probability. These explanatory variables can be thought of as being in a k-dimensional vector Xi and the model then takes the form

The logits, natural logs of the odds, of the unknown binomial probabilities are modelled as a linear function of the Xi.

Note that a particular element of Xi can be set to 1 for all i to yield an intercept in the model. The unknown parameters βj are usually estimated by maximum likelihood using a method common to all generalized linear models.
The interpretation of the βj parameter estimates is as the additive effect on the log of the odds for a unit change in the jth explanatory variable. In the case of a dichotomous explanatory variable, for instance cultivator and non-cultivators, eβ is the estimate of the odds of having the outcome.
The model has an equivalent formulation

This functional form is commonly called a single-layer perceptron or single-layer artificial neural network. A single-layer neural network computes a continuous output instead of a step function. The derivative of pi with respect to X = x1…xk is computed from the general form:

where f(X) is an analytic function in X.
With this choice, the single-layer neural network is identical to the logistic regression model. The variables description, their expected signs and the estimates of logit model are discussed in the third section.
Results and Discussion
Summary statistics and statistical significance tests on equality of means for continuous variables and equality of proportions for binary variables for adopters and non-adopters are presented in Table 1. For all India, the data set contains 89,317,448 farm households and, of these, about 41 per cent are adopters, the average age of the household head is about 47 years and about 6 per cent are female-headed. Adopter categories do seem to be significantly different in terms of all the indicators as compared to non-adopters: that is, adopters have higher percentages (or proportions) in terms of all the selected indicators than non-adopters. The significance has been confirmed by t-statistics (or chi-square statistic) at 1 per cent for all the variables. This suggests that all these selected variables might be correlated with decision to adopt. For instance, the average size of the household is six for adopters and five for non-adopters and the difference is statistically significant supporting the importance of family labour for adoption of new technologies.
Descriptive Summary of Selected Indicators for India during 2003–2004

Descriptive Summary of Selected Indicators for India during 2003–2004
It is also seen from Table 1 that crop income for adopters is almost 10 per cent more than that of non-adopter category. Per capita total consumption is 22.50 per cent higher for adopters; moreover, per capita education and health expenditure is around 22 per cent and 31 per cent higher. The simple comparison of these two groups of farmers suggests that adopters and non-adopters differ significantly in welfare proxy of consumption expenditure (or income) per capita. These results also indicate the accumulation of more human capital among technology adopter households: as indicated by higher average expenditure in favour of adopters.
The result also depicts that adopter categories have more productive assets, on an average, than that of the non-adopter households. This finding indicates the ease of access to take up any modern agricultural technology among the adopters. Another important factor which may induce households to adopt new technology is the access to credit. We took outstanding debt as a proxy variable to capture household’s access to credit and found that the debts outstanding of adopters are significantly higher as compared to the debt outstanding of non-adopters. This finding confirms the hypothesis that adopters tend to take more credit to adopt modern technology in their field. This can also be related with the level of household assets: better level of assets help a household to get better access to credit.
Formal training in agriculture becomes very important when question of the use of modern technology arises. As a whole the percentage of farmers who obtained formal farming training is very low. However, in the case of adopters this percentage is still higher: that is, 3 per cent for adopters and less than one per cent for non-adopters (see Table 1).
It should also be highlighted that around 64 per cent of the farmers who have adopted modern technology like farming as a profession against non-adopter (around 57 per cent). Finally, awareness about various institutions is a very important tool to operate farming on modern basis. These variables help farming community to take up their production as well as marketing decisions. The results depict that adopters are significantly more aware about the MSP, WTO and bio-fertilizers as compared to the non-adopters. Moreover, the higher percentages of the adopters are aware to minimize crop risk in relation to non-adopters.
Descriptive Summary of Selected Indicators for India across Different Zones during 2003–2004
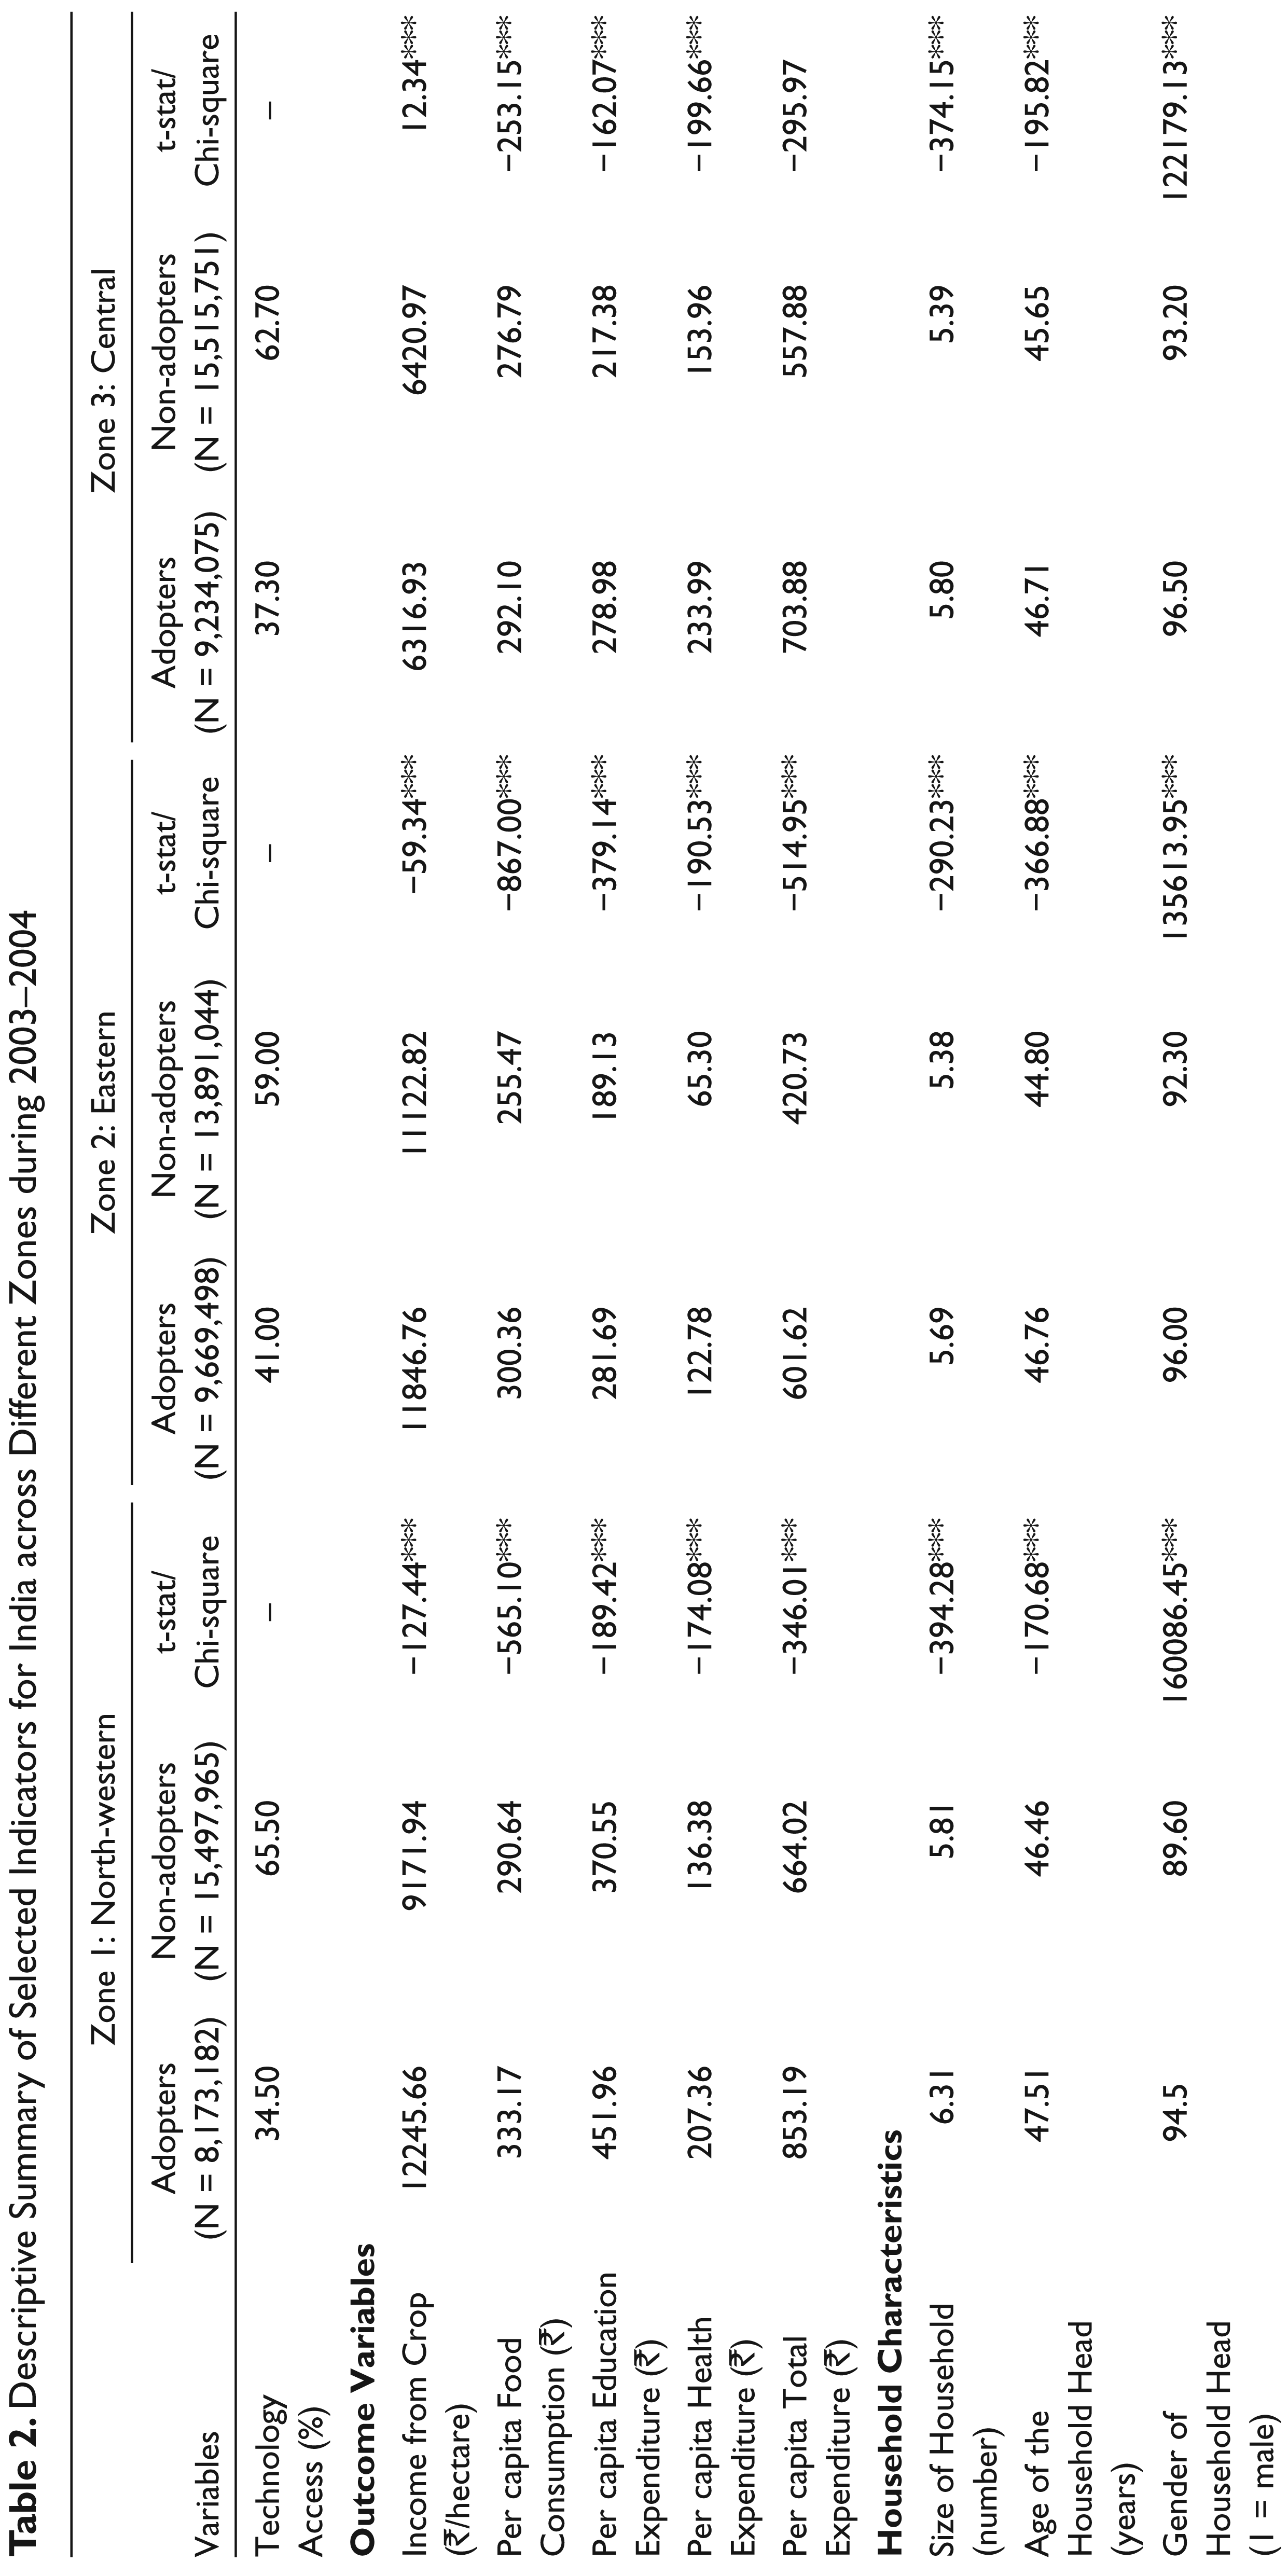
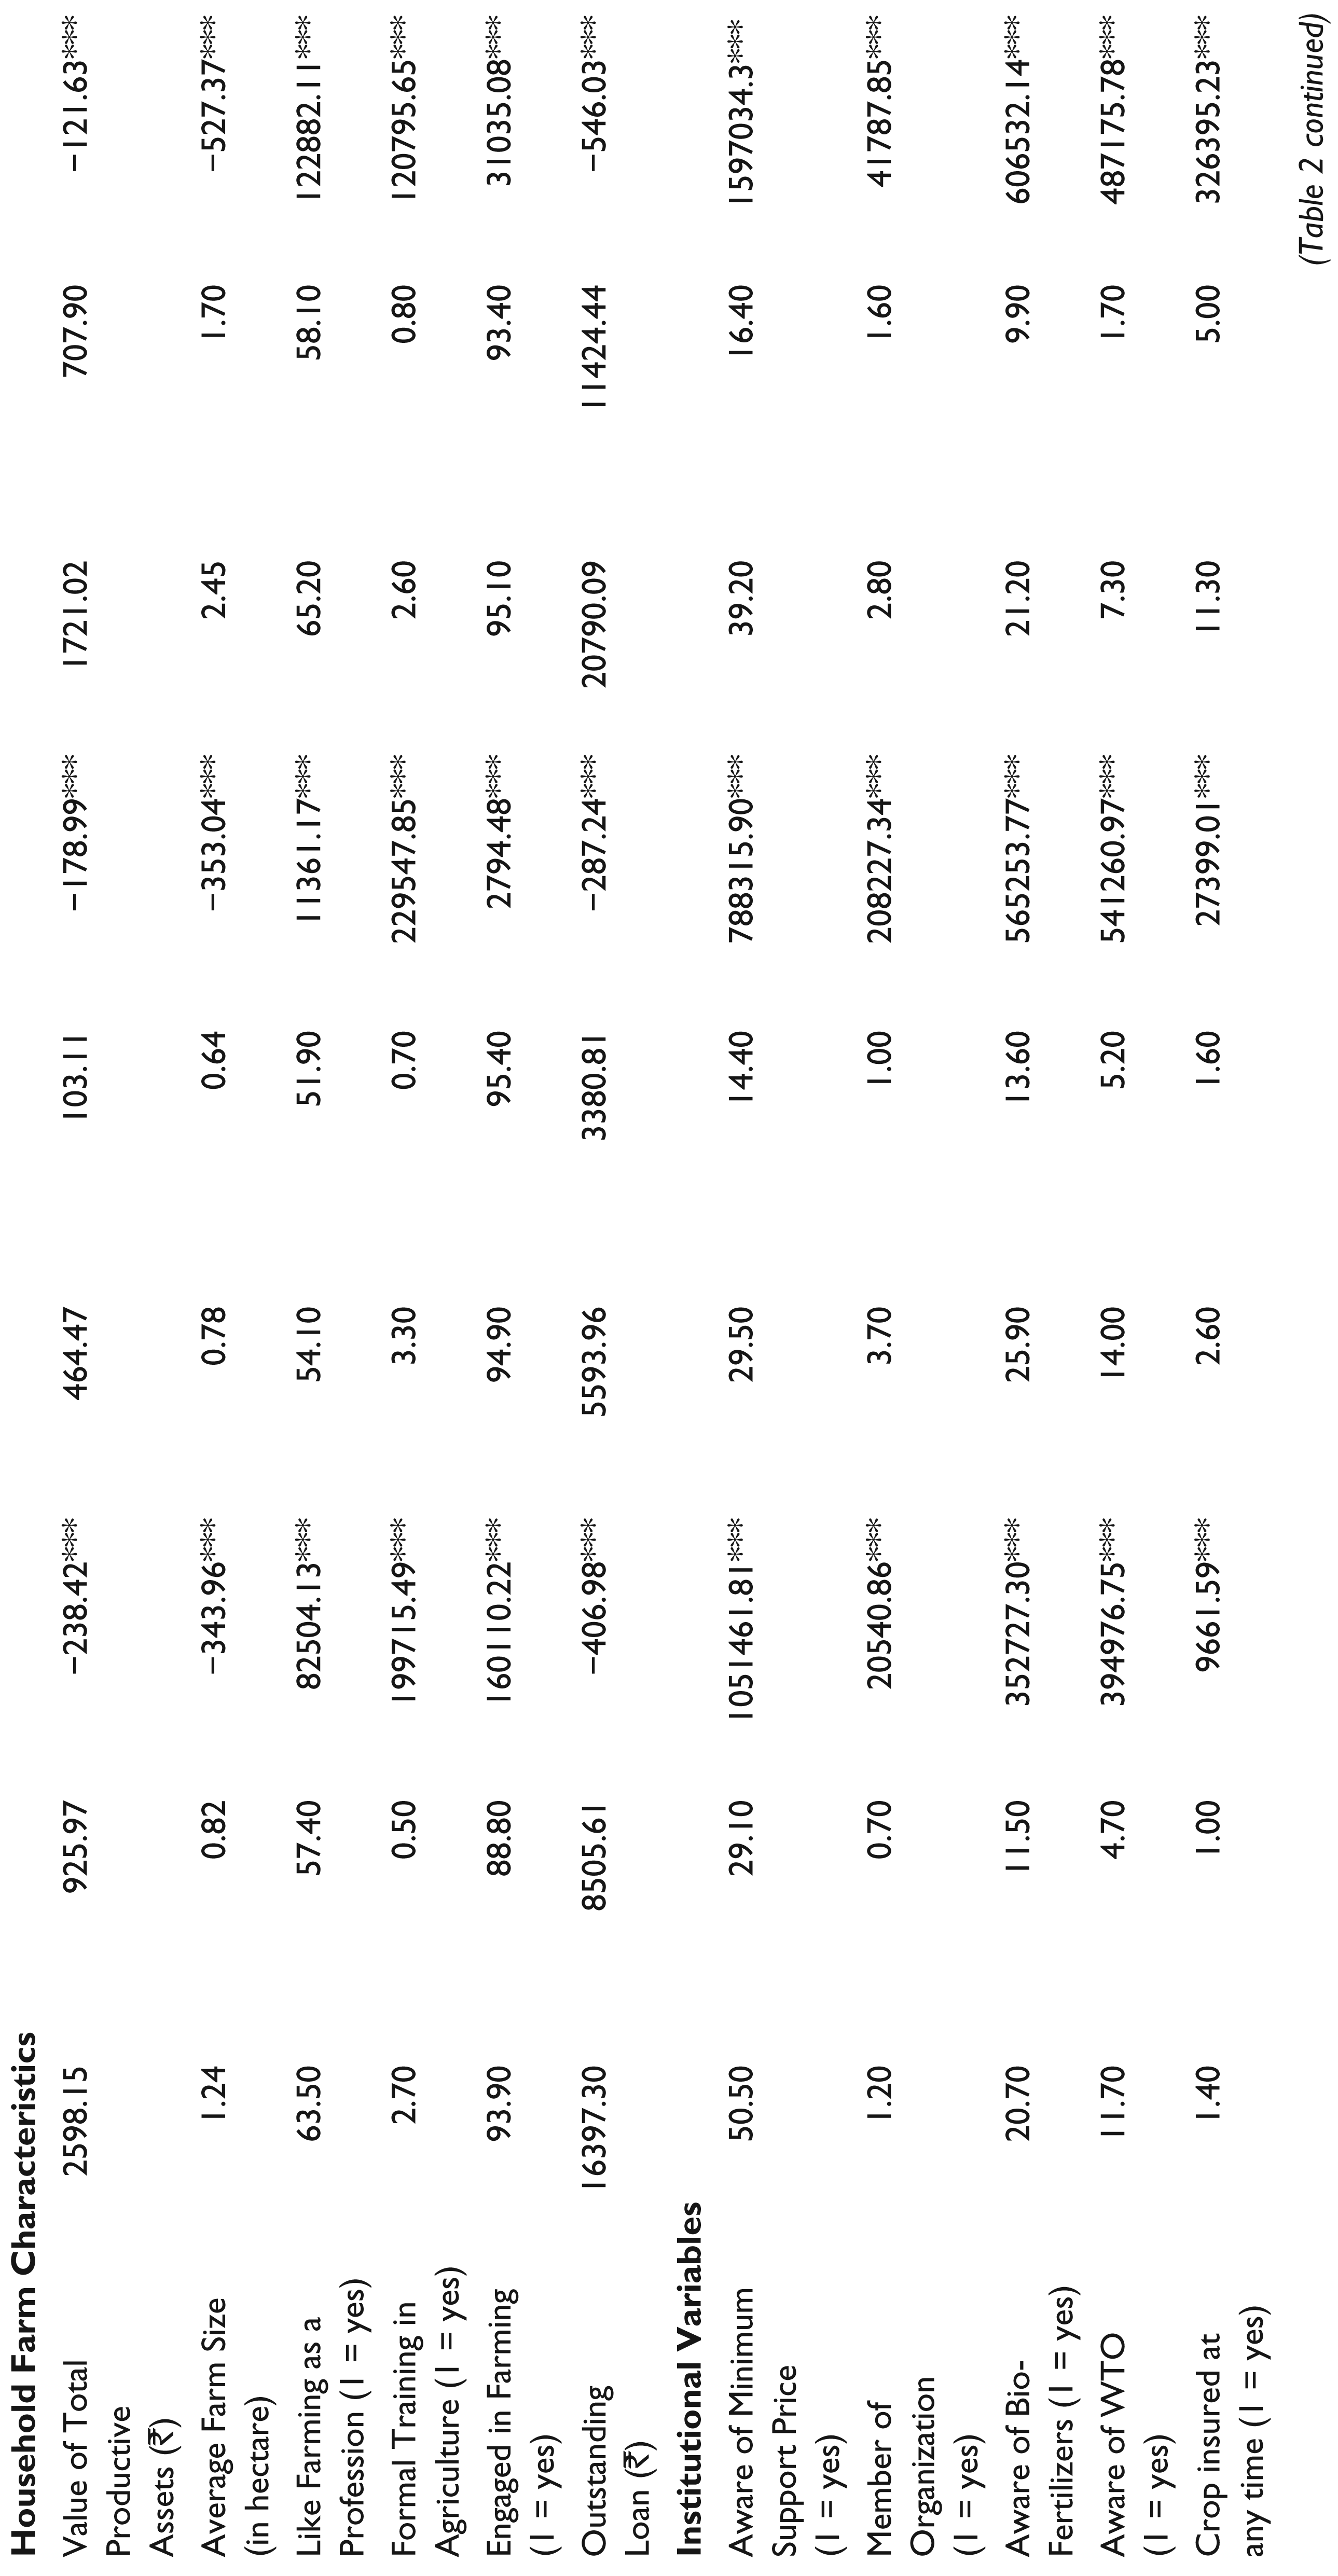
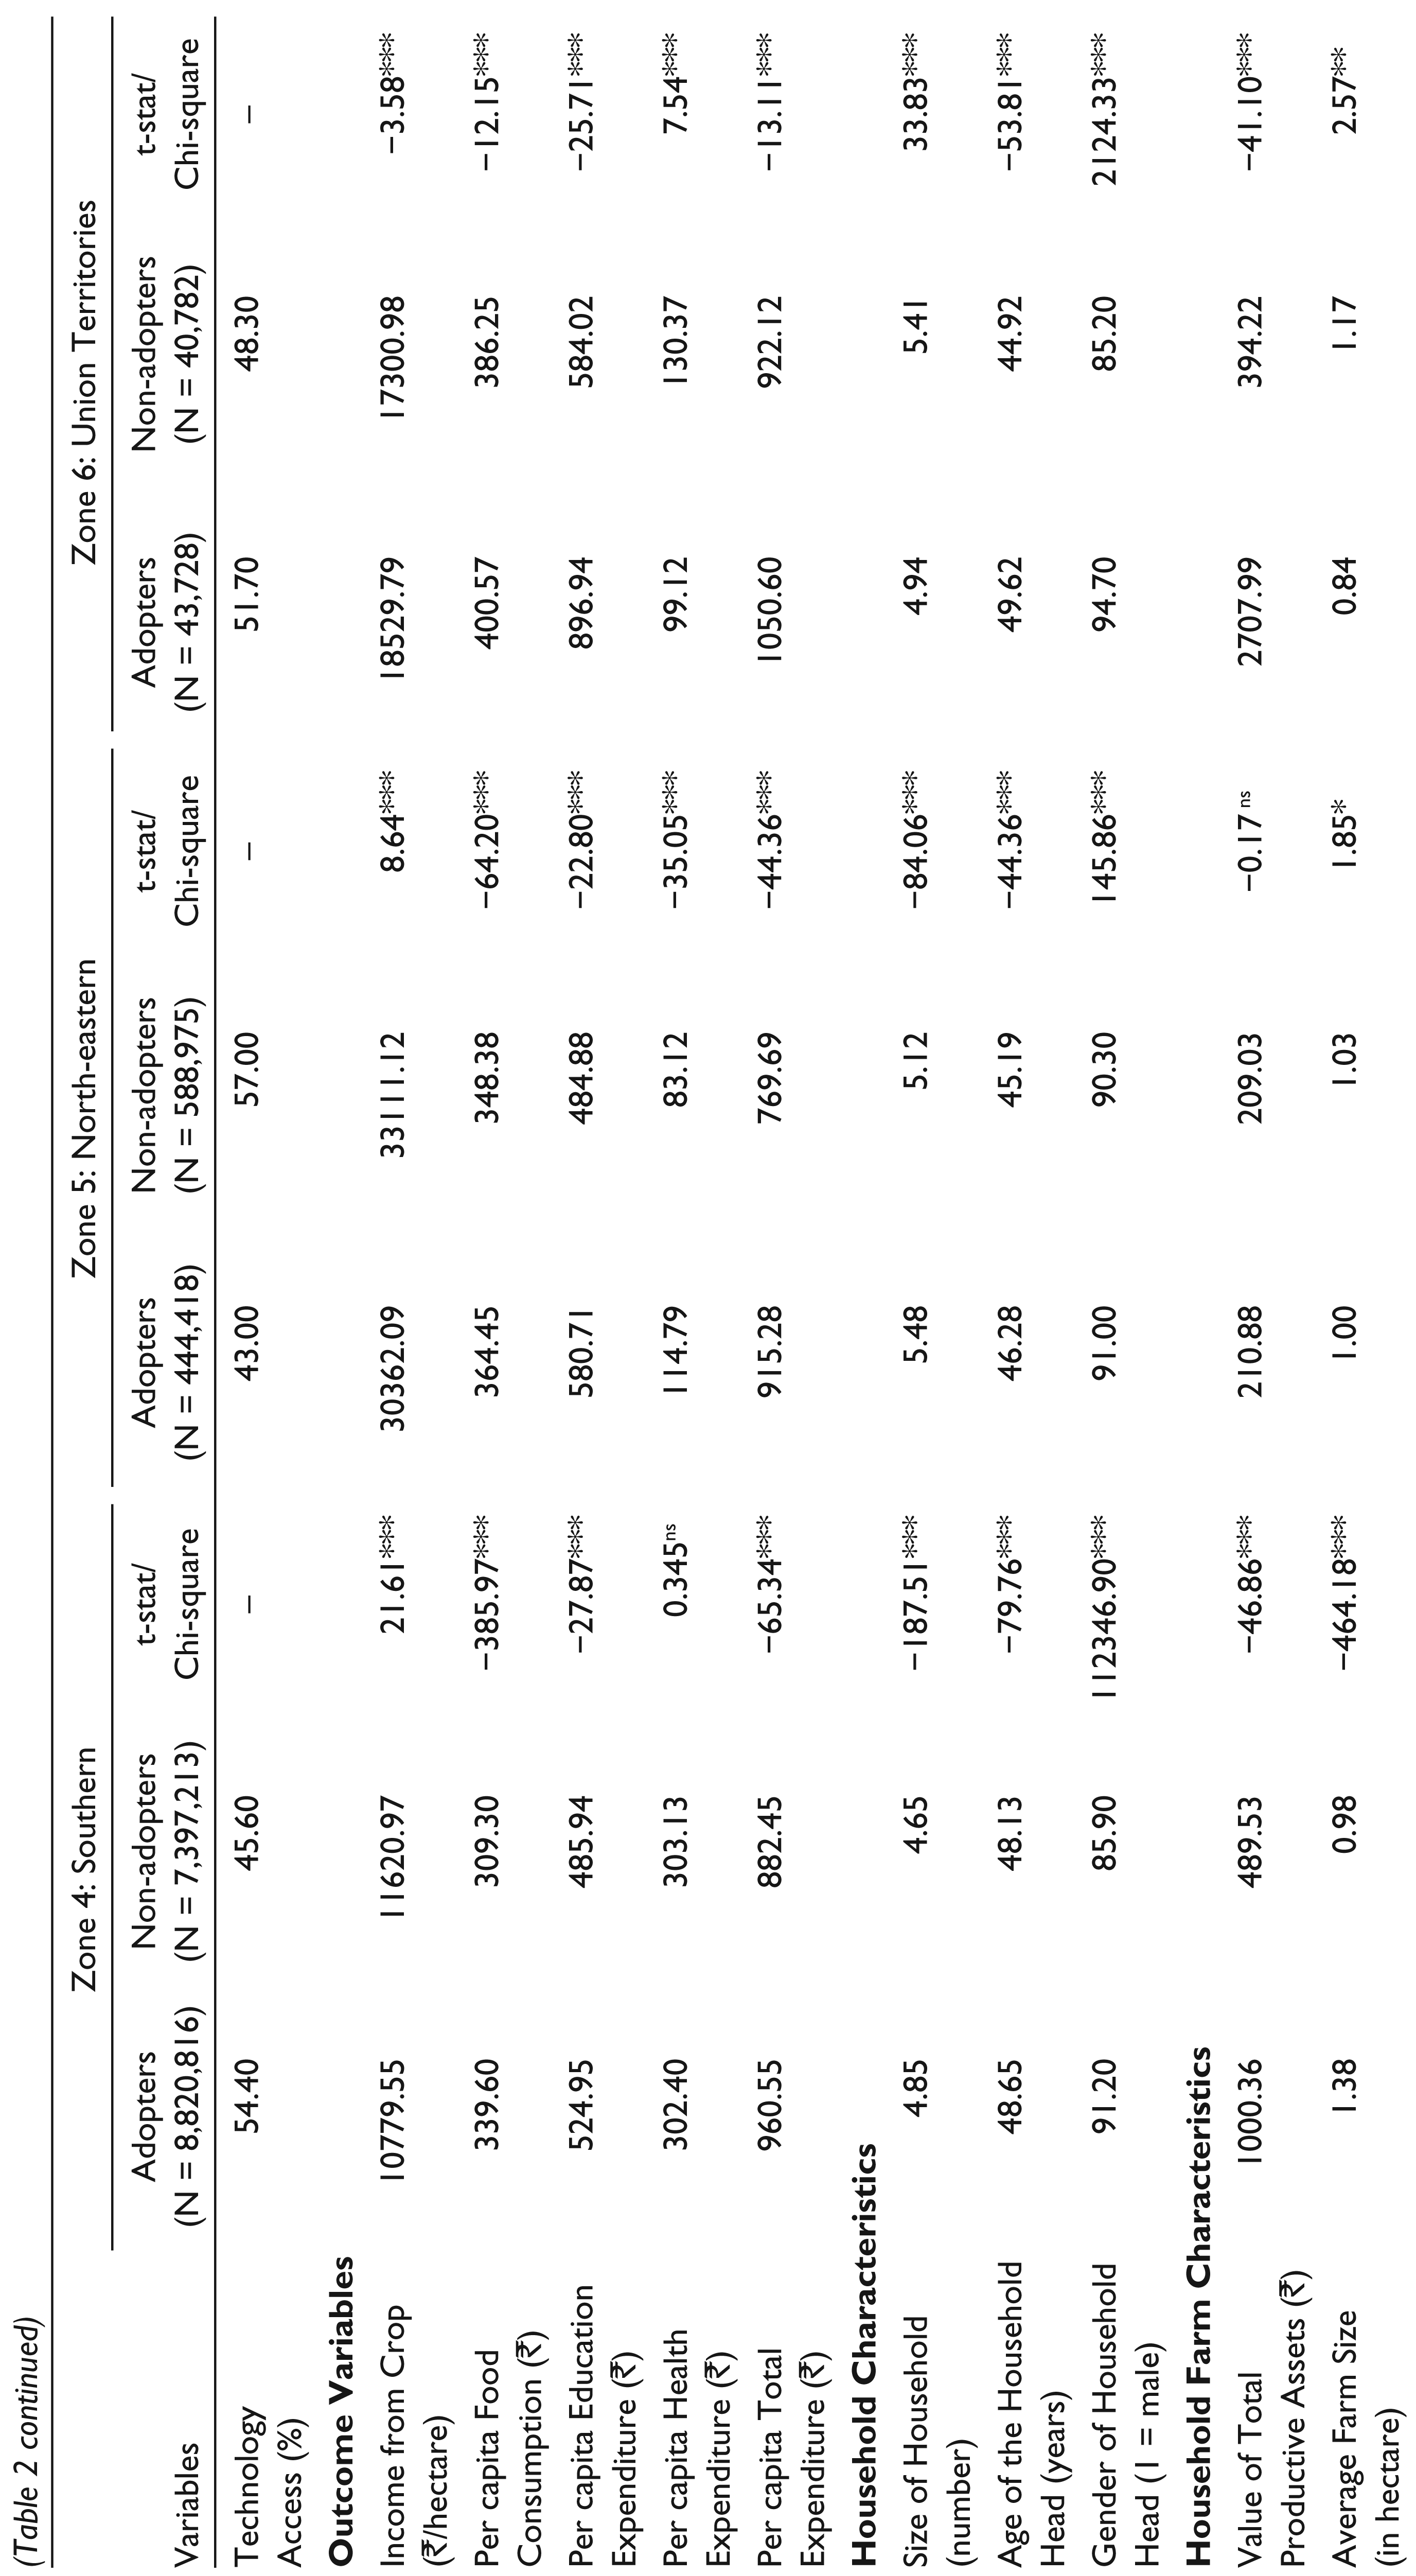

It is necessary to have a zonal analysis, since overall analysis does not portray the region-based differences. Six rural zones have been classified on the basis of geographical location to analyze the differences in selected variables (see Table A1 in the Appendix for the zonal division). The outcome variable per hectare crop income is found to be significantly higher for adopter households in north-western zone, eastern zone and in union territories (UTs). On the other side, reverse trends have been found in the southern zone, central zone and north-eastern zone (see Table 2). The increased crop income is the most crude and apparent result of adoption of modern technology in all the zones. The ultimate outcome of technological adoption is considered as increased consumption (as already elaborated in conceptual framework). Per capita consumption is found significantly higher for all the zones among modern technology adopter households. This clearly explains that the ultimate welfare outcome, as captured by proxy of consumption per capita, of modern technology may increase with the adoption of modern technology. This hypothesis is needed to be tested statistically to verify the relation.
Table 2 shows that household characteristics are significantly different for adopters and non-adopters for all the zones. It is seen that for all the zones, productive assets and loan outstanding are significantly higher for adopters than non-adopter households. These trends are clearly matching with all India level. Average farm size is found to be higher for adopters for all the zones, the only exception in this regard is UTs. This relation is insignificant for the north-eastern zone. Among institutional variables, it is found that for all zones adopter households are more aware of these institutions. Only for the north-eastern zone, the participation in agricultural organization is higher for non-adopters. It is clearly evident from these findings that increase in the awareness about the institutions might induce adoption of modern technology among farmer households.
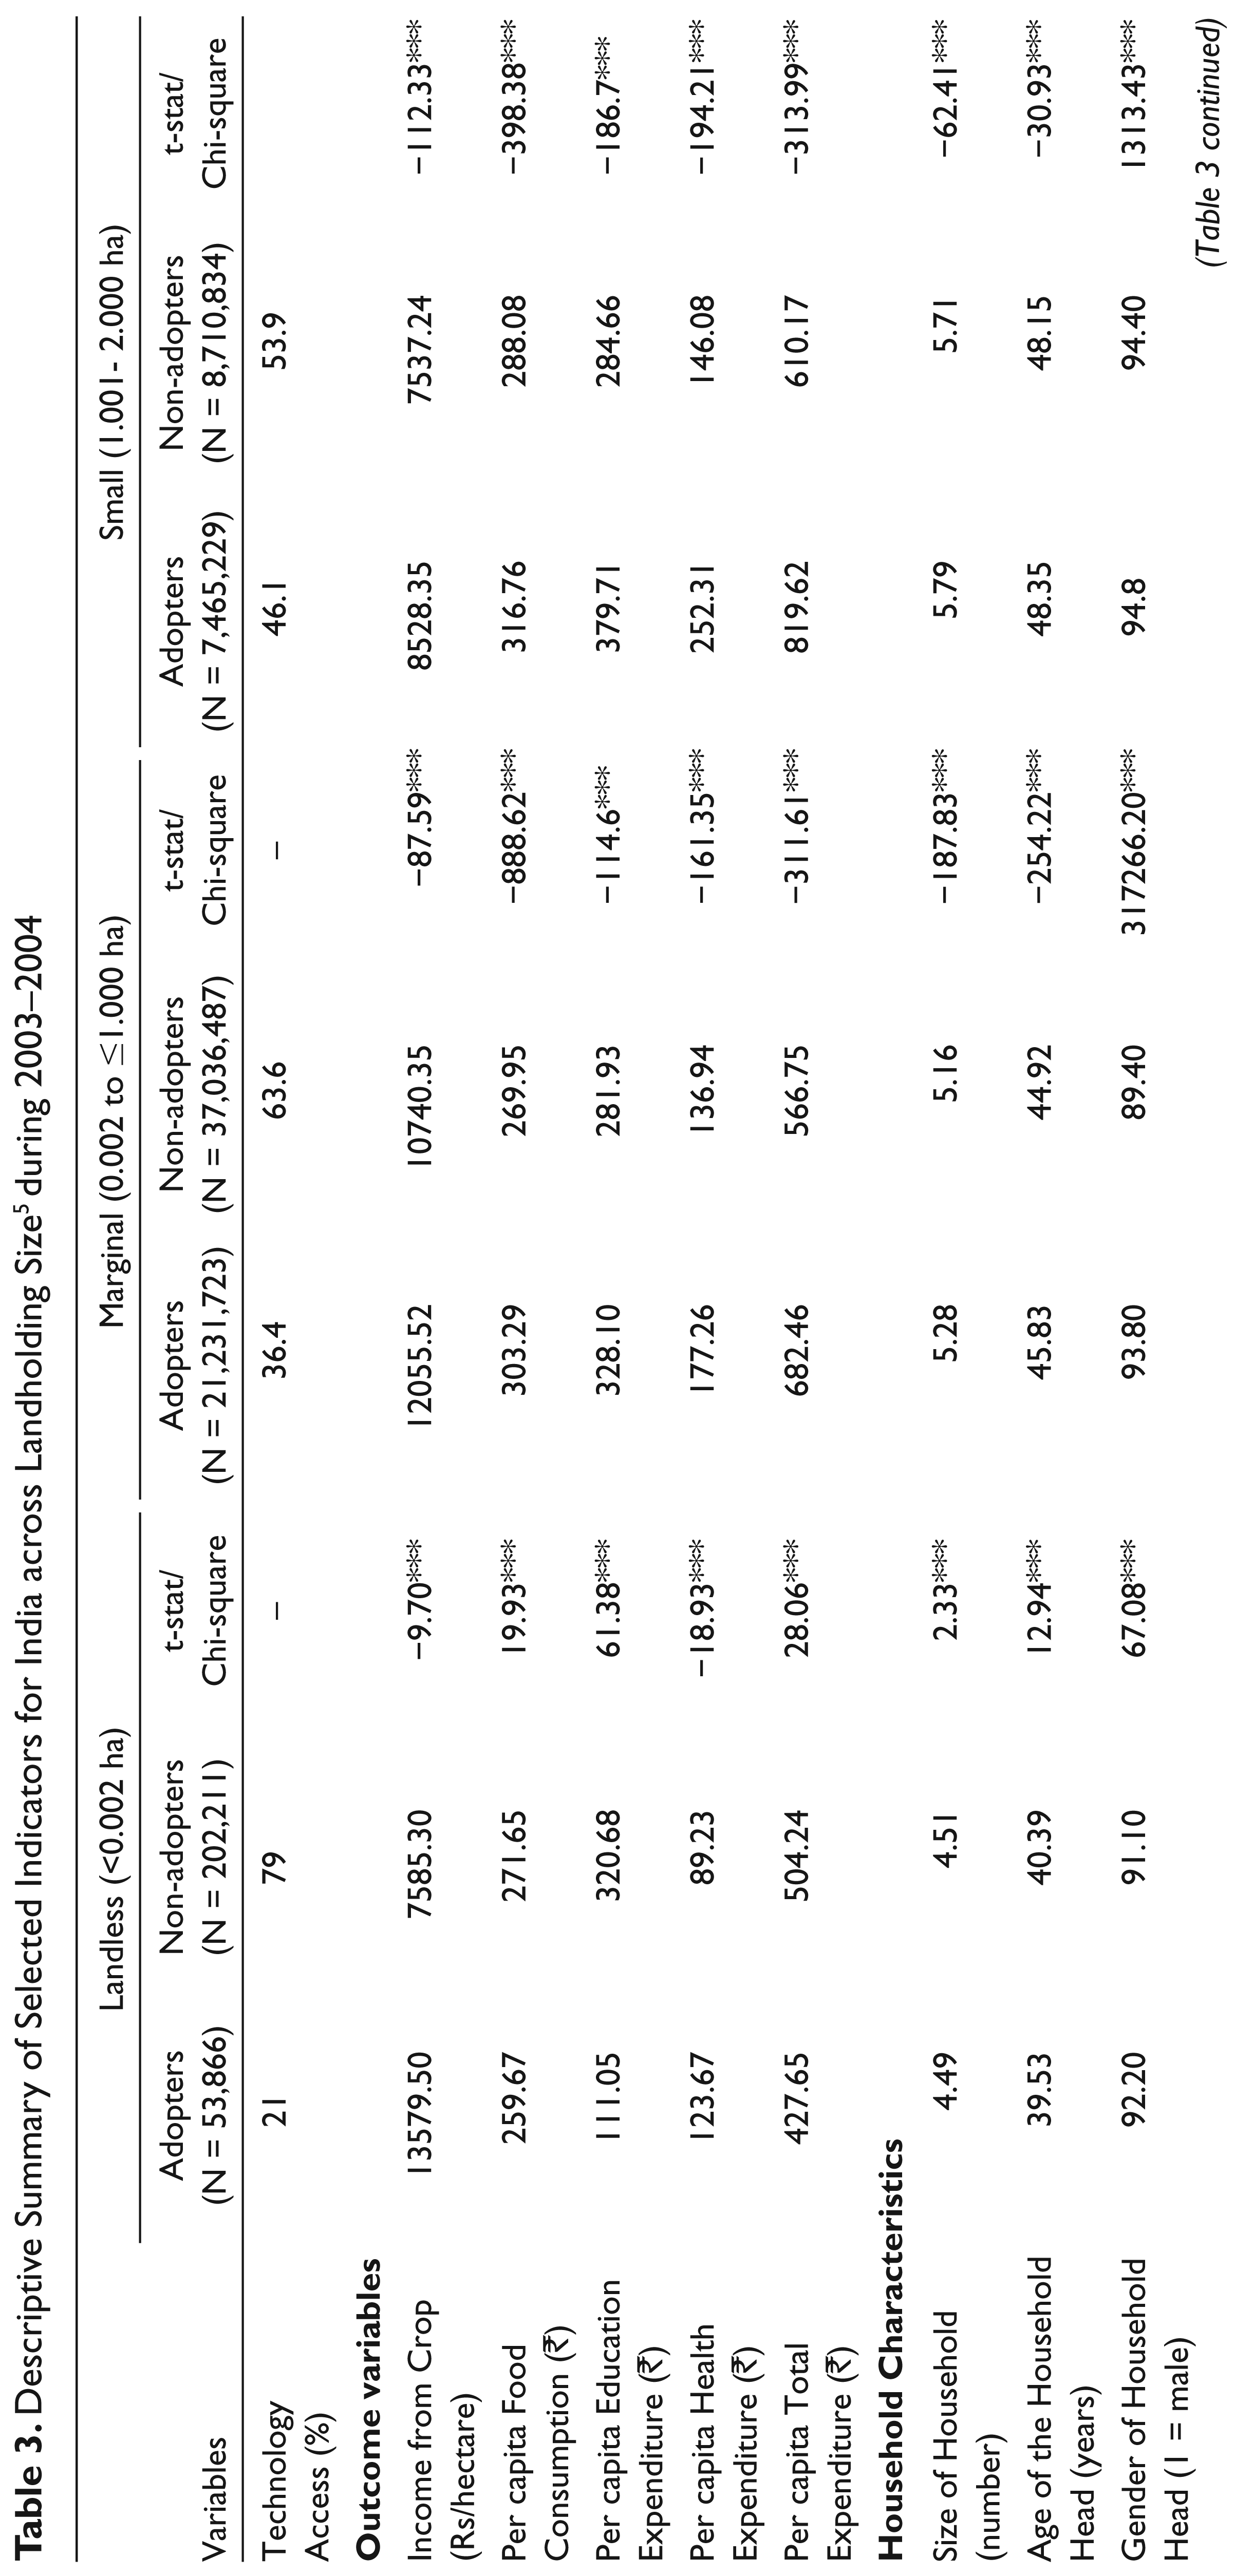
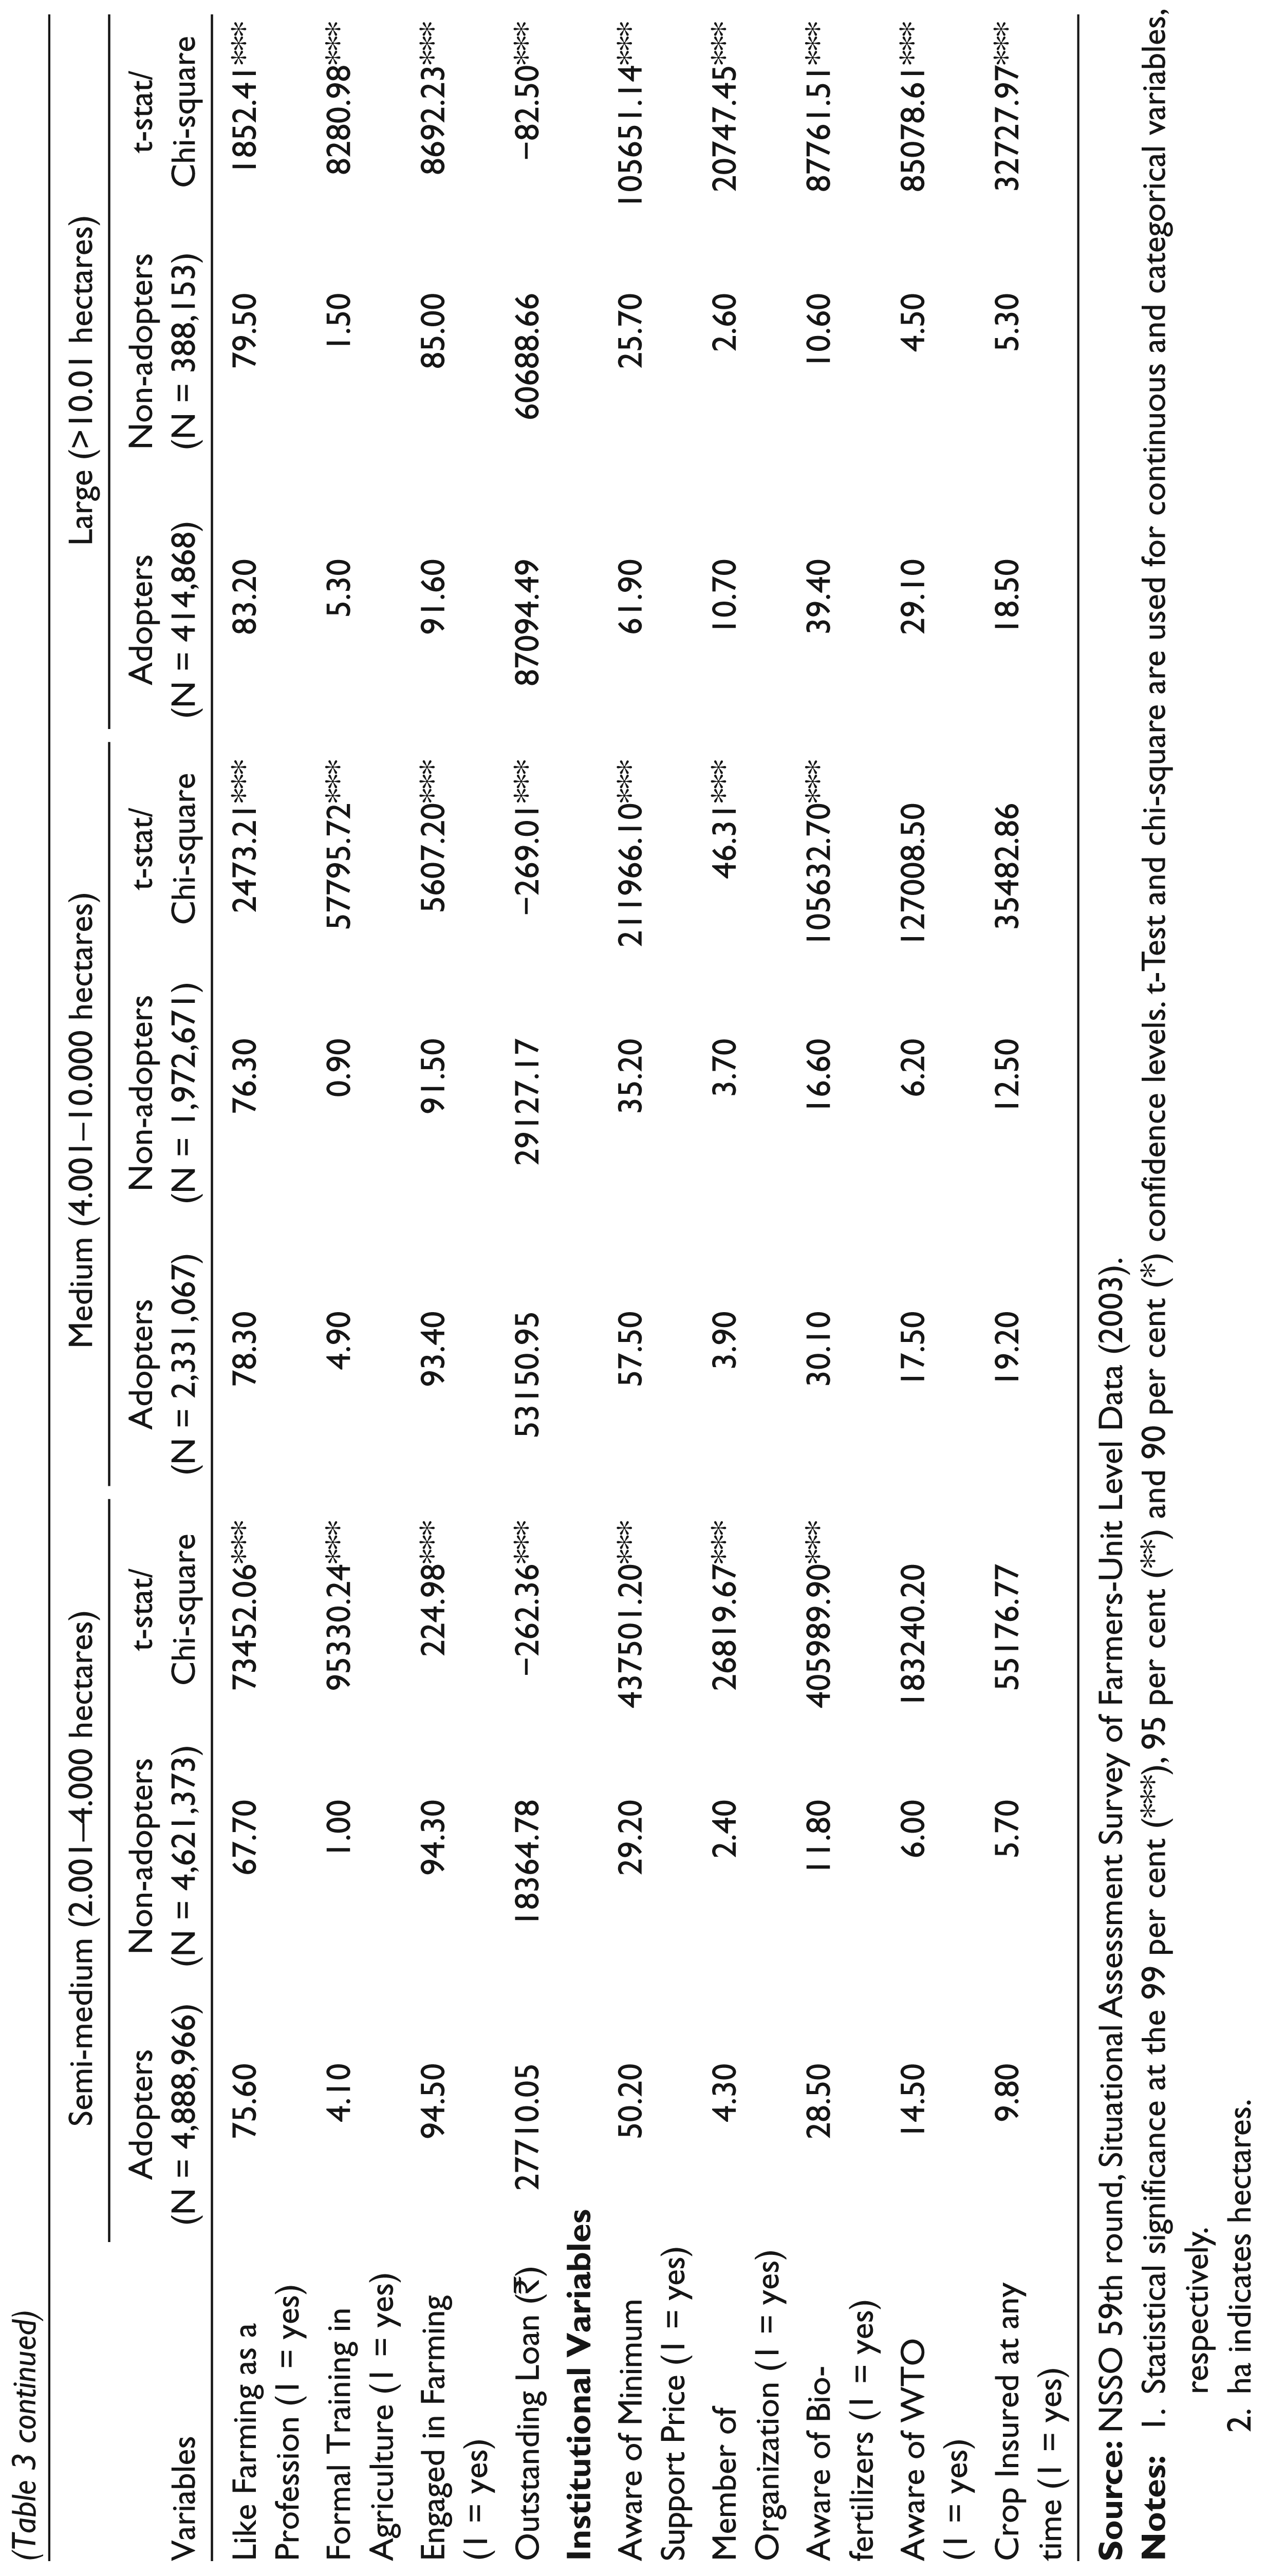
We also analyzed the differences in the adoption of modern technology and its outcome across landholding size. The results are presented in Table 3. Expectedly, the percentage of modern technology adopters is increasing; as one move towards higher holding size from lower size of holding. However, for large holders, this percentage somewhat declines as compared to the medium holders. Per hectare income from crop of modern technology adopters is higher across all the holding sizes of land except for large holding. Per capita total consumption has been increasing with increasing size of holdings. The point here to be noted that for landless category per capita total consumption of adopters is higher than that of non-adopters. These findings clearly indicate that land size is an important factor to gain the benefits of modern technology.
A household’s level of productive asset has shown an upward rise with the increase in holding size in general; however, for adopters it is more than that of non-adopters across all the land holdings. The average size of land holding is larger for adopters across all the categories.


2. ha indicates hectares.
Coming to debt outstanding, it is also higher among adopters as holding size increases. This result indicates that as compared to small and marginal holders; large, medium and semi-medium holders have better access to credit and have better chances of adoption of modern agricultural technology, thereby leads to more productive assets. Finally, the percentage of institutional variables is poor in general across all the categories of land holdings. However, it is to be noted that all the indicators are performing relatively better in case of modern technology adopters.
Before presenting the logistic regression results, it is useful to give variable description (refer Table 4). In the present analysis we seek to explore the relationship between access to modern agricultural technologies and the welfare of farmer’s households. Welfare has been considered as the outcome variable which has been taken in terms of poverty line. It is argued that access to modern technology may increase the welfare of farmers’ households. We specify a number of other variables which we expect to influence poverty levels such as demographic characteristics of households (head of household, age of household’s head, educational level, number of household members, etc.), awareness level of a farmer, size of holding size, etc. Thus, access to technology along with other conditioning factors have some bearing on the level of poverty. To empirically test the above stated arguments, we employ an econometric exercise using individual level information of farmers’ households.
Variables Included in Logistic Regression: Dependent Variable, Per Capita Consumption Expenditure [APL (Above Poverty Line) = 1; BPL (Below Poverty Line) = 0] 6

The maximum likelihood estimates of the logit model of adoption of modern technology in the context of India are presented in Table 5. Just to recall the hypothesis: technological access/adoption enhances per capita level of consumption among farmer households. The variables included in the model provide production services and are resources available to the farmer household in his farming activity and we expect these variables to increase the likelihood of adoption for a given household thereby enhances welfare.
Estimates of Logistic Regression

Log Likelihood = 59281.63, Model Chi-square = 8897.80***, Cox & Snell R-Square = 0.161, Nagelkerke R-Square = 0.217, Hosmer and Lemeshow Test= 13.90*
ROC Analysis: Area under the Curve = 0.744***
We find that our explanatory variables are, in most cases, related to consumption expenditure as per our expectation. First, there is some support for the hypothesis that technology adoption increases welfare of the farmer households in terms of consumption expenditure. All the variables in the model are statistically significant at 1 per cent level. In particular, controlling for other variables, model has found positive relationship of technology access index with per capita consumption expenditure. The odds ratio suggests that the level of per capita consumption expenditure remains around eight times higher if the household adopts modern technology with reference to who did not adopt technology. Thus, this finding is in line with the findings of study by Asfaw et al. (2012) confirming the hypothesis that technology adoption has a positive and significant effect on consumption of the household.
Second, the level of education and awareness index are also positively related with the dependent variable. The odds for both the variables are more than one which suggests that the probability of level of consumption is higher if the household head have better level of education and better awareness about agricultural institutions. One possible explanation is that higher level of education and awareness about agricultural institutions eases the adoption of modern agricultural technology. It is also seen that being a member of an agricultural organization has a greater probability of higher level of per capita total consumption than not being a member.
Third, adoption decision was found to vary across different agro-ecological zones. Zonal dummies included in the model are found to be highly significant and positive (the point of reference is eastern). The relationship of land dummies with dependent variable is negative for landless and marginal class however for all other land holding dummies, the relationship is positive. Small holding land size is taken as reference category. This pattern explains that the relationship between technological adoption and per capita consumption remains positive with the precondition that the holding size must be at least small or above. Using the set of explanatory variables in Table 4, the estimated model explains only about 74 per cent of the total variation in consumption across households in the country as a whole and model’s chi-square is significant. Further, Hosmer and Lemshow (2000) test was also conducted which is non-significant. A non-significant value for this test indicates that the model does not differ significantly from the observed data. Alternatively, non-significant value is indicative of a model that is predicting the real-world data fairly well.
This article evaluates the potential impact of adoption of technology in terms of access to various sources of information as a proxy on farmer household’s welfare measured by consumption expenditure in rural India. The causal impact of technology adoption is estimated by utilizing logistic regression. What follows are the main conclusions of the article.
First, it can be inferred from descriptive analysis that the outcome variables show better performance for those who adopt modern agricultural technology. Per capita total consumption is found to be more in case of adopters. Better awareness about institutions and level of assets facilitate the adoption of modern technology. It means that the group of farm households that did adopt modern technology has significantly different characteristics than the group of farm households that did not adopt. This is also significantly true for different agro-ecological zones of the country though there is variation in access to different sources of information. Note that, there is a clear bias in technology adoption against small holders: that is, modern technology adoption significantly increases with increase in landholding size.
Second, the estimates of the logistic regression confirm the hypothesis that technology adoption has a positive and significant effect on consumption of the household even after controlling for other factors. In other words, higher gain of consumption expenditure per capita from modern technology adoption means decrease in poverty level of the farmer household. In a nutshell, the results from this paper generally confirm the potential role of technology adoption on improving rural household welfare.
The issue is if the welfare effects of modern technology adoption is so great then what explains after is the lack of adoption by about 59 per cent of farmer households in the country? The descriptive analysis of adoption generated very interesting results. Value of productive assets, formal training in agriculture, access to credit and institutional variables (such as, awareness of minimum support price, member of organization and awareness about bio-fertilizers) are identified as key constraints for technology adoption. Some of these constraints were also found in the studies carried out in other contexts (for example, Adesina and Zinnah 1993; Asfaw et al. 2012; Feder et al. 1985; Lybbert and Sumner 2012; Traxler and Byerlee 1993).
This implies the need for policy and the possible suggestions are as follows: first, there is need to strengthen the government extension services and rural institutions to promote and create awareness about the existing improved technologies (both mechanical and bio-chemical). The government will need to take the lead in technology promotion and its dissemination among the farmers. Also, it is critical not to underestimate the temporal and spatial variability in which agriculture operates. Second, there is a need to take some institutional measures that help the small and marginal farmers to increase their earnings. Specifically, new technologies in agriculture should be made accessible to the small farmers for enabling them to diversify their production towards high value commercial and export commodities along with investment in infrastructure. There is also need to create necessary infrastructure in processing, marketing and grading of produce. Finally, the country needs its own people with the capacity to conduct adaptive agricultural research and to design and implement agricultural policy with special attention to specific region.
Footnotes
Appendix
Dichotomous Variables Used in the Construction of Technology Access Index
| Sr. no | Source of Information | Whether Access? |
| 1. | Participation in Training Programme | (Yes – 1, No – 0) |
| 2. | Krishi Vigyan Kendra | (Yes – 1, No – 0) |
| 3. | Extension Worker | (Yes – 1, No – 0) |
| 4. | Television | (Yes – 1, No – 0) |
| 5. | Radio | (Yes – 1, No – 0) |
| 6. | Newspaper | (Yes – 1, No – 0) |
| 7. | Village Fair | (Yes – 1, No – 0) |
| 8. | Government Demonstration | (Yes – 1, No – 0) |
| 9. | Input Dealer | (Yes – 1, No – 0) |
| 10. | Other Progressive Farmers | (Yes – 1, No – 0) |
| 11. | Farmers Study Tour | (Yes – 1, No – 0) |
| 12. | Para Technician/Private Agency/NGO | (Yes – 1, No – 0) |
| 13. | Primary Cooperative Society | (Yes – 1, No – 0) |
| 14. | Output buyers/Food Processor | (Yes – 1, No – 0) |
| 15. | Credit Agency | (Yes – 1, No – 0) |
| 16. | Others | (Yes – 1, No – 0) |

Acknowledgements
The authors are grateful to the two anonymous referees for their helpful suggestions which improved the paper substantially.