
Abstract
During the COVID-19 lockdown, Indian migrant population face heightened vulnerability. Payment banks (PBs) were established to boost financial inclusion, catering to migrant labour, small businesses and low-income households with savings accounts and digital services. The study empirically evaluates the performance of six PBs, namely Airtel Payments Bank, India Post Payments Bank, Fino Payments Bank, National Securities Depository Limited Payments Bank, Jio Payments Bank and Paytm Payments Bank, encompassing annual panel data spanning from 2019 to 2022, and analysing financial metrics such as return on assets (ROA), profit margin, liquidity, banking business, leverage and efficiency to determine their impact on economic activities. Using the generalized method of moments and dynamic ordinary least squares, it is observed that all explanatory variables yielded a positive outcome, emphasizing the importance of PBs for those factors determining the profitability of bank operations. Payment banks have registered negative ROA and high operating expenses, although Airtel, Fino and Paytm Payments Banks exhibit profitable businesses among six. It is recognized that PBs play a crucial role in promoting financial services, promoting digital transactions and assisting India to achieve larger economic development objectives. The study recommended PBs to prioritize technological collaboration, efficient operations, financial literacy and regular monitoring of financial health, and encouraged payment banks to lend to micro-businesses within MSMEs for economic growth.
I. Introduction
Over the past decade, the banking industry in India has experienced an augmented growth in terms of both volume and complexity. Despite notable advancements in maintaining profitability and competitiveness, it remains a stark reality that essential financial services continue to elude marginalized segments and underserved regions (Sikdar & Kumar, 2016). In this context, the Government of India (GOI) has introduced a specialized bank aimed at catering to a distinct section of society. The basic objective of these banks is to broaden the vision of payments and financial products to marginalized sections, migrated worker, unorganized smaller businesses in a safer and secure digital environment with globally recognized bank accounts (RBI, 2020). Payment banks (PBs) popularly known as specialized banks for ‘comprehensive financial services for small businesses and low-income households’ to infuse financial inclusion (RBI, 2014b) 1 . Payment banks operate on a smaller scale to avoid credit risk, although they perform all banking services like other Scheduled Commercial Banks (SCBs). It performs most banking operations, excluding lending of money, time deposit of long tenure and issuing credit cards. The main services PBs enable include accepting demand deposits up to rupees 0.2 million, offering remittance services and enabling mobile purchases, transfers and payments of utility bills and daily expenses. Additionally, it provides other essential banking services such as debit cards, funds transfers and internet banking. Payment banks, which are technology-driven banks, came into effect when the central bank (RBI) granted license to 11 players to formulate special kinds of banks for financial inclusion and provide almost equivalent service to the traditional banking sector. As of March 2022, out of 11 players, only 6 (Table A1) are operational but not very successful in banking parameters like profitability indicator and other financial parameters. These banks primarily rely on fee-based earnings for revenue analysis (Pramani & Iyer, 2023), such as transaction fees on bill payments, further similar transactions, micro-ATMs’ earnings for remittance, cash management services, withdrawal services, business correspondence services to other banks, commission through point-of-service (POS) terminals, merchant discount rate charges, and other para-banking operations. These are some ways through which PBs generate income (Forbes India, 2023; RBI, 2022). The aforementioned sources of income with respect to PBs generated from remittance activities, which enhanced the value (amount) of PB transactions in centralized payment systems such as real-time gross settlement (RTGS) and national electronic funds transfer (NEFT), increased by more than 4 times as transactions increased by around 19 times. There are two types of remittances: inward and outward, including NEFT, RTGS, immediate payment service (IMPS), unified payments interface (UPI), E-Wallet and others. In 2021–2022, inward remittances via PBs rose 76.3% in volume, while outward remittances increased 84.5%, with values doubling (RBI, 2022). Unified payments interface led in both number and value of inward and outward remittances (2019–2022). They serve as business correspondents (BCs) for universal banks, focusing on financial inclusion through a vast BC network. Operating with lean structures, they ensure profitability interest margin about 3%–4%, customer service efficiency and technological innovation, requiring careful supervision to maintain public trust in digital transactions.
Over 190 million adult population in developing countries like India do not have access to banking facilities, making India the second largest nation in terms of unbanked and underbanked population (Draboo, 2020). The central bank aims to provide banking services in hilly areas; every village or hamlet with 500 households must have a bank branch within a 5-km radius. This milestone was successfully attained in 26 states and 7 union territories (UTs), covering 99.97% of the country, with 40 villages remaining unreached in Odisha, Chhattisgarh and Ladakh. These differentiated banks were permitted to tackle certain restricted activities to banks under the Banking Regulation Act, 1949. These banks desire to facilitate financial services to unprivileged sections of societies (Carstens, 2019). Branchless banking, including online and mobile banking, extends essential financial services to unbanked areas, promoting inclusion. India uniquely adopts this system globally, though Kenya features M-Pesa, a similar mobile wallet initiative (Pramani & Iyer, 2023). But mobile wallet and PBs are differentiated in their business model. It is basically used for the reservation of travel tickets, paying utility bills and other expenses (Roy et al., 2017). The business model of PBs relies on transaction and investment income to cover various expenses. Additionally, their model centres around small remittances, which are held in digital wallets and can be used for purchasing goods and services (RBI, 2020).
This article evaluates the performance of payment banks in India since the COVID-19 pandemic with a focus on financial metrics from 1 April 2019 to 31 March 2022. Financial metrics are quantitative measures and used to assess the financial performance, health and efficiency of banks. These indicators offer valuable insights into different facets of a bank’s operations, profitability, risk management and overall financial health. Some of these are incorporated in the study return on assets (ROA), profit margin (PM), assets, efficiency, banking business, leverage and liquidity. Financial services include diverse products and activities by banks and institutions to meet financial needs, manage money, facilitate transactions, provide credit and mitigate risks for individuals and businesses. Therefore, financial metrics and financial services are intricately linked in the banking industry, including PBs in India. These metrics provide insights into performance, profitability, risk management, customer satisfaction and regulatory compliance, guiding strategic decision-making and ensuring the effective delivery of financial services to customers. The selected time period aligns with the period following the COVID-19 pandemic. During the COVID-19 lockdown implemented by the Indian government, it became clear that the migrant population remains the most vulnerable segment of society (Dev & Sengupta, 2020; Ranjan, 2021). On the contrary, PBs are still facing competition with several other online payments services such as mobile payment gateway (Phone Pay, Google Pay, Bharat Pay, Mobi Kwik, etc.), Aadhar-enabled payment system, unified payment interface (BHIM) and online apps of SCB. Although prior studies have explored financial inclusion or customer perception, adoption and general challenges of PBs (Chakraborty, 2019; Pramani & Iyer, 2023), there remains a paucity of empirical research evaluating their financial performance in the post-Covid era using robust econometric methods such as generalized method of moments (GMM) and dynamic ordinary least squares (DOLS). Moreover, the impact of the pandemic on the financial performance of PBs, which operate under unique constraints compared to traditional banks, remains underexplored. This study addresses the gap by analysing key financial metrics such as profitability, efficiency, liquidity and leverage to evaluate PBs’ sustainability and challenges during the pandemic, offering valuable insights into financial inclusion and banking performance. To address this gap, the study formulates the following research question: How have key financial metrics such as efficiency, liquidity, leverage and asset size influenced the financial performance (measured by ROA and PMs) of PBs in India during the post-Covid period? The research question addresses the gap by empirically evaluating PBs’ financial performance during a critical period using GMM and DOLS. It provides insights into factors driving profitability and sustainability, aligning with the study’s objectives to bridge the identified gap. Thus, it is crucial for assessing the relevance and performance of PBs in supporting economic activities. The following section integrates previous research and highlights the distinct significance of the current study.
The remainder of the article is organized as follows. Section II discusses the reviews of relevant literature and identifies gaps addressed by the study. Section III outlines the trends on financial metrics of PBs, while Section IV presents the data definition and statistical tools. Section V depicts the empirical results. Section VI consists of conclusion and policy implication of the current study.
II. Review of Literature and Hypothesis Formulation
Theoretical Underpinning
The concept of PBs in India emerged as a response to the need for financial inclusion, particularly in rural and underserved areas. The RBI formulated the idea of PBs to enable banking services to small depositors and low-income households, leveraging technology and innovation to offer cost-effective solutions. Payments banks were established in India based on the recommendations of the Committee on Comprehensive Financial Services for Small Businesses and Low-Income Households. On 19 August 2015, the RBI granted license to 11 applicants (see Table A1) to establish PBs (RBI, 2016). The guidelines for PBs and the on-tap licencing policy for universal banks represent a step towards formulating a diverse banking system (RBI, 2017). These PBs were envisioned as a means to provide basic banking services to underserved and remote areas, thereby fostering economic growth and empowerment. Airtel Payments Bank Limited began its operation as the first PB on 23rd November 2016. The business model of PBs is different from the schedule commercial banks as PBs are prohibited from lending, issuing of credit cards or accepting deposits from non-resident Indians. Notwithstanding, they act as a BC to other banks and separate business guidelines issued for the same. On 29 October 2018, the RBI allowed PBs to participate in call, notice and term money markets as lenders and borrowers, even without SCB status. Active PBs, such as Airtel, India Post, Fino, Jio, National Securities Depository Limited (NSDL), and Paytm, aim to uplift underserved populations. However, entities such as Cholamandalam, Tech Mahindra and Vodafone M-Pesa faced challenges, including high infrastructure costs, capital generation issues and technology investment demands, leading to surrender or closure. While some PBs made strides towards financial inclusion, others struggled, underscoring the complexities of providing banking services to weaker sections of society. Despite the mixed outcomes, the initiative reflects the RBI’s commitment to fostering a more inclusive and accessible financial landscape in India. The Reserve Bank of India had decided its regulatory framework for these banks largely based on Basel standards. It outlines the capital adequacy framework to mandate the minimum amount of capital that these banks must maintain to ensure their financial stability and ability to absorb potential losses. Payment banks’ maximum balance in each account raised from 100 thousands to 200 thousands in April 2021 to strengthen capital adequacy norms and empower them to invest in safer government securities (RBI, 2021).
Formulation of Research Question
Several studies were conducted to discuss the impact of financial inclusion in India after the commencement of PBs. According to Thorat (2007) and Leeladhar (2006), various financial inclusion initiatives taken by RBI having specific focus on improving the financial situation and living conditions of the underprivileged section. Financial inclusion deals with ensuring the appropriate financial products and services to vulnerable societies at an affordable cost (Barua et al., 2016). Different methods and banking variables were used by researchers and analysts to understand the perspective of the targeted population with respect to PBs, such as the adoption of PBs, customer perception, attitude, perceived usefulness and usage and trust towards it. According to a study, the poor adoption of PBs financially excluded the targeted customer due to a lack of knowledge, trust and perceived need for their services (Pramani & Iyer, 2023). Also, Shrey et al. (2018) concluded that PBs have the potential to uplift financial inclusion, but there exists a lack of awareness among people about PBs. Chakraborty (2019) identified that performance expectancy, social influence, effort expectancy and initial trust significantly influence users’ behavioural intention to adopt PBs’ services and offer key insights into enhancing adoption strategies in the Indian banking sector. Mehta and Shah (2020) found that user-friendliness, security, convenience, cash management and cost-effectiveness influence customers’ decisions to use PBs. However, a study by Samitha SS and Venkatesan, (2021) concluded that the majority of people use PB services easily and show a positive attitude towards trust, perceived usefulness and usage. D’souza (2018) found that PBs have the potential to encourage financial inclusion by providing different services to vulnerable societies, such as making even the smallest of payments at odd hours and making payment systems viable for the masses.
This research examines financial exclusion and innovation in banking, focusing on PBs’ impact on financial inclusion, especially for vulnerable groups excluded from the mainstream of the banking services. Kempson and Whyley (1998) found that residents in hilly and remote areas are particularly susceptible to financial exclusion. Additionally, low-income households, migrants, the unemployed, elderly individuals, ethnic minorities and those in the informal sector are at heightened risk (Goodwin, 2000; Kempson & Whyley, 1998). To bolster financial inclusion, banking sector regulators must continuously monitor areas prone to exclusion. Studies by Leyshon and Thrift (1995) and Carbo et al. (2007) suggest that financial exclusion is symptomatic of broader social exclusion issues. Rangarajan (2008) emphasizes that comprehensive financial inclusion aims to eradicate social exclusion, addressing not only financial crises but also broader societal marginalization. Financial exclusion exposes vulnerable populations to exploitation by money lenders when institutional credit is inaccessible (Sikdar & Kumar, 2016). Factors impacting financial inclusion include banking accessibility, financial literacy, customer economic status, physical infrastructure and service suitability (Roy et al., 2017). Geographically proximate banking services with extensive coverage are crucial for inclusion (Toporowski, 1987). Financial inclusion barriers stem from both demand and supply sides, with demand-side factors significantly influencing inclusion.
Technological advancement and innovation are crucial for enhancing financial inclusion in a tech-driven landscape. They open avenues for non-financial institutions to provide empowering financial services. Digitalization of banks has given rise to PBs, contributing to financial inclusion . Ryu (2018) notes a shift from traditional online banking by financial institutions to innovative services offered by non-financial entities. Telecommunication and IT companies have reshaped the financial sector (Arner et al., 2016). Technology enables the delivery of financial products and services, addressing customer needs through smartphones. Internet connectivity and targeted strategies are pivotal (Aboelmaged & Gebba, 2013; Safeena, 2012). Oliveira et al. (2016) highlight technology’s role in crowdfunding, bill payments and cost reduction, fostering financial inclusion. However, technology’s impact can be double-edged, with both positive and negative implications (Mick & Fournier, 1998; Walker et al., 2002). Marginalized groups face complexities in adopting technology, necessitating efficient solutions from regulators, banks and financial institutions to assist the unbanked and underbanked segments.
Existing literature apprehends a comprehensive overview of various studies related to financial inclusion, financial exclusion, technological advancement and innovation, which leads its ways to produce a PB. While the above literature discussed the emergence of PBs in India and their potential to enhance financial inclusion, there seems to be a lack of comprehensive empirical studies evaluating the efficiency of PBs based on numerous financial ratios and parameters such as ROA, net PM, log of assets, liquidity, banking business, leverage and others. Akhter et al. (2021) analyse the drivers and challenges of PBs in India, emphasizing digital technology, financial literacy and regulatory limitations while advocating for quantitative research on financial inclusion metrics. The existing studies mainly focus on the potential benefits and challenges, but there is limited empirical evidence on the effectiveness of PBs in achieving their intended objectives. Therefore, by addressing these potential research gaps and building on the existing literature, studies contribute to a deeper nuanced understanding of the financial performance of PBs and their impact on financial metrics of PBs since COVID-19. Mishra and Misha (2023) examined herding behaviour in public sector banking and financial services stocks during COVID-19 bull markets, causing asset mispricing, and recommend reducing information asymmetry to enhance market stability. Based on the above objective, the study seeks to answer whether changes in financial metric variables enhance the performance of PBs throughout the study period.
The conceptual framework of this study integrates insights from the existing literature on PBs and their financial performance, with a focus on the key determinants of profitability and efficiency. Previous research emphasizes that variables such as liquidity, efficiency, leverage and asset size significantly impact financial health (Floros & Tan, 2012; Sharma & Kumar, 2017). These variables are closely linked to the profitability measures used in this study: ROA and PM. Guided by the gaps identified in the literature, the conceptual framework of this study is designed to assess the post-Covid financial performance of PBs, bridging the lack of empirical evidence in this area. By employing advanced econometric techniques such as GMM and DOLS, the framework evaluates how operational, financial and structural factors influence PBs’ profitability. This aligns with the study’s objective of providing actionable insights into the operational challenges and policy needs of PBs in India’s evolving financial ecosystem. While connecting them to theoretical insights from the literature, the following hypothesis were formulated that provides a clear direction for empirical testing.
III. Trends on Financial Metrics of Payments Banks
Figure A1 compares the financial health of six PBs from 2019 to 2022. It offers a comprehensive view of their total assets, deposits and financial health, illuminating their growth paths and economic impacts. Except for Jio Payments Bank, all PBs show significant asset expansion by FY2022, signifying a wider adoption of financial services, particularly bridging rural and underserved areas. This underscores their vital role in promoting financial inclusion, enhancing capital market efficiency, digitalization and economic modernization. These diverse asset growth trends collectively have the potential to reshape India’s economic landscape, fostering inclusive growth and efficiency across sectors (Figure A2).
The total deposits depicted in Figure A3 for six PBs provide insights into their performance and impact on India’s financial landscape. Jio Payments Bank shows varying trends over the years. The significant deposit growth reflects growing customer trust and adoption of its services, particularly in rural and underserved areas. This shift towards formalized banking contributes to financial inclusion, secure savings and economic growth at grassroots level. The surge indicates the popularity of digital wallets and mobile payments, driving cashless transactions and financial digitization. Overall, rising deposits signify broader trends of financial inclusion, digitalization and economic advancement. Increased engagement, enhanced access to banking and the move towards formalized, digitized financial interactions all contribute to India’s evolving economic landscape.
The financial trajectory of Indian PBs (2020–2022), reflected in Figure A4, highlights their ongoing struggle for profitability. Persistent losses of ₹8.27 billion (2020), ₹7.98 billion (2021) and ₹1.30 billion (2022) raise sustainability concerns. Operating expenses (OEs) surged from ₹43.24 billion (2020) to ₹58.26 billion (2022), reflecting expansion costs or inefficiencies. Although net interest income rose marginally from ₹2.86 billion to ₹3.03 billion, it failed to offset losses. Financial challenges hinder credit extension, innovation and inclusion. Declining net interest margin (from 4.8% to 2.3%) indicates reduced profitability, while negative return on assets (ROA) and return on equity (ROE) highlight shareholders’ return struggles, threatening investor confidence and capital inflow.
Although the cost-to-income ratio (CIR) improved from 124.8% to 99.1%, it remains high, indicating the need for better cost management. The PMs of -23.9%, -20.3% and -2.2% highlight ongoing profitability challenges, emphasizing the need for continuous efforts in optimizing asset utilization, cost management and core banking income.
IV. Data Definition and Statistical Tools
Defining Data
A set of variables is defined to capture various financial aspects of a PB in Table A2, aiding in the analysis of its performance and financial health. The table encompasses both dependent and explanatory variables. The dependent variables include ‘return on assets’ and ‘profit margin’. ‘Return on assets’ is calculated as the ratio of net income to the average assets, expressed as a percentage (Sharma & Kumar, 2017). This metric assesses how efficiently a company generates earnings from its assets. Meanwhile, ‘profit margin’ is determined by dividing net income by average sales and is also expressed as a percentage (Floros & Tan, 2012). It provides insights into the PB profitability relative to its sales revenue. The explanatory variables consist of several factors that shed light on different dimensions of the company’s operations and financial structure. ‘Log (assets)’ refers to the logarithm of the bank’s total assets, indicating the magnitude of its asset base, that is, cash and balances with the RBI, balance with banks and money at call on short notice, investments, advances, fixed assets and other assets (RBI, 2021). ‘Banking business’ is represented as the ratio of deposits to assets, multiplied by 100. This variable comprehends the extent of company’s assets that are used for banking activities. A measure of ‘liquidity’ is the ratio of liquid funds to assets expressed as percentage (Floros & Tan, 2012). Liquid funds comprise of cash, balance with the RBI, balance with banks, money at call and short notice, and government securities. This variable provides information on the bank’s capacity to fulfil immediate financial obligations. ‘Leverage’ is expressed as the percentage of paid-up share capital in relation to total assets (Sharma & Kumar, 2017). It showcases the proportion of the bank’s assets that are financed through equity shares, providing an indication of its reliance on external funding sources. Finally, ‘efficiency’ is calculated by the ratio of OEs to operating income (OI) multiplied by 100 (RBI, 2021). This variable gives an understanding of a banks’ operational efficiency by highlighting the relationship between its costs and revenues. Overall, Table A2 presents a comprehensive set of variables that collectively offer a detailed perspective on various financial and operational aspects of the banks under analysis. These variables serve as valuable tools for assessing the bank’s performance, profitability, liquidity, financial structure and operational efficiency.
This study uses secondary data collected from the annual report of specific PBs. To assess the performance of PBs, annual data spanning from 1 April 2019 to 31 March 2022 have been utilized because it involved the challenges of the COVID-19 pandemic in the banking industry as well as in Indian economy. In response to the pandemic, the central bank played a crucial role in safeguarding banks’ interests, particularly their balance sheets, by providing essential liquidity support and stabilizing the financial sector. Additionally, the Government of India set up the National Asset Reconstruction Company Limited (NARCL) to assist in the recovery process and alleviate stress on banks’ balance sheets (RBI, 2021). A total of six PBs, namely Airtel Payments Bank, India Post Payments Bank (IPPB), Fino Payments Bank, NSDL Payments Bank, Jio Payments Bank, Paytm Payments Bank, have been functioning in India. But they commence their business at different time period. Although we construct a balanced panel dataset for analysis because this article majorly evaluates the performance of PBs since pandemic and its impact on financial services (i.e., accept demand deposit up to 2 lakhs, provide remittance services, mobile payments, transfers, purchases and additional banking services such as ATM/debit cards, online banking and third-party fund transfers). The names of payments banks included in analysis are mentioned earlier. For the dependent variable, two key indicators are used to assess the performance of banks: PM and ROA (Berger & Bouwman, 2013; Dietrich & Wanzenried, 2014; Petria et al., 2015; Sharma & Kumar, 2017). Regarding the explanatory variables, the logarithm of total assets has been normalized (Sharma & Kumar, 2017). Additionally, efficiency—measured by the ratio of OEs to OI—is considered to account for variations among banks. Leverage is included to reflect financial resilience and stability. Similarly, factors such as banking business and liquidity are incorporated to evaluate their potential impact on the performance of PBs (Sharma & Kumar, 2017).
The study employs several banking parameters that indicate the performance of PBs in terms of financial metrics over time. A dynamic statistical panel model is developed, where the first lag of the dependent variable is used as an explanatory variable. In dynamic panel models, the key conditions include a large number of cross sections and a short time frame. Therefore, this study employs seven major observations such as ROA, net profit, log (assets), banking business, liquidity, leverage and efficiency, which majorly demonstrate banks’ financial metrics to measure its performance. Generalized method of moments are a widely used and recognized effective method for generating efficient estimates that account for endogeneity. The GMM approach utilizes lagged values of dependent variables as instruments, both in levels and in differences, along with lagged values of other regressors that address endogeneity issues. This is referred to as difference GMM (Arellano & Bond, 1991). However, these methods become inefficient when the instruments are weak, as highlighted by Arellano and Bover (1995) and Blundell and Bond (1998). Although a system GMM estimator is developed that involves both lagged levels and lagged differences. Roodman (2006) explains that the problems of endogeneity, unobserved heterogeneity, autocorrelation and profit persistence can be calculated by difference and system GMM. However, Bond (2006) noted that if a unit root is present, difference GMM may be biased. In contrast, system GMM estimators provide more accurate results. Bond also indicated that when the standard error is small, one-step GMM outperforms its two-step alternatives. Consequently, GMM is commonly employed to assess the performance of companies, organizations and the banking sector. Relevant studies have applied GMM to evaluate the performance of the banking industry (Floros & Tan, 2012; Sharma & Kumar, 2017). Therefore, our research utilizes one-step system GMM to perform the statistical analysis model developed by Sharma and Kumar (2017). The GMM model is elaborated upon in the statistical model section.
Statistical Model and its Estimation
Generalized Method of Moments (GMM)

where
In Equation (1), yi, t describes the dependent variable of the ith merged banks at the tth time period; yi, t – 1 depicts the lagged endogenous variables; Xi, t is a matrix that explains the values of independent variables; η i is the unobserved effect of merged banks and ω i, t represents idiosyncratic shocks. Hence, all specifications are evaluated using one-step system GMM.
The explained specification of Equation (1) is as follows:
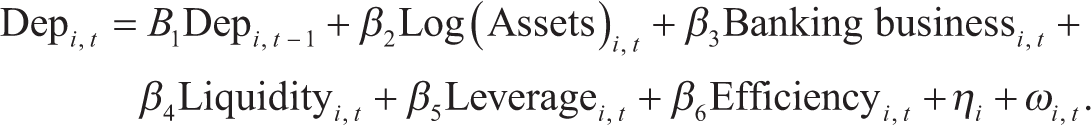
In the above equation, Depit represents the dependent variable, which is taken as ROA and PM, separately, with a common set of independent variables as previously mentioned.
Dynamic Ordinary Least Square (DOLS)
DOLS can be used to analyse the implication of explanatory variables of a dependent variable for the long-run relationship of the performance of PBs. Kao and Chiang (2000) proposed the dynamic ordinary least squares (OLS) techniques to examine the persistent dimension of cointegration for non-stationary panels. Ullah et al. (2018) recommended that the GMM is an effective strategy to dealing with endogeneity since the dynamic panel estimating measures arguments that the dependent variables lag as explanatory factors. The lagged values of the dependent variables are employed as control instruments for the endogenous relationship. Nonetheless, DOLS subsequently incorporates leads and lags to solve the endogeneity problem. Nguyen et al. (2020) and Nasir et al. (2019) argued that DOLS has extensively been implemented in economics research. These estimators regulate the fundamental pooled OLS for serial correlation and regressor endogeneity, which are typical in long-run relationships. The DOLS approach offers reliable estimation even when there are issues of endogeneity and interdependence among the explanatory variables (Nazlıoğlu, 2010). The co-integration test would be performed to determine whether the variables under exploration have a long-term relationship. The DOLS estimator is a purely parametric algorithm designed to be a computationally suitable replacement for the fully modified OLS panel (Pedroni, 2004; Phillips & Moon, 2000). But Maeso-Fernandez et al. (2006) determined that the degree of freedom of the DOLS estimator is constrained by leads and lags.
The DOLS approach involves the following model specification:


Where
ROA it = the return on assets for PB i in year t, serving as a dependent variable.
ROE it = the return on equity for PB i in year t, acting as a dependent variable.
αi = individual fixed effect for each bank.
β1 and β2 = coefficients associated with the independent variables.
ΣΥΔΧit – k= the inclusion of leads and lags of the first differences of the independent variables Xit , which account for dynamics and help to eliminate endogeneity issues.
εit= the error term, assumed to be white noise.
The choice of DOLS over other econometric methods such as OLS or fixed effects/random effects is due to its ability to account for both endogeneity and serial correlation in a cointegrated panel data framework. The inclusion of lags and leads of the independent variables makes DOLS more robust to deal with issues commonly encountered in panel data, such as omitted variable bias and autocorrelation, providing more reliable and unbiased long-run coefficient estimates.
V. Empirical Results
Descriptive Results
Descriptive statistics for all variables are presented in Table A3, highlighting that the dependent variables commonly referred to as profitability ratios in the banking industry, specifically ROA and PM, demonstrate significant improvement based on mean and median values of central tendency, suggesting a positive overall trend in the bank’s financial performance. For instance, the study found that while average ROA remained negative, the extent of losses reduced over the years (2020: -13.5%; 2022: -3.8%). Similarly, OEs continued to rise, indicating the high costs associated with expanding services to underserved regions. These findings align with prior studies (e.g., Floros & Tan, 2012; Sharma & Kumar, 2017) that emphasize that achieving profitability in emerging banking models often entails significant initial costs. For all dependent variables (i.e., profitability measure of the banking industry) standard deviation displays increasing/decreasing values in the case of ROA; however, PM depicts declining tendency. The standard deviation, which measures the dispersion of data points around the mean, presents interesting insights. For the ROA variable, the standard deviation appears to decrease, implying a more consistent performance over time. In contrast, the PM demonstrates a declining tendency in terms of standard deviation, suggesting a narrowing range of profitability values. However, explanatory variables such as efficiency and banking business have improved their performance concerning the mean, median and standard deviation from 1 April 2020 to 31 March 2022. The performance of banking business has increased in both mean and median for small finance banks (Sharma & Kumar, 2017). Moreover, these banks’ ability to generate deposits increased steadily (banking business ratio: from 17.9% in 2020 to 37.4% in 2022), reflecting growing customer trust. This trend aligns with reports highlighting the shift towards digital banking solutions post pandemic (RBI, 2022). Additionally, the independent variable log (assets) demonstrates an enhancement in terms of mean, median and standard deviation, suggesting positive developments in terms of asset management and growth. Liquidity in terms of mean and median display increasing trends, but in the case of standard deviation, it declines throughout the year. The declining standard deviation suggests that the dispersion of liquidity values has reduced, possibly indicating a more stable liquidity position. On the other hand, leverage records a diminishing trend with respect to mean and median, implying a reduced reliance on external funding sources. Interestingly, the standard deviation for leverage increases, indicating a growing dispersion of leverage values, which could have implications for the bank’s risk profile and financial stability.
It is important to ensure that the variables exhibit stationarity before conducting regression analysis. Non-stationarity in regression analysis can lead to spurious results (Sharma & Kumar, 2017). To validate this claim, a panel unit root test was performed, which enabled the rejection of the null hypothesis of a unit root, as shown in Table A4. In the light of this, we have included the main variables at their level.
Results of Generalized Method of Moments
This study uses one-step system GMM for measuring the performance of PBs from 1 April 2019 to 31 March 2022. The variables that determine the performance and profitability of PBs are demonstrated in Table A5. As mentioned earlier, we have considered two dependent variables separately: NPM and ROA. Initially, the estimate for the lagged dependent variable (L1. Dep) is positive for both profitability measures, but it is not statistically significant, indicating that past profitability may not have a significant impact on current profitability measures. Furthermore, log (assets) produces positive but insignificant results for all profitability metrics. This implies that the size of assets alone may not be a significant determinant of profitability for PBs during the specified period. Banking business and liquidity are positive across all model estimators, and furthermore, these factors were found to be statistically insignificant in relation to both PM and ROA. Payments banks showed steady improvement in liquidity ratios over the three-year period (from 76.2% in 2020 to 86.1% in 2022), reflecting growing resilience. However, the lack of a significant impact on profitability suggests that liquidity management alone is insufficient to drive performance improvements. This finding is consistent with prior studies which argue that the profitability of emerging banking models depends more on efficiency and innovation than on traditional liquidity measures (Sharma & Kumar, 2017). This inferred that the nature of banking business and liquidity conditions did not have a significant impact on the profitability of PBs during the analysed period. Patra and Rajdeep (2023) found that while Basel III liquidity coverage ratio positively affects Indian PSBs profitability, its interaction with advances has a negative impact, with no significant effects from economic policy uncertainty, gross domestic product or deposits. But PBs demonstrate an increasing trend in deposits on liability sides; it accounts 27.4% in 2019–2020, which was more than double from 2018–2019 despite ₹100 thousand per account (RBI, 2020). Share of deposits in total liabilities increased to 42.4% (2021–2022) from 36.8% in 2020–2021 (RBI, 2021, 2022). Also, the customer base of PBs had registered a significant growth on year-on-year basis: IPPB crossed 50 million users, Paytm Payments Bank had over 64 million customers while Airtel Payments Bank had over 60 million consumers till FY2022. Among all, Paytm Payments Bank had the highest users, followed by Airtel Payments Bank and IIPB. It portrays that increment in customer/user base signify those banks connecting unbanked, underbanked and underserved population. This significant accomplishment of reaching millions of customers demonstrates the trust and confidence that the people of India have in PBs. These banks are dedicated to achieving the robust financial inclusion network, particularly in India comprising both rural and urban India, also to providing a cost-effective, simple, easy and secure digital ecosystem across country. The establishment of PBs was a strategic initiative aimed at closing the financial gap, empowering underserved populations and promoting financial inclusion by integrating traditional and digital banking services. By prioritizing financial inclusion, PBs have been instrumental in empowering individuals from various demographics, including those in remote and underserved regions. Therefore, an increase in the customer base leads to an increase in the number of transactions that generate huge deposits in PBs, meaning that all three are positively correlated with each other. In contrast, variables such as leverage and efficiency found to be positive for all, but leverage is significant in the case of ROA. Efficiency expressed as the cost-to-income ratio, which was enhanced while the NIM reduced during 2019–2021 (RBI, 2020, 2021). Despite an improvement in efficiency for the fourth consecutive year, PMs remained narrow even for successful PBs, and the NIM declined for the third consecutive year (RBI, 2022). Efficient cost structures are vital for PBs, given their reliance on fee-based revenues (Sharma & Kumar, 2017). Despite improvements, net PMs remain negative (–20.3% in 2021 to –2.2% in 2022), indicating the need for further cost optimization. Operating in a competitive landscape, PBs face high costs, mirroring global trends in digital banking (Ryu, 2018). On the other hand, the impact of leverage was statistically significant only in the case of ROA. This indicates that higher leverage levels could contribute to improved ROA, but it may not necessarily affect the PM. The findings indicate that leverage positively impacts ROA but has a negative relationship with PMs. This dual effect suggests that while leverage supports asset utilization, it may increase financial risks, leading to narrower margins. Payments banks face a unique challenge of balancing capital adequacy with operational needs, a point echoed by Floros and Tan (2012). Performance metrics such as PM and ROA remained negative, although the extent of losses reduced (2020–2021). Although there was a rise in both interest and non-interest income, PMs faced losses due to high OEs (2021–2022). Other performance metrics, such as ROA and PMs, stand negative during the year, but the extent of losses declined considerably (RBI, 2021, 2022). The reason why PBs’ profitability indicators stayed negative all the year may come into question. Because PBs, who employ technology to provide basic banking services to underserved areas of society, are constantly under pressure to innovate in order to remain competitive, particularly against BigTech competitors. As a result, their profitability is affected because of higher operational costs and investment requirements than other banking industry segments (RBI, 2021, 2022). Overall, the results highlight the significance of bank performance over the past three years. Therefore, all explanatory variables yielded a positive outcome, emphasizing the importance of PBs for those factors determining the profitability of bank operations. Payment banks have registered negative ROA and high OEs. Few PBs have registered their business as profitable. Three PBs out of six existing PBs record profitable business, such as Airtel Payments Bank, Fino Payments Bank and Paytm Payments Bank.
The Sargan and Hansen tests were used to assess the validity of instruments in GMM estimations. The Sargan test, with a p value of .965, confirms valid instruments, as the null hypothesis cannot be rejected. The Hansen test, with a p value of 1.000, further supports instrument validity. The Arellano–Bond autocorrelation test showed no second-order serial correlation in residuals, validating the dynamic GMM model and confirming the instruments’ reliability for consistent estimation, as required by Arellano and Bond (1991).
Results of DOLS
The DOLS method accounts for potential cointegration between the dependent variable (ROA and PM) and the explanatory variables (banking business, efficiency, leverage, liquidity, log of assets) by including both leads and lags of the independent variables. This approach helps to mitigate issues of endogeneity and omitted variable bias, making the results more robust in long-run relationships. The DOLS estimation offers compelling evidence that efficiency positively and significantly affects ROA, indicating that improved operational efficiency leads to a rise in ROA. This result is consistent with the expectation that banks with higher efficiency achieve better financial performance, whereas leverage negatively affecting ROA indicates that higher leverage levels reduce profitability, supporting the view that banks with higher leverage may face higher financial risk, leading to lower returns on assets. The banking business, liquidity and size (log of assets) are not statistically significant, implying that they do not have a clear impact on profitability within the sample period. The model explains over 90% of the variance in ROA suggesting that the model has strong explanatory power, and the Wald test confirms that the variables are jointly significant. (Since the p values for both the chi-square statistic and the F-statistic are less than .05, we reject the null hypothesis. This indicates that the independent variables are jointly significant in explaining the variation in ROA, confirming that the model is statistically valid.). Additionally, the residuals are normally distributed, further supporting the reliability of the results. (Since the p value exceeds .05, the null hypothesis of normality cannot be rejected. This indicates that the residuals of the model are normally distributed, which satisfies one of the key assumptions of regression analysis and supports the validity of the model. Normally distributed residuals imply that the model is well specified and reliable for inference.)
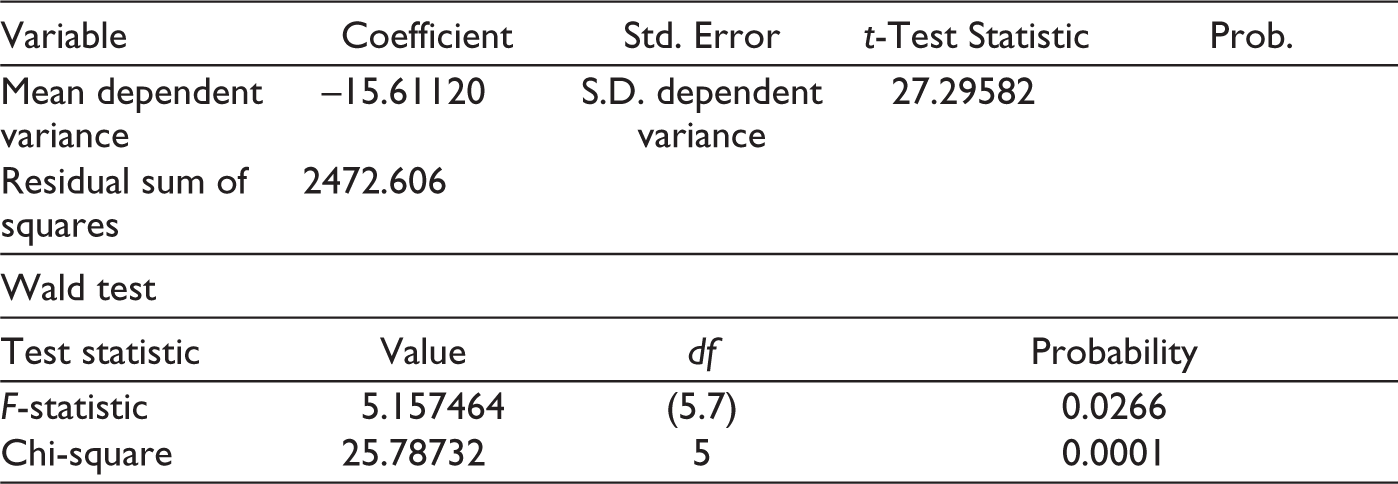
The results from the DOLS estimation provide insights into the impact of independent variables on the PM. The model demonstrates strong explanatory power with an R2 of 80.48%, suggesting that the chosen variables account for a substantial portion of the variation in profit margin. However, the adjusted R2 of 52.59% indicates that the explanatory variables account for the variability of the dependent variable in the model. Among the key variables, leverage has a significant negative effect on PM (coefficient: -1.2418; p value: .0152), aligning with financial theory that higher leverage increases financial risk, leading to lower profitability. In contrast, banking business, efficiency, liquidity and log of assets have statistically insignificant effects on PM, as indicated by their high p values (all > .05). This suggests that these factors may not have a significant direct impact on profitability during the sample period. The normality test (Jarque–Bera statistic: .285, p value: .867) depicts that the residuals of the model are normally distributed, supporting the validity of the regression model. The Wald test (F-statistic: 5.157; p value: .0266) rejects the null hypothesis that all coefficients are jointly zero, confirming the overall significance of the model. Despite the insignificance of some individual variables, the model as a whole provides a robust explanation of the determinants of PM in PBs.
For the DOLS model, the residuals were tested for normality using the Jarque–Bera statistic, which yielded p values exceeding the .05 significance level. This supports the normal distribution of residuals, a key assumption for valid inference. Additionally, the inclusion of leads and lags in the DOLS specification mitigates endogeneity concerns, ensuring unbiased and efficient estimates (Kao & Chiang, 2000). The Wald test was employed to assess the joint significance of the coefficients in the models. For both GMM and DOLS, the null hypothesis that all coefficients are jointly zero was rejected, with F-statistics of 15.10 (GMM) and 5.16 (DOLS). This confirms the collective explanatory power of the independent variables in determining the dependent outcomes.
The results of these diagnostic tests affirm the validity of the econometric models used in this study. The Sargan and Hansen tests validate the instruments employed in the GMM model, while the Arellano–Bond test ensures the absence of serial correlation. Similarly, the robustness of DOLS estimations is supported by the normality of residuals and inclusion of leads and lags to address endogeneity. These findings provide confidence in the reliability of the results and reinforce the relevance of the policy implications drawn from this study.
VI. Conclusion and Policy Implication
This study delves into a comprehensive estimation of the financial performance and profitability of payment banks (PBs) in India over a specified period. For this, a rigorous empirical approach was employed by utilizing panel data and the generalized method of moments (GMM) and dynamic OLS (DOLS) estimation technique to investigate the various factors like ROA, net profit, log (assets), banking business, liquidity, leverage and efficiency, which influences the performance of PBs, to shed light on the financial health and its performance. The empirical findings of GMM reveal noteworthy insights into the financial landscape. Variables such as efficiency and leverage were found to have a favourable effect on profitability, while others such as asset size and nature of banking activity depicted less significant relationships. Notably, the lagged dependent variable has no discernible impact on current profitability, highlighting the dynamic and shifting character of the financial performance. On the other hand, DOLS depicts robust evidence on the determinants of profitability for PBs. Efficiency is a key driver of ROA, with improved operational efficiency leading to higher profitability. In contrast, leverage negatively impacts both ROA and PM, indicating that higher leverage increases financial risk and reduces profitability. The banking business, liquidity and size (log of assets) are statistically insignificant for both ROA and PM, suggesting no clear influence on profitability within the sample period. Overall, the DOLS results provide a comprehensive understanding of the factors affecting profitability in PBs, with efficiency and leverage emerging as key determinants. The study recognizes that PBs play a crucial role in promoting financial services, promoting digital transactions and assisting India’s larger economic development objectives. Payment banks have demonstrated a significant improvement in operational efficiency, as evidenced by metrics such as the ROA and the cost-to-income ratio, despite net profit/loss statistics over the analysed periods. It is crucial to be aware of the study’s limitations that include the potential impact of unobserved factors and external macroeconomic circumstances that could have impacted the profitability. To preserve the long-term financial health and viability of these institutions within the larger financial ecosystem, the findings highlight the need for ongoing efforts to improve operational efficiency, reduce expenses and optimize profitability.
This study emphasizes the significant impact of operational efficiency on profitability and recommends adopting advanced digital technologies, streamlining processes and incentivizing technology adoption through grants or tax benefits. Additionally, balanced capital structures are crucial for managing leverage, reducing financial risks and ensuring long-term sustainability. Policymakers should provide tailored leverage guidelines and encourage equity funding. Although liquidity did not significantly impact profitability, enhancing liquidity buffers and diversifying funding sources remain vital for operational stability during disruptions. The positive link between banking activities and profitability highlights the need for deposit mobilization in underserved areas via digital platforms and financial literacy. Payments banks play a key role in inclusion, warranting policy flexibility for limited credit activities like micro-lending. For sustainability, they should explore new revenue streams and cost optimization, while policymakers consider revising caps like the ₹200 thousands deposit limit. Though this study focuses on the post-COVID period, its policy insights remain crucial for both immediate challenges and long-term growth.
Footnotes
Declaration of Conflicting Interests
The authors declared no potential conflicts of interest with respect to the research, authorship and/or publication of this article.
Funding
The authors received no financial support for the research, authorship and/or publication of this article.
Appendix
Results of Profit Margin Using DOLS.
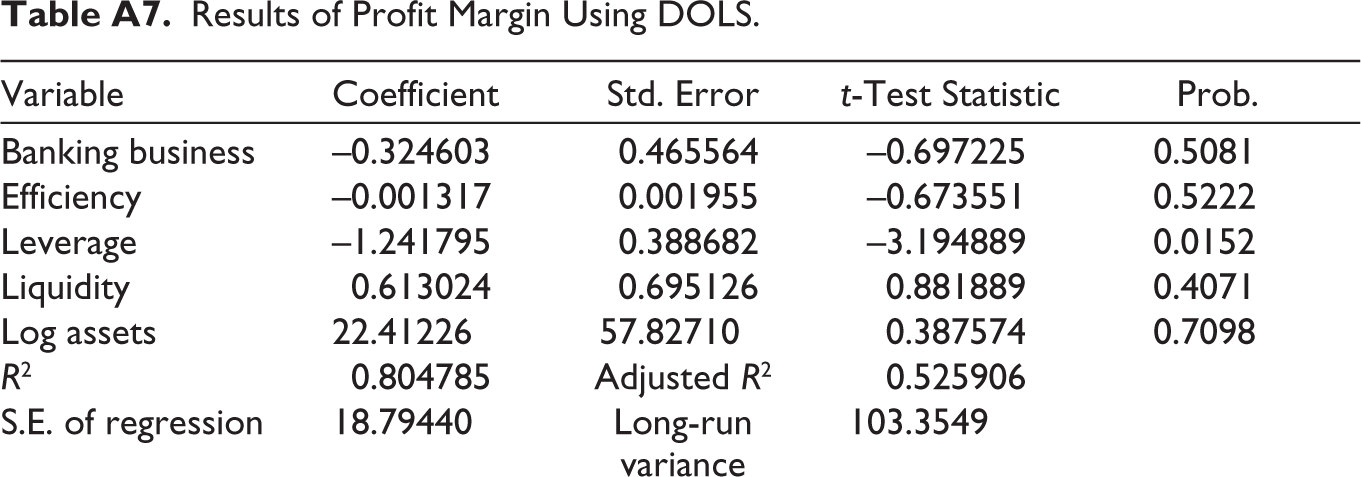
| Variable | Coefficient | Std. Error | t-Test Statistic | Prob. |
| Banking business | –0.324603 | 0.465564 | –0.697225 | 0.5081 |
| Efficiency | –0.001317 | 0.001955 | –0.673551 | 0.5222 |
| Leverage | –1.241795 | 0.388682 | –3.194889 | 0.0152 |
| Liquidity | 0.613024 | 0.695126 | 0.881889 | 0.4071 |
| Log assets | 22.41226 | 57.82710 | 0.387574 | 0.7098 |
| R 2 | 0.804785 | Adjusted R2 | 0.525906 | |
| S.E. of regression | 18.79440 | Long-run variance | 103.3549 | |
| Mean dependent variance | –15.61120 | S.D. dependent variance | 27.29582 | |
| Residual sum of squares | 2472.606 | |||
| Wald test | ||||
| Test statistic | Value | df | Probability | |
| F-statistic | 5.157464 | (5.7) | 0.0266 | |
| Chi-square | 25.78732 | 5 | 0.0001 | |