






Abstract
A large number of small-holder dairy farmers (SDFs), with low yields and low input costs, have led to an inflated, inefficient livestock in India, with a much greater carbon footprint than necessary. The adoption of cross-breeding by SDFs should lead to increased yields. However, cross-breeding is not popular in India as in many other less-developed economies where SDFs dominate milk production. This article investigates whether market incentives are enough to induce the more efficient technique of cross-breeding among SDFs in a fairly competitive environment. We conduct a detailed primary survey on 300 SDFs from Haryana state in India to understand the choices determining breed composition in the herd. Using a system instrumental variable approach to deal with endogeneity and simultaneity, we estimate the impact of a measure of market exposure (based on milk sales) on the household’s herd composition. Our results indicate that market exposure does not automatically lead to adoption of cross-breeding. Farmers generally rear buffaloes and cross-bred cattle similarly in terms of feed and medical care, leading to a loss of potential yield of the cross-bred animals.
Introduction
The small-holder dairy farmer (SDF) is an integral part of the milk production ecosystem in most developing countries. This is a farmer who has small livestock and uses low-cost inputs to generate profits, income and sustenance for their households. According to Hemme & Otte (2010), there are more than 150 million such households engaged in milk production all over the world. Although such farmers tend to be very economical, they are not able to exploit the economies of a larger scale. As such, overall efficiency, average milk yields and environmental sustainability tend to suffer (Herrero et al., 2013).
A good example of this problem is India. India is today the largest producer and consumer of milk in the world; however, the dairy sector is nowhere near its potential. According to the annual report of the Indian Department of Animal Husbandry and Dairying for 2022–2023, the average yields of cross-bred cattle, indigenous cattle and buffaloes are respectively 8.32, 4.07 and 6.62 kg of milk per day. At the same time, average milk yields in the United States is 30 kg/day, and in the United Kingdom, it is 22 kg/day (Mani & Beillard, 2021). This large gap in milk yield is largely driven by the low genetic potential of Indian herds, as well as factors such as poor nutrition or feed management, poor farm management practices, ineffective veterinary and extension services and, inefficient implementation of breed improvement programmes (Alderman et al., 1987; Rajendran & Mohanty, 2004). Most of these issues are typical for SDFs who tend to dominate the milk production sector in the country. As a consequence, dairy operations in India can be described overall as large but inefficient. A key factor generating this inefficiency is believed to be the inadequate use of cross-breeding. Theoretically, the same levels of milk production could be achieved using much smaller livestock with fewer inputs if cross-breeding was adopted and implemented properly (Gupta & Dasgupta, 2020).
In addition to economic efficiency, smaller, more cross-breed-based livestock is also desirable from the point of view of the environment. Livestock production is the second largest contributor to global methane emissions (Kirschke et al., 2013), whose contribution to climate change is more than half that of carbon dioxide (Shine & Sturges, 2007). India is the second largest emitter of methane from livestock production in the world (FAOSTAT), with estimated methane emissions from enteric fermentation of approximately 14 million tons in 2021, which represents 13.8% of global methane emissions from enteric fermentation. This is a significant source of greenhouse gas emissions and should not be ignored. The scientific literature on methane emission from enteric fermentation identifies two key factors that impact the emission yield per unit of milk produced. These are cattle breeds and cattle feed. Cross-bred cattle and buffaloes emit less methane per unit of milk produced than indigenous breeds (almost 25% lower per litre; see Swamy & Bhattacharya, 2006).
Studies on the adoption of cross-breeds from different parts of the world suggest that cross-breeds are better performers in terms of yield. As such, we expect the technology of cross-breeding to be associated with a lower average cost of production by milk producers. This would imply that over time, as milk demand expands, more and more producers would adopt cross-breeding as they gravitate to their long-run competitive equilibria. However, this has not been the case in India. Despite the government’s active promotion, cross-breeds only made up about 13% of total livestock, according to the latest livestock census (2012). This low adoption rate would suggest that milk producers in India are somehow not subject to the expected market incentives encouraging cross-breeding, or that there are other factors that prevent the adoption of cross-breeding despite market incentives. These factors in the latter scenario are well studied in the literature on technology adoption and include access to credit, technical knowledge and network effects, among others (see Besley & Case, 1993; Feder et al., 1985). It is important to understand which of the two scenarios we are facing, since the policy response to the two may have to be different. In this article, we investigate this question. First, we assume that we are in the latter scenario where incentives exist but are drowned out by the effects of other factors, and we test if the agents of market incentives, like prices and commercial motivation, indeed have any effect on adoption after controlling for other factors. In the latter part of our article, we also explore the possibility that we are in a scenario where the market incentives are not applying to farmers and comment on why this might occur.
The scope of our study will be the state of Haryana and, in particular, the district of Sonipat. Haryana, though a relatively small state, has a significant position in the Indian dairy farming spectrum. The state is home to Murrah buffalo, which is widely considered the best breed of water buffalo in the country. According to statistics provided by the National Dairy Development Board, in 2017–2018, the state had an aggregate milk production of 9.8 million tons. This high level of production, along with its small size, makes it the second highest in terms of per-capita milk availability, similar to the highest levels achieved by any country in the world (according to data from the Food and Agriculture Organization). As such, we expect that our study, based in the relatively richer agricultural areas of India (Haryana), is likely to show greater adoption of cross-breeding.
Our study uses a detailed primary survey of 300 dairy farming households from 78 different villages in the district of Sonipat in Haryana. We collect information on household characteristics, village-level amenities, details of dairy operations and sources of knowledge and information about dairy practices. We use these data to empirically estimate the importance of various socio-economic determinants of the composition of the livestock maintained by these households, with special emphasis on measures of exposure to markets/market incentives. Seemingly unrelated regressions and system instrumental variable approaches are used, bearing in mind that the households jointly determine the decision to keep and maintain different breeds.
Our analysis yields three key results. First, we find that cross-breeding adoption has not been successfully undertaken in the district of Sonipat in Haryana. Only 13% of the total animal population is cross-bred (which is close to the national average).
Second, when we look for observable characteristics of farmers that can predict the adoption of either of the three breeds (cross-bred, indigenous and buffalo), we find that the primary source of income and source of information are the most important. When the farmer’s main income is from livestock, they are more likely to have at least one buffalo and are less likely to have at least one cross-bred animal in their herds. In addition, when the household’s source of knowledge on livestock-related matters is only their family, they are much more likely to have at least one buffalo. As in other studies, we also observe that higher land ownership and larger household size, which are all indicators of wealth, are associated with a higher probability of owning cross-breeds.
Last, we show that the agents of market-based incentives do not encourage higher adoption of cross-breeds. Using a system of equations corresponding to the three breeds, we demonstrate that milk prices only positively affect the proportion of buffaloes in the herd. We also use household milk sale information to demonstrate that households that are less likely to care about market incentives are most likely to have higher proportions of cross-breeds in their herd. This is surprising as the higher yields of cross-breeds should have incentivised commercial-minded households to comparatively higher rates of adoption. The likely explanation for this counterintuitive result is the fact that we are facing the alternate scenario in which the agents do not feel strong market-based incentives to encourage cross-breeding. This seems likely as we find no significant differences in milk prices or in yields between cross-breeds and buffaloes. The difference remains insignificant even after we control for inputs, measures of caregiving and animal characteristics like age, length of dry period and others. Our results suggest that cross-breed animals are not able to perform up to the standards observed in controlled settings. Possibly, this is due to the use of similar quantities and quality of inputs for cross-breeds and buffaloes. Cross-breed animals in Haryana seem to be in a low-input, low-productivity trap, and market-based incentives are not enough to break this.
This article is structured as follows: Section II comments on the background and related literature, Section III discusses the data used, Section IV states the estimation strategy, Section V reports results, Section VI discusses the results in the context of the main research question and Section VII concludes. More details about our survey are available in the data appendix available online.
Literature Review
In this article, we conceptualise the household decision to adopt cross-breeding as a technology adoption choice. Accordingly, our research question is grounded in the extensive literature on agricultural technology adoption by rural households. This literature emphasises that adoption decisions are shaped not only by profitability or market incentives, but also by factors such as information diffusion, risk perceptions and network externalities. The comprehensive survey by Feder et al. (1985) highlights the predominant theoretical framework in this field, which models adoption as a dynamic optimisation problem under uncertainty. Within this framework, the introduction of a new technology constitutes a shock that disrupts the existing equilibrium and gradually shifts producers toward a new long-run equilibrium that may involve adoption. Over time, farmers learn about the technology, update their beliefs and weigh trade-offs related to risk, information availability and credit constraints. Viewed through this lens, the low adoption of cross-breeding in India can be interpreted as the outcome of multiple interacting factors, including external constraints such as imperfect information and limited access to credit (which we account for in our empirical analysis), as well as endogenous outcomes, such as a mismatch between potential yield gains and realised performance, which we observe in our data.
The importance of information networks is demonstrated in Conley & Udry (2010), who showed that information spreads via informal farmer networks and that peers’ experiences significantly affect individual adoption decisions. The absence of social network inputs, such as exposure to successful cross-breed adopters or membership in cooperatives, may explain why market incentives alone fail to induce adoption.
This study is primarily looking to understand the adoption of cross-breeding among rural dairy farmers in India. As such, we draw from another large body of literature that analyses the nature and characteristics of milk production in India. India is the largest producer of milk in the world. Large proportions of this production come from households with 2–3 animals rather than from larger commercial dairy enterprises. This structure of the Indian dairy sector is well-documented (Alderman et al., 1987; Banerjee, 1994) and is typical of other less-developed economies (Hemme & Otte, 2010; Herrero et al., 2013). According to Rajendran & Mohanty (2004), in 1992, more than 67% of the very substantial livestock in India was held by such small farmers who produced about 80% of the milk. Another characteristic of the Indian dairy sector is the very low average yields compared to global standards. Cross-breeding has long been suggested as a solution to these issues, especially for small milk farmers (Al Kalaldeh et al., 2021). Changing the genetic structure of the Indian livestock was one of the main strategies for Operation Flood, the largest government initiative to make dairy commercially lucrative, implemented in India during the 1970s (Alderman et al., 1987; Rao et al., 1995). Apart from the purely commercial reasons for the adoption of cross-breeding, there is also the fact that cross-bred animals produce a much lower amount of methane per kilogram of milk produced (Swamy & Bhattacharya, 2006). For this reason, converting the livestock genetically in favour of cross-breds (as envisaged in Operation Flood) could substantially lower the emission of greenhouse gases from this sector (Gupta & Dasgupta, 2020).
For all its merits, cross-breeding has not been adopted by Indian farmers to the extent that was expected. The cross-breeding programme began in earnest in 1963 with the Intensive Cattle Development Project (ICDP). However, even after 20 years, the percentage of cross-bred cattle in the country was about 4.65 according to the Indian Livestock Census 1982, as reported in Rao et al. (1995). In fact, Kerala was the only state to have seriously implemented the programme with a penetration of 46.92%. According to the latest 2012 Livestock Census, about 13% of all cattle and buffaloes were cross-bred cattle. This motivates our main research question, which is to understand why the competitive market has failed to induce the adoption of cross-breeding in our survey area. The literature on the determinants of the adoption of cross-breeding comes from both India and other developing countries, where cross-breeding has been encouraged to improve milk productivity. For example, a couple of studies from Ethiopia have analysed the adoption of cross-breeding along with other modern farming practices. The general conclusion is that cross-bred animals are better performers. However, they are usually adopted by richer farmers who are more informed with access to funds and technical know-how (Dehinenet et al., 2014; Mekonnen et al., 2010). Similar studies also exist for Bangladesh, for example, Quddus (2012) and Quddus (2017), which have similar findings. In the Indian context, country-wide studies of the adoption of cross-breeding are rare. However, region-specific work has been done. For example, Malik et al. (2005) for the state of Uttar Pradesh, Khode et al. (2016) and Basunathe et al. (2010) for the Vidarbha region in Western India and Bayan & Dutta (2017) for the state of Assam. These articles are usually optimistic about the impact of the adoption of cross-breeding on farmers’ incomes. Lack of knowledge, facilities and resources are reasons for non-adoption. Given the findings of this literature, it is a bit surprising that cross-breeding is not so prevalent in our area of study, which is the state of Haryana. Given the relatively richer farmers and the state’s very well-developed dairy farming sector, one would presume that the basic conditions for adopting cross-breeding are already present here.
Some other general and qualitative studies provide some insights as to other/alternative reasons for the non-adoption of cross-breeding. For example, Basu (2009) compared the penetration of cross-breeding across two villages, in two different states, Gujarat and Madhya Pradesh. She concluded that the difference in adoption is not just about the performance of cross-bred animals but also depends on the social support system of the farmers as well. Other articles that discuss the support or organisation behind the adoption of cross-breeding are Leroy et al. (2016) and Roschinsky et al. (2015).
This study also draws from the literature that studies the motivation of Indian small dairy farmers to maintain livestock. The most obvious motivation here is either real or notional profits. As long as keeping animals at home allows the household to produce milk at a lower cost than the market price, it makes sense to maintain livestock. However, the pure economic motive is questioned in some studies. For example, Anagol et al.’s (2017) showed that returns to maintaining cattle and buffaloes for rural households turn out to be substantially negative once they take into account the costs of their own labour input. The authors then go on to pose the question, ‘Why do Indian households persist with dairy farming’? One possible explanation suggested is the religious and cultural importance of the cow in India for certain religious groups. Therefore, households may want to hold on to cattle even if economic returns are negative. The empirical basis for this assertion has later on been challenged by Attanasio & Augsburg (2018), who pointed out that Anagol et al.’s (2017) result may have been obtained due to the timing of their survey. Returns from livestock are variable across years and even within the year. There are also other theoretical studies that contest the religious motive as the driving force for dairy farming (Harris et al., 1966). Nevertheless, the commercial viability of the small farmer is still a matter of debate. One study that is relevant for this is Hemme et al. (2003). This study is based on the same field area as the present study, the state of Haryana in India. They analysed the growth potential of dairy farmers with 2, 4, 22 and 37 animals, respectively, and concluded that the majority of the small farmers that typically have close to two animals are not commercially viable in the long run. Lastly, the literature also talks about a consumption-smoothing motive for rearing livestock. According to this view, households treat animals as durable assets and use them to tide over consumption shocks. However, the empirical evidence on this channel is mixed (Kazianga & Udry, 2006; Rosenzweig & Wolpin, 1993).
Although we draw from the literature on why small farmers maintain cattle, it should be pointed out that our main concern is not this. This study is concerned with the factors determining the adoption of cross-breeds, specifically the role of market incentive, once the household has decided to rear livestock. Potentially, all the factors discussed in the context of the decision to rear livestock can also be relevant to the decision to include cross-bred animals in the herd. However, studies based on microdata that analyse the household-level decision to choose the breed are not very common in the literature. Certain studies exist that try to evaluate the programmes that promote cross-breeding, for example, Rajapurohit (1979), comparing the costs in terms of loss in draught animals to gains in milk. Kumar et al. (2003) did a cost-benefit analysis of resources applied to the promotion of cross-breeding. Some case-specific analyses of this issue have been highlighted by Nair (1982). However, we feel that more microeconomic studies with survey data are required to understand the choice-of-breed decision at the household level. This is where our study hopes to contribute.
Data
The survey was conducted in two phases–the summer and winter of 2021. Our survey collects detailed information about the operations of dairy farmers. This includes the numbers, breeds, gender and age of the livestock maintained by the farmers. Detailed information about the cost of inputs, feed, healthcare of the animals and sources of knowledge about livestock was collected. Information about our survey can be obtained from our data appendix.
In Table 1, we report the household characteristics and asset positions of the milk farmers sampled. We find that our sample is predominantly Hindu with a standard distribution of broad caste categories. Around 66% of our sample are landowners. Among the landowners, the average size of land in possession is about 2 ha, which is comparable to Indian farm holdings in general. This figure may be imprecisely measured, as the standard deviation is quite large (reported in parentheses). The sample seems to be relatively richer, as very few of them possess the MNREGA job guarantee cards. We would expect poorer households to be more likely to possess these. Also, large proportions of the sample households have ‘pucca houses’ (brick and mortar houses as opposed to mud etc.) and possess bank accounts. These are signs of wealth. In addition, most households list family as their only source of information on livestock rearing. Other sources included progressive local farmers, veterinarians, media, extension agents and others.
Descriptive Statistics of Household Characteristics of Dairy Farmers.
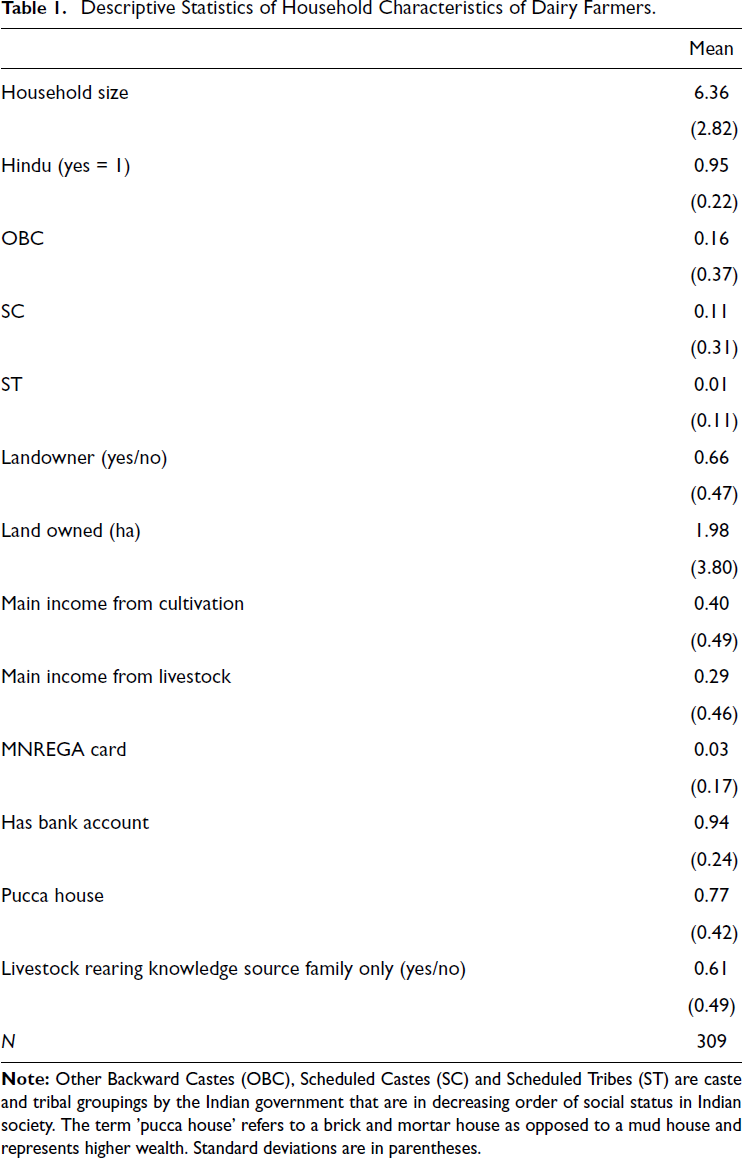
Descriptive Statistics of Household Characteristics of Dairy Farmers.
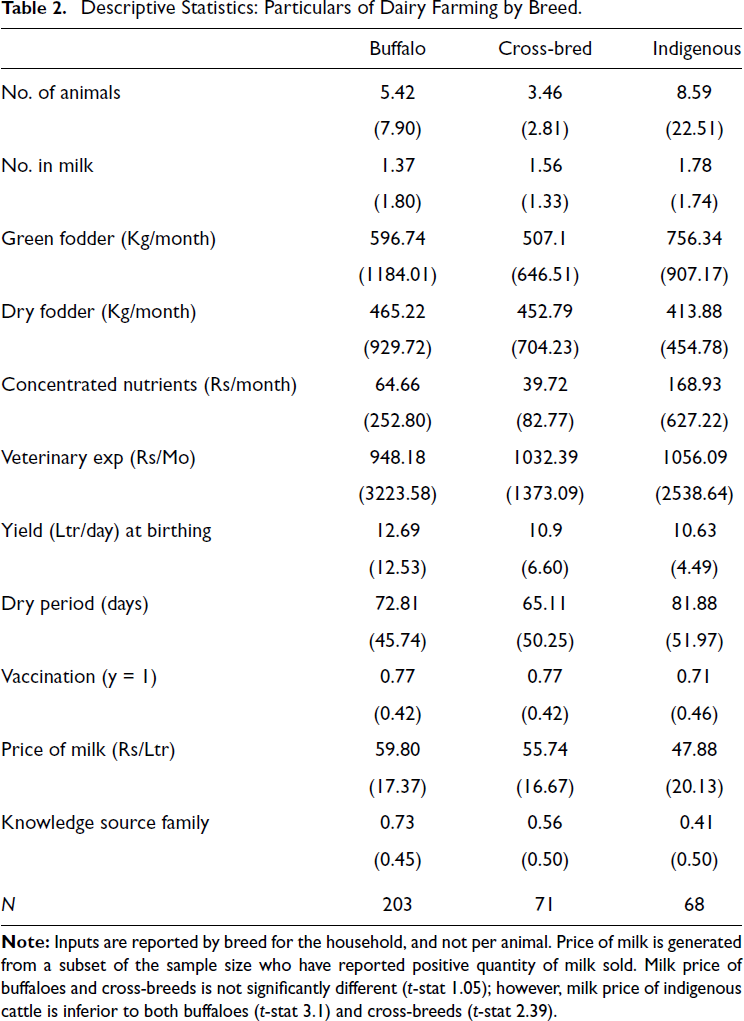
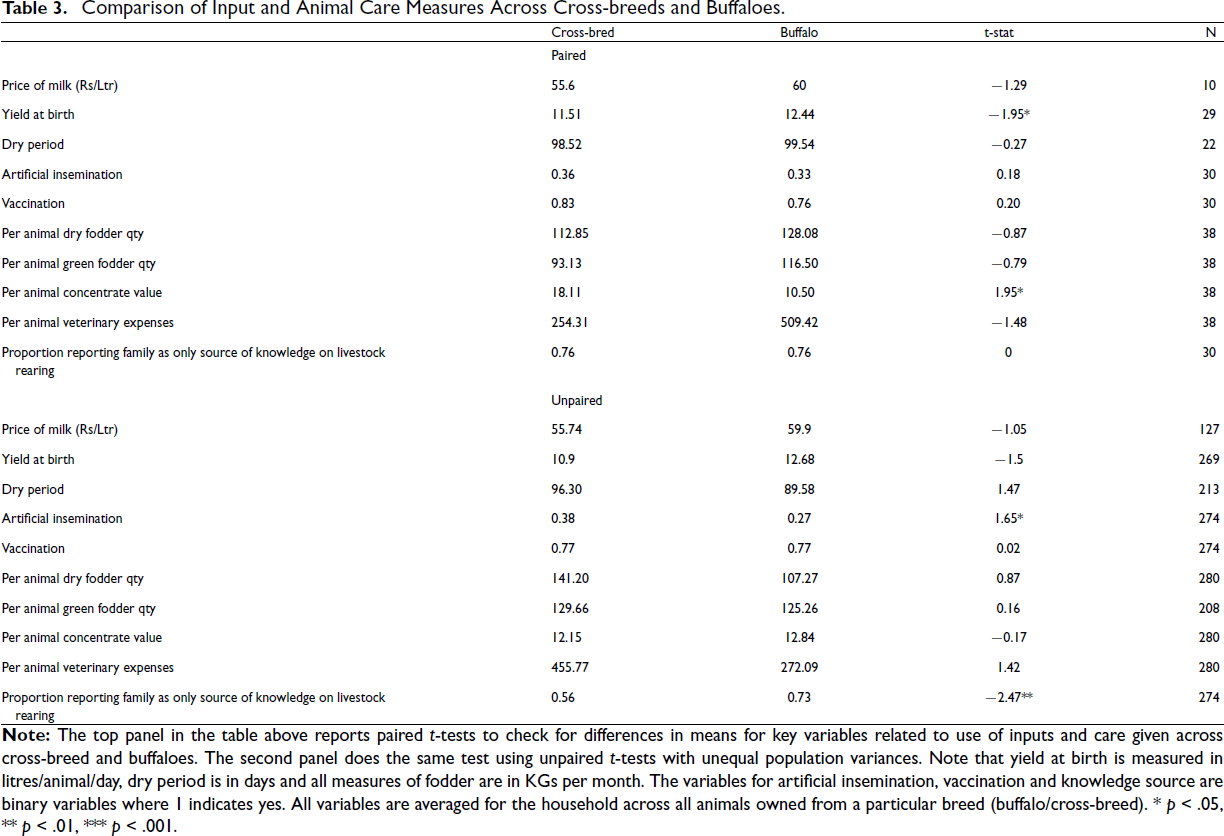
Table 2 reports the details of the number and composition of the animal herds maintained by an average milk farmer in the sample. The first row reports the size of the herd by breed if the household has that breed. We see that indigenous cow herds are the largest, followed by buffaloes and cross-breeds. However, the proportion of animals in milk is much higher for cross-breeds, indicating that milk farming is perhaps more intensive with cross-breeds than with indigenous cattle. Similar conclusions can be drawn from the figures for dry period days (gap between the end of milking from one birth to the start of milking from the next birth). However, milk yield and price of milk are highest for buffaloes. We also conduct simple tests to determine the statistical significance of the difference between the groups. These results are reported in Table 3. It should be noted that the price of milk is not significantly different for buffaloes and cross-breeds; however, both are significantly higher than the price of milk of indigenous cattle.
Descriptive Statistics: Particulars of Dairy Farming by Breed.
Comparison of Input and Animal Care Measures Across Cross-breeds and Buffaloes.
Descriptive Statistics by Activity
Last, we present the breakdown of our sample by activity status regarding milk production and marketing. The sample can be divided into four categories according to their current activity status. We classify a household as a home consumer if they report a positive number of animals in milk but no milk sold. If the total milk produced (which we calculate by multiplying the yield per animal by the number of animals in milk) exceeds the reported quantity sold, we classify the household as a consumer and seller. If not, we call them pure sellers. There is also a fourth category of households that own milch animals but do not report any animals in milk in the last 30 days. Presumably, the animals in these households are either going through a dry period or are too young. We see that a majority of our responders are keeping milch animals for home consumption only. About 28% of the sample sells milk.
The four groups, as identified above by their activity status, also demonstrate significant differences in household characteristics, dairy operations and adoption of cross-breeding. In Table 4, we demonstrate these differences by presenting descriptive statistics by activity status and testing to identify significant differences between the respective groups and the entire sample. Note that a positive t-statistic indicates that the group average is lower than the full sample average.
Descriptive Statistics by Activity.
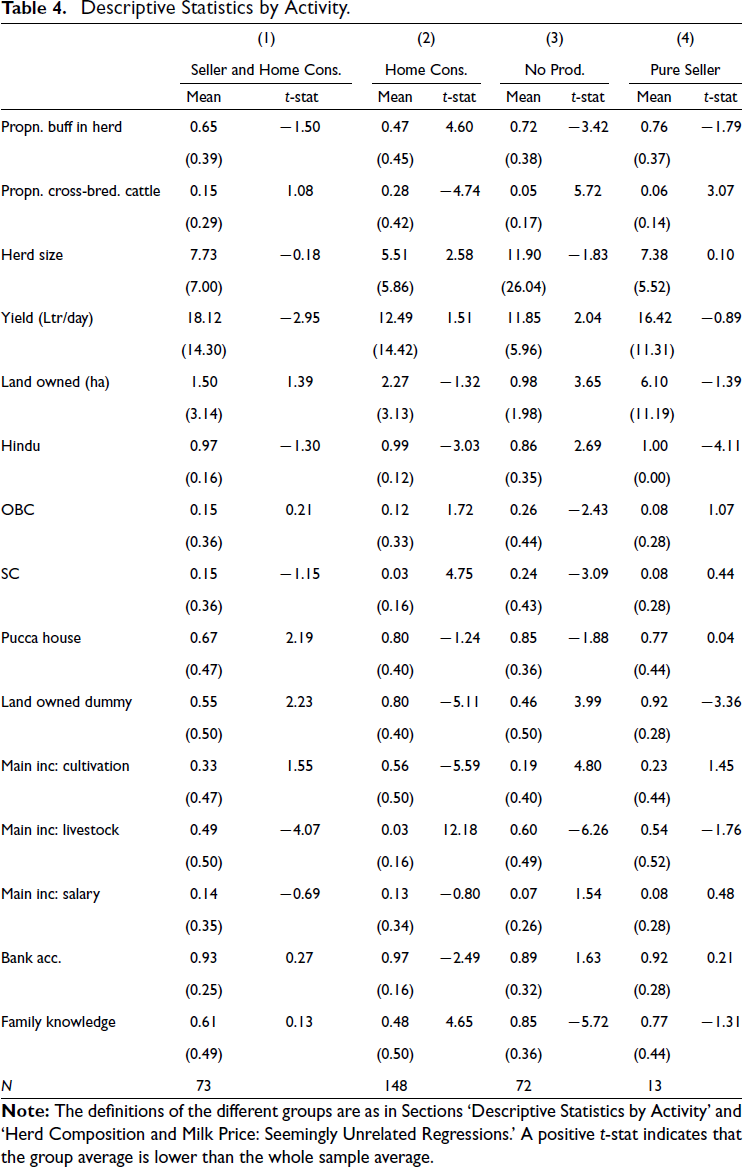
From Table 4, we see that the group of pure home consumers maintains smaller herds with a significantly higher proportion of cross-bred animals and a significantly lower proportion of buffaloes. The group of pure sellers is the mirror opposite of the home consumers in terms of herd composition; however, the pure seller group is very small (only 13 households). The home-consumer group seems to be richer both in terms of material resources and social status. For example, they have a significantly higher proportion of land owners, bank account holders and a higher percentage of families with farming as their primary source of income.
The primary objective of this article is to model milk farmers’ decisions regarding the adoption of cross-bred animals within their livestock holdings, with particular emphasis on the role of market factors. Our analysis is conducted conditional on the household owning at least one milch animal. While the decision to keep dairy animals may itself be influenced by factors that also affect breed choice, we do not explicitly model this extensive-margin decision. Instead, we treat the decision to own milch animals as exogenous to our main research question, which focuses on the composition of the herd rather than the decision to participate in dairy production per se.
Herd Composition: Multinomial Probit
In this section, we model the probability that a certain breed is included in the herd by a household. In our sample, households hold different combinations of the three breeds. We consider each of these categories as a particular choice of breed composition and model these as different categories in a multinomial probit model with household characteristics and demographics as explanatory variables (see Equation (1) below).

The dependent variable Ii is an indicator variable that takes the following values:
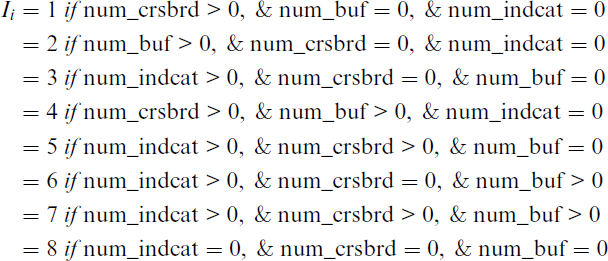
The set of explanatory variables includes household characteristics such as caste, amount of land owned, whether they have a MNREGA card, whether they have a bank account, household size, an indicator for the family being the only source of information about livestock and indicators of their main source of income (livestock/cultivation).
Herd Composition and Milk Price: Seemingly Unrelated Regressions
The probit approach from Section ‘Herd Composition: Multinomial Probit’ above is not ideal for understanding the degree of cross-breeding adoption in the internal margins. In this section, we focus on this aspect and shift to the proportion of cross-breds in the household herd as our main dependent variable.
Although our main interest is in the proportion of cross-breeds in the herd, we realise that this variable comes from an optimisation exercise conducted by each household to maximise their objectives by choosing over the different breed options. This will result in the simultaneous determination of the proportions of all three breeds in the herd. Keeping this in mind, we estimate a set of seemingly unrelated regressions as given in Equation (2).

In this exercise, our primary independent variable of interest is the price of milk. We assume that a quadratic polynomial in milk price adequately captures the market-based incentives influencing households’ livestock breed composition. This assumption warrants clarification and justification. As discussed in Section I, we posit that households perceive cross-breeding as a more economically viable production technology. Market prices are commonly understood to be the primary mechanism through which such information is conveyed to economic agents. Under the assumption of a competitive market equilibrium, the price of milk would be uniform across households. However, this is not what we observe in the data. Instead, producers appear to operate in localised or segmented markets, where proximity to consumers and reliance on social networks may confer a degree of market power and result in price dispersion. In this context, household herd composition should be interpreted as a long-run equilibrium outcome. Accordingly, we hypothesise that, first, households facing higher relative prices for cross-bred milk will exhibit herd compositions more heavily weighted toward cross-bred animals; and second, higher milk prices more generally will be associated with a greater share of cross-breeds in the herd, as these animals are expected to achieve higher yields and thereby lower average production costs. Nonetheless, the use of milk prices as a proxy for market incentives entails important limitations, which we discuss and address in the subsequent section.
Herd Composition and Market Incentives
Given the expectation of high yields from cross-bred animals, we would expect price or market-based incentives to lead to higher adoption of cross-breeds. However, the relatively small geographical area covered by our survey makes it difficult to have a lot of price variation in our sample. A second issue with the regressions in Equation (2) is that a good proportion of households do not report any milk sold. As such, we do not observe the milk price for these households. Due to these limitations, we use a different measure of the influence of market-based incentives based on the information on reported milk sale. In particular, a large part of our sample consists of households that maintain livestock only for home consumption. Such households are unlikely to respond to market prices. For such households, we would expect the adoption of cross-breeds to be less. We classify farmers into four categories based on their activity in terms of milk selling/home consumption:

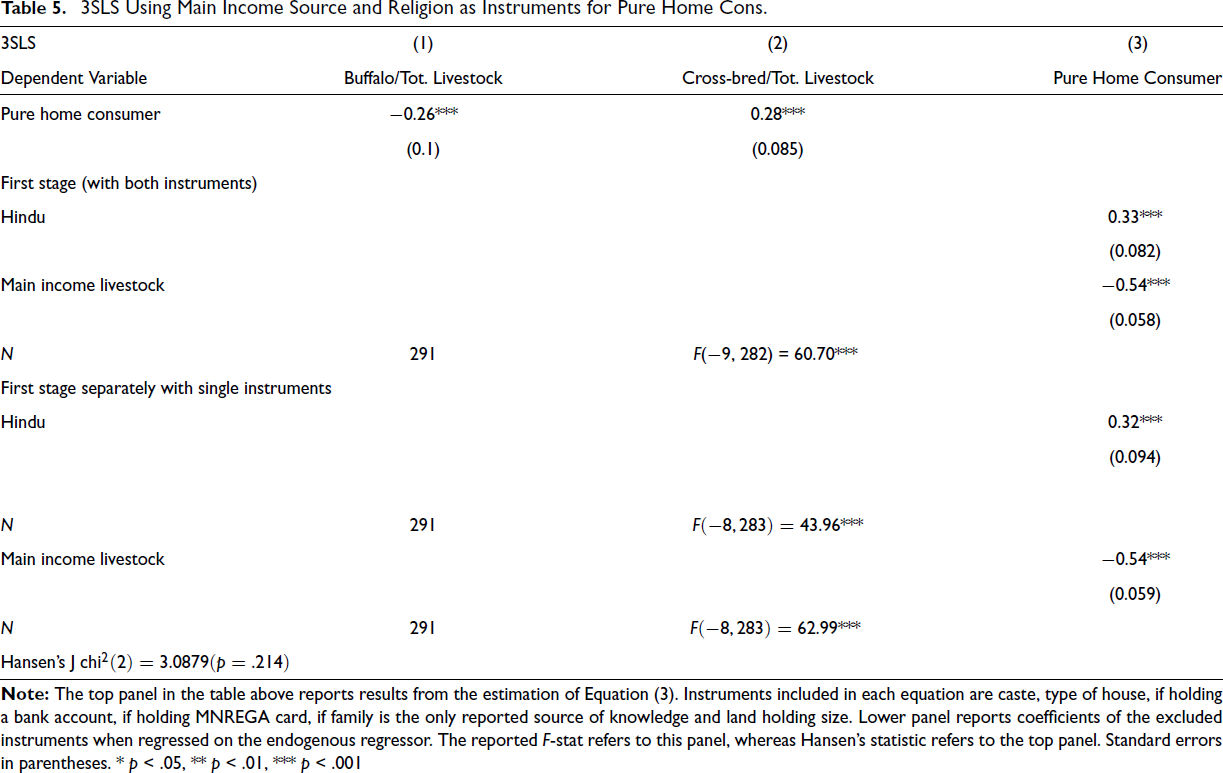
Out of the four categories above, the group that is least likely to be affected by market prices is group 2, which are pure home consumers. We use a 3-stage least squares (3SLS) system instrumental variable approach to test the effect of being a home consumer on the proportion of buffaloes and cross-bred in the livestock maintained by the household. This approach stems from two observations. First, as discussed before, the proportion of different breeds should be jointly determined, making a system estimation most appropriate. Second, the choice to either sell milk or consume it at home is likely to be endogenous. Various factors, such as market prices, income levels and others, are likely to affect both the proportion of breeds maintained and the decision to sell milk. As such, we decide to use the Hindu religion and the dummy for the main income source to be livestock as instruments for the household belonging to the group of pure home consumers. Since the proportion of the three breeds adds up to one, it is sufficient to estimate two of the following equations as a system. We drop the equation where the dependent variable is the proportion of indigenous cattle.
3SLS: each breed b represents a different equation

The lower panel in Table 5 reports the results for what would be the first stage in a 2SLS estimation of a single Equation (4) specification where pure home consumption is regressed on the excluded instruments, Hindu dummy and the indicator for main income source being livestock, along with all other exogenous variables. We see that both instruments are highly correlated with the endogenous variable. As such, with two excluded instruments and one endogenous variable, the order condition is satisfied. In addition, we can test overidentifying restrictions using Hansen’s J statistic (since the 3SLS is also an efficient generalised method of moments [GMM] estimator), which follows a chi-squared distribution with 2 degrees of freedom. We see that we cannot reject the null hypothesis that the overidentifying restrictions are valid and the exclusion restrictions hold.
3SLS Using Main Income Source and Religion as Instruments for Pure Home Cons.
The binary variable indicating the Hindu religion is correlated with the decision to sell milk, as a higher proportion of Hindus traditionally happen to be cultivators. However, there is no reason to expect the variable to directly affect herd composition, and as such, it would satisfy the exclusion restriction. The other instrument, a binary variable for main income source being livestock, will definitely influence herd composition through the decision to sell milk. However, it is difficult to think of any other reason why this variable may directly affect herd composition.
A concern regarding the validity of our strategy could be factors that are correlated with both the instruments and the dependent variable, such as land holding, caste-based information, milk marketing networks or traditional knowledge. Numerous studies have documented the importance of such factors in determining the ability of a household to generate a livelihood from livestock. For example, Yadav (2024), in a study based in Haryana, described how land ownership, along with caste, becomes a key determinant of whether income is primarily derived from livestock or not. Apart from this connection through land ownership, caste should also play a role through the traditional knowledge of the occupations they represent. Heffernan et al. (2011) mentioned such ‘social divisions and local epistemologies’ regarding uptake of milch animal vaccination. Sarkar (2020) also pointed out that certain castes may face restrictions on the market they are allowed to supply due to social taboos. This literature tells us that land ownership, caste networks and traditional knowledge do play a role in determining whether a household derives income primarily from livestock. In addition, these may also affect the herd composition maintained by the household. As such, our exclusion restriction would be satisfied conditional on all such factors. Accordingly, we include controls for caste, land holding, measures of household wealth and sources of knowledge about livestock in our main specification.
Probit
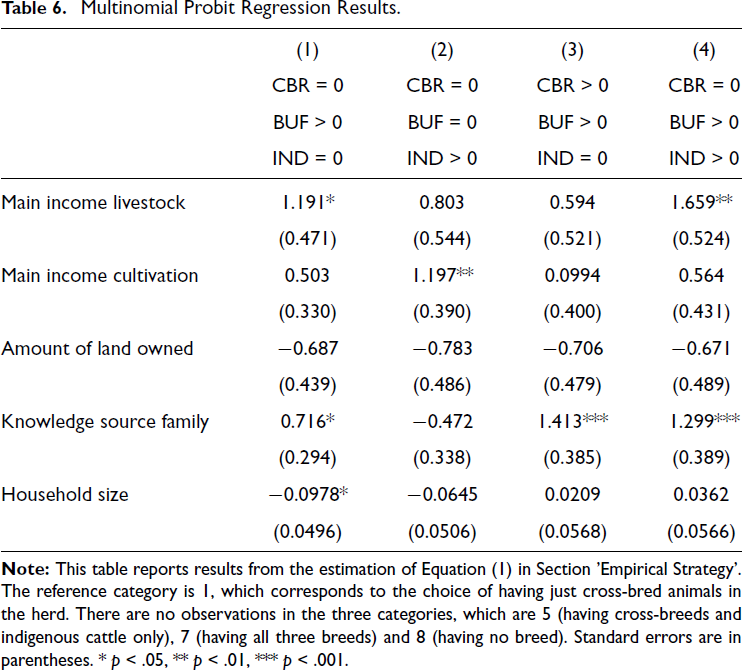
Results of the estimation of Equation (1) are reported in Table 6. This is a multinomial probit model in which the base outcome corresponds to the dependent variable taking a value of 1. This is the case where the household does not own indigenous cattle or buffaloes but owns a positive number of cross-bred cattle. The estimation results should be compared to this excluded category. The base outcome case, where the dependent variable takes the value 1, has 38 observations, 137 observations belong to value 2, 52 take value 3, 35 take value 4 and 38 take value 6. There were no observations in categories 5, 7 and 8.
Multinomial Probit Regression Results.
Multinomial Probit Regression Results.
Estimation results suggest that if the main income is from livestock, then households have a lower chance of owning cross-bred cattle. On the other hand, buffaloes seem to be preferred if main income is from livestock. If the main income is from cultivation, we see that there is a higher chance of owning indigenous cattle. This could be because indigenous cattle are better as draught animals.
Amount of land owned has a negative coefficient in all cases, demonstrating that cross-bred owners are likely to have more land; however, this is not statistically significant. The loss of statistical significance is probably due to the inclusion of the variable indicating the source of knowledge about livestock rearing. We expect this to be heavily correlated with land ownership. We find that owning a buffalo becomes significantly more probable when the household acknowledges family as the only source of knowledge. Household size has a negative and significant effect on a household’s chances of owning only buffaloes.
These results suggest that buffaloes are preferred when the main source of income is livestock, whereas the preference shifts to indigenous cattle when the main source of income is cultivation. We also observe that richer households, indicated by higher land ownership and access to better information, have a preference for cross-bred animals. If household size goes up, the chances of owning a cross-bred are higher.
Seemingly Unrelated Regressions with Milk Prices
Estimates of Equation (2) are reported in Table 7. The dependent variable here is the proportion of the farmer’s herd belonging to a particular breed – buffalo, cross-bred or indigenous cattle. These results suggest that own milk price affects the proportion of the breed in the herd only for buffaloes and indigenous cattle. The relationship between buffalo milk price and the proportion of buffaloes in the herd is increasing and concave. The sign of the square term is negative and significant. The coefficient of milk price indicates that a | 1 increase in price leads to a 2% increase in the proportion of buffaloes in the herd. However, for indigenous cattle, both signs are reversed. While the direction of the relationship is as expected for buffaloes, it is not so for the indigenous cattle. However, as previously pointed out, the number of observations in this regression is quite low, as not many households sell milk. In fact, whereas 105 households report the sale of buffalo milk, only 25, and 32 such households exist for cross-breeds and indigenous cattle. For indigenous cattle, there is a higher chance of having this breed in the herd if the farmer is a Hindu, if they are not SC, if they do not have a bank account and if the household holds less land.
Seemingly Unrelated Regression Results.
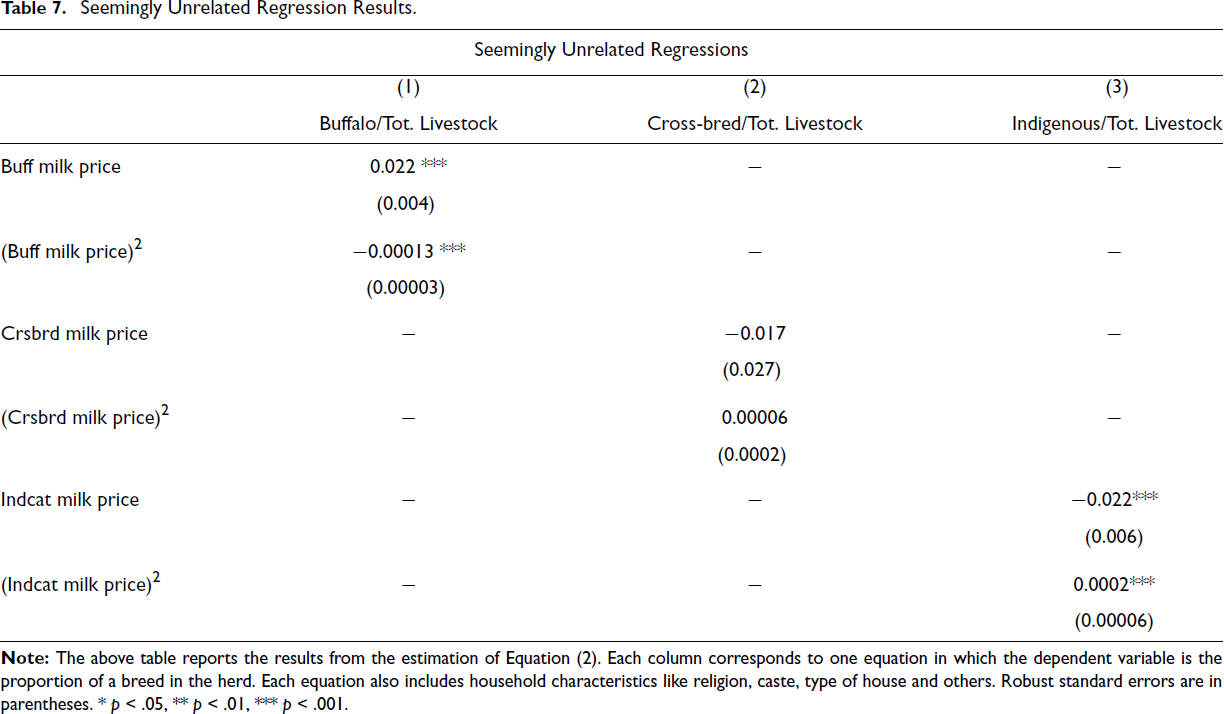
These results seem to indicate that market prices act as positive incentives only for buffaloes. Although the size of the effect is very small, and unlikely to have any significant economic consequences in the short run, it is possible that the incentive of higher prices pushes households to adoption of more buffaloes over time. Having said that, we should bear in mind the issues with this estimation as pointed out earlier, and take this as suggestive evidence only. However, if this is to be believed, it is contrary to our expectations.
3SLS
The 3SLS results as in Equation (3) are reported in Table 5, top panel. Contrary to our expectations, and in-line with the results in Table 7, we find that being a pure home consumer is associated with a herd composition that has a significantly lower proportion of buffaloes and a higher proportion of cross-breeds. This is after taking into account the endogeneity in the variable pure home consumer. The magnitude of the coefficients corresponds to a 26% fall in the proportion of buffaloes for pure home consumers, while there is a 28% increase in the proportion of cross-breeds compared to the excluded group, who sell or do not produce (presumably buyers).
Milk Yield: Buffalo Vs. Cross-breed
Referring to the discussion in the Introduction Section I, there are two scenarios wherein the low adoption of cross-breeding may be explained. First, there is the scenario in which market incentives that encourage adoption get obscured due to other factors, such as a lack of resources or knowledge. Our results in Sections ‘Seemingly Unrelated Regressions with Milk Prices’ and ‘3SLS’ would seem to suggest that this is not the case. Even after controlling for resources (land, type of house) and knowledge (caste networks, knowledge source), we see that more commercially motivated households generally prefer to operate with buffaloes rather than cross-breeds. This is counterintuitive, since cross-breeds are supposed to have higher yields (Al Kalaldeh et al., 2021; Dehinenet et al., 2014; Mekonnen et al., 2010), and pure sellers should prefer the option that reduces average cost. In this section, we try to understand the reasons for this result.
The alternate scenario where farmers do not adopt cross-breeding is when the market is not able to incentivise this. This would happen, for example, if the yield advantage of cross-breeds that we observe in controlled studies does not exist in the field. To examine this, we look at the yield at birth for the two breeds, buffalo and cross-breeds, in more detail. First, we compare average yields across the two breeds using simple t-tests. These results are reported in Table 3. The panel on top reports results from paired t-tests using households that carry both breeds. This sample is very small, so more reliable estimates are obtained by conducting unpaired tests for means or proportions assuming unequal variance across the two populations. These estimates show that, according to our sample, milk yield for buffaloes is the same if not more than that of cross-breeds.
One possible reason for the lack of yield advantage for the cross-breeds may be the presence of unobserved differences in the care given. In addition, the very fact that the household has a buffalo may indicate the desire to intensively use the animal for milk production as compared to a cross-bred. We attempt to partial out all these effects and then re-examine the difference in yields of buffaloes from cross-breeds. For this, we run a regression treating each (household × breed) as an observation. For example, if household A has two buffaloes and one cross-breed, then the household will be represented in the data twice. First, as A’s buffaloes, where the average yield at birth for the two buffaloes, household characteristics of A and per animal inputs used by A specifically for buffaloes will be represented. The second observation will correspond to A’s cross-breed animal, where the yield at birth and inputs will correspond to those used by household A for the cross-breed. Household characteristics for the two entries will be the same. After removing all the indigenous cattle, we are left with 254 such (household × breed) pairs. On this sample, we run the following regression:

Here, Yib refers to the average yield at birth measured in litres per day for all animals of breed b in household i. The main coefficient of interest is β1, which measures the difference in yield if the breed is buffalo compared to cross-bred. There is also a set of (household × breed) specific controls, which includes various measures of inputs like dry and green fodder, value of concentrates, use of artificial insemination, vaccination against common diseases, veterinary expenses, source of information about the breed, and animal characteristics like average dry period and the number of births undergone by the animal. We also realise that unobserved factors that lead to the household choosing a particular breed may affect yield, as pointed out earlier. As such, we instrument the main variable of interest, buf ib , using indicator variables for land ownership and the indicator for knowledge of livestock derived from family only. The instruments are not very strong (F-statistics in the first stage is 3.112), however, Sargan’s test for overidentifying assumptions is not able to reject the hypothesis that the instruments are correctly excluded. The results for this estimation are reported in Table 8. These results clearly show that even after controlling for various inputs, selection bias and animal characteristics, we still do not see a significant difference in yield between buffaloes and cross-breeds.
2SLS Estimates of the Effect of Animal Breed on Milk Yield: Buffalo Vs. Cross-bred.
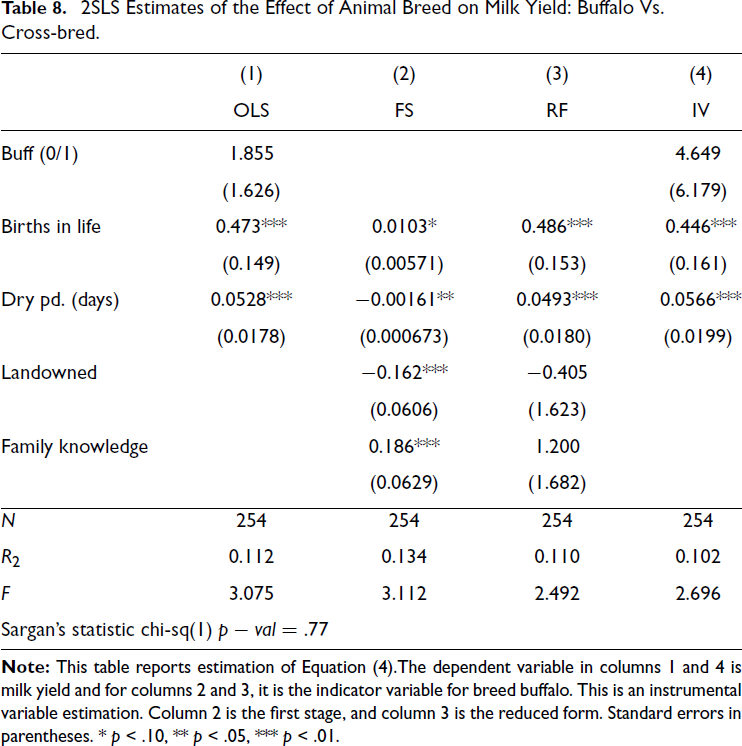
The similarity in the yields of cross-breeds and buffaloes can explain our findings in Table 5. However, it is a result that goes against the general consensus in the literature. The advantage in yield generated by cross-breeds is not just the main motivator for the advocacy for its adoption; it is also a robust finding in almost all comparative studies. As such, this finding warrants closer inspection.
The prima facie reason for similar yields is perhaps the use of similar levels of inputs and care. This is evident from Table 3, where we do not see any significant differences in fodder quantity, concentrates or veterinary expenses. High yields of cross-breeds, as documented in the literature, are generally achieved with heavy use of inputs. There seems to be limited effort to maximise the potential yield from these animals. To understand this choice by farmers, we note that in our sample, having commercial motives for dairy cultivation is associated with poorer households with lower land holdings. In Table 4, we see that the group that does not sell milk has a significantly higher chance of being a landowner, a higher probability of holding a bank account and a lower chance of deriving livestock-related knowledge from just their immediate families. All this paints the picture of a relatively richer group with better access to technical knowledge. This negative association of land with livestock rearing for income is a characteristic of smallholder farming households, as noted by others (Yadav, 2024). This fact may explain why adopters of cross-breeds are not motivated to maximise yields as long as adoption is primarily by richer households.
The theoretical literature on the adoption of new technology in agriculture (Feder et al., 1985) portrays the decision to adopt or not as a problem to be solved every period in a dynamic setting. At each point in time, farmers take into account their resources, access to credit, technical knowledge and their subjective perception of the risks and benefits of adoption. As such, when a new technology is first introduced, there are likely to be just a few adoptions by agents with a high tolerance for risk and greater access to resources. This is especially true if adoption involves a lumpy investment. Consistent with this prediction, the adoption of cross-breeding is usually found to be associated with households that have more resources and technical knowledge. This is a trend that has been demonstrated in many previous studies (Dehinenet et al., 2014; Mekonnen et al., 2010) and is also borne out by our data. In Table 6, we show that higher ownership of land is associated with the adoption of cross-breeding.
However, in case the technology in question is older, land, resources and access to credit may not determine adoption. For example, Ruttan (1977), as quoted in Feder et al. (1985), has mentioned that the extensive literature on the adoption of high yielding varieties (HYV) seeds has demonstrated that although smaller farmers initially lag behind their larger counterparts, they eventually catch up. Theoretically, if the benefits of the new technology truly outweigh the costs, this information is likely to filter down from the original adopters to the others, resulting in a change in their subjective perception of the risks associated with the technology. In the case of cross-breeding, where considerable time has elapsed since its first introduction, this process of information dissemination should have resulted in higher rates of adoption. However, the richer original adopters in this case are not enjoying particularly high yields due to their lack of motivation and low-intensity farming, as discussed earlier. As such, this channel of positive feedback remains closed.
Putting all these facts together, we see that richer households, who have the resources and knowledge to adopt cross-breeds, lack the motivation to cultivate these animals intensively, which may have allowed them to realise their potentially high yields. On the other hand, the poorer households, who have the motive for intensive dairy farming, do not have the knowledge and resources to raise these animals.
Policy Implications
Economic and environmental sustainability of SDFs has been a focus of policy for quite some time. The main thrust in India has been the promotion of cross-breeding through subsidised inputs and dissemination of knowledge. However, our study suggests that knowledge and resources are unlikely to induce small farmers to shift to cross-breeding. Unfortunately, the requirements of a farming household dictate the small size of their herds and the inability to operate at a scale that gets the best out of cross-breeds. As such, traditional breeds (especially buffaloes) will always be a better choice for such farmers.
The solution in terms of policy is to make it worthwhile for an average farming household to outsource the functions of a home-maintained herd. Animals at home provide income, nutrition, food security and insurance against negative income shocks. A village-level consolidation of dairy farming where individual farmers retain a level of ownership is likely to best serve all the functions that the farmers look to derive from their herds.
A good example of such a solution is presented by the huge scale and success of the dairy cooperative movement in Anand in Gujarat state of India, (Alderman et al., 1987). However, the internal organisation that allowed different groups of milk producers to come together in Anand has been difficult to replicate in other parts of India. It is important to revisit the policy in this respect. The crucial element in the success of cooperative movements seems to be social organisation. Once again, the imposition of a cooperative structure borrowed from somewhere else is unlikely to succeed.
This study provides some key insights into the decision-making of small household dairy cultivators regarding the genetic composition of the herd they choose to maintain.
The study is based on an extensive telephonic survey that we conducted in the Sonipat district of Haryana, India, in 78 different villages. We chose Haryana as our field area as dairy farming is a very important activity in this state. The data collected via our surveys contain rich information on household characteristics, information on village characteristics and information on knowledge about dairy practices. Our main motivation for this study is to understand why milk farmers in Haryana do not take to cross-bred cattle in their herds even though they seem to make economic sense. This is an important question, which has relevance not just for the profitability of small milk farmers and their productivity, but also for the reduction of the carbon footprint of the dairy sector. However, the data required to answer this question are not readily available. As such, microdata-based studies addressing this question are rare. The data we collect allow us to address this question, which is a contribution to the understanding of this important issue.
The central finding of this study is that market-based incentives are unlikely to substantially increase the adoption of cross-bred animals. We identify a positive relationship between milk prices and the proportion of animals in the herd only in the case of buffaloes. Moreover, households that primarily consume milk at home, who are therefore least exposed to market forces, are the most likely to maintain higher proportions of cross-breeds in their herds. Finally, consistent with previous studies, we find that household income and technical knowledge are significant predictors of cross-bred animal ownership.
The findings of this study taken together suggest that the choice of breed is determined to a large extent by the motivation of the household. In our study area, farmers with the means and knowledge to adopt cross-breeding do not derive their main income from dairy farming. On the other hand, farming households with fewer resources, especially land, are more motivated to engage in commercial dairy cultivation, but they lack the necessary resources and knowledge to adopt cross-breeding. As a result, the performance of cross-breeds in comparison to buffaloes is not significantly higher. Both in terms of yields and in terms of other indicators like dry period days, there is no statistically significant difference. The greater potential yields that the cross-breeds can obtain are not being realised, probably due to the lower intensity of dairying. In other words, the use of inputs and care-giving does not match the high input, high output scenario where the cross-breeds are at their most efficient.
In conclusion, it might be accurate to say that milk farming in our area of study is stuck in a low-yield, low-input, low-productivity trap. It is likely that if intensively cultivated, the cross-breds would be able to provide more milk, at a lower average cost, with lower average methane emissions. However, the small-scale home consumer model is not capable of breaking out of this trap.
Footnotes
Acknowledgements
The authors would like to thank all our research assistants who have helped in every stage, especially with data collection. Special mention for Akash Saharan for mentoring and guiding our survey evaluators. The authors are also deeply indebted to the Centre for Digital Finance and Inclusion, Delhi, for their excellent support in the digitisation of the survey questionnaires and for allowing us to use their online data collection portal ‘Sangrah’. The authors gratefully acknowledge the invaluable contribution of our colleague Ram B. Ramachandran during the data collection phase and planning of the survey. The authors also gratefully acknowledge two anonymous referees for their constructive comments and suggestions.
Declaration of Conflicting Interests
The authors declared no potential conflicts of interest with respect to the research, authorship and/or publication of this article.
Funding
The authors disclosed receipt of the following financial support for the research, authorship and/or publication of this article: The authors gratefully acknowledge support from the O.P. Jindal Global University for funding this study through a generous grant.
Supplemental Material
References
Supplementary Material
Please find the following supplemental material available below.
For Open Access articles published under a Creative Commons License, all supplemental material carries the same license as the article it is associated with.
For non-Open Access articles published, all supplemental material carries a non-exclusive license, and permission requests for re-use of supplemental material or any part of supplemental material shall be sent directly to the copyright owner as specified in the copyright notice associated with the article.
