






Abstract
The aim of the study was to identify the factors associated with undernutrition indicators in children 5 years and younger in a rural community in Malaysia. A total of 295 children and their carers were selected from community clinics based on a multistage sampling method. Pretested questionnaire, anthropometric measurement, and dietary assessment were used for data collection. There was 69% stunting, 63.4% underweight, 40% wasting, and 26.8% with mid-upper-arm circumference (MUAC) for age below a z score of −2 among children. In all, 10 factors were found to be associated with different indicators of undernutrition. Age was the only factor that had association with all the undernutrition indicators. Total household income and total expenditure showed significant association with underweight. Birth weight was reported to have significant association with underweight, stunting, and low MUAC-for-age. The findings suggest that the factors of undernutrition were different for different indicators of undernutrition and thus give a more comprehensive picture on factors contributing to acute and chronic malnutrition.
Introduction
Undernutrition is the direct result of inadequate dietary intake, the presence of disease, or the interaction of these 2 factors. 1 Over the years, undernutrition has been linked to the cause of death among children 5 years old and younger. In developing countries, the highest level of underweight prevalence was found in South Asia, where almost half (46%) of the children aged 5 years and younger were underweight. 2 Studies also reported that 52.5% of all deaths in young children were attributable to undernutrition. 3
To assess undernutrition in children, anthropometry data are useful. In addition, these data also provide an excellent measurement of the inequalities in human development in the communities. 4 Indicators such as weight-for-age, height-for-age, and mid-upper-arm circumference (MUAC) for age are used as proxies for assessing the eventual extent and severity of undernutrition. Weight-for-age is widely used as an indicator of recent undernutrition; Height-for-age reflects achieved linear growth and its deficit indicates long-term health and nutritional inadequacy. Weight-for-age represents both acute and long-term health and nutritional deficiency. 1 MUAC, an indicator of muscle and subcutaneous adipose tissue, is an accepted measure of nutritional status, especially in emergency situations where the collection of height and weight is difficult. 5 It has also being recommended as the best (ie, in terms of age independence, precision, accuracy, sensitivity, and specificity) case detection method for severe malnutrition. 6
Undernutrition and poor health at the early years of life can affect the cognitive, motor, psychosocial, and affective development of a child. Growth retardation in early childhood is significantly associated with functional impairment in adult life and reduced work capacity, thus affecting economic productivity. 7 The 2005 Annual Report of the Malaysian Ministry of Health reported that the percentage of children with moderate (weight-for-age z score of less than −2) to severe (weight-for-age z score of less than −3) malnutrition for the year 2000 was around 14%. Although the severe forms of nutrient deficiencies are rare, moderate undernutrition is still widespread among rural communities. Studies done locally indicated that the determinants for undernutrition among chidren are complex, multidimensional, and interrelated.8-11 These determinants vary from biological, behavioral, and environmental and are manifested from the individual level to the household level and the community level. Because of the adverse effects of undernutrition, identification of its actual local determinants becomes crucial to ensure better management.
This study was undertaken to identify the biological, behavioral, and environmental determinants associated with underweight, stunting, wasting, and low MUAC in children 5 years and younger. Specifically, the objectives of this study were
to assess the prevalence of underweight, stunting, wasting, and low MUAC in a representative sample of children 5 years and younger living in Tumpat, a rural district of Kelantan and
to examine the association of biological, behavioral, and environmental factors, with underweight, stunting, wasting, and low MUAC.
Methods
The state of Kelantan was chosen for this study because past study 8 had shown that it has the highest rate of moderate undernutrition (24%) and severe undernutrition (5.9%). It was also one of the top 5 states in Malaysia receiving food basket assistance. 12
A sample frame of 7119 children was identified. Using Statcalc EpiInfo version 3.5, with the estimated national prevalence of 18%, 333 children were recruited based on the inclusion and exclusion criteria. A multistage cluster sampling method was used to select the sample for this study. Ten clinics were randomly picked. There were 2 sets of respondents, the children and their mothers or caregivers. The inclusion criteria were normal children aged 5 years and younger attending the health clinics, with the mothers or caregivers as permanent residents of the area. Children who were mentally retarded, physically disability, or on medical treatment for serious illnesses were excluded from this study. Ethical approval was obtained from the funding institution. Informed consent was obtained from the adult respondents and conformed to the Malaysian ethical standard for research.
The first author who was trained in anthropometric measurement took all the measurement for the children. These measurements included the weight (to the nearest 0.1 kg), height/length, and MUAC measurement (to the nearest 0.1 cm), which were measured following the standard procedure. The z scores for weight-for-age, height-for-age, and MUAC-for-age were derived using WHO AnthroPlus version 1.0.2 software. Underweight was defined as weight-for-age less than −2 SDs based on theWorld Health Organization 1 ; similarly, stunting was defined height-for-age less than −2 SDs; wasting was measured from weight-for-height and low MUAC-for-age from MUAC-for-age.
A face-to-face interview with these children’s mothers or caregivers was conducted using a pretested questionnaire. The questionnaire was designed in Malay language, contains 50 items, assessing 7 domains: (a) background information on respondent (race, religion, gender, age, education level, marital status, occupation); (b) house condition (type of ownership, type of house, number of room in the house); (c) basic necessity and utilities (availability of schools, health facilities, grocery store, water supply, electricity, telephone, toilet, sewage disposal, waste disposal, use of cooking fuel); (d) property and land ownership (ownership of vehicle and household products, land ownership), (e) income and expenditure; (f) child health status (anthropometry status, health history, feeding practices); and (g) diet (24-hour recall, food preparation). Face-to-face interviews were conducted as some of the adult respondents were illiterate. The children’s diet was assessed through 24-hour food recall by interviewing the mother or the caregiver. The calculation of total calories intake was based on the nutrient composition of Malaysian foods. 13 Comparison of nutrient intake is done based on Malaysian Recommended Nutrient Intake (RNI) 2005. 14 The data obtained were analyzed using SPSS for Windows, version 14.
Results
The respondents were recruited from 3 health clinics and 7 community clinics. The number of respondents per clinic ranged from 27 to 31.
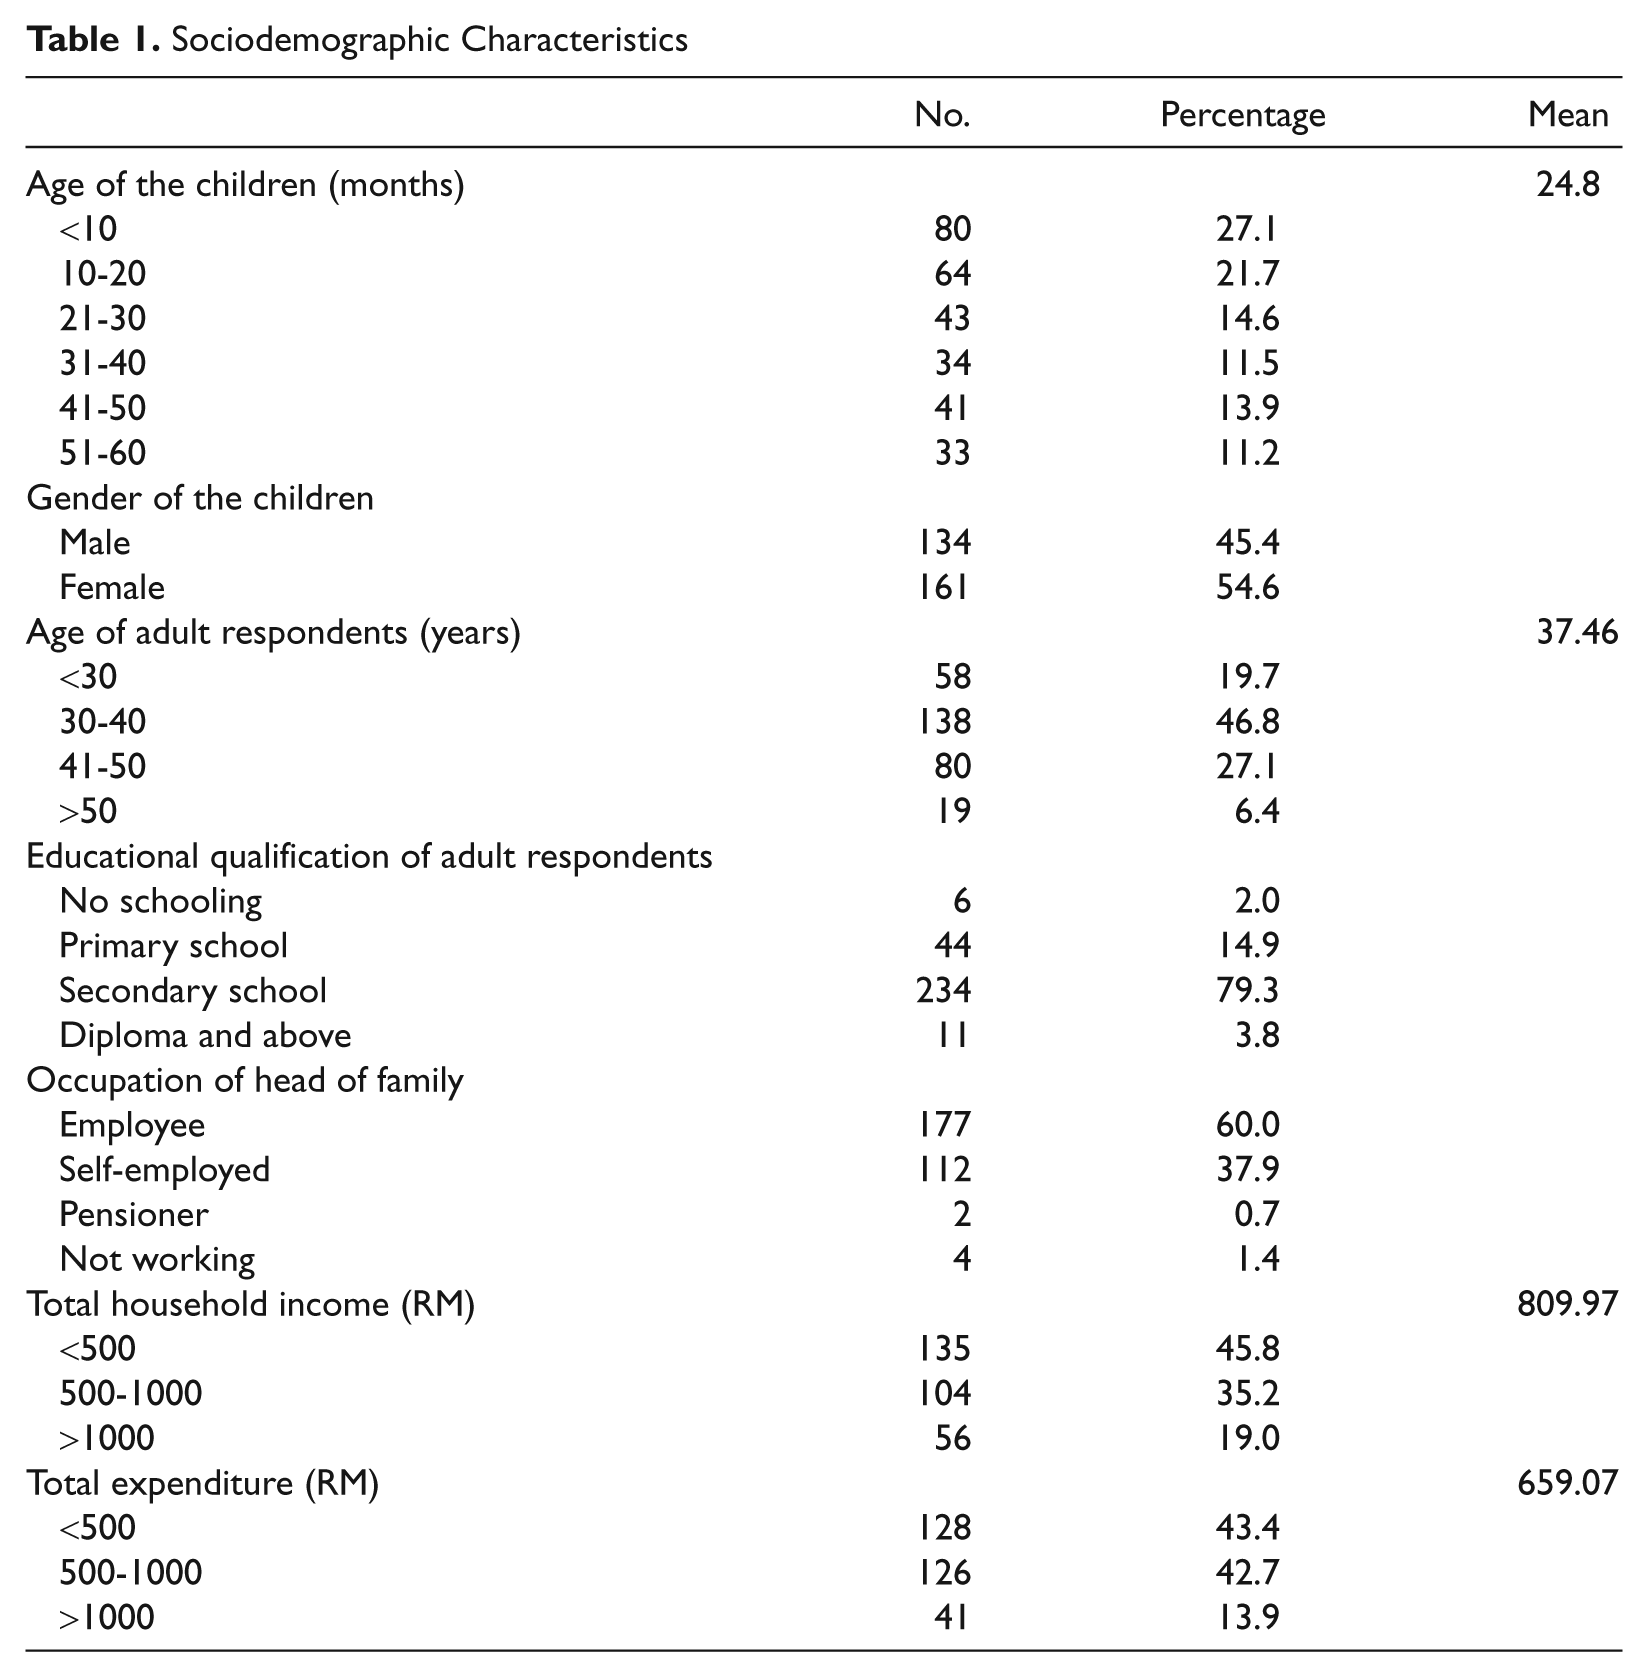
The mean age of the children surveyed was 24.8 ± 17.77 months, whereas the mean age of the adult respondents was 37.46 ± 8.37 years. Table 1 shows the sociodemographic background of the families involved in the study. Majority of the adult respondents had secondary level of education (79.3%). Overall, 60% of the child respondents’ fathers were employed either by government or private agencies. The mean household monthly income was RM 809.97 ± 624.28 with the highest pay amounting to RM 3500.00. About 45.8% of the household were reported to earn around RM 500.00 a month, which was below the Malaysian poverty line index. Approximately 43% of the households spent less than RM 500 per month for household consumption. The mean total expenditure per month was RM 659.07 ± 395.62.
Sociodemographic Characteristics
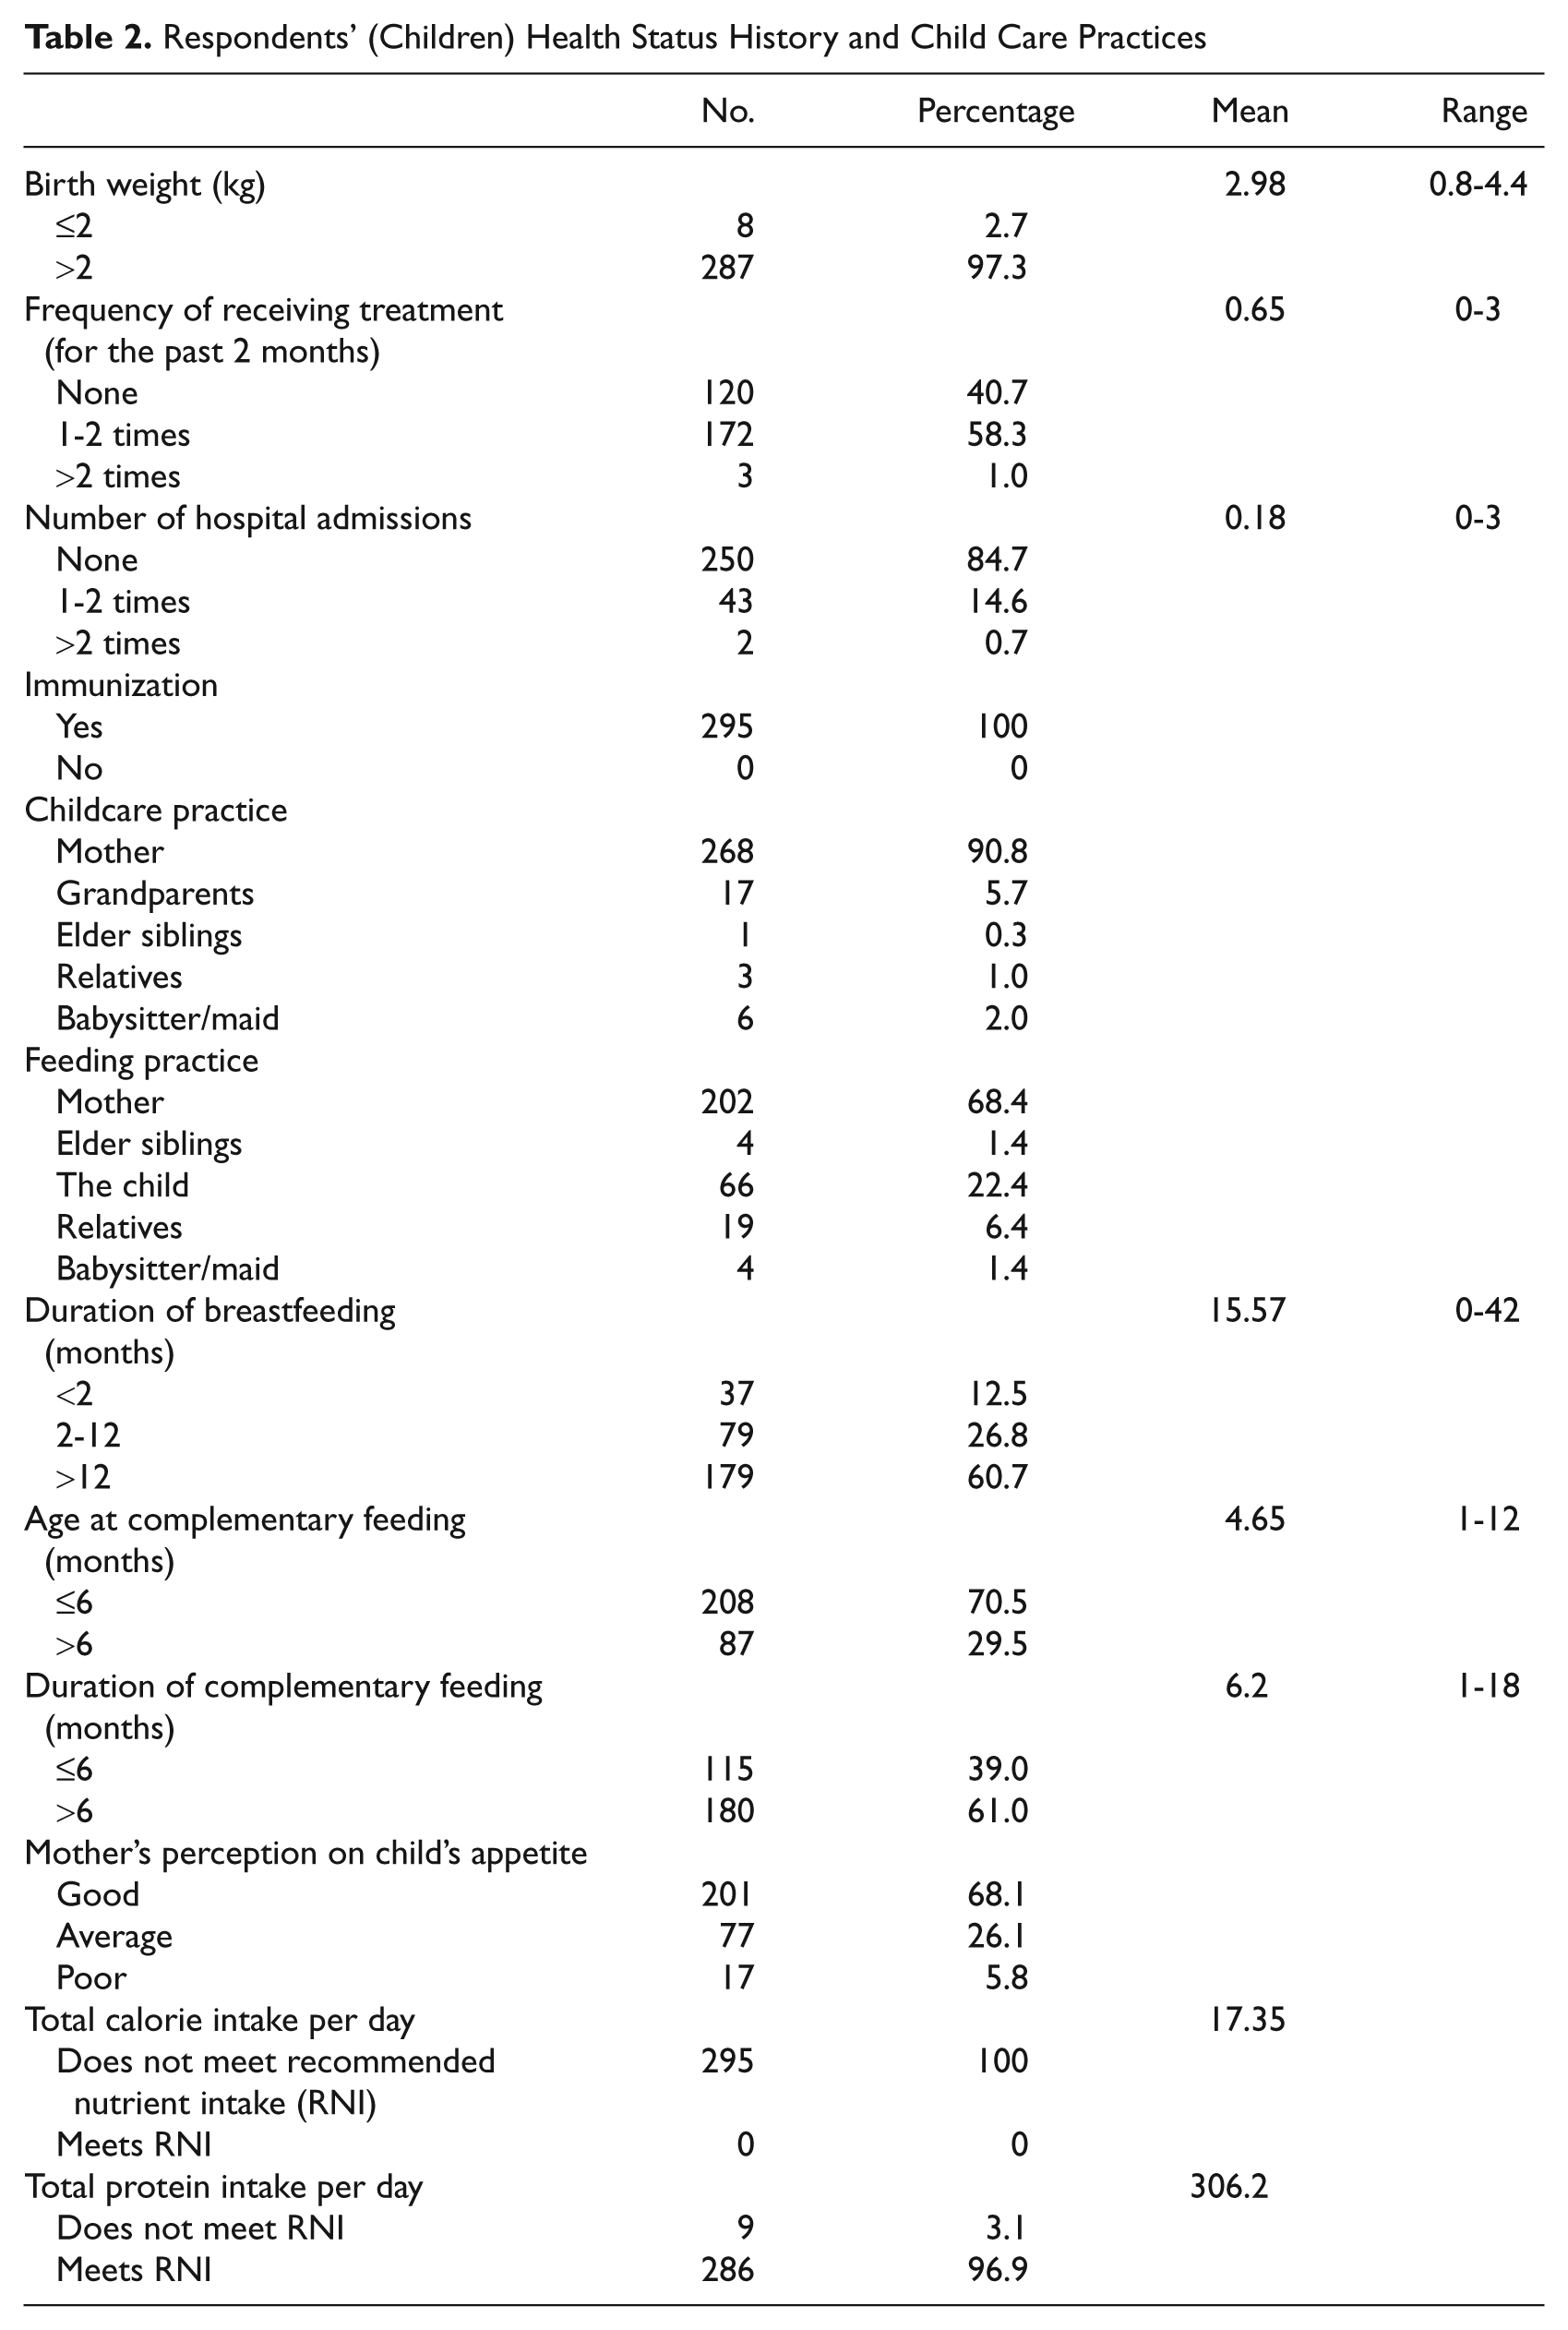
All the children were immunized accordingly, either at the government or private clinics. The birth weight of almost all the children (97.3%) was more than 2 kg. Majority of the children (90.8%) were taken care of by their own mothers. However, only 68.5% of the mothers reported that they themselves feed their own children. Some of the children ate by themselves (22.4%), especially the older ones. It was reported that in the past 2 months, 58.3% of the children were treated 1 to 2 times for illnesses, whereas 40.7% were reported as having no illness. Only 14.6% of the children were reported to be hospitalized 1 to 2 times since birth. The reasons for hospital admission were jaundice and respiratory-related disease. Majority of the mothers breastfed their children for more than 2 months, with 26.8% between 2 and 12 months and 60.7% for more than 12 months. Most mothers started their children on complementary feeding at the age of 4 months and older (70.5%). The rest of the mothers (29.5%) started their children on complementary feeding only after 6 months of age. Average age for complementary feeding was at 4.65 ± 1.75 months. The duration of complementary feeding varied from less than 1 to 18 months with a mean of 6.2 ± 3.09 months. Approximately 60% of the children were reported by their mothers to have good appetite. However, all the children were reported of not meeting the RNI calorie requirement. In addition, 3.1% of the children were reported of not meeting the protein requirement. Table 2 shows the detailed information.
Respondents’ (Children) Health Status History and Child Care Practices
There was 69% stunting, 63.4% underweight, 40% wasting, and 26.8% with MUAC-for-age with a z score less than −2 in this study sample. Prevalence of undernutrition with different indicators of undernutrition in percentage and its association with various factors is presented in Table 3. Among the factors, age is one of the significant factors for all undernutrition indicators (weight-for-age, height-for-age, weight-for-height, and MUAC-for-age). Infants younger than 1 year had lower undernutrition rates compared with older children. There was no significant difference in terms of undernutrition rates between male and female respondents (children). Breastfeeding duration was found to have significant effect on wasting, stunting, and underweight in children. As expected, children who reported having low/poor appetite had higher rates of undernutrition. However, significant differences were found in all categories of undernutrition except stunting. There was also significant difference in terms of frequency of illness among children with low MUAC-for-age categories.
Prevalence of Malnutrition and Its Association With Different Factors

Abbreviations: MUAC, mid-upper-arm circumference; NS, nonsignificant.
Majority of the children were reported to be fed by their own mothers, and there was difference in terms of feeding practice among underweight and low MUAC-for-age children. There was no significant difference in all undernutrition indicators with regards to caregivers and period of complementary feeding. Families that sometimes faced monetary problems had higher percentage of stunting and underweight compared with other groups, and the difference was significant. Only in the category of underweight, families who own a house without paying any installment has the highest percentage of underweight, and the difference was significant. Majority of the mothers have their education level up to secondary school. No significant difference was found between the undernutrition indicators. Planting at home also had no significant effect on child undernutrition.
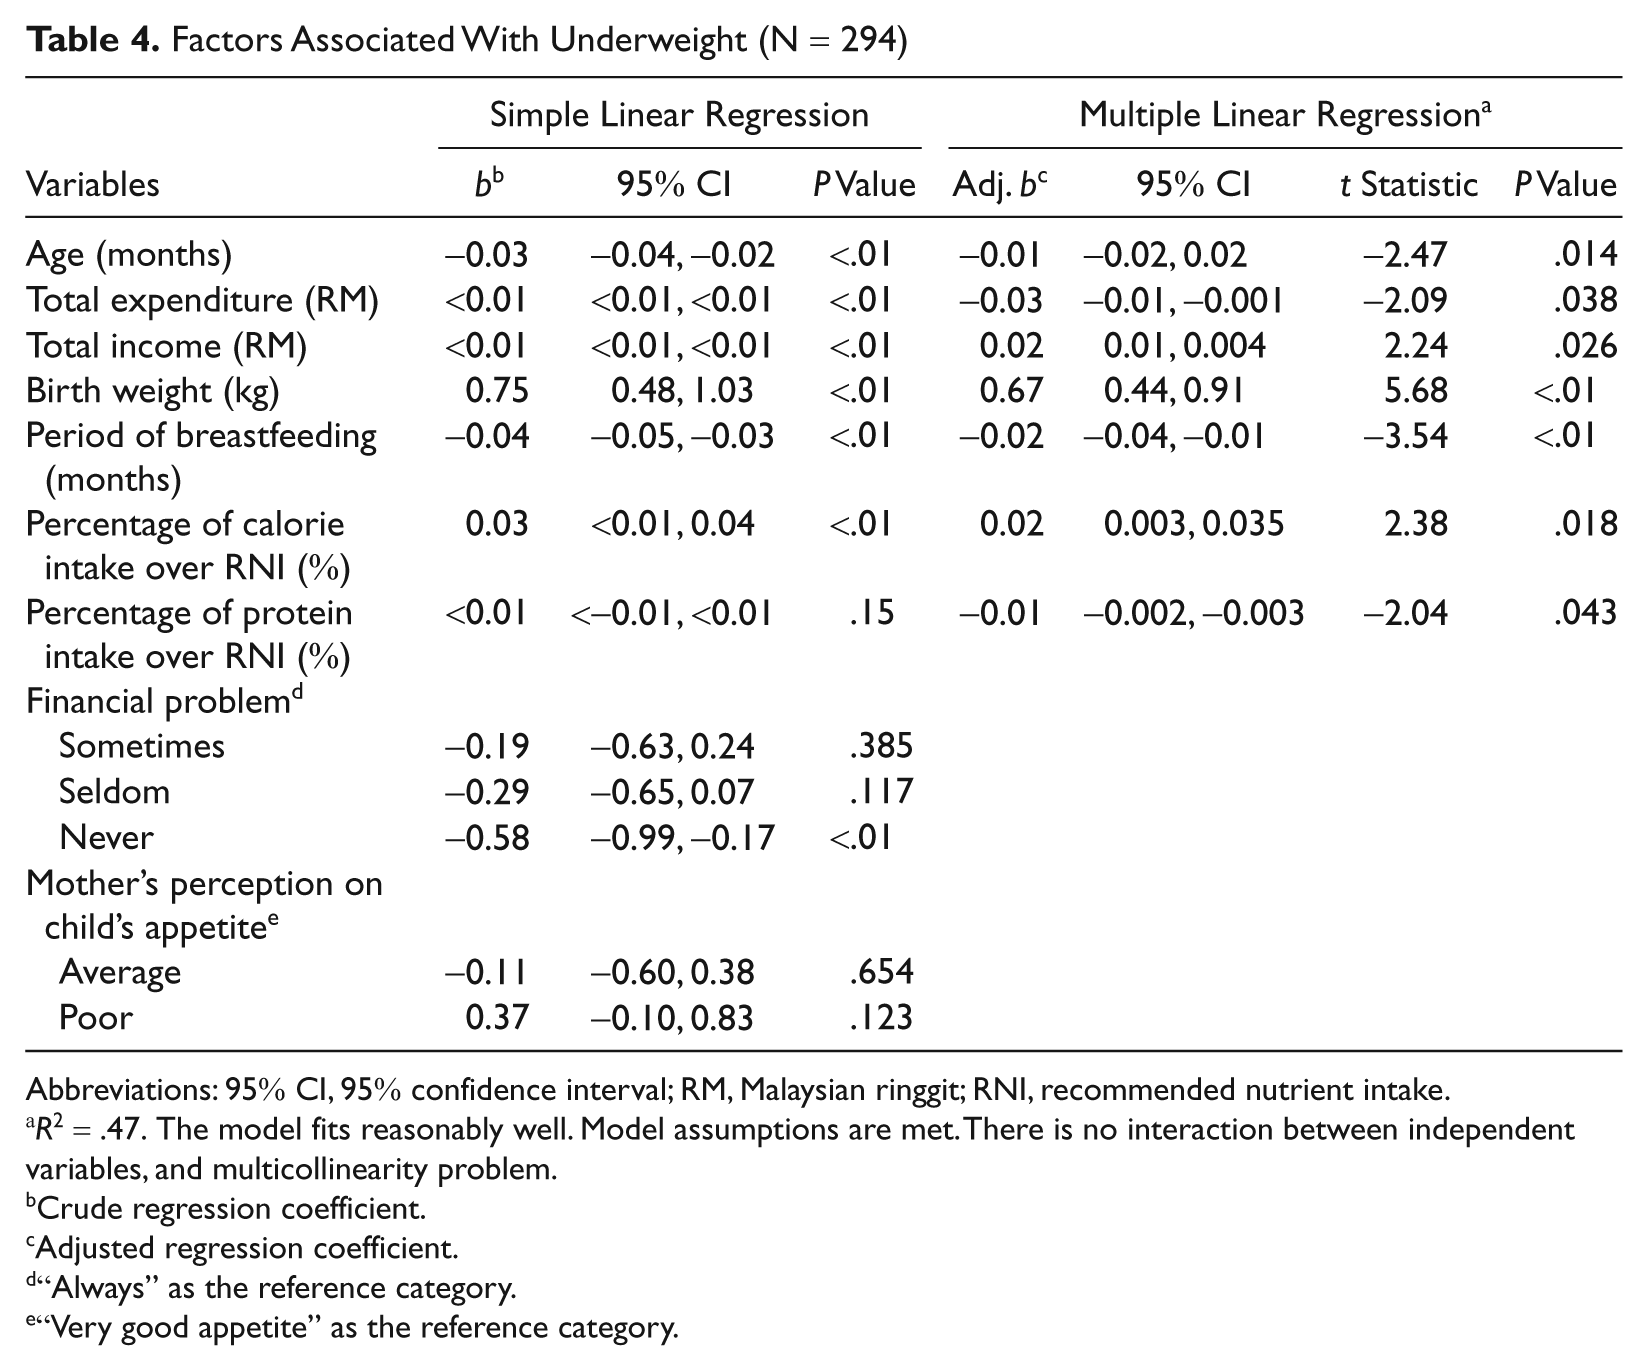
Regression analysis of all variables for the 4 separate models was performed. Simple linear regression analysis of underweight showed that significant associated factors of undernutrition were age (crude b = −0.03, 95% CI −0.04, −0.02, P < .01), total expenditure (crude b <0.01, 95% CI <0.01, <0.01, P < .01), total income (crude b <0.01, 95% CI <0.01, <0.01, P < .01), birth weight (crude b 0.754, 95% CI 0.48, 1.03, P < .01), period of breastfeeding (crude b −0.04, 95% CI −0.05, −0.03, P < .01), percentage of calorie intake over RNI (crude b 0.03, 95% CI <0.01, 0.04, P < .01), and financial problem (crude b −0.58, 95% CI −0.99, −0.17, P < .01). Multivariate analysis showed that age (adjusted [adj] b −0.01, 95% CI −0.02, 0.02, P = .014), total expenditure (adj b −0.03, 95% CI −0.01, −0.001, P = .038), total income (adj b 0.02, 95% CI 0.01, 0.004, P = .026), birth weight (adj b −0.01, 95% CI −0.02, 0.02, P = .014), period of breastfeeding (adj b −0.02, 95% CI −0.04, −0.01, P < .01), percentage of calorie intake over RNI (adj b 0.02, 95% CI 0.003, 0.035, P = .018), percentage of protein intake over RNI (adj b −0.01, 95% CI −0.002, 0.003, P = .043) have significant association with underweight (refer to Table 4).
Factors Associated With Underweight (N = 294)
Abbreviations: 95% CI, 95% confidence interval; RM, Malaysian ringgit; RNI, recommended nutrient intake.
R2 = .47. The model fits reasonably well. Model assumptions are met. There is no interaction between independent variables, and multicollinearity problem.
Crude regression coefficient.
Adjusted regression coefficient.
“Always” as the reference category.
“Very good appetite” as the reference category.
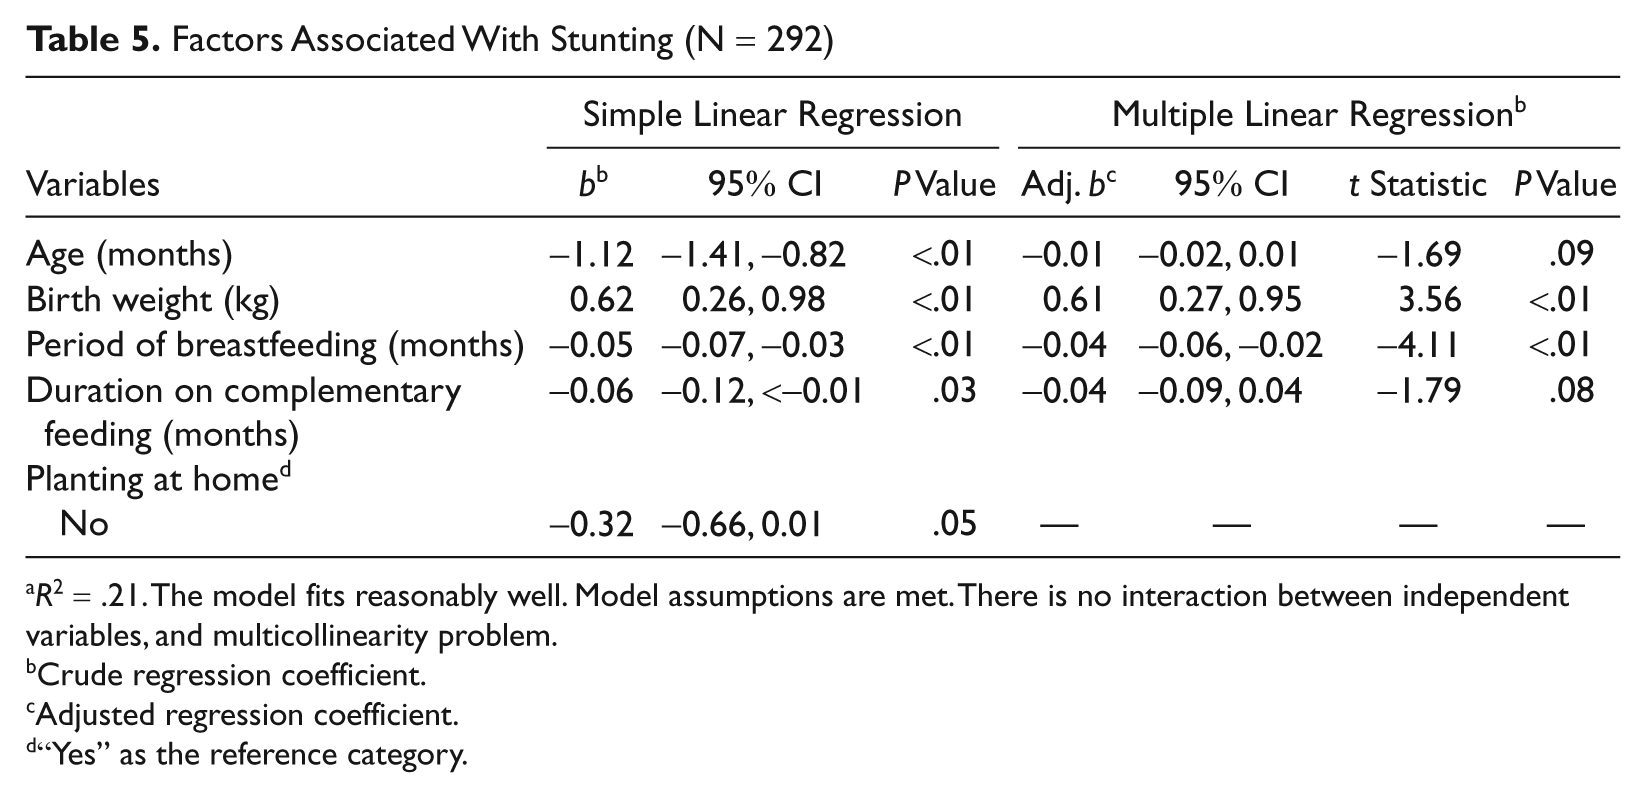
Analysis of simple linear regression showed age (crude b −1.12, 95% CI −1.14, −0.82, P < .01), birth weight (crude b 0.62, 95% CI 0.26, 0.98, P < .01), period of breastfeeding (crude b −0.05, 95% CI −0.07, −0.03, P < 0.01), period of complementary feeding (crude b −0.06, 95% CI −0.12, <0.01, P = .03), planting at home (crude b −0.32, 95% CI −0.66, 0.01, P = .05) to have significant association with stunting. Based on multivariate analysis, 2 determinants—birth weight (adj b 0.61, 95% CI 0.27, 0.95, P < .01) and period of breastfeeding (adj b −0.04, 95% CI −0.06, −0.02, P < .01) were found to have significant association with stunting (refer to Table 5).
Factors Associated With Stunting (N = 292)
R2 = .21. The model fits reasonably well. Model assumptions are met. There is no interaction between independent variables, and multicollinearity problem.
Crude regression coefficient.
Adjusted regression coefficient.
“Yes” as the reference category.
As for wasting, age (crude. b −0.03, 95% CI −0.04, −0.02, P < .01), mother’s period of contraception (crude b 0.14, 95% CI −0.02, 0.26, P = .02), percentage of calorie intake over RNI (crude b 0.04, 95% CI 0.02, 0.07, P < .01) only showed evidence of significant association. Multivariate analysis revealed 3 determinants—age (adj b −0.02, 95% CI −0.03, −0.01, P < .01), mother’s period of contraception (adj b 0.13, 95% CI 0.04, 0.23, P < .01), and percentage of calorie intake over RNI (adj b 0.03, 95% CI 0.01, 0.05, P < .01) were found to have significant association with wasting (refer to Table 6).
Factors Associated With Wasting (N = 293)
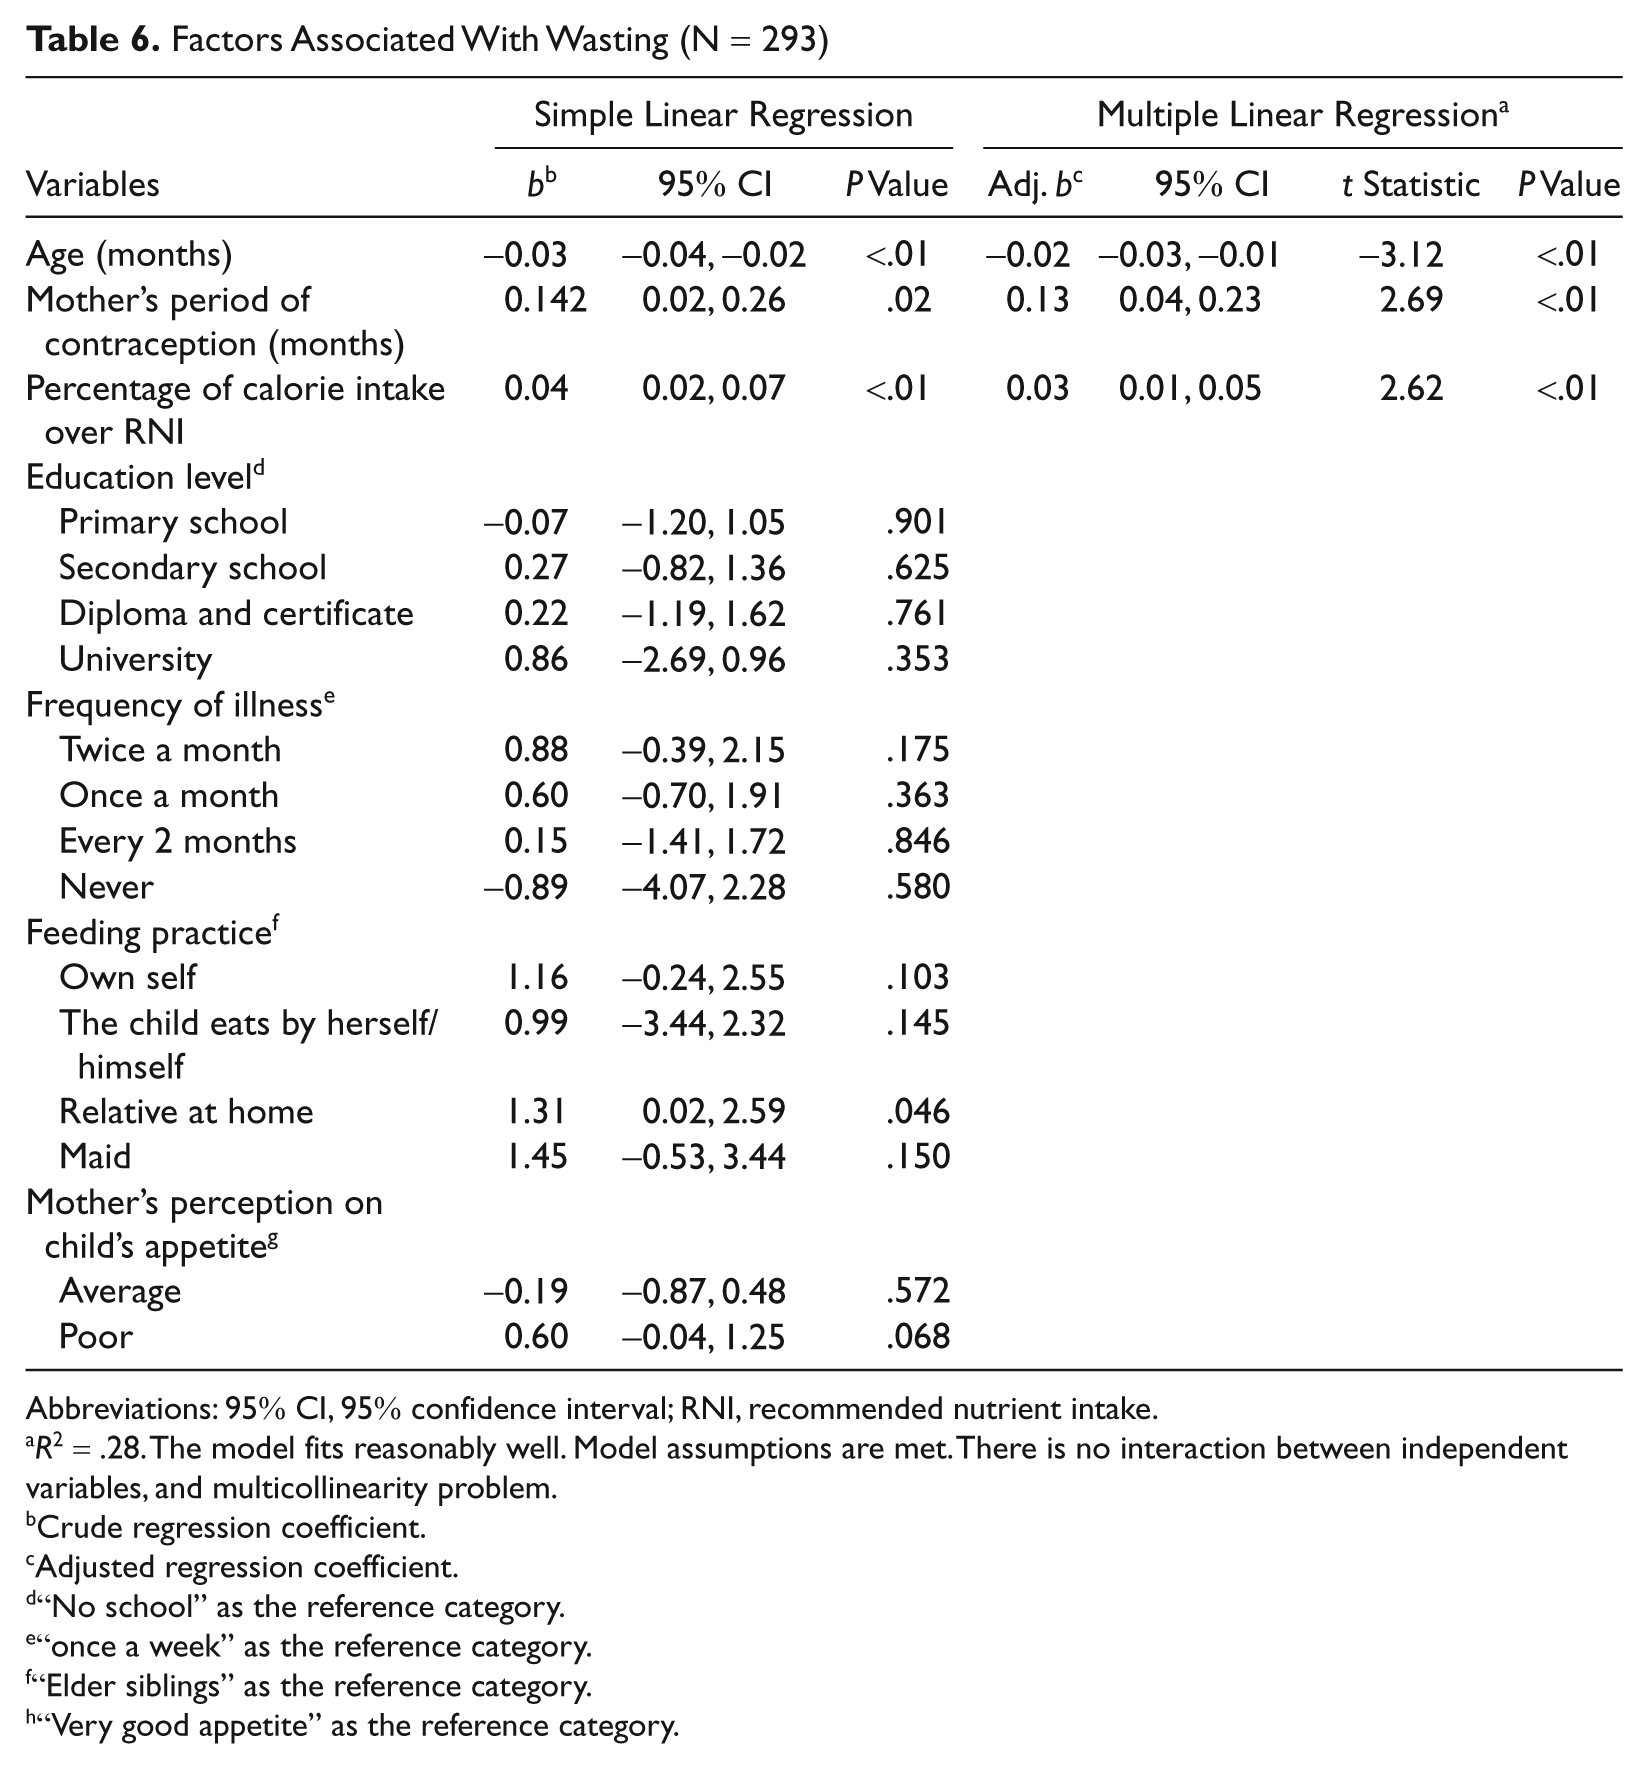
Abbreviations: 95% CI, 95% confidence interval; RNI, recommended nutrient intake.
R2 = .28. The model fits reasonably well. Model assumptions are met. There is no interaction between independent variables, and multicollinearity problem.
Crude regression coefficient.
Adjusted regression coefficient.
“No school” as the reference category.
“once a week” as the reference category.
“Elder siblings” as the reference category.
h“Very good appetite” as the reference category.
The last model on z score for MUAC-for-age, age (crude b −0.02, 95% CI −0.02, −0.01, P < .01), birth weight (crude b 0.42, 95% CI 0.20, 0.65, P < .01), and percentage of calorie intake over RNI (crude b 0.03, 95% CI 0.01, 0.04, P < .01) showed significant association with outcome. Multivariate analysis showed that age (adj b −0.01, 95% CI −0.02, −0.03, P = .003), birth weight (adj b 0.30, 95% CI 0.08, 0.51, P = .007), percentage of protein intake over RNI (adj b −0.01, 95% CI −0.01, −0.02, P = .019), and percentage of calorie intake over RNI (adj b 0.03, 95% CI 0.02, 0.04, P < .01) had significant association with z score MUAC-for-age (refer to Table 7).
Factor Associated With Low MUAC-for-age (N = 259)
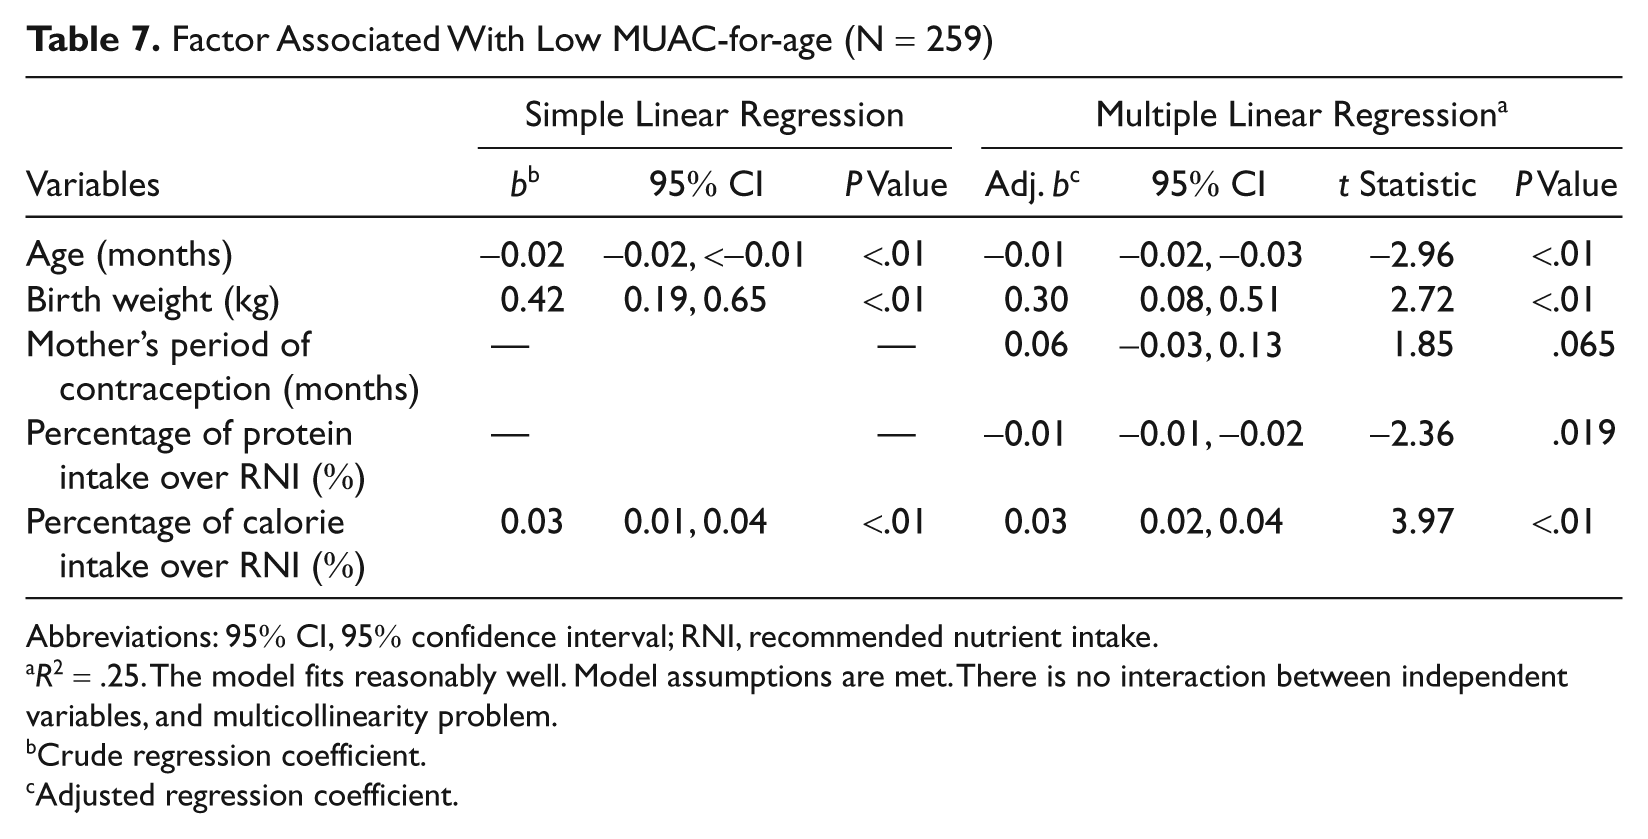
Abbreviations: 95% CI, 95% confidence interval; RNI, recommended nutrient intake.
R2 = .25. The model fits reasonably well. Model assumptions are met. There is no interaction between independent variables, and multicollinearity problem.
Crude regression coefficient.
Adjusted regression coefficient.
Discussion
The overall prevalence of malnutrition in this study (69% stunting, 63.4% underweight, 40% wasting and 26.8% with MUAC-for-age z score less than −2 were higher as compared with earlier studies.9-11 In this study, stunting and underweight were more prominent among children aged 13 to 36 months, whereas wasting and low MUAC-for-age were more common in the older age groups (37 to 60 months). This is similar to a study done in rural Nepal. 15 It is quite common for the stunting to start increasing after the age of 3 months and peaking at 3 years. 16 This is because stunting is a sign of chronic undernutrition, and therefore takes time to manifest compared with other undernutrition indicators.
Low birth weight was associated with all the 4 undernutrition indicators. The positive coefficients in Tables 4 to 7 indicate that the higher the birth weight, the better is the z score for weight-for-age, height-for-age, and MUAC-for-age. Similar results were reported in other studies.17,18
The average duration of breastfeeding reported was 15.57 ± 9.67 months, indicating that most mothers were aware of the importance of breastfeeding. The World Health Organization–recommended 19 duration of exclusive breastfeeding is 6 months and breastfeeding to continue with complementary feeding up to 24 months. Although these children were found to be breastfed for 12 to 24 months and complementary feeding was introduced at 4 to 5 months, yet undernutrition was prevalent. This is evidenced by the findings on that the mean age of introducing complementary feeding for underweight was 4.93 ± 1.75 months; stunting 4.71 ± 1.61 months; low MUAC-for-age 5.0 2.0 months, and wasting 5.03 ± 2.05 months. Nevertheless, the outcome of 24-hour dietary recall revealed that the mean percentage of calorie intake according to RNI was very low at 17.34% ± 7.54%. However, the mean percentage of protein according to RNI was high at 306.2% ± 134.97%. Further analysis of the type of food intake by the affected children revealed that majority of them consumed little rice (as the staple food), which was often diluted with soup to facilitate the feeding process. This finding is in contrast to the study done by Larrea and Kawachi, 20 who found a high proportion of carbohydrate and limited intake of proteins in their sample in Ecuador. In that study, the children were reported to be less interested in eating as compared with playing. It was further found in this present study that food served was perceived as “boring” and junk food was given to lure the children to eat.
The mean household income was RM 809.97 with the highest percentage (45.8%) from the income group less than RM 500 per month. This amount is equivalent to approximately US$ 254. This finding also indicated that these respondents lived below the Malaysian poverty line index. This might be related to the children’s fathers’ occupation, as 60% of them were employed in the construction area. Based on a field survey, most of these jobs were not reliable and were based on availability of housing projects. The remaining population (38%) was doing home business, and their income was based on market demand of their sales.
Another important observation in this study was that low family income was associated with stunting (RM 655.34 ± 414.73), wasting (RM689.68 ± 576.68), underweight (RM 651.15 ± 482.24), and MUAC-for-age less than −2 SD (RM 761.38 ± 767.89). This indicated that those with undernutrition problems were more likely to be from the low-income group. This finding is similar to the study of Norhayati et al 11 and Zamaliah et al, 21 who showed that poverty affected the majority of the households with food insecurity, and children from higher income family had better nutritional status (weight-for-age).
The mean household expenditure indicated that an average of RM 659.07 was used every month for expenditure at home. This was rather high as the average income was reported to be RM 809.97. Based on the field survey, even though the cost of living in the studied areas was low, not much savings could be put aside each month. The situation worsened during festive times or when schools reopened.
The study also indicated that there was a significant relationship between household expenditure and undernutrition problems (stunting = RM578.02 ± 297.32; wasting = RM 568.86 ± 314.99; underweight = RM 589.13 ± 307.67; MUAC-for-age less than −2 SD (RM 481.49 ± 152.05). During the northeast monsoon season, the main economic activities, based on agriculture and aquaculture, are badly affected by inundation. During this period, many of the families face difficulty in providing food at home as their income is disrupted. Many of the families indicated that they did not have access to suitable land for homegrown agriculture to generate extra income. Nevertheless, future study on the potential of each family in homegrown agriculture would be useful for intervention efforts.
Conclusion
The findings from this study showed that the rate of undernutrition children was higher compared with other studies. With the mean income of RM 650 to 690 per month, it was difficult for the family to sustain a normal living with adequate food and providing a conducive environment for healthy growth. Majority of the children were consuming low-energy diet, which could be the main contributing factor for undernutrition. Staple food such as rice was diluted to help the children to eat, which in turn reduced the amount of energy supply needed by the child. As expected, poor appetite could hinder children from eating well, which was reflected in the low calorie intake of the children. However, it was unclear why their diet was high in protein. Future study should examine this issue. Low birth weight was another contributing factor to undernourished children. Birth weight is affected by the general and nutritional health of the mother. Even though efforts have been carried out at the clinics to educate the mothers, the issue of lack of acceptance of contraception had not been totally resolved.
The findings revealed that there were differences in terms of determinants predicting different categories of undernutrition. Thus, the approach of using all 4 nutritional indicators—weight-for-age, height-for-age, weight-for-height, and MUAC-for-age—had helped generate a more comprehensive picture of what contributed to undernutrition from acute to chronic condition. However, this study shows that underweight has the most predictors compared with other undernutrition indicators. Thus, using underweight as an indicator for undernutrition would be considered the best. By addressing these determinants, early preventive measures can be taken, rather than to wait until the child gets into the condition of underweight, wasting, or stunting. Undernutrition in children may start before the child is born. If pregnant mothers are malnourished, their children would be born underweight. After birth, these newborns get insufficient breast milk because of mothers’ poor nutritional status. If this is followed by imbalanced complementary feeding, a child’s nutritional status would be further affected. If illness occurs, these children’s health would be further compromised. This vicious cycle is difficult to break and eradication of undernutrition would require social, economic, and political involvement. Strategies should focus on improving the people’s economic status and encourage better acceptance of contraception practice, and healthier feeding according to local cultural practices. As this study was done was conducted in the Tumpat district in Kelantan, generalization can only be made to sites with similar characteristics.
Footnotes
The author(s) declared no potential conflicts of interests with respect to the authorship and/or publication of this article.
The author(s) received no financial support for the research and/or authorship of this article.