






Abstract
The validity of survey measures of smoked and smokeless tobacco use in the Western Pacific Region is often unknown. We conducted a validation study (n = 201) in a random sample of rural adults in Cambodia. A comparison with salivary cotinine indicated (1) that survey items and pictograms of current tobacco use had an 87% (95% confidence interval [CI] = 78%-93%) sensitivity, 94% specificity (95% CI = 87%-98%), and 93% (95% CI = 85%-97%) positive predictive value in detecting cotinine levels >10 ng/mL; (2) a positive correlation with number of cigarettes smoked (R = 0.34; P = .01); and (3) a positive correlation with the amount of tobacco chewed (R = 0.44; P = .02). The validity of the index for the amount of smokeless tobacco used was enhanced by adding to the index the data from pictograms that were utilized to help participants estimate the amount of loose tobacco used per session. These tobacco items and pictograms were found to have excellent reliability (κ = 0.80-1) over 2 to 3 weeks. Interviewer-administered survey items and pictograms can provide an accurate, quantitative measure of smoked and smokeless tobacco use in rural Cambodia.
Keywords
Introduction
The World Health Organization’s (WHO’s) 2008 assessment of the global tobacco epidemic projects that between 2005 and 2023, tobacco use will contribute an excess of 175 million deaths worldwide and that the majority of these fatalities will occur in developing countries. 1 This alarming trend gave rise to a recent “MPOWER” initiative 1 by the WHO to implement the following 6 tobacco control measures in target regions: (1) Monitor tobacco use, (2) Protection against tobacco smoke, (3) Offer of help to quit tobacco, (4) Warning about dangers of tobacco, (5) Enforcement of bans against tobacco, and (6) Raising taxes on tobacco products. We note that such measures rely on being able to accurately monitor nationwide tobacco use both at a baseline level and to assess the efficacy of MPOWER control measures over time.
Accurate assessment of nationwide tobacco use is typically accomplished by survey measures of tobacco use in the context of a population-based household survey or census. In the US population, survey measures of cigarette use have shown excellent sensitivity (>97%) 2 and a strong positive correlation with urine, plasma, and salivary measures of cotinine or nicotine in a general population samples (ie, National Health and Nutrition Examination Survey [NHANES])2-4 and in subgroups such as African Americans, 5 Asian Americans (Cambodian, Laotians, and Vietnamese), 6 pregnant women,2,7 and patient samples. 8 Although there is a paucity of sensitivity data in non-US populations, similar positive correlations between survey measures of cigarettes and cotinine or exhaled carbon monoxide have been shown in Brazil, 9 Mexico,10,11 Poland, 11 Tanzania, 12 and China. 11
When considering the validation of survey measures of tobacco use globally, it is important to note that a sizable proportion of tobacco users in Asia are habitual users of smokeless tobacco (ie, added to a betel quid) 13 or some form of tobacco pipe. We are not aware of any published studies that examine the validity of survey measures of these tobacco habits in Asia, despite the availability of biomarkers (ie, salivary cotinine).14,15 Accurate survey measures must account for the amount of tobacco added to the betel quid. Similarly, measuring tobacco consumed among pipe and/or water-pipe users requires accounting for variance based on variables such as the following: pipe-loads of tobacco, water used, size of water-pipe well, and the duration of session. Neergaard and colleagues 16 have recently used data from India, Lebanon, Kuwait, and Jordan to show that a single 45-minute session with a water pipe delivered the same nicotine as 10 to 12 cigarettes.
Our study focuses on Cambodia, where we recently completed a large, nationwide survey of adult tobacco use (n = 13 988).17-19 During the design stage of this survey, the findings from survey items and pictograms on local tobacco products were compared with salivary cotinine levels among 200 adults. Our aims in the present study are as follows: (1) to evaluate the validity of survey items and pictograms on tobacco use in estimating exposure to tobacco as measured by salivary cotinine and (2) to evaluate the reliability of survey items and pictograms in estimating tobacco use.
Methods
Study Population
For the validity study that was conducted before the national prevalence survey, 17 we randomly selected 201 adults (ages 21 to 84 years) from a rural province (Kampong Thom) using methods (ie, census basemaps) that have been previously described. 17 Of these 201 adults, 196 (98% response rate) provided interviewer-administered survey data on tobacco use and saliva samples. For the reliability study that was conducted during the national prevalence survey, we randomly sampled 30 individuals (from 10 provinces) who had completed the national prevalence survey and 2 to 3 weeks later completed a reinterview using the identical survey and a different interviewer.
Informed consent was obtained in the participant’s language and in written form at the beginning of the data collection. Institutional review board approval of the survey, salivary cotinine, and sampling protocols of this study was obtained from the Ethics Committee of the Ministry of Health (Phnom Penh, Cambodia) and from the US-based ethics review committee at Loma Linda University (Loma Linda, California).
Survey Pictograms Designed Based on Findings From Qualitative Studies
During the design of the survey, we conducted focus groups by selecting participants from an administrative district of the Kampong Thom province. Of 61 villages of the district, 3 were randomly selected to participate in focus groups (18 women, aged 24-56 years, and 17 men, aged 22-63 years). The sampling of women and men was further stratified to ensure that 50% of each group were tobacco users (current or former). These groups were used to identify local tobacco products, and representative pictures were obtained that were used to design the pictograms of smokeless tobacco (ie, from the betel quid), pipes, and hand-rolled cigarettes.
Survey Items and Pictograms
The interviewer-administered survey included items on demographics and current and past tobacco use (cigarettes, both commercial and hand rolled; smokeless tobacco; and pipes), age at initiation, and exposure to environmental tobacco use. For cigarettes, participants were asked the following questions: (1) Do you currently smoke cigarettes (pictograms of commercial and hand-rolled ones displayed by interviewer)? (2) What is your best estimate of the number of days you smoked during the past 30 days? (3) What is your best estimate of the number of days you smoked a cigarette during the past 30 days? and (4) On the day or days you smoked cigarettes during the past 30 days, how many cigarettes did you smoke per day, on average (picture cards used to determine commercial [pictogram of the top 35 brands] or roll-your-own cigarettes)? For smokeless tobacco, participants were asked the following questions: (1) Do you currently chew tobacco (pictograms of cut tobacco leaf added to the betel quid)? (2) What is your best estimate of the number of days you chewed tobacco during the past 30 days? (3) During the past 30 days, on how many days did you chew tobacco? (4) On the day or days you chewed tobacco during the past 30 days, how many times per day did you chew? and (5) On the day or days you chewed tobacco during the past 30 days, how much tobacco did you chew each time (pictogram displayed prespecified weights [5, 10, and 30 g] of cut tobacco leaf)? For the tobacco pipe participants were asked the following questions: (1) Do you currently smoke a tobacco pipe? (2) What is your best estimate of the number of days you smoked a tobacco pipe during the past 30 days? (3) During the past 30 days, on how many days did you smoke a tobacco pipe? (4) On the day or days you smoked a tobacco pipe during the past 30 days, how many times did you fill the tobacco pipe each day? and (5) On the day or days you smoked a tobacco pipe during the past 30 days, list the type of tobacco pipe you smoked (pictograms for water pipe and other pipes).
For environmental tobacco smoke (ETS), exposure was measured using the following 3 items: (1)Do you inhale the smoke from any smoker (other than yourself) for more than 15 min/d and more than 1 d/wk? (2) How many days per week do you inhale the smoke from any smoker (other than yourself)? and (3) Where do you inhale the smoke from any smoker (other than yourself)—home, work, public place?
Salivary Cotinine Measure
Salivary cotinine was measured for each participant using the NicAlert test (NyMox Corporation)—a semiquantitative immunoassay technology that uses rapid test strips to assess salivary cotinine levels from exposure to cigarettes, smokeless tobacco, or tobacco pipes that have occurred during the past 48 to 72 hours. Cooke et al 15 have reported that the NicAlert test has a sensitivity of 93%, specificity of 95%, and positive predictive value of 95% when compared with salivary cotinine measured by gas chromatography nitrogen phosphorus detection.
After completion of the interviewer-administered survey, each participant provided a saliva sample, which was collected through a small funnel in a collection tube. The saliva was tested (on the NicAlert strip) on-site within 2 hours of collection of the specimen. Color zones 0 to 6 on the test strip indicate cotinine equivalents and thus provide a semiquantitative measure of salivary cotinine. The semiquantitative variable was further dichotomized into tobacco user (zones 1-6 represent ≥10 ng/mL cotinine) and nonuser (zone 0 represents <10 ng/mL cotinine). After the required 30 minutes of exposure time, the strips were photographed for confirmation by investigators at Loma Linda University.
Statistical Analysis
For the validity study, we used both dichotomous (<10 ng/mL and ≥10 ng/mL cotinine) and semiquantitative salivary cotinine measures as the gold standard for the validation of the survey measures of tobacco use. Comparison with the dichotomous cotinine values was accomplished by calculating sensitivity, specificity, and positive predictive values. Confidence intervals (CIs) for these measures were computed using the familiar efficient score method described by Newcombe. 20 A validity correlation between semiquantitative measures of cotinine and intensity of tobacco use (ie, number of cigarettes smoked per unit time and number of units of tobacco chewed per unit time) was calculated using Spearman’s rank test for the ordinal variables.
For the reliability study, we computed test-retest correlations and κ values between the survey measures of tobacco at baseline and at a retest with a different interviewer 2 to 3 weeks later. κ Values greater than 0.75 were used as evidence of reliability of the interviewer-administered survey method.
Results
Validity of Current Tobacco Use
Demographic and tobacco use data of the population in Table 1 indicate similar trends to the national sample 17 as evidenced by a mean age of about 40 years, 60% being married, and a tendency for men to smoke cigarettes (39.7% smoked the commercial brand and 24% smoked hand-rolled ones), whereas women chewed tobacco with betel quid (24.4%). It was also consistent with national trends that all participants indicated Khmer ethnicity, Buddhism for their religion, and no use of a tobacco pipe. Our data from the national sample 17 indicate that pipe use is infrequent and almost entirely practiced by ethnic and religious minorities (<5% of the population) in provinces on the Laos-Cambodia border.
Demographic Characteristics and Tobacco Use in a Sample of 196 Adults in Cambodia.

Abbreviation: SD, standard deviation.
In Table 2, we present validation data in which survey measures of tobacco use (cigarettes and smokeless tobacco) were compared with the semiquantitative assessment of salivary cotinine (0-9 ng/mL representing nonusers, ≥10 ng/mL representing a tobacco user). The contingency table data in Table 2 were used to compute a sensitivity of 87.0% (95% CI = 77.9%-92.8%), a specificity of 94.2% (95% CI = 87.4%-97.6%), and a positive predictive value of 93.0% (95% CI = 84.9%-97.1%) for the survey measures of tobacco.
Comparison of Current Tobacco Use Measured by the Tobacco Control Leadership Training (TCLT) Survey With Semiquantitative Assessment of Salivary Cotinine Levels Among 196 Rural Cambodian Adults.

In Figure 1, we present the findings from a Spearman’s rank correlation analysis to relate the number of cigarettes smoked per month among cigarette smokers to the level of salivary cotinine. We found a significant positive correlation (R = 0.34; P = .01) between an individual’s report of the number of cigarettes smoked and the salivary cotinine measured at the time of the survey. We further investigated this correlation by type of cigarette smoked (Figures S1 and S2; see supplementary material online) and found that the validity correlation with salivary cotinine was slightly stronger among commercial cigarette users (R = 0.33; P = .05) as compared with hand-rolled cigarette users (R = 0. 30; P = .14).

Correlation between number of cigarettes smoked per month among all cigarette smokers and salivary cotinine levels (R = 0.34; P = .01).
In Figure 2, we present similar findings among tobacco chewers that indicate a significant positive correlation (R = 0.40; P = .04) between a participant’s report of number of smokeless tobacco episodes per month and the levels of salivary cotinine. We further tested the validity of the pictogram item (see Appendix A, item 10, and Appendix B, picture card 2, in online supplementary material) in which participants were presented with an amount of tobacco chewed (held between the thumb and the forefinger) and asked whether they chewed “more,” “about the same,” or “less than” the amount of tobacco depicted. To test this item, we constructed an index of smokeless tobacco use that is given by the following:
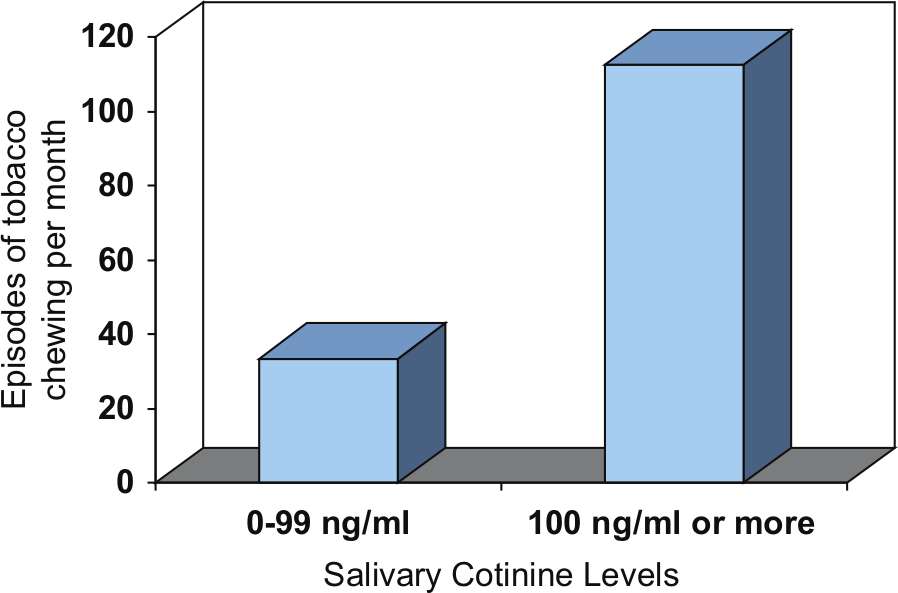
Correlation between chew episodes per month among chewers and low, medium, and high salivary cotinine levels (R = 0.40; P = .04).
where F represents a correction factor for the amount of tobacco chewed per episode (as measured by the pictogram). By a sensitivity analysis, we found that inclusion of F in the calculations further increased the correlation between the smokeless tobacco index and salivary cotinine (R = 0.44; P = .02).
Among participants who did not use tobacco, we compared the indication of exposure (15 min/d and more than 1 d/wk) to ETS and salivary cotinine. We found a sensitivity of 50% (95% CI = 22.3-77.7) and specificity of 59.2% (95% CI = 48.8-68.9), and the positive predictive value was low (13.0%, 95% CI = 5.4-27.0). Also, correlation between the number of days of ETS exposure and salivary cotinine was very low (R = 0.05; P = .55).
Reliability Study
We found excellent reliability for current and past tobacco use, with κ values ranging from 0.80 to 1.0 for specific forms of tobacco (see supplementary Table S1 online). For current use, a κ of 1 was found for repeated measures using a commercial cigarette pictogram of 37 brands and a picture card of the water pipe typically used in the Mondol Kiri province.
We conducted a paired t test (not shown in Table S1) to assess the reliability of the number of cigarettes smoked by current smokers and found a nonsignificant (P = .35) 1.36 cigarette difference with the retest results. We also found nonsignificant differences for the retest of money spent on cigarettes (259 riel difference, P = .62), age at initiation of the cigarette habit (0.42-year difference, P = .57), and age at initiation of any tobacco habit (5.94-year difference, P = .20).
We found poor reliability for repeat measures of exposure to environmental tobacco (κ = 0.57) and the location of the exposure (κ = 0.23).
Discussion
We tested the validity and reliability of a tobacco survey among adults in Cambodia and found that the combination of an interviewer question and a pictogram of a local tobacco product produced excellent validity and reliability. Our major findings include the following: (1) survey items and pictograms of current tobacco use were found to have an 87% sensitivity, 94% specificity, and 93% positive predictive value when compared with a salivary cotinine indicator of tobacco use (>10 ng/mL cotinine); (2) survey measures of the number of cigarettes smoked were positively correlated (R = 0.34; P = .01) with salivary cotinine; (3) a survey-derived index of amount of tobacco chewed (in betel nut form) was positively correlated (R = 0.44; P = .02) with salivary cotinine in an analysis whereby validity was enhanced by a pictogram-derived measure of the amount of tobacco chewed being added to the calculation of the index through a sensitivity analysis; and (4) survey measures and pictograms of current and past tobacco use were found to have excellent reliability (κ of 0.80-1) during a 2- to 3-week retest interval.
Our findings indicating the excellent validity of self-reported tobacco use in this population are consistent with qualitative studies indicating that cigarette smoking among men and smokeless tobacco use among women are socially acceptable habits that even have perceived medicinal value,21,22 and thus, self-report would not be greatly affected by social desirability biases. The poor validity and reliability of the self-reported ETS exposure is likely a result of (1) lack of detail in the survey item about participants’ perception of enclosed spaces, (2) the broad exposure range (by time and frequency) measured by the survey items (>15 min/d, >1 d/wk), (3) changes in ETS exposure over time, and (4) the lower sensitivity of the salivary cotinine test to detect low-level of ETS exposure. 23
Validity and Reliability of Survey Measures of Cigarette Smoking
Our findings indicating excellent accuracy for current cigarette use and a strong positive correlation between number of cigarettes and salivary cotinine among users are consistent with the findings from a wide range of studies where the survey measured exposure to commercial cigarettes.
Our data indicating that the validity correlation was better for commercial cigarette users (R = 0.33; P = .05) as compared with hand-rolled cigarette users (R = 0.30; P = .14) may be a result of the slightly smaller sample size (n = 27) for hand-rolled cigarette smokers. Additional sources of measurement error with respect to hand-rolled cigarettes should also be noted. For example, our qualitative data indicate important variability in the amount of tobacco added to hand-rolled cigarettes. Additionally, variation in the method and materials (banana leaf, leaf of the sangkhe tree, rolling paper, and other paper) could also contribute to differences in inhalation frequency, inhalation depth, and burn time of the resulting cigarette.
Overall, it is noteworthy that the lower correlations (R = 0.3) between number of cigarettes (of any type) and cotinine levels among Cambodian smokers may also be indicative of unmeasured features of the behavior that include but are not limited to puff topography, variation in nicotine by brand, variation in nicotine levels by local tobacco leaf types, mixed use of hand-rolled and manufactured brands, and changes in cigarette purchase during low-resource periods. The sample size of the smoker groups (39 manufactured-cigarette smokers and 27 hand-rolled cigarette smokers) also reduced the power to detect associations.
Validity and Reliability of Survey Measures of Smokeless Tobacco
Our findings indicate a significant positive correlation between the amount of smokeless tobacco used per month (amount per episode × episodes per day × days per month) and salivary cotinine in a context where tobacco is consumed together with a betel nut leaf, betel nut, and slaked lime. We are not aware of any other studies that examined the cotinine levels of smokeless tobacco consumed using this method, which is prevalent throughout Southeast Asia and South Asia (India and Bangladesh).
Correlations with measured cotinine levels have been investigated among smokeless tobacco users in the US—snuff users who “dip” commercially available tobacco (packaged in tins) into the side of their mouth for 1 to 2 hours at a time. Among 56 male, brand snuff users in Copenhagen, Hatsukami et al 24 found a significant positive correlation between cotinine level and number of dips per day, duration of dip, daily duration of snuff use, and interdip interval. Lemmonds et al 25 found a similar correlation only for duration of dip. Ferketich et al 14 found a significant positive correlation between salivary cotinine and a Smokeless Tobacco Dependence Scale (r = 0.31; P < .001) but not with duration of dip or amount of snuff consumed. One possible reason for the variability in findings is substantial variability in nicotine levels for various commercial brands of smokeless tobacco.
Limitations
A number of limitations of the study should be noted. Because of the smaller sample size (n = 201 adults) and use of only a single rural province, we did not have good coverage of smaller subgroups of the population, such as: ethnic minorities using tobacco pipes (<1% in the national sample), men who chew tobacco (1% of the national sample), or urban adults. We would not expect survey performance to be lower in urban adults or male users of smokeless tobacco. Also, our measure of salivary cotinine was semiquantitative and thus had lower power to detect significant correlations with survey measures. This would suggest that the current findings would be stronger in a study with a continuous variable. Finally, there is the possibility that the collection of a saliva sample following the survey interview produces a bias in the accuracy of the responses, though participants were not specifically told that this was a test of tobacco use.
Conclusions
Interviewer-administered survey items and pictograms can provide an accurate quantitative measure of cigarette and smokeless tobacco use in rural Cambodia. With the advent of household interviews using handheld computers (ie, WHO Global Adult Tobacco Survey), the facility to incorporate pictograms into a survey protocol is further increased.
Footnotes

Declaration of Conflicting Interests
The author(s) declared no potential conflicts of interest with respect to the research, authorship, and/or publication of this article.
Funding
The author(s) disclosed receipt of the following financial support for the research, authorship, and/or publication of this article: The research was funded by a National Institutes of Health/Fogarty International Center (Asian Leadership Training for Tobacco Control Research) grant (No. R01 TW05964-01).