
Abstract
Obesity, hypertension, and diabetes have risen dramatically in Asia, but few cohort studies track age and secular trends in these conditions. We use Cebu (The Philippines) Longitudinal Health and Nutrition survey data to document 1998 to 2015 prevalence and co-occurrence of body mass index (BMI; >25 kg/m2), high waist circumference (WC; >80 cm), elevated blood pressure (EBP; systolic ⩾130 or diastolic ⩾85 mm Hg), and type 2 diabetes among ~2000 women aged 29 to 62 years in 1998; and identify their relationship to community, household, and individual factors using longitudinal logistic regression. Prevalence (1998-2015) rates were 35% to 49%, BMI >25 kg/m2; 32% to 58% high WC; 21% to 59% EBP; and 2% to 14% diabetes. Only 20% of women had none of these conditions in 2015. Diabetes was strongly driven by age and secular trends in high WC related to higher socioeconomic status and urbanization. Hypertension increased with age in lower socioeconomic status rural and more affluent urban women. Results underscore the continuing need for public health measures to prevent obesity and to identify and treat hypertension and diabetes.
Introduction
Obesity, type 2 diabetes, and hypertension are increasing rapidly in many low- and middle-income countries, and cardiometabolic (CM) diseases have become the top causes of mortality.1-5 While obesity, and in particular central obesity, is a well-established risk factor for type 2 diabetes and hypertension, some studies suggest that there is a “metabolically healthy obese” phenotype characterized by a body mass index (BMI) >25 kg/m2 (or >23 kg/m2 in some Asian populations), without type 2 diabetes, hypertension, or dyslipidemia.6-8 A distinct pattern of fat distribution may characterize this phenotype, particularly in Asians, 9 with metabolically healthy obese individuals having less central adiposity.9,10 However, this phenotype may be only a phase in the development of CM disease risk, as many metabolically healthy obese individuals subsequently develop CM disease as they age.11-14
There are few long-term longitudinal studies in Asian populations where CM diseases develop at a lower BMI and at younger ages than in European or African populations. 15 We present analyses from the Cebu Longitudinal Health and Nutrition Survey (CLHNS), 16 which has followed a cohort of Filipino women since 1983, but added an emphasis on noncommunicable disease risk in 1998. Our main objectives were to (1) describe 17-year trends in the prevalence and co-occurrence of BMI >25 kg/m2 (overweight or obese [OWOB]), high waist circumference (WC), elevated blood pressure (EBP), and type 2 diabetes (referred to as diabetes, hereafter) and (2) determine how community, household, and individual sociodemographic factors relate to phenotypes characterized by co-occurrence of these conditions over time.
Methods
Study Sample and Data
In 1983, single-stage cluster-sampling was used to randomly select 17 urban and 16 rural barangays (administrative units) of Metro Cebu, the second largest metropolitan area in the Philippines. 16 All pregnant women in these barangays were invited to join the study, forming a 1-year birth cohort. We used data from the 1998 to 2015 surveys, which included measurement of CM disease risk factors: 1998-1999 (N = 1989), 2002 (N = 2102), 2005 (N = 2018), 2007 (N = 1977), 2012 (N = 1815), and 2015 (N = 1568).
Individual, Household, and Community Data
CLHNS data were collected during in-home interviews, supplemented with assessments in clinical settings by nurses or medical technologists. Socioeconomic status (SES) and demographic information included age, education, household income and assets, and urbanicity of residence. We categorized age in 1998 as <35 years, 35 to 39 years, 40 to 44 years, 45 to 50 years, and 50+ years. SES was represented by wealth (a factor score reflecting ownership of 31 household assets), household income (log-transformed earnings of all household members), and maternal years of schooling. A multicomponent urbanicity index represented population size and density, community infrastructure, and economic and environmental characteristics of each barangay. 17 Weight, height, and WC were measured using standard techniques. In 2012 and 2015, we used Tanita scales, which estimate total body fat based on bioelectric impedance, and provide a visceral fat score based on bioelectric impedance, age, and anthropometrics. OWOB weight status was categorized as BMI >25 kg/m2. Despite suggestions of elevated CM risk at lower BMI among Asians,18,19 we used this cut-point for greater comparability with other studies. High WC was defined as >80 cm.
Blood pressure was measured in triplicate by trained research staff or medical technologists using appropriate cuff sizes, after a 10-minute seated rest, using mercury sphygmomanometers (1998-2007) or OMRON HEM-7211 blood pressure monitors (2012-2015). We defined EBP as systolic blood pressure >130 mm Hg or diastolic blood pressure >85 mm Hg, or taking antihypertensive medications (the International Diabetes Foundation [IDF] guidelines). 20 We used this cut-point because it is part of the IDF guidelines for the definition of multiple risk factors associated with the development of CM diseases. Medications were reported and verified as antihypertensives.
Diabetes was self-reported in 1998 and 2002. In 2005, we collected fasting venous blood and defined diabetes as glucose ⩾7.0 µmol/L. In 2012 and 2015, we defined diabetes as hemoglobin A1c >6.5% (NycoCard Reader II). Fasting plasma lipids were measured only in 2005. Nonfasting lipids were measured in 2012 using the CardioChek point-of-care system. Because we only had 2 nonequivalent measures of lipids, and no self-reported dyslipidemia, lipids are not used to characterize time-varying phenotypes.
From reproductive histories updated at each survey, we identified total prior pregnancies in 1998, and number of pregnancies in each subsequent survey interval. Women pregnant at the time of data collection were excluded only from that survey. Two-day mean intake of total energy and percentage of energy from fat, carbohydrate, and protein were estimated from 24-hour dietary recalls, with nutrient values calculated using the Philippines food composition table. 21
All participants provided informed consent, and the CLHNS has ongoing approval from Institutional Review Committees at the University of North Carolina, Chapel Hill, and the University of San Carlos in Cebu, Philippines.
Data Analysis
Graphical representations of prevalence over time in 5 age cohorts illustrate age and secular trends, and random effects longitudinal logistic regression (XTLOGIT in Stata 14) 22 was used to model predictors of having each condition. We then created individual phenotypes based on the presence or absence of conditions at each survey. Of 16 unique phenotypes, 2 (OWOB + diabetes and OWOB + EBP + diabetes) found in only 1 or 2 individuals in any year were dropped from further analysis. For simplicity when naming phenotypes, hereafter, “healthy” refers to the absence of EBP and diabetes. We estimated subsequent prevalence of EBP and diabetes among women who were healthy in 1998.
We used polytomous logistic regression models (MLOGIT in Stata 14) 22 to identify predictors of phenotypes across all years, clustering by participant ID to adjust standard errors for within-woman correlation of repeated measures. Models were first estimated with normal weight, low WC, healthy women as the referent, then with healthy OWOB women with high WC (the second most frequent phenotype) as the referent. Covariates included age, height, household assets, income, education, urbanicity index, pregnancies, total energy intake, and percentage of energy from fat and carbohydrates, as recommended for an energy density model. 23 To gain further insight about the phenotypes, we compared mean total body fat and visceral fat score, C-reactive protein (CRP) as a biomarker of inflammation, and total cholesterol (TC) to high-density lipoprotein (HDL) ratio as a marker of dyslipidemia in 2012 when these more detailed measures were available.
Results
Characteristics of women in each survey year are presented in Supplemental Table 1 (all supplementary materials are available in the online version of the article). Attrition and item nonresponse reduced the sample over time. In 1998, owing to a funding focus on CLHNS birth cohort offspring, women not residing with their index child were excluded. In subsequent years, all original CLHNS mothers were invited to participate. From 1998 to 2015, the cumulative losses to follow-up are attributable to deaths (13.7%), migration from the study area (74.5%), refusals (4.0%), and ineligibility (7.8%). (See Perez 24 and Adair et al 25 for a complete account of attrition in the CLHNS.) The analysis sample for the current study included 2184 women with a mean of 4.5 observations each. Missing data were more frequent among younger women in 1998 and 2002 (largely owing to pregnancy), and among urban women in later years. Women were 29 to 62 years old in 1998.
Age and Secular Trends in the Prevalence of OWOB, High WC, EBP, and Diabetes, and Underlying Sociodemographic Factors Associated With Their Prevalence Across Survey Years
OWOB, high WC, EBP, and diabetes increased markedly across survey years, but patterns differed substantially by age (Figure 1). The largest increases in OWOB and high WC were in the youngest groups, where prevalence of high WC nearly doubled. The secular trend can be appreciated by comparing the age group with mean age of 50 years in 2002 to the age group with mean age of 50 years in 2015. The 13-year secular increase is from 41% to 61% for OWOB prevalence, with a 4.6 kg increase in body weight; and from 47% to 65% for high WC prevalence, with a 5.6 cm increase in WC.
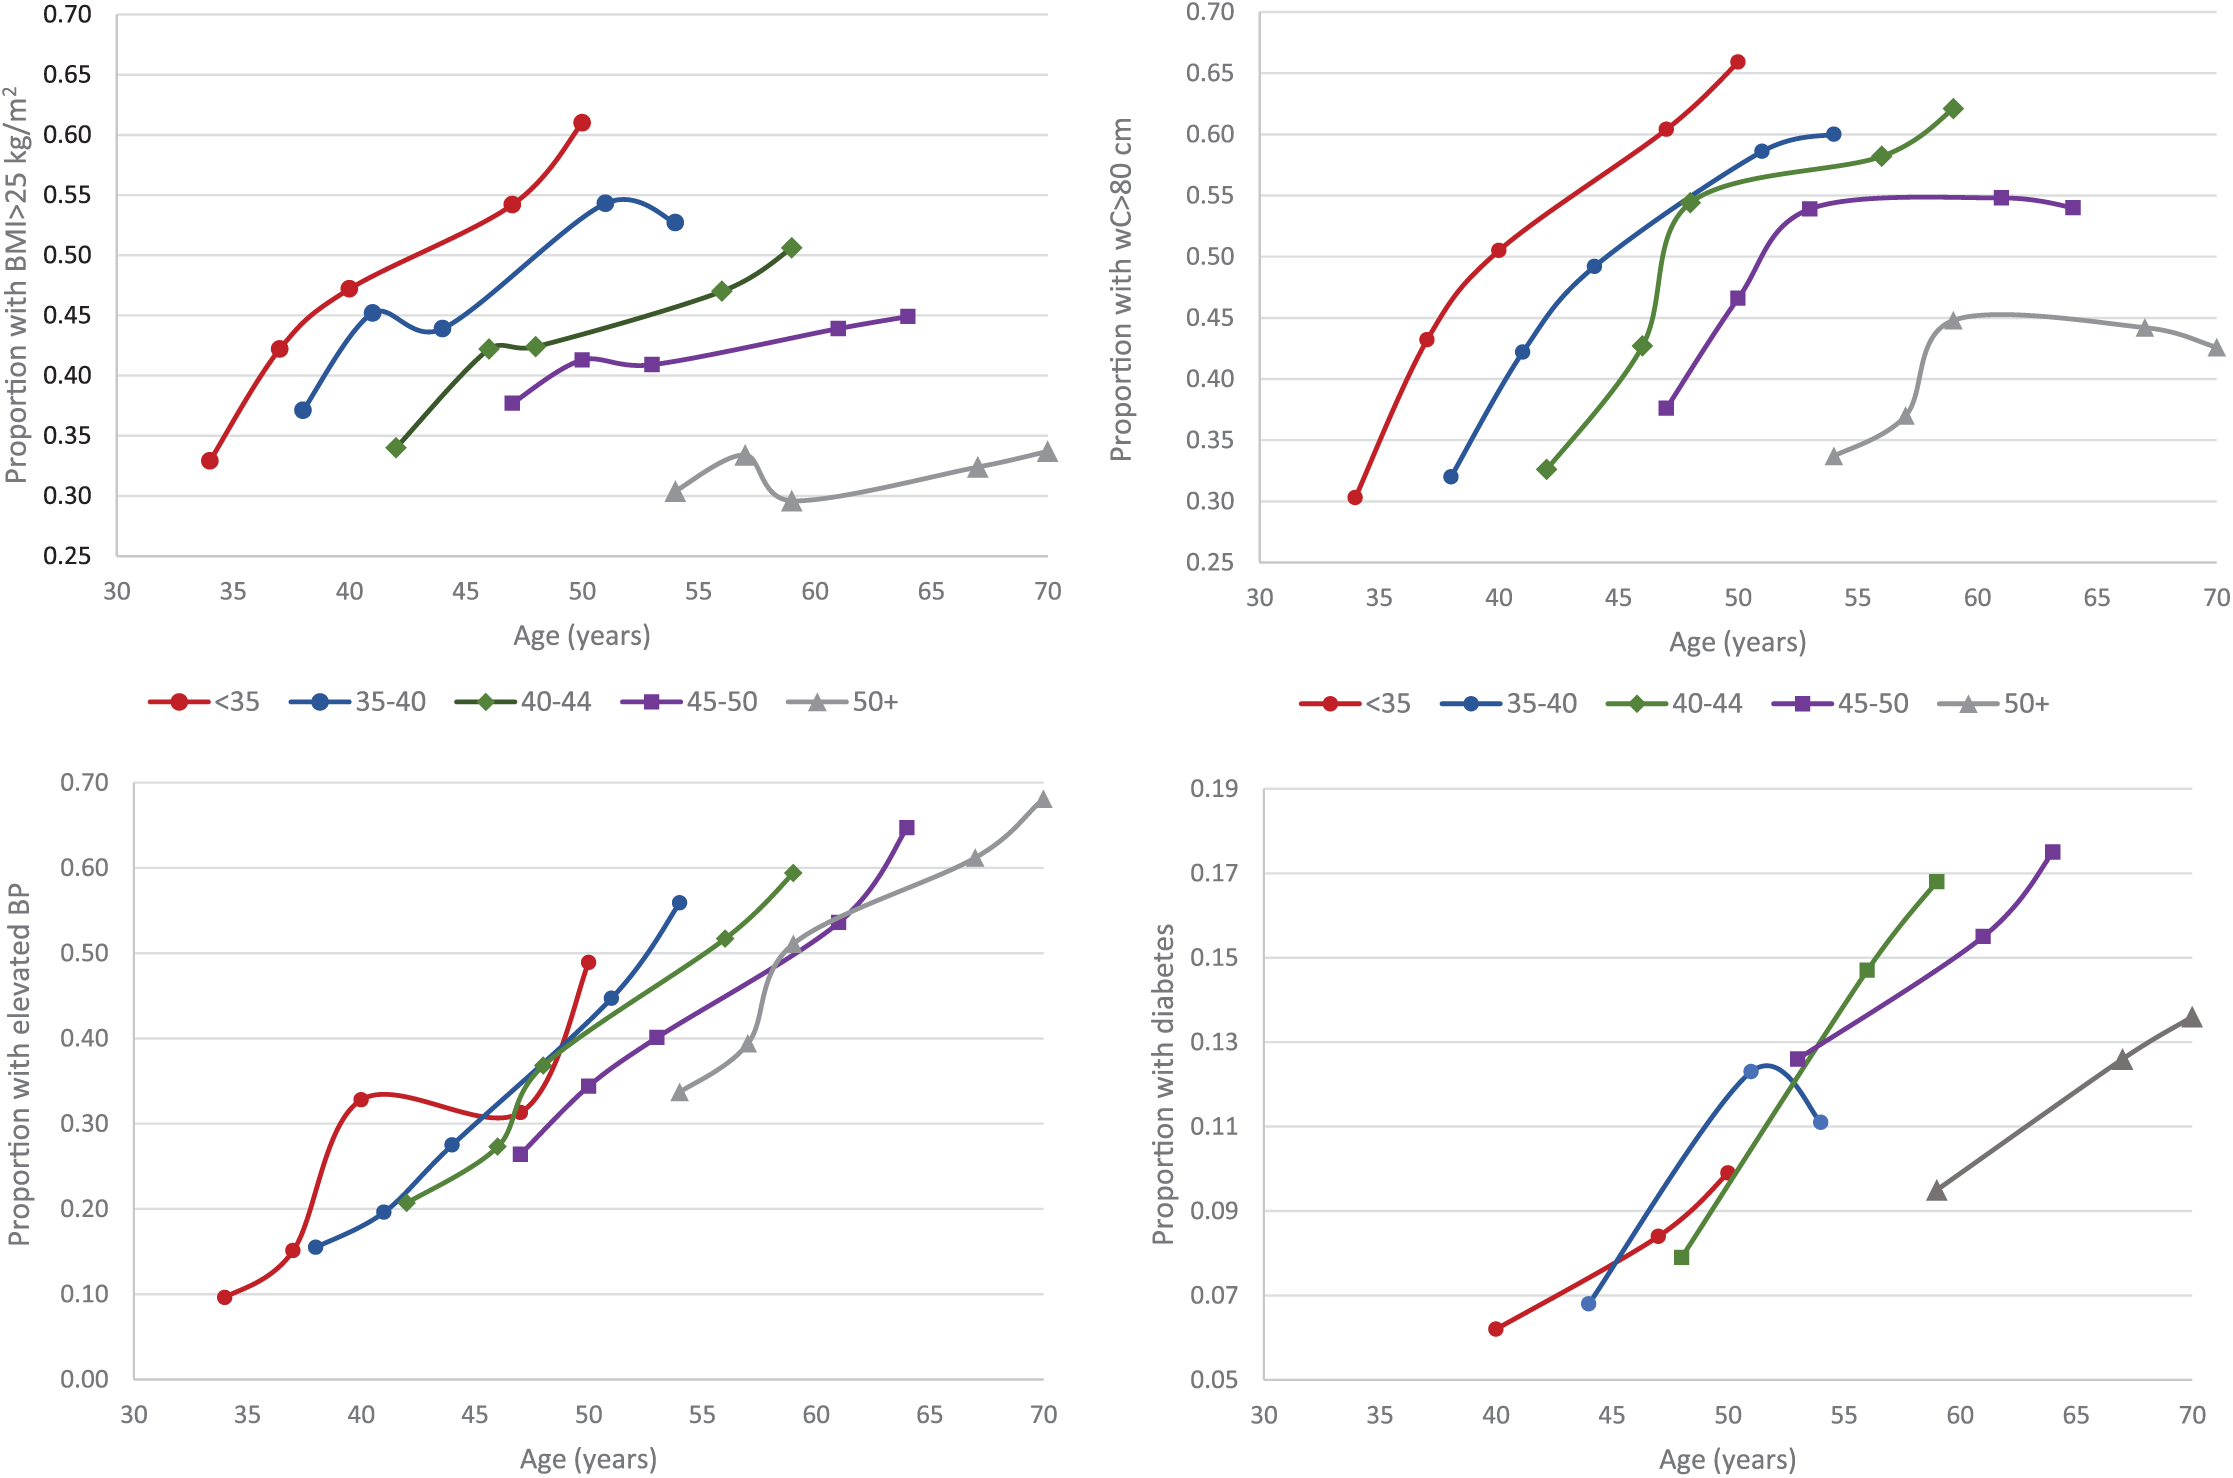
Age and secular trends in weight status (body mass index [BMI] >25 kg/m2), high waist circumference (WC; >80 cm), elevated blood pressure (EBP; the International Diabetes Foundation definition), and diabetes in Filipino women, 1998 to 2015.
Large increases in EBP prevalence occurred in all age groups. The prevalence difference related to the secular trend (as defined above) was 15 percentage points, corresponding to a 12 mm Hg secular increase in systolic blood pressure, not accounting for blood pressure medication use. Diabetes trends are shown only for the years when the definition was based on biomarkers (2005-2015). The prevalence difference related to the 10-year secular trend was 7.3 percentage points.
Supplemental Table 2 presents logistic regression results with data pooled across years for each condition. Controlling for year, odds of EBP and diabetes increased markedly with age. Age trends in OWOB and high WC leveled off with increasing age. Higher income was associated with increased odds of high WC, while higher assets were strongly associated with increased odds of OWOB, high WC, diabetes, and EBP. Higher urbanicity and maternal education were associated with higher odds of OWOB, high WC, and diabetes.
Pattern of Co-Occurrence of OWOB, High WC, EBP, and Diabetes Over Time
In 1998, half of the sample women were normal weight, low WC, and healthy, and 27% were OWOB and/or had high WC, but healthy (Figure 2). By 2015, only 20% had none of the 4 conditions, and 17% were OWOB and/or had high WC, but healthy. Incident EBP accounted for many changes in phenotype distribution over time. In 2015, the most prevalent phenotype was OWOB + high WC + EBP. Hypertension in the absence of OWOB or high WC became the third most prevalent phenotype in 2015. Among women without EBP in 1998, subsequent prevalence of EBP was strongly related to their weight and WC status (Supplemental Figure 1). Among women without diabetes in 2005, diabetes in 2012 and 2015 was most strongly related to high WC. Among OWOB women without high WC, there was no diabetes.
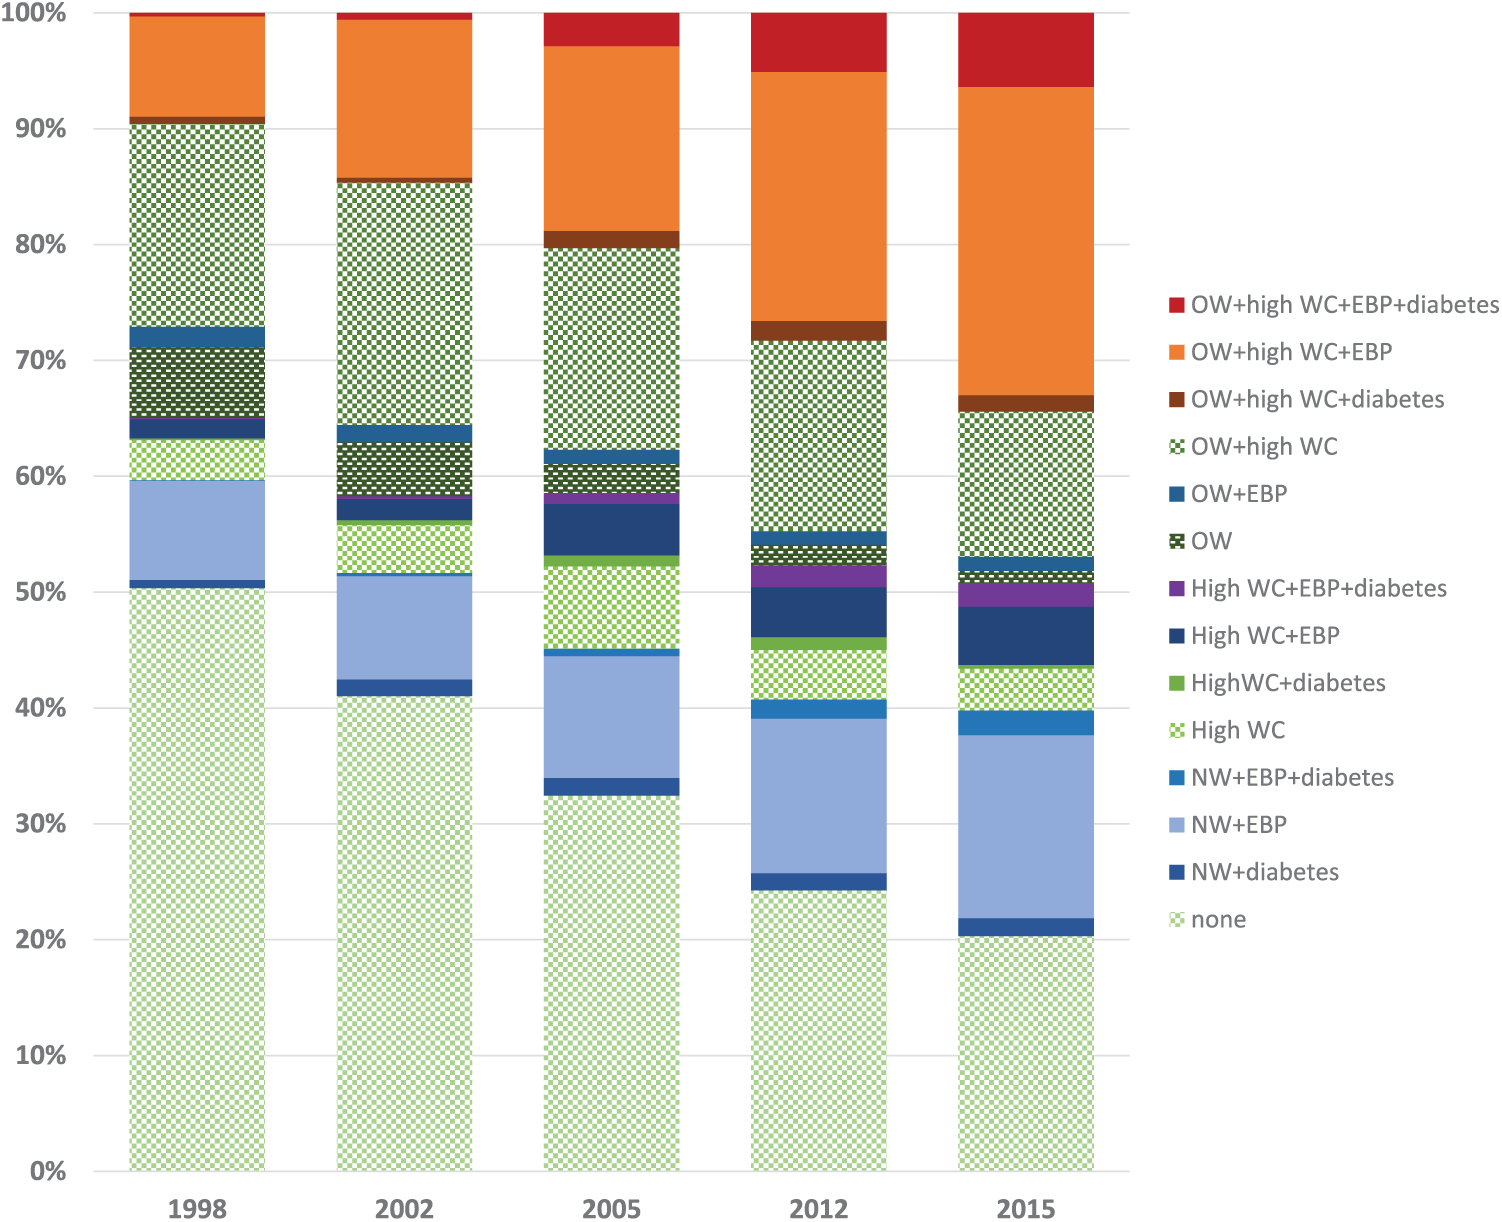
Phenotypes based on co-occurrence of overweight/obesity (body mass index [BMI] >25 kg/m2), high waist circumference (WC; >80 cm), elevated blood pressure (EBP; the International Diabetes Foundation definition), and diabetes in Filipino women, 1998 to 2015.
Individual, Household, and Community Characteristics Related to the Phenotypes
Phenotype-specific mean characteristics in 2012 are shown in Table 1. Compared with normal weight + low WC + healthy women (Table 1, first row), women with EBP only were, on average, 2 years older. Women with high WC only, and women with high WC + EBP + diabetes had higher CRP. WC and visceral fat score differentiated the phenotypes, even when WC was <80 cm. Among normal weight women, those with EBP had a higher visceral fat score, and those with diabetes had higher WC and visceral fat score compared with healthy women.
Characteristics of CLHNS Women in 2012, Classified by Co-Occurrence of OWOB, High WC, EBP, and Diabetes.
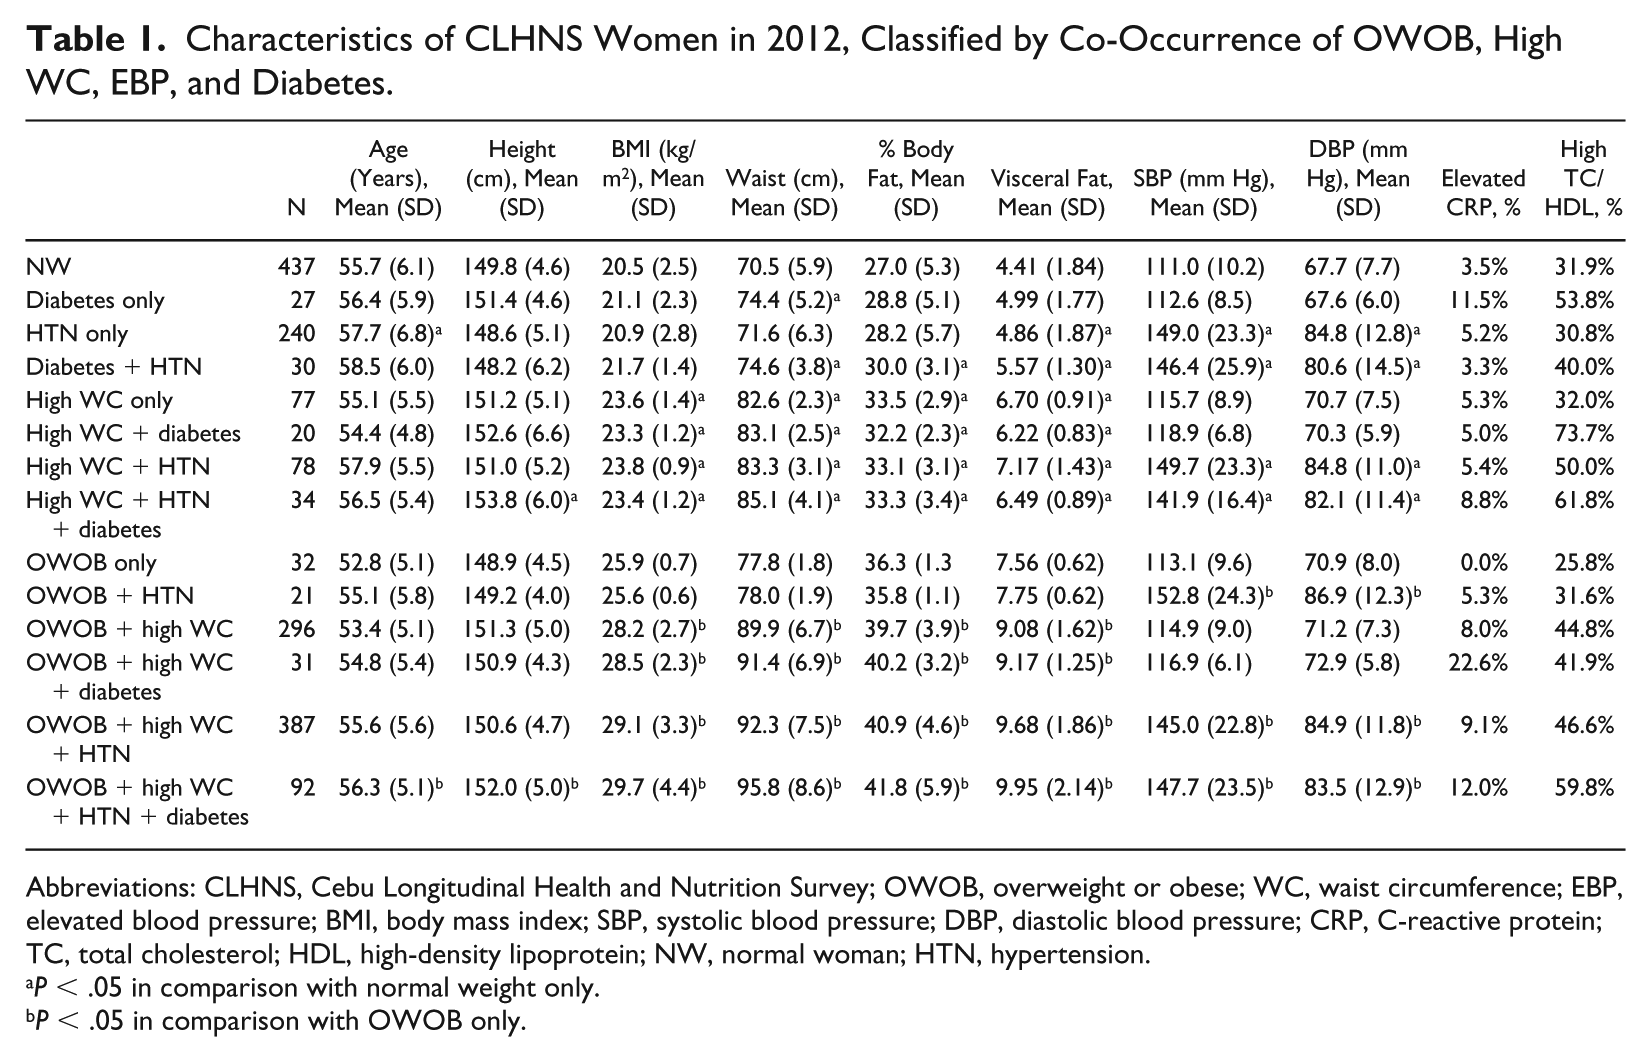
Abbreviations: CLHNS, Cebu Longitudinal Health and Nutrition Survey; OWOB, overweight or obese; WC, waist circumference; EBP, elevated blood pressure; BMI, body mass index; SBP, systolic blood pressure; DBP, diastolic blood pressure; CRP, C-reactive protein; TC, total cholesterol; HDL, high-density lipoprotein; NW, normal woman; HTN, hypertension.
P < .05 in comparison with normal weight only.
P < .05 in comparison with OWOB only.
Compared with normal weight + low WC +healthy women, those with high WC and those with EBP and/or diabetes had higher BMI, and total and visceral fat. Among OWOB women, all with high WC had higher CRP. High atherogenic ratio (TC/HDL >5), was more prevalent in women with any phenotype that included high WC, regardless of weight status, compared with women with low WC (47.3% vs 32.5%, respectively, χ2 P < .001).
The first set of multinomial logistic regressions estimated the likelihood of being in each phenotype relative to normal weight + low WC + healthy women (Supplemental Table 3). Regardless of weight status, older age was associated with higher likelihood of all phenotypes that included diabetes or EBP, with the largest age effects in women over 40 years in 1998. Taller stature was associated with higher likelihood of all phenotypes that included high WC, while shorter stature was associated with higher likelihood of the OWOB only and OWOB + EBP phenotypes. Coefficients on household assets score were positive, and of similar size across all phenotypes, but precision of estimates varied with sample size such that not all comparisons were statistically significant. Higher household income was associated with OWOB phenotypes that included high WC. Pregnancies during survey intervals after 1998 were associated with higher risk of phenotypes that included high WC. Higher percentage of calories from protein (the omitted macronutrient in the model) were associated with increased likelihood of disease phenotypes that included high WC.
Compared with OWOB + high WC + healthy women, taller stature was associated with lower likelihood of OWOB + low WC, and of having EBP. Higher education was associated with increased likelihood of having EBP alone or in combination with diabetes. Higher percentage of calories from fat and carbohydrate were associated with an increased likelihood of the diabetes only phenotype (Supplemental Table 4).
Given the well-established association of EBP with weight status, the normal weight + low WC + EBP phenotype is worthy of additional attention. This phenotype was one of the 4 most prevalent in our sample and it increased substantially over time. Compared with the more typical pattern of EBP in overweight women with high WC, thin women with EBP were older, shorter, from households with lower income and assets, lived in less urbanized communities, and consumed total fewer calories, but a higher percentage of energy from fat. Reported blood pressure medication use in 2012 was less frequent in this phenotype (30.8% in 2012, 36.3% in 2015) compared with medication use in overweight women, high WC hypertensive women (47.0% in 2012, 52.1% in 2015).
Given the Philippines’ status as a low- to middle-income country, there is a remaining concern about undernutrition, particularly in older women. In 2015, 16.0% of women in the oldest age group had a BMI <18.5 kg/m2, and among these underweight women, 35% were hypertensive. Fewer underweight hypertensive women were taking blood pressure medications (18.2% and 29.2% in 2012 and 2015, respectively) compared with 43.2% and 51.9% of normal or OWOB hypertensive women.
Discussion
Our cohort of Filipino women followed through midlife experienced large increases in OWOB, high WC, type 2 diabetes, and EBP prevalence, consistent with trends seen in other Southeast Asian countries. For example, based on national estimates, type 2 diabetes prevalence doubled in Vietnam between 2002 and 2012, 26 and in Malaysia obesity prevalence increased from 12.2 in 2003 to 15.1% in 2011. 27
The range of baseline participant ages in the CLHNS offered the opportunity to identify age and secular trends in these conditions. We found strong secular trends in all outcomes. Our youngest age group in 2015 was heavier and had more central adiposity and higher prevalence of EBP than the comparable age group in 2002. These changes reflect the rapid social and economic development in Metro Cebu in the past several decades. Similar increases have been observed in China, where the age-adjusted prevalence of BMI >24 kg/m2 increased in women aged 40 to 59 years from 31.6% to 50.6% from 1991 to 2011. 28 Higher BMI in younger aged women, and the noted secular trend in BMI, is important in the context of public health, portending a worsening of CM disease risk and its associated health care costs and threats to quality of life if the trends are not reversed. Younger women who were of childbearing age through all survey years had larger increases OWOB prevalence compared with older women. In the oldest age group, OWOB prevalence changed very little, and some older women experienced weight loss during the last decade.
We identified phenotypes based on the co-occurrence of OWOB, high WC, diabetes, and EBP. Healthy phenotypes did not persist. As women aged, most progressed out of healthy status, with the decline in healthy phenotypes largely reflecting sharp increases in EBP. Other longitudinal studies have also found that the metabolically healthy obese (MHO) phenotype is transient. For example, in the Korean Genome and Epidemiology study, hazard ratios for diabetes and cardiovascular disease were moderately elevated (1.2 and 1.4, respectively), and about 16% of individuals who were MHO at baseline had maintained that phenotype after 10 years. 14 Similarly, in a US cohort, 20% of MHO individuals retained that phenotype after 15 years. 12
OWOB, high WC, and diabetes were more likely among urban women with higher SES, marked by higher education, household assets, and/or income. In contrast, EBP was more widely distributed. While most EBP was in women with OWOB and high WC, we also observed EBP in the absence of OWOB or high WC. This EBP-only phenotype increased from 8.5% in 1998 to 15.8% in 2015 and was more likely in older women residing in rural areas and having low income and assets. Across all years, 8.6% of women had BMI <18.5 kg/m2, but in the oldest age group, 16.1% were underweight in 2015. The high level of EBP (35%) among underweight women in 2015, coupled with their lower use of antihypertensive medications, calls attention to the need for better screening and health care in this group.
Stature significantly predicted some phenotypes. Stature represents women’s nutritional and socioeconomic history, and taller women are more likely to have higher SES and better nutritional status. Stature is also modestly correlated with WC (0.23), and significant height associations may partly reflect higher central adiposity not fully captured by our binary high WC variable.
We found only modest associations of phenotype with diet. Higher total energy was associated with OWOB, especially OWOB + high WC phenotypes. This is expected based on higher energy needs related to larger body size. Negative coefficients on percentage of calories from fat and carbohydrate indicate that a higher percentage of calories from protein (the omitted macronutrient category) was associated with higher likelihood of phenotypes associated with higher WC. In the Philippines, higher protein intakes largely reflect higher pork and fish consumption.
Additional biomarkers and more detailed body composition measures available in 2012 are informative for better understanding the phenotypes. Among normal weight + low WC women, those with diabetes or EBP had more central adiposity, even though WC was <80 cm. Similarly, among OWOB women, those with diabetes or EBP had higher WC.
Filipino women are known to have a high prevalence of “isolated low HDL” compared with US and other populations. 29 The atherogenic ratio (TC/HDL) largely reflects low HDL in Cebu women, and is elevated with high WC. We used a BMI cut-point of 25 kg/m2 to define OWOB. If we used BMI >30 kg/m2, some relevant phenotypes had number too small for analysis. We chose the the IDF cut-points for elevated blood pressure. 20 If we used obesity (>30) and the World Health Organization definition of EBP, 5.3% of women would be classified as “healthy obese” in 2015 (vs 20% with the definition we used).
Important limitations include attrition and missing data, the lack of directly comparable measures of diabetes across survey years, the change in blood pressure instrumentation between 2005 and 2012, and the lack of comparable lipid measurements and more detailed body composition data across all years. We completed a detailed analysis of attrition in the CLHNS, identifying causes of loss to follow-up across all years.24,25 Missing data were more likely in the earlier years of the study owing to exclusion of women when they were pregnant. Also of note is the increasing mortality related to diabetes and cardiovascular disease among older women. Since healthier individuals are more likely to survive into late ages, this will impact the apparent health profiles of the oldest cohorts through selection. Selection related to survivorship may explain the lower diabetes prevalence among the oldest women in the sample (50+ years) compared with the remaining age groups. We restricted most of our analyses of diabetes to the 2005 to 2015 time period, when glycemic status was measured with biomarkers. We retained self-reported diabetes measures from 1998 and 2002 in the multidimensional phenotype profiles, despite the likelihood of underreporting in those years, so that we could have a longer time span over which to see change. We felt confident about this choice because a sensitivity analysis of correlates of self-reported versus biomarker-based diabetes status yielded no substantive differences.
Notable strengths of the study include long-term follow-up, with 5 surveys spanning 17 years, and detailed data on important exposures and CM health-related conditions, allowing us to differentiate phenotypes marked by different combinations of these conditions and to identify key predictors.
In sum, we noted strong age and secular trends in the prevalence of OWOB, high WC, diabetes, and EBP associated with higher SES. While weight gain and CM disease prevalence were highest among higher income women, the burden of these diseases increasingly affected all income groups. The most frequent phenotype included concurrent OWOB, high WC, and EBP. However, a sizeable subset of Cebu women had EBP despite having normal weight, or even despite being underweight. The healthy OWOB phenotype did not persist in most women. By 2015, when the mean age was 59 years, only 20% of CLHNS women had none of the 4 studied conditions. These data underscore the continuing need for public health measures in the Philippines to screen for CM diseases, and to provide guidance and treatment aimed at reducing weight gain and central adiposity while improving access to antihypertensive and other necessary medications.
Supplemental Material
Supplemental_Tablesandfigures – Supplemental material for Seventeen-Year Changes in Body Mass Index, Waist Circumference, Elevated Blood Pressure, and Diabetes Phenotypes in a Cohort of Filipino Women
Supplemental material, Supplemental_Tablesandfigures for Seventeen-Year Changes in Body Mass Index, Waist Circumference, Elevated Blood Pressure, and Diabetes Phenotypes in a Cohort of Filipino Women by Linda S. Adair, Christopher Kuzawa, Thomas McDade, Delia B. Carba and Judith B. Borja in Asia Pacific Journal of Public Health
Footnotes
Declaration of Conflicting Interests
The author(s) declared no potential conflicts of interest with respect to the research, authorship, and/or publication of this article.
Funding
The author(s) disclosed receipt of the following financial support for the research, authorship, and/or publication of this article: R01-AG039443, Carolina Population Center NIH Center grant (P2C HD050924) for general support.
Supplemental Material
Supplemental material for this article is available online.
References
Supplementary Material
Please find the following supplemental material available below.
For Open Access articles published under a Creative Commons License, all supplemental material carries the same license as the article it is associated with.
For non-Open Access articles published, all supplemental material carries a non-exclusive license, and permission requests for re-use of supplemental material or any part of supplemental material shall be sent directly to the copyright owner as specified in the copyright notice associated with the article.