
Abstract
Existing estimates of mortality for Papua New Guinea (PNG) have primarily been based on models using little empirical data, and without estimation of life expectancy at subnational level. We used data on deaths from the 2000 and 2011 censuses and indirect demographic methods to estimate under-5 mortality (5q0), adult mortality (45q15), and life expectancy by province and sex. A Socioeconomic Composite Index was constructed to assess the plausibility of life expectancy estimates. We generated 5q0 estimates (68 per 1000 live births for males and 58 for females), 45q15 (269 per 1000 for males and 237 for females), and life expectancy (62.0 years for males and 64.3 for females) in PNG in 2011. Provinces with low life expectancy had correspondingly low levels of development as measured by the Composite Index, and vice versa. These subnational estimates of mortality levels and patterns maybe useful at the provincial level to improve population health in PNG.
Keywords
Introduction
Papua New Guinea (PNG) is a country with significant geographic, cultural, and economic diversity, with 88% of its 8 million population living in rural and remote communities where access is often difficult resulting in significant challenges to improving population health. 1 To our knowledge, no comprehensive analyses of mortality in PNG and its provinces have been published in the academic literature, primarily because the civil registration system is dysfunctional and there is no other routine source of reliable mortality data. 2 Previous mortality studies in PNG have focused on specific infectious diseases, particularly malaria, pneumonia, and TB (tuberculosis), and population-based mortality studies have been limited to small populations in few selected sites.3-7
Mortality Studies in PNG
Between the 1950s and 1970s, studies on early age mortality in a few sites in PNG indisputably showed long-term declines.3-5 Subsequent analysis by Gouda et al 6 on deaths collected through verbal autopsies from 4 sites between 1970 and 2000 reported under-5 mortality rates (U5MR) of 104.7 per 1000 in Tari, Southern Highlands province; 91.2 in Asaro, Eastern Highlands; and 65.6 in Karkar, Madang. More recently, Gouda and colleagues 7 reported U5MR that were half those from the verbal autopsies series suggesting decline in child mortality in these sites.
The only representative mortality estimates for PNG have been derived from censuses and surveys. Bauze et al 8 reported U5MR as 78 per 1000 in 2000, with large inter- and intra-provincial variations. These patterns are similar to those reported by Bakker 9 and the National Statistics Office (NSO). 10
Publications on life expectancy at birth for PNG are provided by the United Nations 11 and the Global Burden of Disease Study (GBD), 12 using different model life tables. The UN life expectancy estimates of 62.4 for males and 67.2 for females are substantially higher than those reported by the GBD of 57.8 for males and 60.3 for females. Aside from under-5 mortality, the GBD does not use empirical data but relies on socioeconomic covariates and mortality levels and age patterns of nearby countries to estimate mortality. Furthermore, these sources provide only national estimates without subnational estimates for PNG.
Given the limited information on mortality in PNG, there is very little understanding of mortality levels and patterns at national and subnational levels. This study seeks to address this knowledge gap by estimating key mortality indicators in PNG by province and sex, using available data sources and a range of demographic methods. Specifically, the study estimates the risk of dying below 5 years (U5MR [5q0]), the risk of adult mortality (45q15, or the probability of dying from age 15 to 60 years), and life expectancy at birth. These results are then compared with a Composite Index that measures socioeconomic status, and heath care access differences among provinces in PNG, to assess the plausibility of the mortality findings.
Methods
Data Sources
PNG lacks reliable data sources from which to accurately measure mortality. 13 Information on deaths is fragmented because civil registration is dysfunctional. The National Department of Health collects data on 6000 to 11 000 individual deaths annually, primarily from provincial hospitals through the Discharge Health Information System (DHIS), and approximately 8000 to 15 000 deaths per year from health centers and hospitals via the National Health Information System (NHIS). However, these sources exclude deaths outside facilities, making the data unsuitable for estimating population-level mortality indicators. The 2000 and 2011 censuses collected summary birth histories (SBHs; i.e, number of children ever born and still living), parental survival or orphanhood data, and household deaths (by age and sex) in the last 12 months. SBHs and parental survival data from the 2006 Demographic Health Survey (DHS) were found to be of poor quality by Bauze et al 8 and so were not analyzed further in this study. Approval was obtained from the Director of NSO for the use of the census and DHS data.
Estimating Under-5 Mortality
SBH data calculated from the 2011 census, tabulated by 5-year age groups of women aged 15 to 49 years, were used to estimate 5q0 for each sex and province using the maternal age cohort method. 14 The resulting 5q0 from the 2011 census, however, was estimated as 39, much lower than the level of 63 estimated by the United Nation Inter-Agency Group for Child Mortality Estimation (UNIGME) based on modeling of trends of estimates from censuses and DHSs. 15 Final 5q0 estimates by sex and province were calculated by scaling to UNIGME estimates; the ratio of provincial sex-specific 5q0 to national sex-specific 5q0 was multiplied by the sex-specific 5q0 estimated by UNIGME.
Estimating Adult Mortality
Adult mortality in this study was estimated based on the parental survival data from the 2000 and 2011 censuses using the orphanhood method.16,17 Male and female 45q15 were estimated based on the proportion of respondents with a surviving father or surviving mother, respectively, tabulated by the 5-year age group of the respondent, using data from both the 2000 and 2011 censuses for females, and 2011 census only for males since no question on paternal survival was asked in the 2000 census. For females, parental survival data by 5-year age group of respondent from 2 censuses allowed us to construct a hypothetical cohort of respondents to estimate adult mortality based on changes in the survival status of each cohort’s parents.18,19
The completeness of the estimated 45q15 for males for each province (ie, the estimated 45q15 divided by the actual 45q15) was measured using an empirical completeness method developed by Adair and Lopez. 20 The estimated number of reported deaths was calculated using a model life table for 2002 (the reference date of the male orphanhood estimate), with the 45q15 taken from the orphanhood estimate and the 5q0 from Bauze et al provincial estimates scaled to the IGME estimate for 2002. 8 This completeness estimate was then used to adjust the original male 45q15 estimate upward. No adjustment of female 45q15 estimate for completeness was made because the hypothetical cohort method uses the same questions of the same cohorts of respondents at 2 points in time, so any bias due to systematic underreporting of mortality would be minimal. Each of these estimates was then projected from the reference date (2002 males and 2005 females) to 2011 by using the trend in PNG 45q15 over the ensuing period estimated by the GBD. 13
The quality of the 2011 census household deaths, NHIS, and DHIS data were evaluated to assess their suitability for use in estimating adult mortality. The natural logarithm of age-specific death rates based on 2011 census household death and population data was first calculated followed by assessment of the NHIS and DHIS actual provincial deaths captured for completeness. 20 For both the NHIS and DHIS, the provincial level number of reported deaths was the sum of the maximum annual number of deaths reported in each facility from 2007 to 2013.
Use of Model Life Tables to Generate Complete Life Tables
Three model life tables, the UN General Life Table System, the Modified Logit System, and the Log Quadratic System, were assessed for their appropriateness to generate age-specific death rates (ASDRs) across all ages.14,21,22 Each model life table relies on 5q0 and 45q15 as inputs. Life expectancy of males and females for PNG and its provinces was taken as the average of all 3 models.
Composite Index
A Composite Index to measure provincial differences in socioeconomic and health characteristics was developed to assess the plausibility of provincial mortality levels and patterns. 13 The Composite Index is derived from the arithmetic mean of education, economic, and health access indicators.23-25 Each indicator was adjusted to be a normally distributed percentage with mean of 50%.
Results
Quality Assessment of Data Sources for Adult Mortality
We assessed the NHIS and DHIS for completeness of death reporting and the 2011 census for plausibility of ASDRs. Despite taking the maximum number of deaths reported by each health facility in the period 2007 to 2013, the NHIS and DHIS reported only 28% and 22% of deaths, respectively (Table 1A, available online), making these data sources unsuitable to derive mortality statistics because they are unrepresentative of the mortality experience of the population of each province.
The pattern of ASDRs (Figure 1A, available online) is highly implausible, as the lowest ASDR for both sexes occurs at ages 40 to 44 years (instead of ages 5-14 years), and the next lowest ASDRs are in surrounding ages. Furthermore, the ASDR at ages 0 to 4 and 5 to 9 years are similar to that reported for ages 80 to 84 and 85 to 89 years, again highly implausible given established age patterns of mortality. 12 This pattern of mortality, therefore, cannot be used to estimate summary mortality measures in PNG despite showing a relatively low sex differences in mortality at all ages, a phenomenon not commonly observed.
Under-5 and Adult Mortality
Table 1 summarizes levels of childhood and adult mortality, life expectancy at birth, and Composite Index by province and sex in 2011. The national 5q0 was estimated at 63 per 1000, (68 for males, 58 for females), ranging from 27 in National Capital District (NCD) to 126 in Sandaun province. East Sepik (ESP) 90, Morobe 78, and Madang 74 reported the highest 5q0. Conversely, Western Highlands (WHP; 33 per 1000), Simbu (38), and Bougainville (49) had the lowest 5q0 estimates for both sexes. These findings are consistent with Bauze et al 8 who found the highest levels of 5q0 in Sandaun, Morobe, and ESP, with NCD and Bougainville showing the lowest 5q0 in 2000.
Under-5 Mortality, Adult Mortality, and Life Expectancy at Birth and Composite Index, by Province and Sex, PNG 2011.
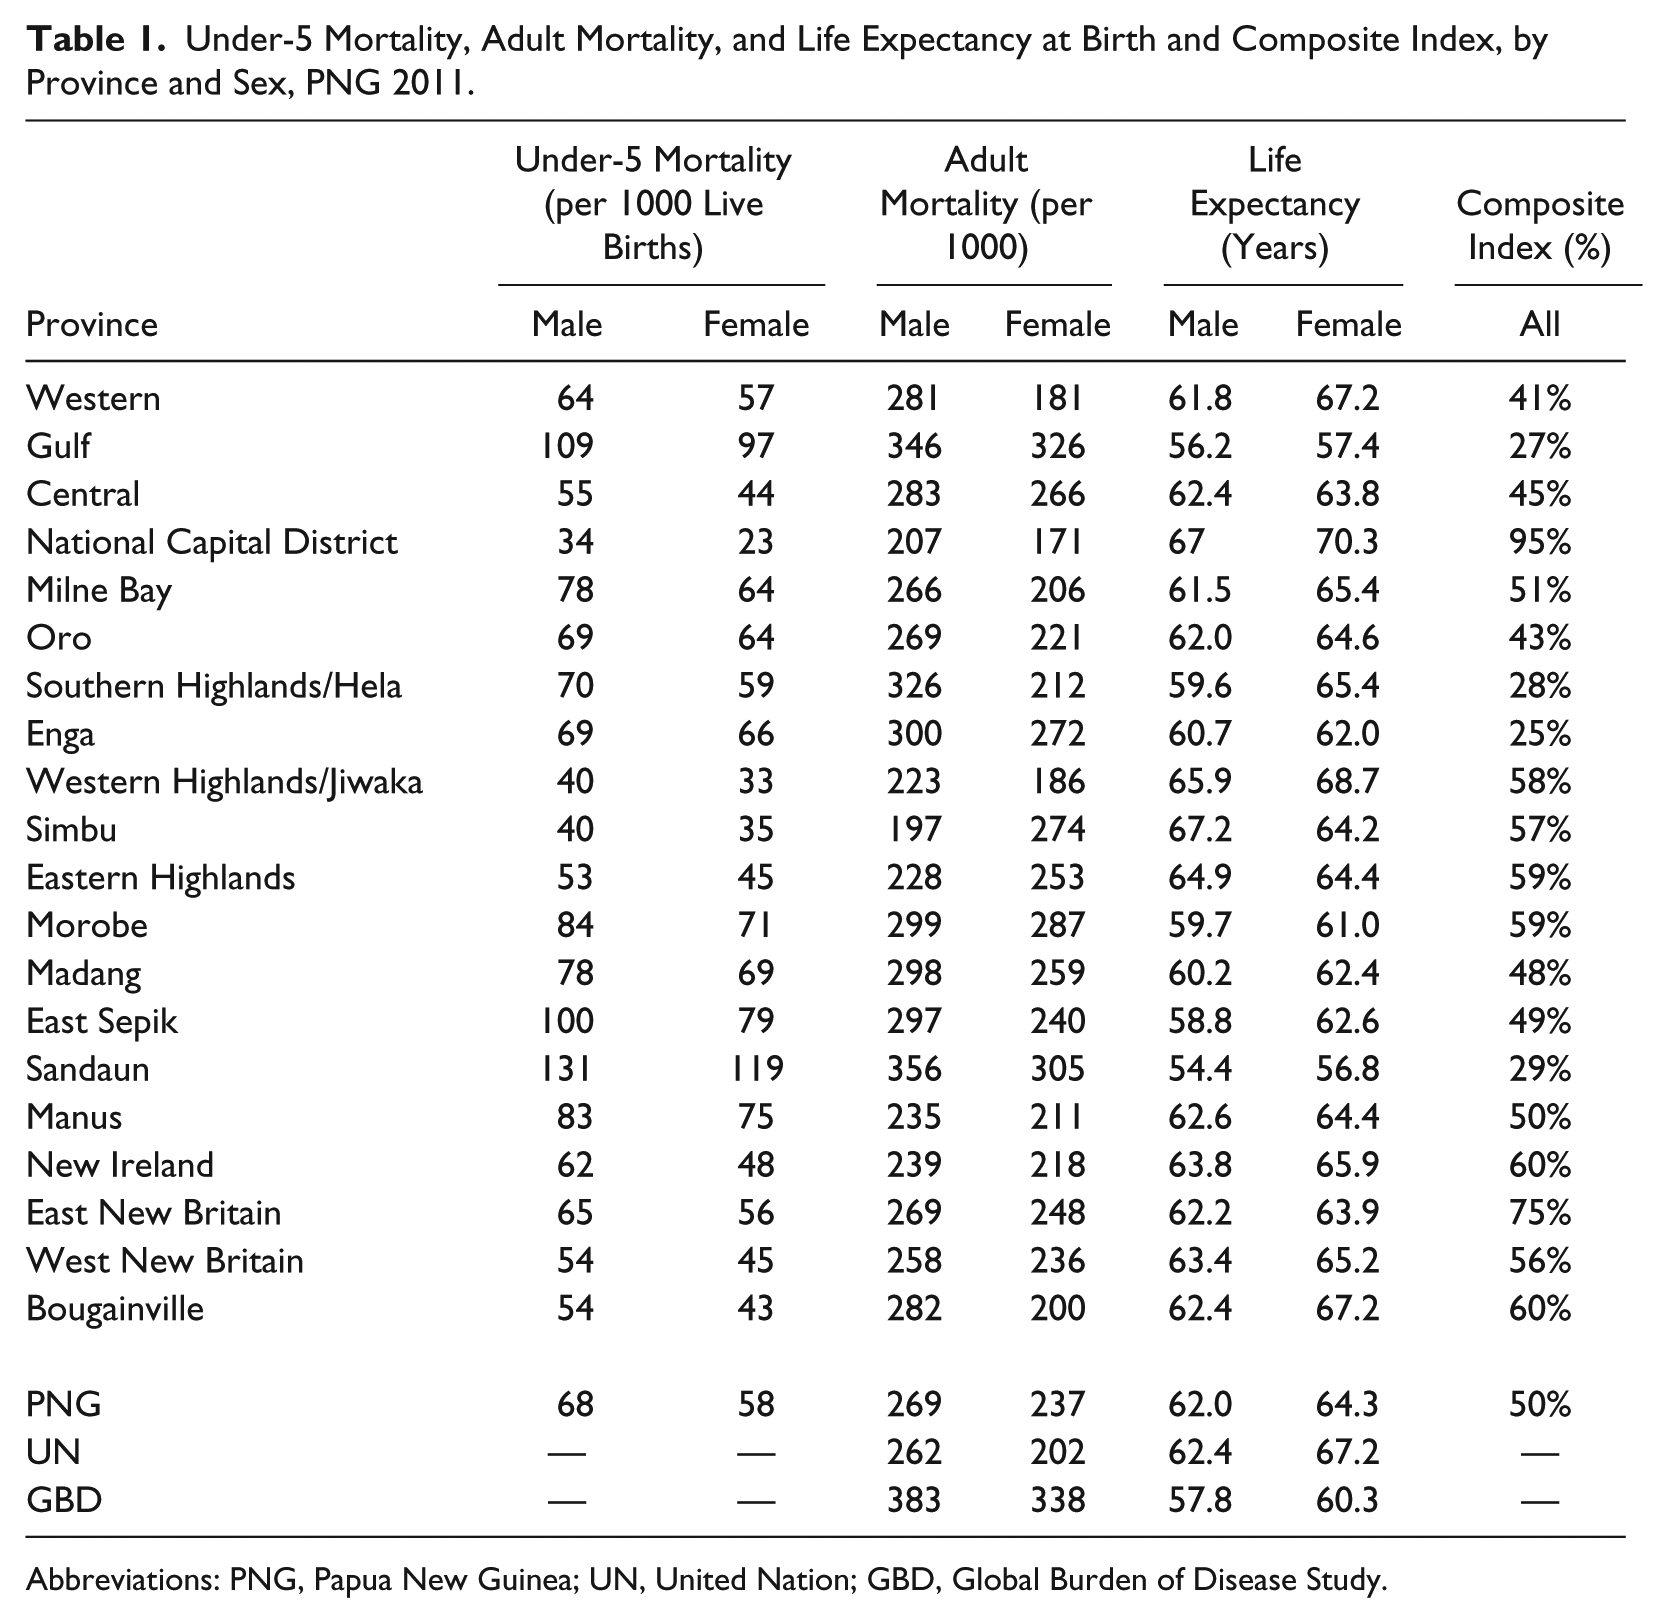
Abbreviations: PNG, Papua New Guinea; UN, United Nation; GBD, Global Burden of Disease Study.
Provinces with the highest 5q0 estimates also exhibited high 45q15 estimates. Sandaun (356 per 1000 for males, 305 for females), Gulf (346 for males, 326 for females), and Morobe (299 for males, 287 for females) reported the highest adult mortality estimates, while NCD (207 for males, 171 for females), WHP (223 for males, 186 for females), and New Ireland (239 for males, 218 for females) recorded the lowest 45q15. Interestingly, in Simbu and Eastern Highlands province (EHP) female 45q15 was significantly higher for women than men.
For both sexes, 5q0 and 45q15 are linearly related (Figure 2A, available online), but stronger for males (R2 = 0.65) than females (R2 = 0.38). No province has clearly disparate 5q0 and 45q15 estimates in males, while Simbu (5q0 35, 45q15 274) and Central (5q0 44, 45q15 266) have relatively low 5q0 and relatively high 45q15 in females. Simbu’s female 45q15 is relatively high given its Composite Index score.
Life Expectancy
Life expectancy at birth in PNG in 2011 was estimated as 62.0 years for males and 64.3 years for females, similar to the United Nations 11 estimate of 62.4 for males but different for females (67.2 years) and the GBD 12 estimate of 57.8 for males and 60.3 for females.
Male life expectancy in provinces varied from 54.4 years in Sandaun to 67.2 years in Simbu, and from 56.8 years in Sandaun to 70.3 years in NCD for females. Simbu and EHP are the only provinces that have higher male than female life expectancy.
Figures 1 and 2 show variations in life expectancy levels by province and sex. Among males, there is a belt of comparatively low life expectancy running through the northern provinces of the country and further south in Gulf province. The comparatively high levels of male life expectancy prevailing in WHP, Simbu and EHP and NCD, is also illustrated by female life expectancy including Bougainville and Western provinces.
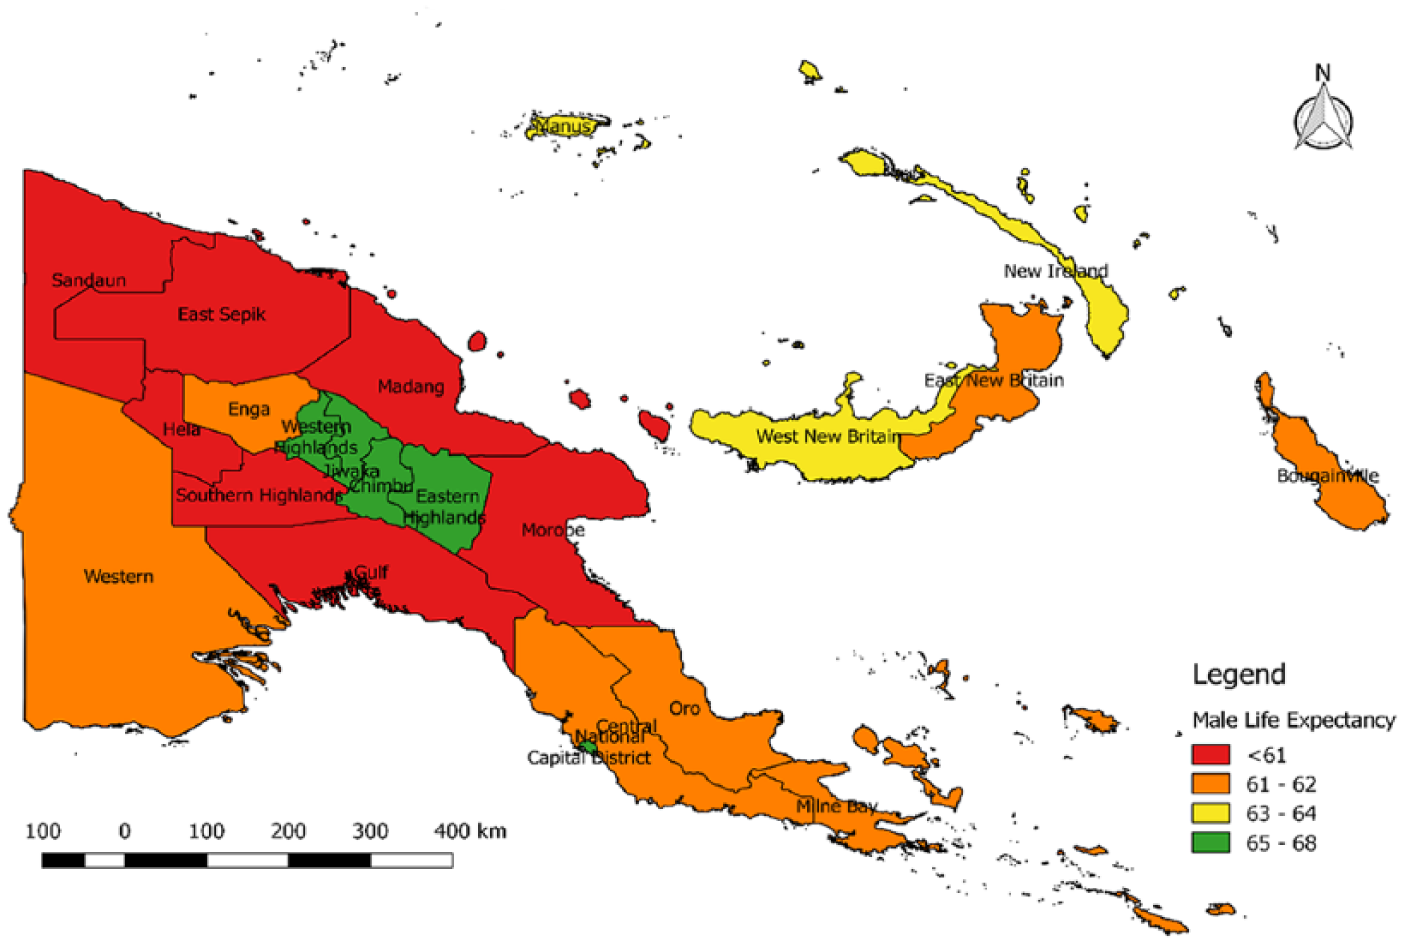
Male life expectancy by province, PNG, 2011.
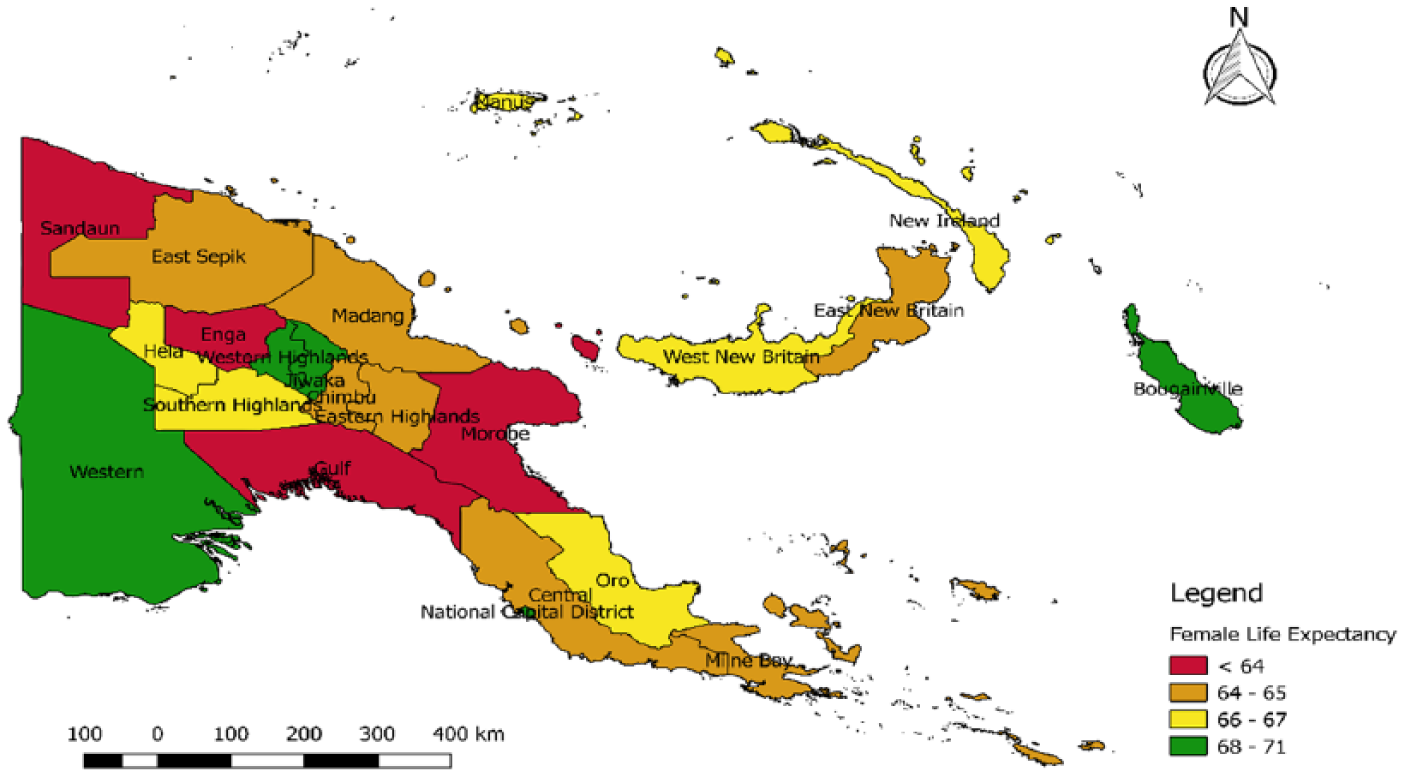
Female life expectancy by province, PNG, 2011.
Composite Index
NCD (95%), East New Britain (75%), Bougainville (60%), and New Ireland (60%) reported the highest score, while Enga (25%), Gulf (27%), SHP (28%), and Sandaun (29%) were the least developed provinces as measured by the Composite Index (Table 1). Detailed information is available in supplementary Table 2A and Figure 3A.
Life expectancy is moderately linearly related to the Composite Index, showing an R2 of 0.48 for males and 0.38 for females (Figure 3). Outliers include a high Composite Index and relatively low life expectancy in Morobe (59%, 59.7 years for males, 61.0 years for females).
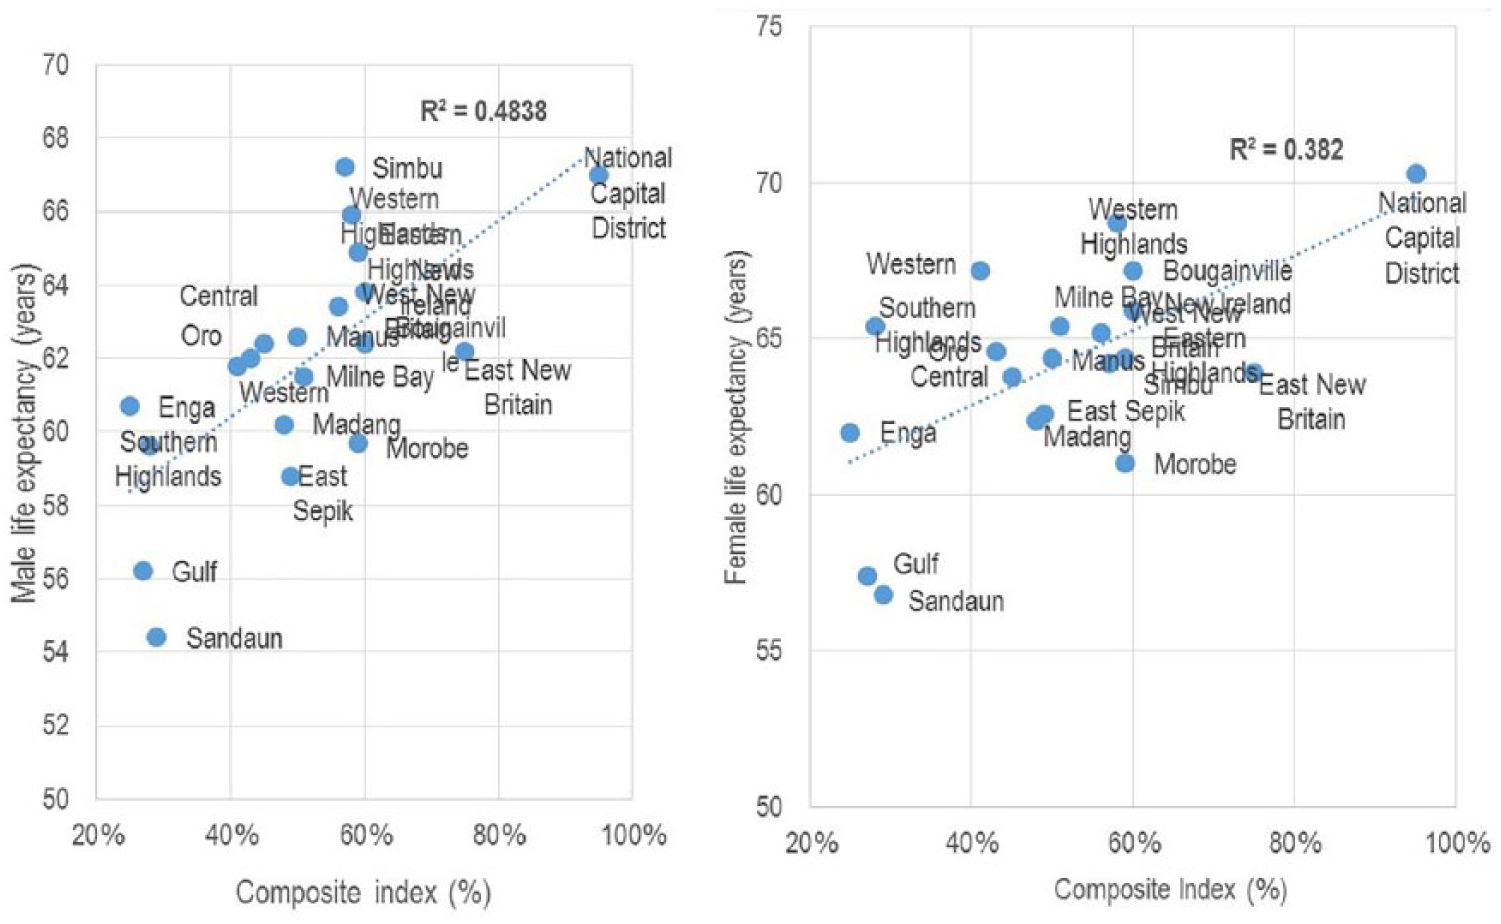
Life expectancy and Composite Index, by province, PNG, 2011.
Discussion
We used empirical data from the 2011 and 2000 censuses to estimate summary measures of mortality by sex, for PNG, and, for the first time, provinces for 2011. Households deaths reported in the 2011 census as well as the NHIS and DHIS data systems were of little use for this analysis because of problems of age misreporting and completeness.
Estimated 5q0 of 68 for males and 58 for females in PNG in 2011 indicated a moderate decline from the estimates of Bauze and colleagues in 2000. 8 Gulf, Sandaun, and Morobe reported the highest 5q0 estimates, corresponding to some of the remotest and least developed districts in PNG with very poor access to health services. 24 NCD, EHP, and Simbu were found to have the lowest 5q0, which are consistent with the relatively high Composite Index for these provinces, reflecting relatively good levels of education and access to services. 13 Provincial 5q0 also correlate quite strongly with 45q15 estimates for males and moderately for females indicating high mortality due to communicable diseases.
The 2011 45q15 estimates for PNG of 269 for males and 237 for females are higher than the largely model life table-based estimates of the United Nations 11 (266, 202) but much lower than the GBD estimates 12 (392, 338). The GBD’s estimates were based on demographic and statistical modeling that relies heavily on the mortality experience of nearby countries, while the United Nations estimates were largely based on child mortality data from the DHS and the use of model life tables. Our estimates are closer to the United Nations than the GBD, likely because the United Nations used more local data than the GBD. Furthermore, the high GBD estimates resulted from employing underlying models that were biased toward other Pacific countries with higher mortality from noncommunicable diseases (eg, diabetes), and its use of modifiers in models to account for the effect of HIV. Conversely, we did not find any compelling evidence to use any effect modifiers for HIV or any other diseases in our estimates, which were largely based on empirical data. 26
Life expectancy at birth in 2011 was estimated at 62.0 for males and 64.3 for females. These are moderately similar to the United Nations estimates of 62.4 for males but significantly different from their estimates of 67.2 for females and the GBD estimates of 57.8 for males and 60.3 for females. Our estimates differ substantially from those of the NSO (56 for males and 57 for females), although they suggest a comparably minor sex difference in mortality. 10 The relatively small sex differential in life expectancy is due to low sex differentials in 45q15 and suggests infectious diseases are still a prominent cause of deaths in adulthood. The sex difference in life expectancy is expected to widen when noncommunicable diseases replace infectious diseases as the leading causes of death. 27
Using the Composite Index to rank each province by socioeconomic development status provides a more informative basis for policy action to reduce mortality differentials than using rural and urban classification. 28 Thus, provinces like Sandaun, Madang, and Gulf with low Composite Indices of development display high levels of mortality and low life expectancy compared with NCD, Bougainville, and WHP with higher indices. This index has been helpful in interpreting provincial mortality differences given the significant geographic and topographical diversity in PNG.
Our mortality estimates have benefited from the use of more empirical data (2000 and 2011 censuses) using appropriate tools to assess data quality and adjust the estimates accordingly. For example, our 2011 5q0 estimates were initially low compared to Bauze et al’s estimates but were made more plausible using adjustments based on the UNIGME estimates.8,15 Application of the empirical completeness model guided the upward adjustment of male adult mortality for 2002 before projecting it forward using the GBD trend analysis to derive the 2011 estimates. 20 Advantages of this model are that it does not rely on implausible assumptions and has been validated against global standards. This method revealed NHIS and DHIS data unsuitable for estimating mortality in this study and identified areas in urgent need for improving mortality surveillance for PNG.
Limitations
We have identified a number of limitations in our study. First, the only available reliable data we could use were retrospectively reported data from the 2011 and 2000 censuses for both adult and child mortality, which meant that the data used are not timely and we have been reliant on projecting estimates forward to 2011 (adult mortality) or scaling them to national 2011 estimates (child mortality). This is an unavoidable situation in PNG, where reliable mortality data are scarce.
Second, due to the methods employed we are unable to measure uncertainty in our estimates, which is likely to be substantial given retrospective reporting, the need to adjust data to a later reference date, and the scarcity of available data. However, is unlikely that the uncertainty around our estimates would be any less than that associated with the GBD estimates, that is, ±20%. 13 Finally, the small numbers of reported deaths in districts in the censuses does not allow for more refined mortality patterns at district level, which might have been more informative for guiding policy reform in the country. However, such level of analysis may have introduced more uncertainty to our analyses.
Conclusion
We have estimated childhood and adult mortality, and life expectancy at birth, by province and sex by using available data and applying established and novel demographic methods. While these data and tools allow us to develop some understanding of how mortality patterns and levels vary in PNG, there is some uncertainty around our results due to the lack of good-quality mortality statistics for the country. If PNG is to reliably measure progress with national and global development goals, the development and maintenance of a reliable and continuous national mortality surveillance system is a developmental priority. It is envisaged that non-facility death reporting will improve in future through improved notification methods being trialed as part of a broader verbal autopsy initiative to measure causes of death in communities but at present little is known about mortality outside of facilities. 29
Supplemental Material
Figure_1A_Age-specific_deaths_rates_(ASDRs),_log_scale,_PNG,_2011_(census_household_deaths) – Supplemental material for Patterns of All-Cause Mortality in Papua New Guinea, 2011
Supplemental material, Figure_1A_Age-specific_deaths_rates_(ASDRs),_log_scale,_PNG,_2011_(census_household_deaths) for Patterns of All-Cause Mortality in Papua New Guinea, 2011 by Urarang Kitur, Tim Adair and Alan D. Lopez in Asia Pacific Journal of Public Health
Supplemental Material
Figure_2A_Provincial_variations_in_45q15_and_5q0,_males_and_females,_PNG_2011 – Supplemental material for Patterns of All-Cause Mortality in Papua New Guinea, 2011
Supplemental material, Figure_2A_Provincial_variations_in_45q15_and_5q0,_males_and_females,_PNG_2011 for Patterns of All-Cause Mortality in Papua New Guinea, 2011 by Urarang Kitur, Tim Adair and Alan D. Lopez in Asia Pacific Journal of Public Health
Supplemental Material
Figure_3A_Map_of_PNG_showing_level_of_socioeconomic_development_by_province,_2011. – Supplemental material for Patterns of All-Cause Mortality in Papua New Guinea, 2011
Supplemental material, Figure_3A_Map_of_PNG_showing_level_of_socioeconomic_development_by_province,_2011. for Patterns of All-Cause Mortality in Papua New Guinea, 2011 by Urarang Kitur, Tim Adair and Alan D. Lopez in Asia Pacific Journal of Public Health
Supplemental Material
Table_1A_Completeness_of_maximum_deaths_reporting_by_NHIS_and_DHIS,_PNG,_2007-2013 – Supplemental material for Patterns of All-Cause Mortality in Papua New Guinea, 2011
Supplemental material, Table_1A_Completeness_of_maximum_deaths_reporting_by_NHIS_and_DHIS,_PNG,_2007-2013 for Patterns of All-Cause Mortality in Papua New Guinea, 2011 by Urarang Kitur, Tim Adair and Alan D. Lopez in Asia Pacific Journal of Public Health
Supplemental Material
Table_2A_Education,_economic_and_health_component_scores,_and_overall_Composite_Index,_by_province,_PNG,_2011 – Supplemental material for Patterns of All-Cause Mortality in Papua New Guinea, 2011
Supplemental material, Table_2A_Education,_economic_and_health_component_scores,_and_overall_Composite_Index,_by_province,_PNG,_2011 for Patterns of All-Cause Mortality in Papua New Guinea, 2011 by Urarang Kitur, Tim Adair and Alan D. Lopez in Asia Pacific Journal of Public Health
Footnotes
Acknowledgements
The authors wish to thank the National Statistician Mr. Roko Koloma and Mr. Benjamin Haichim from the PNG National Statistics Office for access to the 2011 and 2000 census data used in this study. We would also like to thank Ila Rouka for access to the National Department of Health NHIS and DHIS datasets. The authors also acknowledge Professor Ian Riley for his assistance with the literature review and initial conceptualization of the study.
Authors’ Note
Request for data access should be directed to the corresponding author and will be granted subject to approval by the National Statistics Office of Papua New Guinea.
Authors’ Contributions
UK, TA, and AL conceptualized the research theme and analytical framework. UK conducted the data analysis and was responsible for drafting the manuscript. TA and AL critically revised the manuscript. The final draft was approved by all authors.
Declaration of Conflicting Interests
The author(s) declared no potential conflicts of interest with respect to the research, authorship, and/or publication of this article.
Funding
The author(s) disclosed receipt of the following financial support for the research, authorship, and/or publication of this article: This research was conducted as part of UK’s PhD, funded by the Australia Award Scholarship. The funder had no influence on the final results.
Ethics Approval
Only secondary data were used so ethics considerations are not applicable.
Informed Consent
Prior approval for the use of census and DHS data was sought from National Statistics Office of Papua New Guinea.
Supplemental Material
Supplemental material for this article is available online.
References
Supplementary Material
Please find the following supplemental material available below.
For Open Access articles published under a Creative Commons License, all supplemental material carries the same license as the article it is associated with.
For non-Open Access articles published, all supplemental material carries a non-exclusive license, and permission requests for re-use of supplemental material or any part of supplemental material shall be sent directly to the copyright owner as specified in the copyright notice associated with the article.