
Abstract
This study aims to analyze associations between lifestyle-related factors and body mass index (BMI) and blood pressure (BP) in middle-aged and older people in Japan. An association analysis using a multilevel model with demographic and lifestyle-related factors as variables and with BMI, systolic blood pressure (SBP), and diastolic blood pressure (DBP) as outcomes was conducted. Among the modifiable lifestyle factors, we found a significant dose-response association for BMI and slower eating (fast: reference; normal: −0.123 kg/m2 and slow: −0.256 kg/m2). Consuming >60 g/d ethanol was significantly associated, before and after adjustment for BMI, with an increase in SBP of 3.109 and 2.893 mm Hg, respectively. These findings suggested that health guidance should focus on factors such as the eating rate and drinking habits.
Keywords
What We Already Know
High body mass index (BMI) and high blood pressure (BP) are risk factors for cardiovascular disease and a public health issue.
Effective health guidance is needed to reduce the incidence of cardiovascular disease (CVD) in middle-aged and older people in Japan.
What This Article Adds
This is the first study to comprehensively compare the effects of multiple lifestyle factors on BMI and BP with longitudinal data, considering regional differences in Japan.
Among the modifiable lifestyle factors, eating rate and smoking had the large effect on body mass index, suggesting the importance of health guidance to control energy intake.
Among the modifiable lifestyle factors, alcohol intake had the largest effect on blood pressure.
Introduction
Population aging in Japan is rapidly progressing, and health care expenditures continue to increase. Non-communicable diseases account for more than 30% of the national health care expenditure, and cardiovascular diseases (CVDs) constitute the largest component of health care expenditure for the ≥65 years age group in Japan. 1 Smoking, high blood pressure (BP), and high body mass index (BMI) are risk factors for CVDs with the largest number of disability-adjusted life years (DALYs). 1 Therefore, improving these risk factors, especially in the middle-aged and older population, is an urgent issue in the aging Japanese population.
Through observational and intervention studies, evidence of the relationship between lifestyle-related factors and BMI or BP, such as the association between smoking cessation and increased BMI, exercise and decreased BP, faster eating and increased BMI, and alcohol consumption and increased BP, has been accumulated.2-10 However, these studies have mainly focused on the association between single lifestyle-related risk factors and outcomes, with few studies examining the comprehensive association between multiple lifestyle-related risk factors and the outcomes. In Japan, annual health checkups screen for metabolic syndrome or pre-metabolic syndrome, and evidence-based national health guidance is provided to those at risk. The health guidance program is an intervention related to exercise, diet, and medical visits. Fukuma et al 11 examined the effect of the health guidance program on risk factors for CVD and concluded that the health guidance program had a small interventional effect on BMI and waist circumference, but not on other risk factors for CVD, such as BP. Despite the need for effective health guidance in Japan, few studies have focused on comparing the effects of multiple modifiable lifestyle-related risk factors. Furthermore, health disparities in the prevalence of hypertension and other diseases in Japan abound due to regional lifestyle factors, such as diet culture. 12 In addition, differences in nutrient intake by region have been reported, which may contribute to regional differences in BMI and BP. 13 However, to our knowledge, few studies have examined regional differences in the association between lifestyle-related factors and BMI or BP in Japan. In this study, we compared the effect sizes of modifiable lifestyle-related factors on BMI, systolic blood pressure (SBP), and diastolic blood pressure (DBP) in the association analysis controlling for regional differences to identify potentially effective interventions to improve the health status of middle-aged and older people. Lifestyle factors with large effects on BMI, SBP, and DBP have important implications for recommendations on effective health guidance in Japan. This study found lifestyle-related factors that were significantly associated with BMI, SBP, and DBP, controlling for regional differences.
Materials and Methods
Study Design
The objectives of this study were to identify lifestyle factors that markedly influence BMI, SBP, and DBP. This longitudinal study to analyze the associations of lifestyle and regional factors, as substitutes for nutritional intake, along with BMI, SBP, and DBP, was conducted in a large population-based cohort of middle-aged and older people in Japan. The participant data used in this study were extracted from the Shizuoka Kokuho DataBase based on the National Health Insurance (NHI) database of the Shizuoka Prefecture, which is located in mid-Japan. 14 The data comprise individual-level longitudinal data, including information garnered from annual health checkups (lifestyle-related questionnaires and clinical tests and measurements), demographics, and registration data (date of enrollment and withdrawal, reason for withdrawal, and vital status). The annual health checkups are available up to the age of 75 years, and we identified 196 880 men and women, aged 40 to 75 years, who were enrolled in the NHI and had health-checkup records from June 2012 to November 2018 (health-checkup years: 2012-2017). After excluding participants receiving BP-lowering medication, 144 303 participants were included in our analysis.
Outcomes
In Japan, annual health checkups were introduced for early detection of metabolic syndrome, based on clinical tests and measurements. 11 The primary outcomes of our study are lifestyle-based variations in BMI, SBP, and DBP, measured by physicians and nurses during such health checkups. The BP measurement is standardized, and BP level is calculated using the average of two sets of measurements, after ensuring that participants refrain from alcohol intake and strenuous exercise on the day preceding the health checkup.
Lifestyle-Related Questionnaire Variables
At each health checkup, patients are required to fill out a lifestyle-related questionnaire that the government designed based on evidence of the association between lifestyle habits and CVD risk factors. 15 We used 11 lifestyle-related items as questionnaire variables in this study, which included smoking, exercise habits, physical activity, walking speed, eating rate, skipping breakfast, late-night dinner, snack, drinking frequency, alcohol consumption, and sleeping. The specific contents of the questionnaire and answer categories are shown in Supplementary Table 1 (available online).
Demographic and Regional Variables
Age and sex at health checkups were used as demographic variables. Age was divided into seven groups of 5-year intervals, from 40 to 75 years. Akahori analyzed regional nutritional intake data from the Nutrition Intake Survey in Shizuoka Prefecture and reported the presence of regional differences in nutritional intake as well as regional health disparities.13,16 Therefore, we adopted eight survey regions used in that study, i.e., Atami, Kamo, Tobu, Gotenba, Fuji, Shizuoka-Shi, Chubu, and Seibu; which extend from east to west in the Shizuoka Prefecture (Supplementary Figure 1; available online) as substitute variables of nutrient intake. 16
Descriptive Statistical Analysis
Outcome, demographic, and questionnaire variables were summarized by sex, the health-checkup year, and region and are reported as mean with standard deviation, for numerical variables, and percentage in each category, for categorical variables. In addition, t-test or analysis of variance (ANOVA) was performed for continuous variables, and Pearson’s chi-square test was performed for categorical variables. The Spearman correlation coefficients among the demographic and questionnaire variables were also calculated.
Principal Component Analysis
To analyze the pattern of association in the average nutritional intake in each region, we conducted principal component analysis. 16 The nutritional variables selected based on evidence with outcomes comprised 11 categories: total energy; protein; fat; carbohydrate; potassium; calcium; zinc; cholesterol; dietary fiber; salt; and unsaturated fatty acid.6,10,17-26
Association Analysis
The intraclass correlation (ICC) for individuals, the ratio of within-individual variance to the variance in the outcome, was calculated for all outcomes. Similarly, ICCs for the regions were calculated. Based on the results of ICCs, we conducted an association analysis using a linear mixed-effects (LME) model with random intercepts wherein only the individual level was considered. Linear mixed effect modeling for BMI was performed using the demographic, questionnaire, and regional variables as fixed effects. Moreover, as obesity is a risk factor for hypertension, 27 we conducted LME modeling for SBP and DBP, either with or without adjustment for BMI, and compared the effects of the variables in both models. The confidence intervals of the fixed effects of the LME model were calculated, and the effect was statistically significant when the P-value was less than .05. All analyses were performed using R 4.0.2.
Ethics Approval
The study protocol was approved by the ethics committees of the University of Tokyo, Institute for Future Initiatives (Approval No. 20-112). The requirement for informed consent was waived by the Shizuoka prefectural government as only anonymized personal data were available for research use.
Results
Descriptive Statistical Analysis
Supplementary Table 2 (available online) and Table 1 show the sex-stratified means and percentages of the variables, excluding the regional variables, from 2012 to 2017 and in 2012 and 2017, respectively. The mean ages of men and women in 2012 were 61 and 61.9 years, respectively. All outcomes were significantly higher for men than for women in all the health-checkup years (P < .001). The smoking rate had been decreasing yearly for both men and women. However, the smoking rate of men in 2017 was approximately 4.5 times higher than that of women (P < .001). As the year progressed, the percentage of participants with exercise habits and physical activity increased, the eating rate decreased, and the percentage of skipping breakfast and late-night dinner and the frequency and amount of alcohol consumption decreased. Overall, most of the lifestyle factors tended to improve throughout the years.
Characteristics of Participants by Gender in 2012 and 2017.
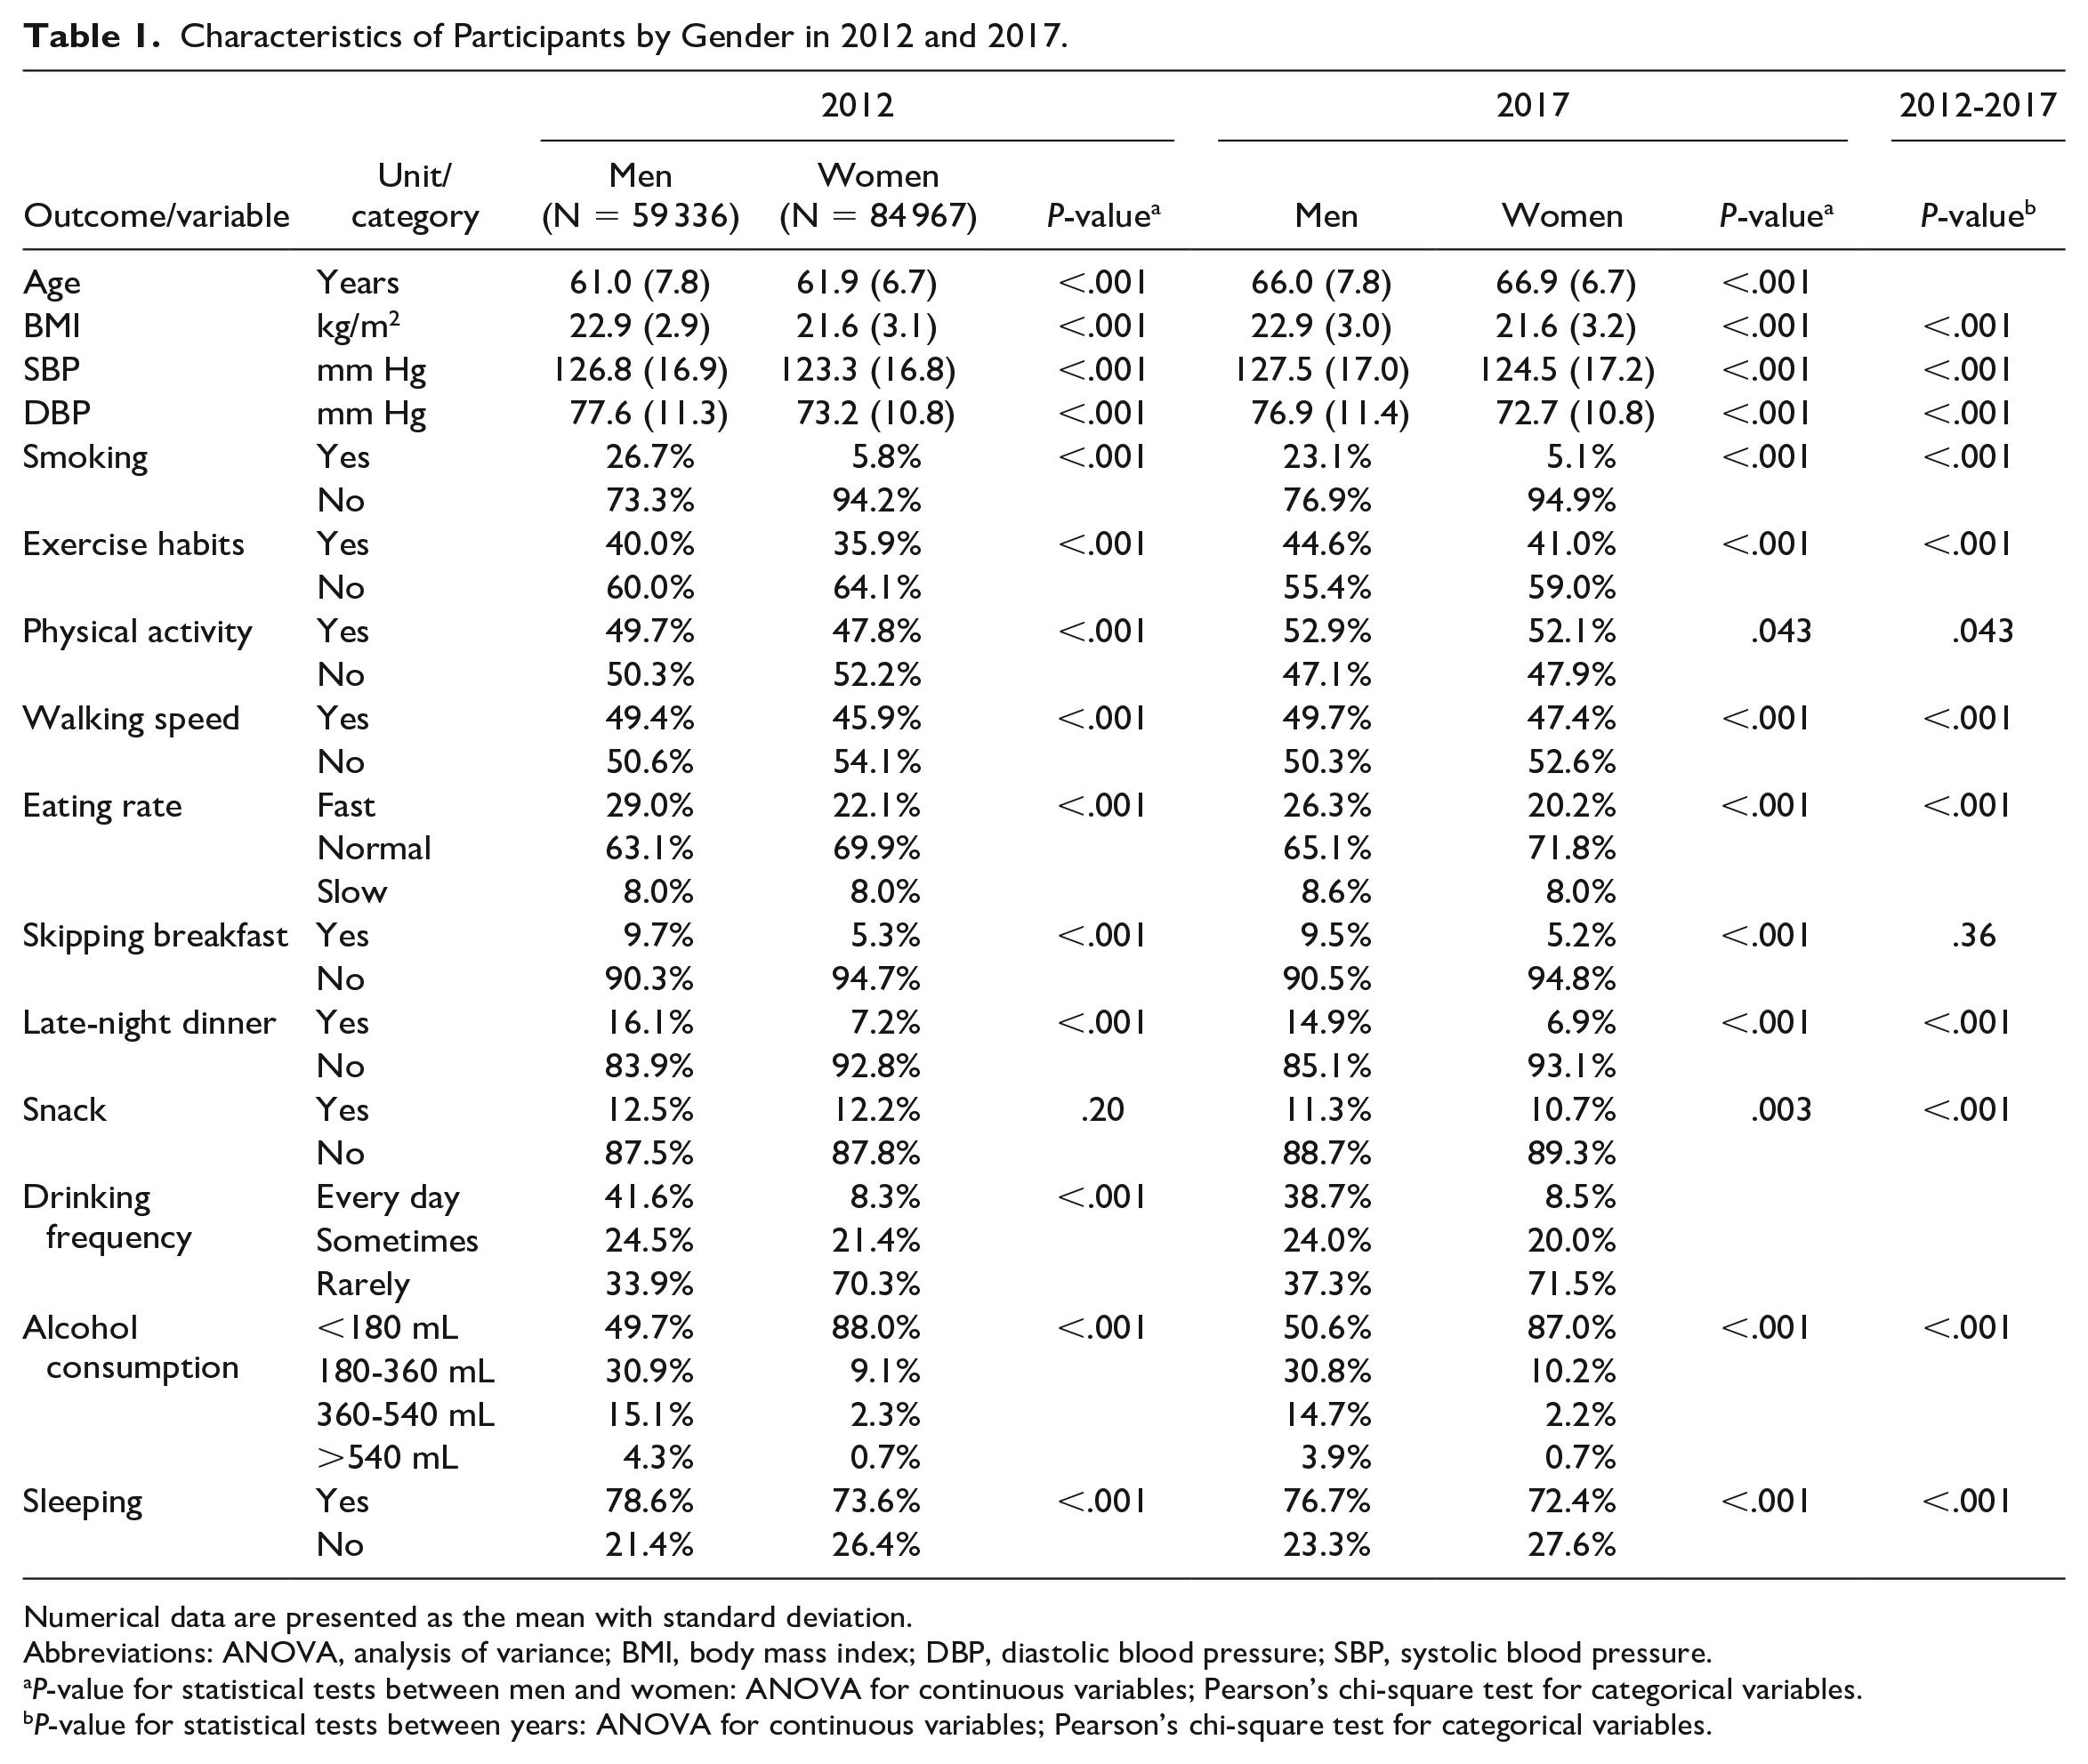
Numerical data are presented as the mean with standard deviation.
Abbreviations: ANOVA, analysis of variance; BMI, body mass index; DBP, diastolic blood pressure; SBP, systolic blood pressure.
P-value for statistical tests between men and women: ANOVA for continuous variables; Pearson’s chi-square test for categorical variables.
P-value for statistical tests between years: ANOVA for continuous variables; Pearson’s chi-square test for categorical variables.
Supplementary Table 3 (available online) shows the region- and sex-stratified means or percentages of the outcome, age, and lifestyle variables in 2012. A comparison of sex differences in lifestyle variables across all regions showed that men had worse smoking, dietary, and drinking lifestyles. In particular, the percentages of smoking, daily alcohol intake, and drinking more than 540 mL of alcoholic beverage per day were 2.7 to 6.6, 2.8 to 7.1, and 2.8 to 10.5 times higher, respectively, for men than for women (P < .001).
Supplementary Table 4 (available online) shows Spearman correlation coefficients among demographic and questionnaire variables. The absolute values of the correlation coefficients among all variables were less than 0.65, and a high correlation that led to multicollinearity was absent.
Principal Component Analysis of Nutrient Intake Patterns
Supplementary Table 5A (available online) shows the first principal component alone explained 70% of the total variance, and values up to the third principal component could explain more than 90% of the total variance. In addition, only the first through second principal components had a contribution greater than 10%.
Supplementary Table 5B (available online) shows the loading for each principal component. All variables for principal component 1 were positive, indicating that the positive direction of principal component 1 represents an excess nutritional intake. The nutrient with the largest absolute negative value in principal component 2 was salt (−0.519). The nutrient with the largest positive value was the carbohydrate (0.673).
Supplementary Table 5C (available online) shows the principal component scores by region. Kamo (5.123) and Fuji (3.726) showed a tendency toward overnutrition, and these areas are located in the eastern part of Shizuoka Prefecture. In contrast, the region with the lowest nutrient intake was Seibu (−3.606) in the western part. The large positive values for principal component 2 were seen in Seibu (1.346) and Fuji (1.278), and the large absolute negative values were seen in Tobu (−1.371), Chubu (−1.303), and Kamo (−0.927), indicating salt intake.
Association Analysis
All ICCs for individuals were considerably greater than 0.1 (BMI: 0.95; SBP: 0.62; DBP: 0.59). This indicated the existence of a time-series hierarchical structure wherein individual differences in outcomes are large, but the differences in outcomes between time points for each individual are small. However, the ICCs for the regions were small (BMI: 0.01; SBP: 0.02; DBP: 0.07). Table 2 shows the results of the association analysis for BMI, SBP, and DBP. For SBP and DBP, models 1 and 2 correspond to no adjustment and with adjustment for BMI, respectively.
Association Analysis for BMI, SBP, and DBP.
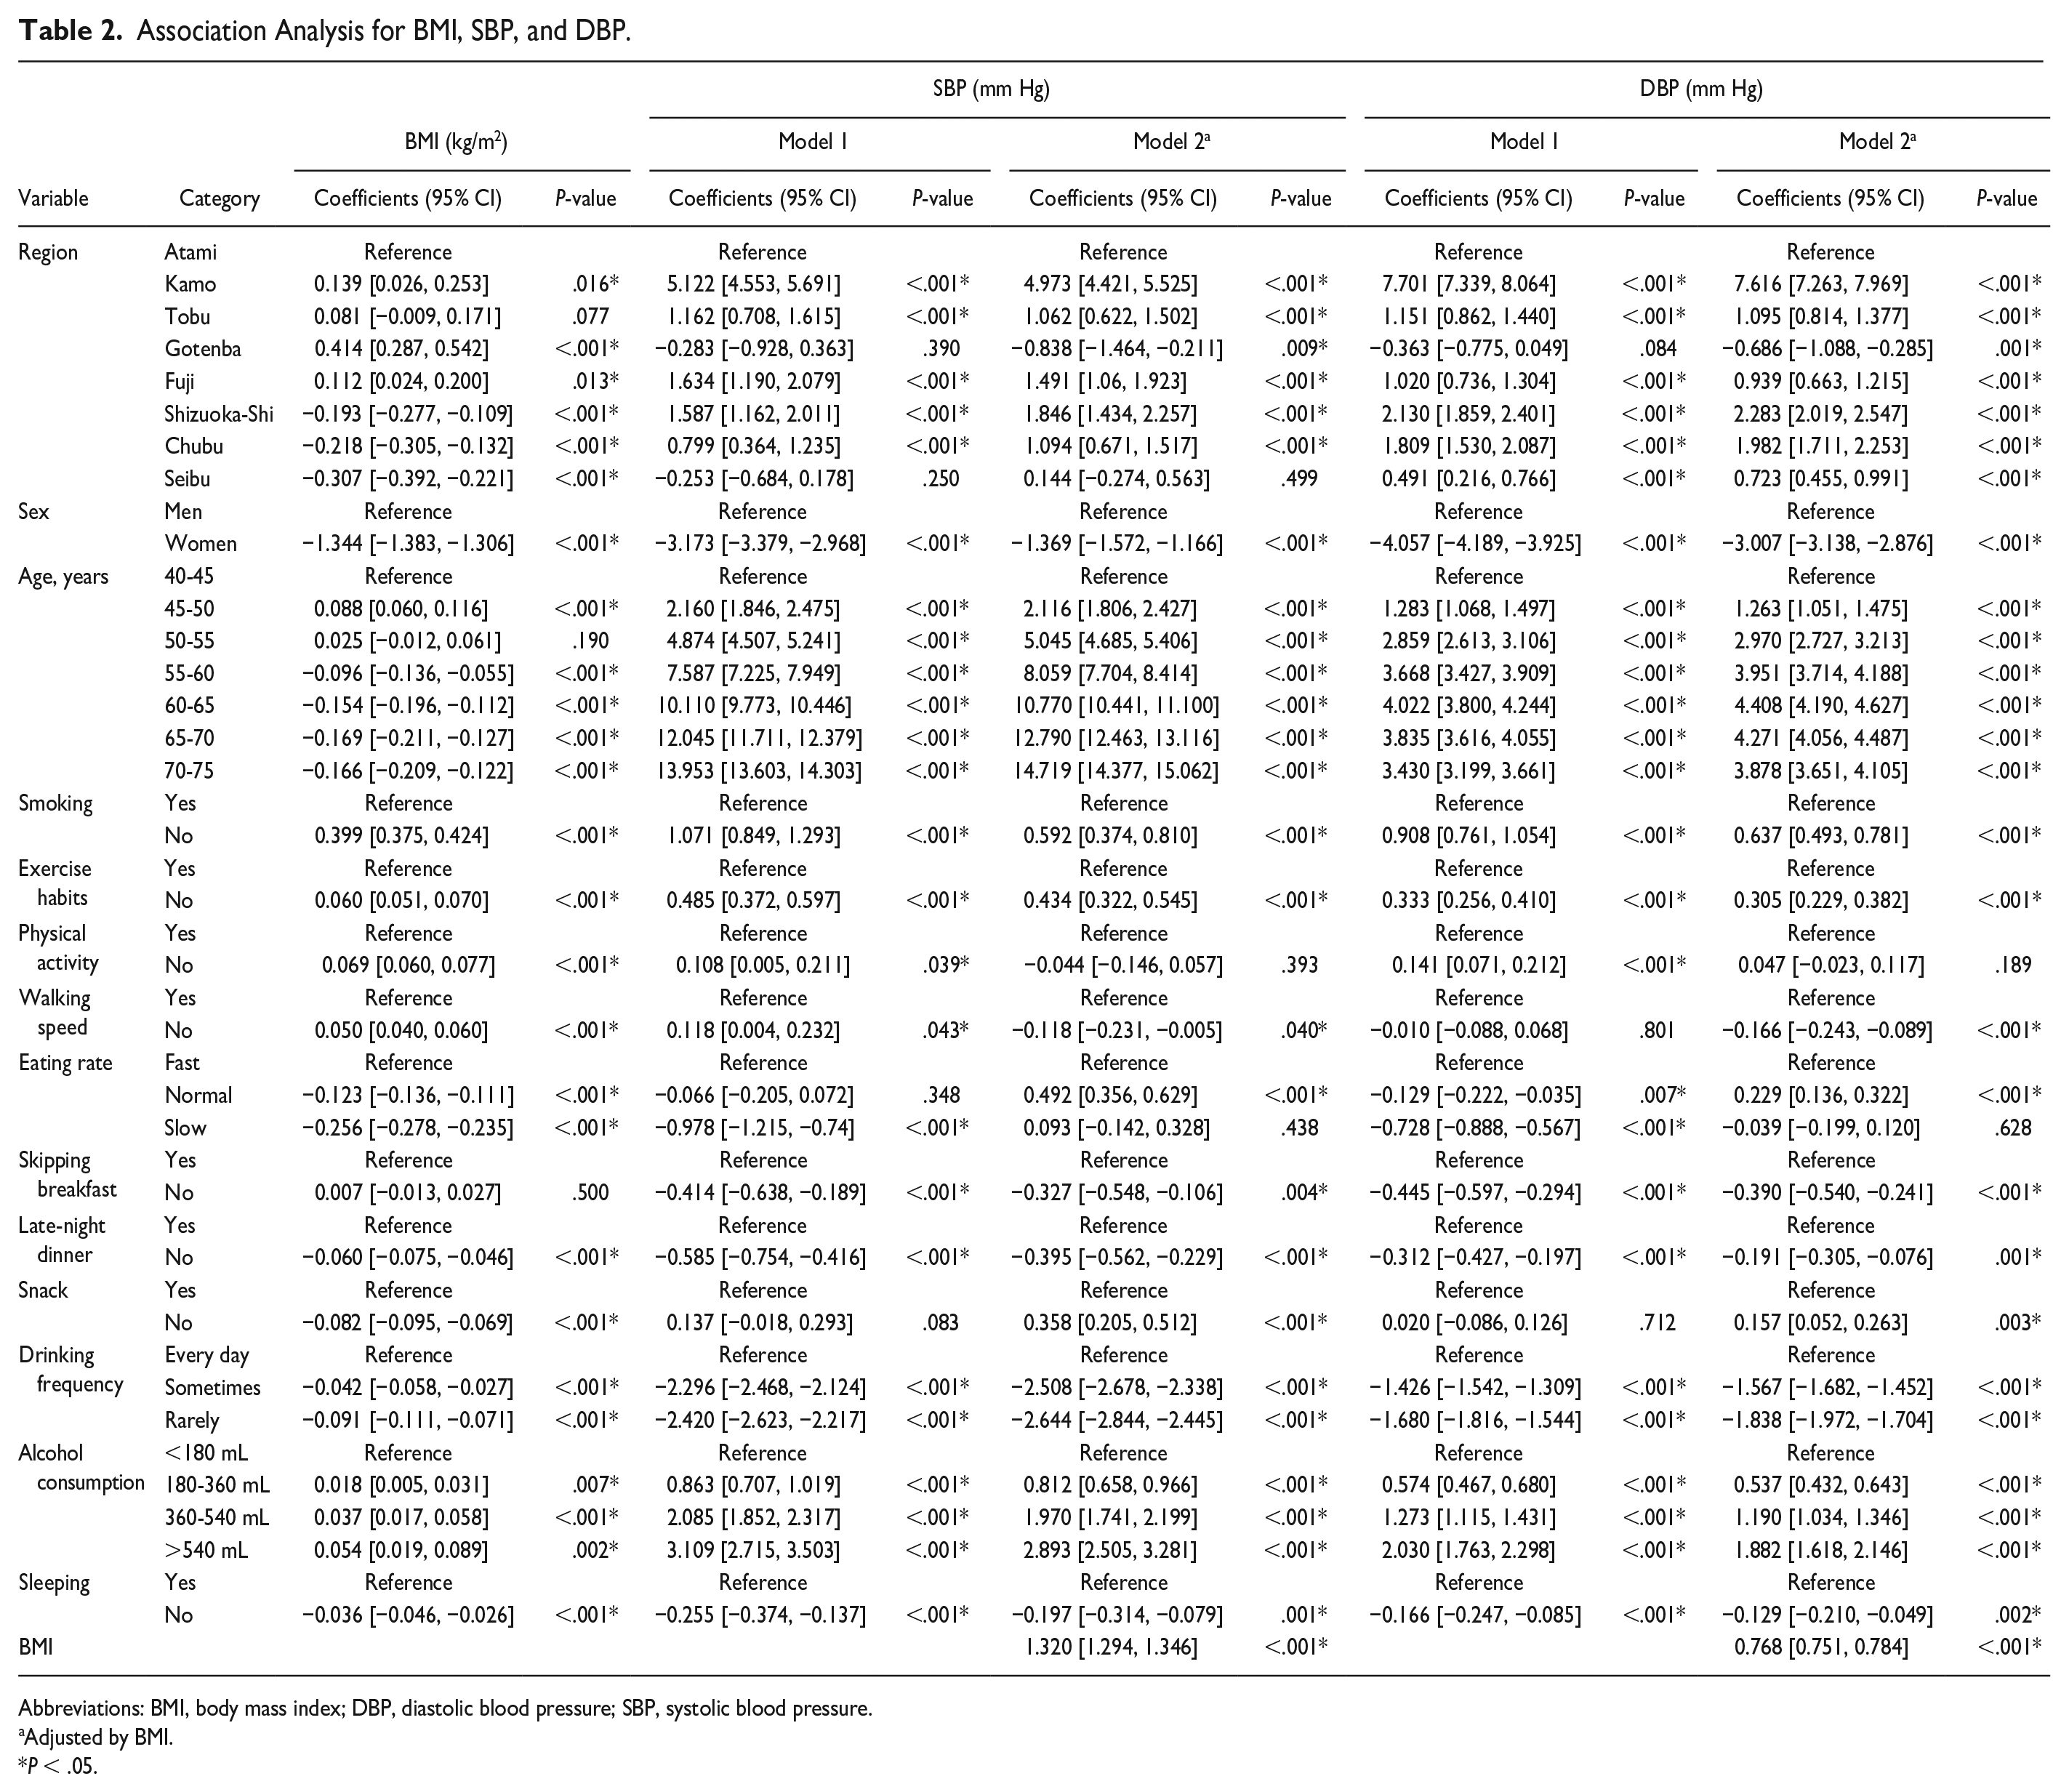
Abbreviations: BMI, body mass index; DBP, diastolic blood pressure; SBP, systolic blood pressure.
Adjusted by BMI.
P < .05.
Body Mass Index
Supplementary Figure 2 (available online) shows the results of the association analysis for BMI in Table 2. Kamo, Gotenba, and Fuji in the eastern region showed significant positive effects on BMI (P < .05), whereas Shizuoka-Shi, Chubu, and Seibu, which are located in the western region, showed a significantly negative effect (P < .001). Smoking had the largest effect among the lifestyle variables and significantly reduced the BMI by 0.399 kg/m2 (0.375 to 0.424). The second largest effect was the eating rate (normal: −0.123 kg/m2; −0.136 to −0.111, slow: −0.256 kg/m2; −0.278 to −0.235), which showed a significant dose-response association with a decrease in BMI at a slower eating rate. Among the variables related to the dietary pattern, late-night dinner and snacking were significant factors (P < .001). The associations of BMI with exercise habits, physical activity, and walking speed were significant, and low exercise intensity was associated with higher BMI (P < .001). Drinking frequency and alcohol consumption showed a significant dose-response relationship with BMI (P < .05), and excessive drinking was associated with an increase in BMI.
Systolic and Diastolic Blood Pressure
Supplementary Figure 3 (available online) shows the associations of SBP and BMI-adjusted SBP in Table 2. Regardless of adjustment for BMI, Kamo was the largest and most significant region (P < .001). Among the lifestyle variables, drinking frequency and alcohol consumption had the significantly largest effects on SBP (P < .001). For example, drinking 540 mL (approximately 60 g of ethanol) or more per day was associated with an increase in SBP of 3.109 (2.715-3.503) mm Hg and 2.893 (2.505-3.281) mm Hg with or without adjustment for BMI, respectively. In addition, smoking was significantly associated with a decrease in SBP (−1.071 [−1.293 to −0.849] mm Hg) in the non-BMI-adjusted model, and the significant, albeit attenuated, negative effect persisted in the BMI-adjusted model (−0.592 [−0.810 to −0.374] mm Hg). Exercise habits, skipping breakfast, and late-night dinner were associated with SBP, regardless of adjustment for BMI (P < .05), and regular exercise and dietary patterns were associated with lower SBP. Body mass index itself was significantly associated with SBP, where each 1 kg/m2 increase in BMI was associated with an increase in SBP of 1.320 (1.294-1.346) mm Hg.
Supplementary Figure 4 (available online) shows the associations of DBP and the DBP adjusted for BMI in Table 2. The associations between most of the lifestyle-related variables and DBP were similar to those for SBP in terms of the relative magnitude of the coefficients between variables, as was the attenuation of the effects after adjustment for BMI.
Discussion
In this study, we analyzed the association between lifestyle-related variables and BMI, SBP, and DBP using individual-level longitudinal data from NHI. In the association analysis of SBP and DBP, variables with large effects remained significant when additionally adjusted for BMI.
Lifestyle-Related Risk Factors for BMI and Blood Pressure
A positive association between energy intake and BMI has been well known. 6 Our analysis suggested that the eastern region is over-nourished, and the larger effect on BMI in the eastern regions could be attributed to overnutrition. This implies the importance of considering regionality as a surrogate for nutritional intake. The cost of obtaining and tracking individual data on nutritional intake for large populations is high, and data acquisition is often not feasible. When nutrient intake patterns vary by region, using regional variables as surrogate variables may be one means of reducing bias.
The smoking habit was significantly associated with a decrease in BMI. A possible reason for this decrease is that nicotine intake suppresses appetite and increases the basal metabolic rate. 2 In Japan, the Framework Convention on Tobacco Control, issued in 2005, has been implemented to reduce smoking rates. Despite not yet having reached the targeted reduction, the smoking rate has been declining nationwide. 1 Smoking rates are likely to continue to decline in Japan, and intervention programs to control energy intake after smoking cessation will become more important. In addition, we found a dose-response association between eating faster and higher BMI, which is consistent with the results of previous studies.4,9,27
This study suggested that the regions with the significantly largest positive associations with SBP and DBP, with or without adjustment for BMI, showed overnutrition and higher salt intake. The positive association between salt intake and blood pressure is well known,10,25 which was consistent with our finding. The areas shown to have high salt intake in our study are located by the sea. According to Akahori’s study, 13 they have a significantly higher seafood intake and are seasoned with salt than other areas. Therefore, in our study area, reducing salt consumption as a seasoning in seafood may be important for preventing higher blood pressure.
Excessive alcohol intake is known to increase BP, but most studies use the incidence of hypertension as an outcome.10,28 However, we found a significant dose-response association between drinking frequency/alcohol consumption and SBP/DBP level, with or without adjustment for BMI. In particular, the dose-response association of alcohol consumption with BP was nearly linear; for example, a reduction in daily alcohol consumption of approximately 180 mL (20 g of ethanol) reduced SBP by approximately 1 mm Hg.
Cigarette smoking is a risk factor for CVD, but its relationship with hypertension is unclear. 1 No consistent conclusions have yet been reached about the long-term effects of smoking on BP. 7 In this study, although the negative effect of smoking on BP was attenuated when adjusted for BMI, smoking and BP remained significantly negatively associated. This finding suggests that smoking has a negative direct effect on BP in our participants. Smoking rates decreased in all our study regions, with a geometric mean of 2.31% from 2012 to 2016. According to the Family Income and Expenditure Survey in Japan, 29 the household consumption of cigarettes in our study area decreased from 2012 to 2016, with a geometric mean of 5.34% of the percentage decrease, indicating a decrease in the number of cigarettes consumed per capita. Furthermore, the questionnaires at health checkups contain only a question on whether the participant smokes but include no question on the number of cigarettes smoked. Therefore, reducing the number of cigarettes consumed by smokers may contribute to lower BP, and adding a question about the number of cigarettes smoked to the questionnaire would allow for more detailed studies. In addition, e-cigarettes have become increasingly popular in recent years, and a negative association between switching from conventional cigarettes to e-cigarettes and BP has been reported. 30 In Japan, e-cigarettes are very popular, and the transition to e-cigarettes may have contributed to the negative association between smoking and BP.
Nagahama analyzed cross-sectional data from health checkups and reported that slow eating was negatively associated with the prevalence of high BP; however, the effect was attenuated and became non-significant after additional adjustment for BMI, which indicated that BMI is a mediator. 27 In this study, we also found that the effect of the eating rate was attenuated in both SBP and DBP after additional adjustment for BMI. This implies that BMI was also a mediator of eating rate and blood pressure in our study participants. Whereas the effect of factors related to alcohol intake on BP remained significantly large with adjustment for BMI, suggesting the existence of a direct path of alcohol intake to BP.
Effective Modifiable Risk Factors
We found that the eating rate had greater effects on BMI than the other lifestyle variables, such as physical activity. As the eating rate was positively associated with energy intake, suppressing energy intake is an important factor in controlling BMI. The effects of alcohol intake on BP were large, and we quantitatively ascertained the effect of alcohol consumption on BP. These findings have implications for how health guidance should be provided. To control BMI and BP in the middle-aged and older population in Japan, it is especially important to chew food well and drink alcohol moderately. These two points should be the main focus of guidance.
Strength and Limitations
Our study is a large individual-level longitudinal analysis. There have been no previous longitudinal studies in Japan analyzing lifestyle-related risk factors for BMI, SBP, and DBP while considering regional differences. In addition, we used a multilevel model to conduct an association analysis that factored in intra-individual correlations between time points, which reduced bias and provided a more robust assessment of significance. However, as the questionnaire items in the data used in this study were self-reported, some amount of bias may exist. In addition, this study is population-based, and further research using other cohorts is needed.
Conclusion
We identified lifestyle-related factors such as eating rate and alcohol intake that have large effects on BMI, SBP, and DBP, suggesting the importance of health guidance to control energy and alcohol intake in Japan. Health guidance must factor in the effect size of each lifestyle-related factor for the outcome of interest.
Supplemental Material
sj-docx-5-aph-10.1177_10105395231175568 – Supplemental material for Associations of Lifestyle-Related Factors With Body Mass Index and Blood Pressure in the Middle-Aged and Older Population-Based Cohort in Japan: A Longitudinal Study
Supplemental material, sj-docx-5-aph-10.1177_10105395231175568 for Associations of Lifestyle-Related Factors With Body Mass Index and Blood Pressure in the Middle-Aged and Older Population-Based Cohort in Japan: A Longitudinal Study by Yuji Hiramatsu, Hiroo Ide and Yuji Furui in Asia Pacific Journal of Public Health
Supplemental Material
sj-docx-6-aph-10.1177_10105395231175568 – Supplemental material for Associations of Lifestyle-Related Factors With Body Mass Index and Blood Pressure in the Middle-Aged and Older Population-Based Cohort in Japan: A Longitudinal Study
Supplemental material, sj-docx-6-aph-10.1177_10105395231175568 for Associations of Lifestyle-Related Factors With Body Mass Index and Blood Pressure in the Middle-Aged and Older Population-Based Cohort in Japan: A Longitudinal Study by Yuji Hiramatsu, Hiroo Ide and Yuji Furui in Asia Pacific Journal of Public Health
Supplemental Material
sj-docx-7-aph-10.1177_10105395231175568 – Supplemental material for Associations of Lifestyle-Related Factors With Body Mass Index and Blood Pressure in the Middle-Aged and Older Population-Based Cohort in Japan: A Longitudinal Study
Supplemental material, sj-docx-7-aph-10.1177_10105395231175568 for Associations of Lifestyle-Related Factors With Body Mass Index and Blood Pressure in the Middle-Aged and Older Population-Based Cohort in Japan: A Longitudinal Study by Yuji Hiramatsu, Hiroo Ide and Yuji Furui in Asia Pacific Journal of Public Health
Supplemental Material
sj-docx-8-aph-10.1177_10105395231175568 – Supplemental material for Associations of Lifestyle-Related Factors With Body Mass Index and Blood Pressure in the Middle-Aged and Older Population-Based Cohort in Japan: A Longitudinal Study
Supplemental material, sj-docx-8-aph-10.1177_10105395231175568 for Associations of Lifestyle-Related Factors With Body Mass Index and Blood Pressure in the Middle-Aged and Older Population-Based Cohort in Japan: A Longitudinal Study by Yuji Hiramatsu, Hiroo Ide and Yuji Furui in Asia Pacific Journal of Public Health
Supplemental Material
sj-docx-9-aph-10.1177_10105395231175568 – Supplemental material for Associations of Lifestyle-Related Factors With Body Mass Index and Blood Pressure in the Middle-Aged and Older Population-Based Cohort in Japan: A Longitudinal Study
Supplemental material, sj-docx-9-aph-10.1177_10105395231175568 for Associations of Lifestyle-Related Factors With Body Mass Index and Blood Pressure in the Middle-Aged and Older Population-Based Cohort in Japan: A Longitudinal Study by Yuji Hiramatsu, Hiroo Ide and Yuji Furui in Asia Pacific Journal of Public Health
Supplemental Material
sj-tiff-1-aph-10.1177_10105395231175568 – Supplemental material for Associations of Lifestyle-Related Factors With Body Mass Index and Blood Pressure in the Middle-Aged and Older Population-Based Cohort in Japan: A Longitudinal Study
Supplemental material, sj-tiff-1-aph-10.1177_10105395231175568 for Associations of Lifestyle-Related Factors With Body Mass Index and Blood Pressure in the Middle-Aged and Older Population-Based Cohort in Japan: A Longitudinal Study by Yuji Hiramatsu, Hiroo Ide and Yuji Furui in Asia Pacific Journal of Public Health
Supplemental Material
sj-tiff-2-aph-10.1177_10105395231175568 – Supplemental material for Associations of Lifestyle-Related Factors With Body Mass Index and Blood Pressure in the Middle-Aged and Older Population-Based Cohort in Japan: A Longitudinal Study
Supplemental material, sj-tiff-2-aph-10.1177_10105395231175568 for Associations of Lifestyle-Related Factors With Body Mass Index and Blood Pressure in the Middle-Aged and Older Population-Based Cohort in Japan: A Longitudinal Study by Yuji Hiramatsu, Hiroo Ide and Yuji Furui in Asia Pacific Journal of Public Health
Supplemental Material
sj-tiff-3-aph-10.1177_10105395231175568 – Supplemental material for Associations of Lifestyle-Related Factors With Body Mass Index and Blood Pressure in the Middle-Aged and Older Population-Based Cohort in Japan: A Longitudinal Study
Supplemental material, sj-tiff-3-aph-10.1177_10105395231175568 for Associations of Lifestyle-Related Factors With Body Mass Index and Blood Pressure in the Middle-Aged and Older Population-Based Cohort in Japan: A Longitudinal Study by Yuji Hiramatsu, Hiroo Ide and Yuji Furui in Asia Pacific Journal of Public Health
Supplemental Material
sj-tiff-4-aph-10.1177_10105395231175568 – Supplemental material for Associations of Lifestyle-Related Factors With Body Mass Index and Blood Pressure in the Middle-Aged and Older Population-Based Cohort in Japan: A Longitudinal Study
Supplemental material, sj-tiff-4-aph-10.1177_10105395231175568 for Associations of Lifestyle-Related Factors With Body Mass Index and Blood Pressure in the Middle-Aged and Older Population-Based Cohort in Japan: A Longitudinal Study by Yuji Hiramatsu, Hiroo Ide and Yuji Furui in Asia Pacific Journal of Public Health
Footnotes
Acknowledgements
We would like to thank Haruko Uemura and Yuri Hamamatsu, for helping data acquisition, and Yoshinori Kasahara and Tomohiko Komoto, for their support for this study. We are grateful to the Shizuoka prefectural government for providing the dataset.
Declaration of Conflicting Interests
The author(s) declared no potential conflicts of interest with respect to the research, authorship, and/or publication of this article.
Funding
The author(s) disclosed receipt of the following financial support for the research, authorship, and/or publication of this article: This work was supported by the Shizuoka prefecture government (grant number: not applicable).
Supplemental material
Supplemental material for this article is available online.
References
Supplementary Material
Please find the following supplemental material available below.
For Open Access articles published under a Creative Commons License, all supplemental material carries the same license as the article it is associated with.
For non-Open Access articles published, all supplemental material carries a non-exclusive license, and permission requests for re-use of supplemental material or any part of supplemental material shall be sent directly to the copyright owner as specified in the copyright notice associated with the article.