
Abstract

Introduction
Severe acute respiratory syndrome coronavirus 2 (SARS-CoV-2) infection manifests as asymptomatic through to mild, severe, or fatal coronavirus disease (COVID-19). 1 The effective reproduction number, Rt, determines the potential for epidemic spread and is an essential parameter to evaluate effectiveness of public health interventions in different settings. 2 The basic reproduction number, R0, is a special case which determines the potential for epidemic spread in a totally susceptible population at the beginning of an outbreak and is estimated to be between 2 and 4 for the wild-type SARS-CoV-2.
In this study, we conducted an early epidemiological investigation of individuals tested and confirmed as COVID-19 cases in Birgunj metropolitan city of Parsa district, and admitted to Narayani hospital, one of the busiest COVID-19-designated hospitals in Madhesh Province at the beginning of the COVID-19 pandemic.
Methods
The study was part of the regular COVID-19 response from the Epidemiology and Disease Control Division (EDCD) in Birgunj metropolitan city, Parsa district of Madhesh Province.
Epidemiological Information
Information for 12 COVID-19 cases were collected from March 30, 2020, to May 13, 2020, and the samples from contacts of the positive and suspected cases in quarantine centers were obtained from May 4 to 11, 2020.
After identification of the list of contacts, epidemiological information was collected following the World Health Organization (WHO) contact tracing and follow-up protocol.
Statistical Analysis
Attack rate (AR) and relative risks (RRs) were calculated with 95% confidence interval (CI) in different age groups. The positivity rate among the residents (representative of the ward population) of the wards of Birgunj metropolitan city were projected on the total ward population and adjusted by the reverse transcription polymerase chain reaction (RT-PCR) sensitivity and 95% CI estimated.
Reproduction numbers were calculated using either the AR for patient positive contacts (AR model) 3 or, when case dates were available, using both Poisson regression of the exponential growth (EG), defined by the per capita change in number of new cases per unit of time (EG model), 4 and a maximum likelihood (ML) approach (ML model), 5 after Obadia 6 using the R0 package. For the EG and ML models, we used two generation intervals (GTs), as R0 estimates are sensitive to this 7 : 3.95 and 5.2 days, with a gamma distribution and 1.5 standard deviation 7 (data not shown).
Results
SARS-CoV-2 Detection and Transmission in Parsa District
Of 662 samples collected from April 30 to May 13, 2020, 89 (13%, 95% CI [11%, 16%]) individuals tested positive for SARS-CoV-2. Among the total collected and tested, 478 samples were from Birgunj metropolitan city, of which 71 (15%, 95% CI [12%, 18%]) were SARS-CoV-2 positive. Moreover, 429 specimens were from inhabitants of Birgunj metropolitan city of which 66 (15%, 95% CI [12%, 19%]) tested positive for SARS-CoV-2.
The distribution of positive cases (Figure 1) through cross-sectional observation demonstrated the increasing pattern of COVID-19-positive cases with effective reproduction estimates ranging from 1.77 (95% CI [1.19, 2.6]) to 2.08 (95% CI [1.25, 3.45]) with the EG model and 3.95- or 5.2-day generation intervals, and 2.67 (95% CI [1.92, 3.61]) to 4.77 (95% CI [3.41, 6.43]) using the ML model (Figure 2).
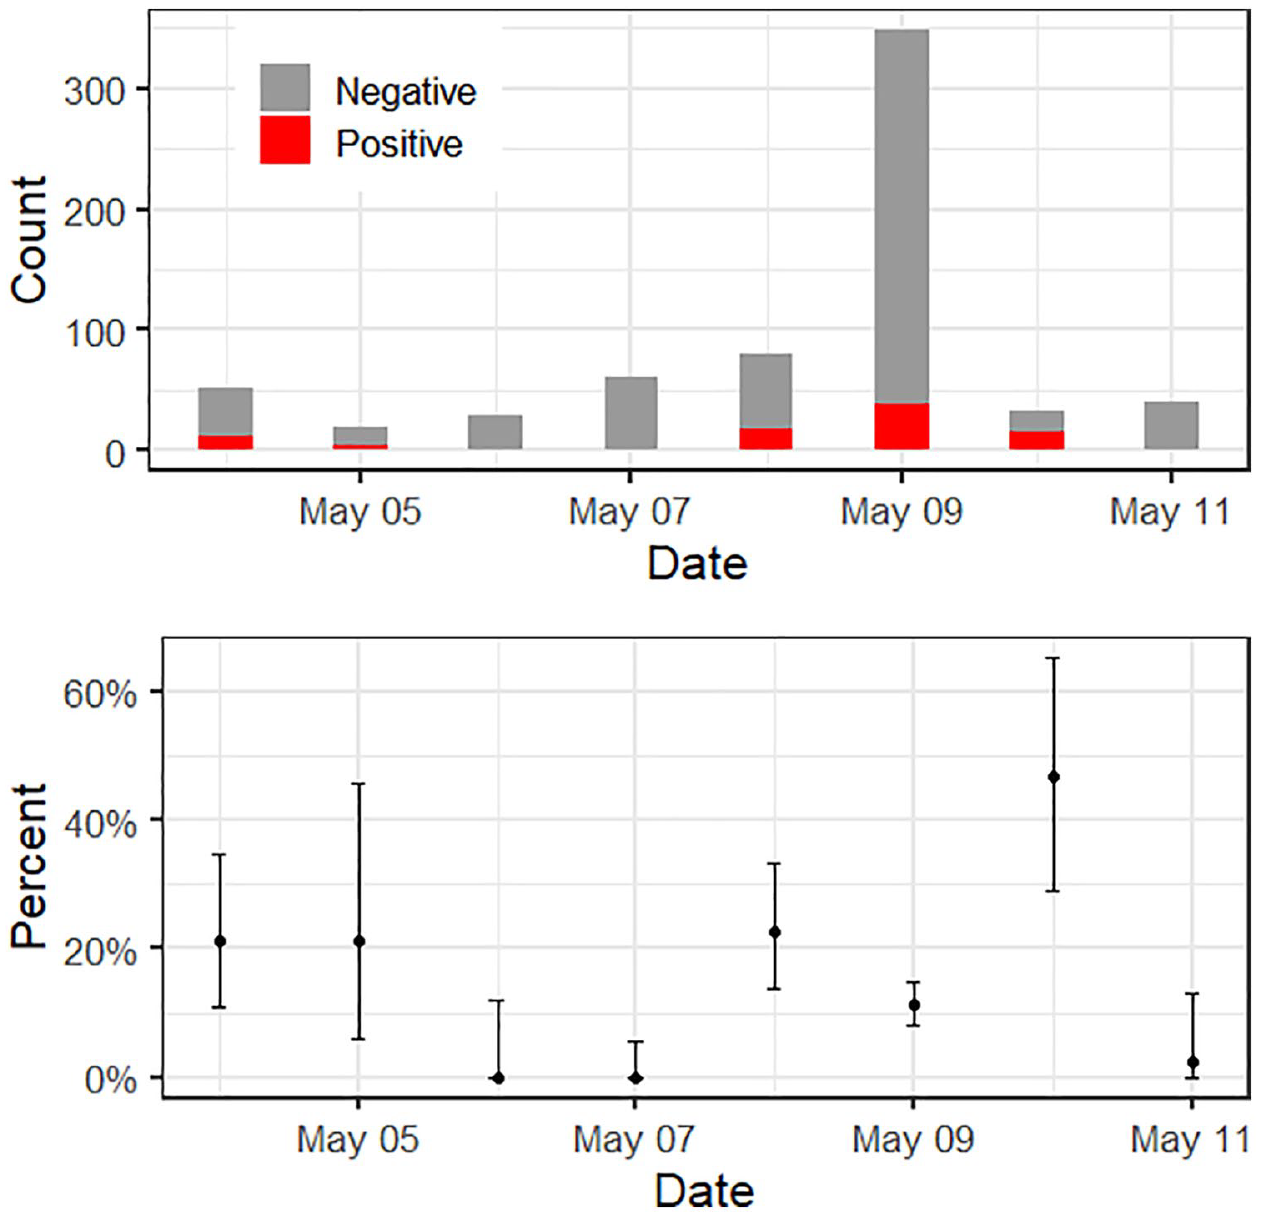
Trends of COVID-19 results from Parsa.
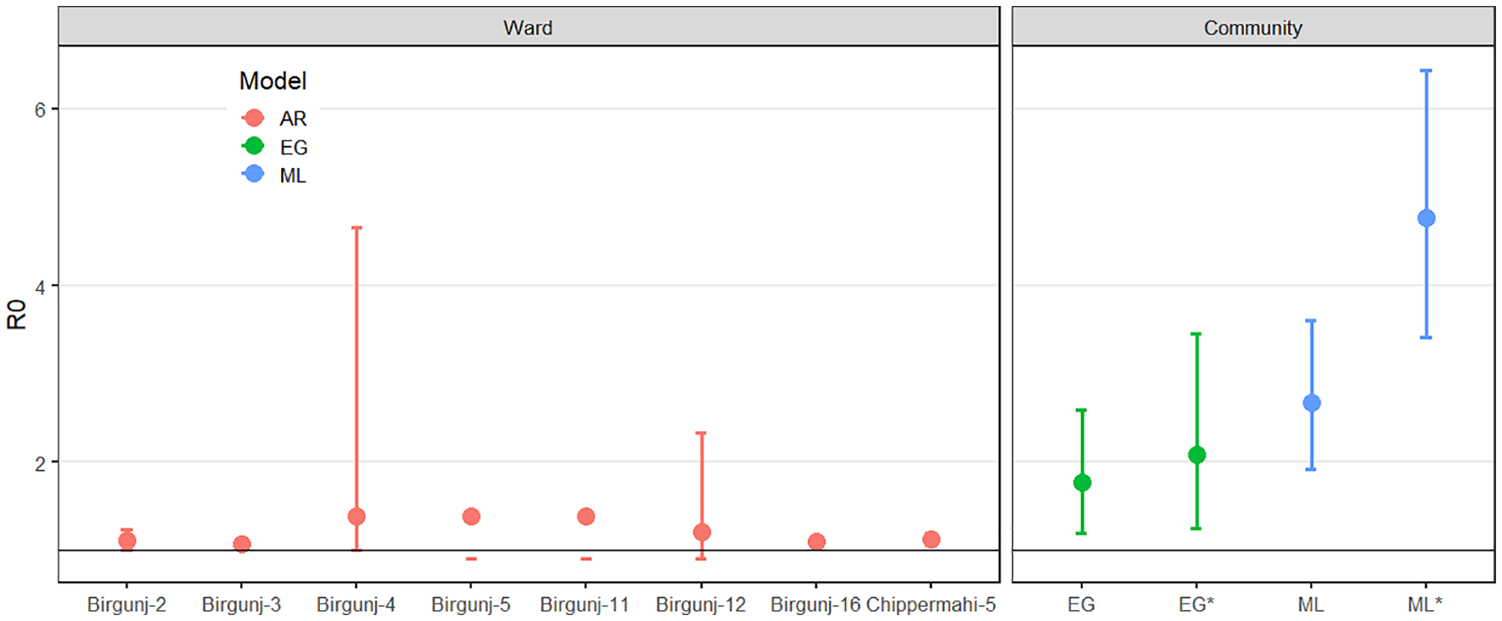
Reproduction number of COVID-19.
Exposure Status of COVID-19 Cases
A small fraction of positive cases (14, 16%) had a travel history to COVID-19-affected countries and those cases were in facility-based quarantine. Only two (2%) of the returnees with SARS-CoV-2-positive results were not in quarantine. A source of acquiring infection was not determined for about 28% (25) of the confirmed COVID-19 cases.
When considering AR by the age group, our data revealed that most people who had prior contact with COVID-19 cases were from the working age groups, 15 to 59 years old (Table 1). However, children were found to have higher AR (AR = 47.4%, 95% CI [24%, 71%]). Adults (15-59 years) and elderly above 60 years of age had attack rates of 14.2% (95% CI [10%, 20%]) and 10.5% (95% CI [1%, 33%]), respectively. The risk of acquiring infection was not significantly different in female vs male, RR of 1.36 (95% CI [0.7, 2.58]). The transmission rate observed was significantly higher in people with a travel history to India than the people without travel history (RR = 2.4, 95% CI [1.01, 5.86]).
Age Structure of the Contacts and Attack Rate.
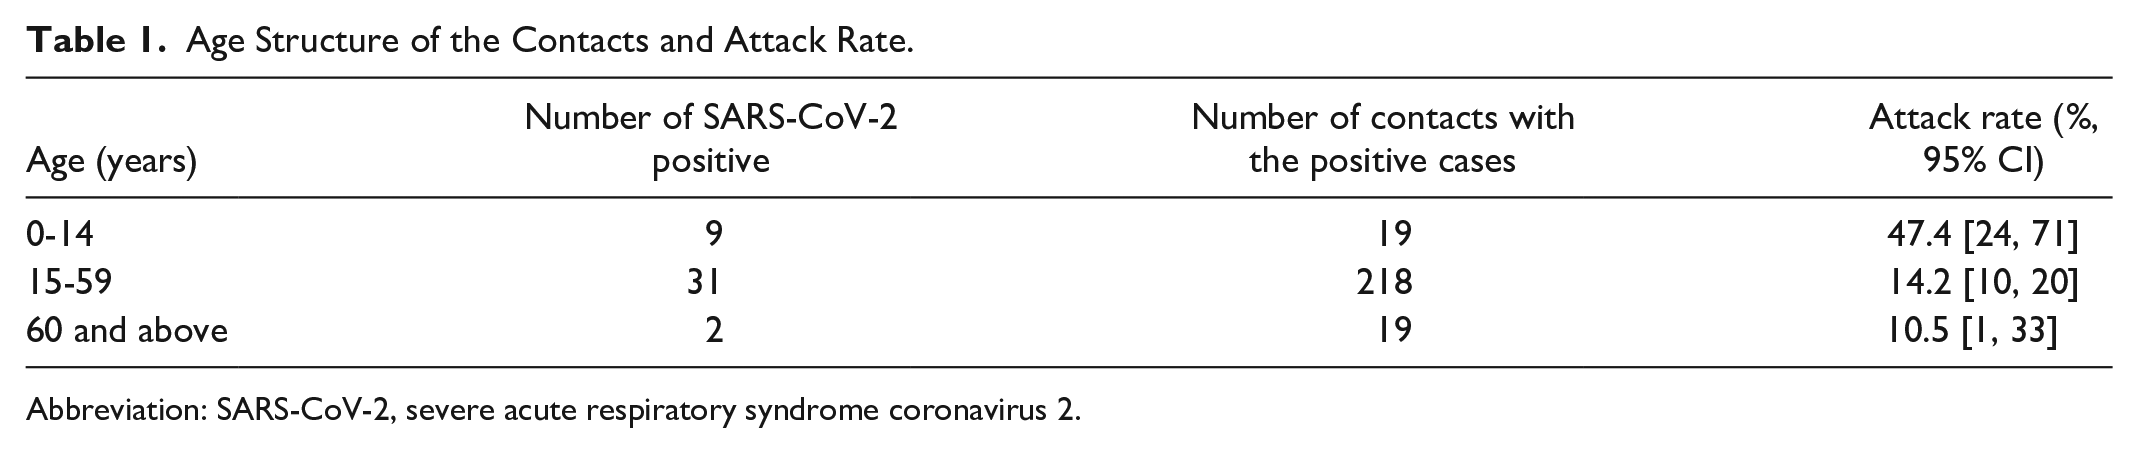
Abbreviation: SARS-CoV-2, severe acute respiratory syndrome coronavirus 2.
Extrapolating Incidence Estimates to the General Population
Besides samples of contacts of SARS-CoV-2-positive cases, samples from people with no known contact with COVID-19 cases and people having no travel history to wards 3, 16, and 26 were also collected and tested. People with and without contact histories were assumed to be from the general population of the respective wards. The SARS-CoV-2-positive detection rate in both groups (contact and no contact) observed between April 30 and May 13, 2020 was projected to the general populations of wards 3, 16, and 26 of Birgunj metropolitan city. A 33% false-negative rate 8 for the RT-PCR testing process was used as an error factor to adjust for false negatives. The incidence per 10 000 population in wards 3, 16, and 26 were projected to be 2958 (95% CI [2844, 3077]), 2296 (95% CI [2229, 2364]), and 249 (95% CI [215, 289]), respectively.
Discussion
The AR in Birgunj metropolitan city was comparable with 0.50% to 59% of AR reported elsewhere at the beginning of the pandemic. 9 Our investigations of early cases in Birgunj metropolitan city revealed individuals had traveled to attend a large religious conference where transmission due to mixing people from different locations could occur, which is evident in other studies.
Our estimates of the reproduction number for the wild-type SARS-CoV-2 are similar to other studies. Our data were somewhat limited, and the different models suffer different issues, but our estimates are close or within the range reported previously, between 1.9 and 6.47 (median = 2.6, mean = 3.1). 10
Conclusion
Overall, our study confirmed that the COVID-19 outbreak in Nepal followed a similar pattern to that in other countries, with travelers introducing infection into the working-age populations and transmission through close contact. Our findings helped to strengthen public health and social measures at national level.
Footnotes
Declaration of Conflicting Interests
The author(s) declared no potential conflicts of interest with respect to the research, authorship, and/or publication of this article.
Funding
The author(s) disclosed receipt of the following financial support for the research, authorship, and/or publication of this article: DTSH is funded by Royal Society Te Apārangi Rutherford Discovery Fellowship (RDF-MAU1701) and the Percival Carmine Chair in Epidemiology and Public Health.
Ethical Approval
The data generated has been approved by EDCD, Department of Health Services as a regular surveillance and response process of Ministry of Health and Population, Nepal.