
Abstract
Although local governments attempt to promote sports among all layers of society, people with a lower socio-economic status are still under-represented in grassroots sports. Previous studies indicate that inter-sectoral networks and joint efforts can contribute to an increase in sport participation among these groups, but a systematic analysis of the structure, coordination and interactions in the networks is still missing. Insight into networks to promote sport for disadvantaged people may help in designing effective networks. Therefore, we conducted a social network analysis to explore the network structure and characteristics of networks that promote sport participation among disadvantaged people in three Flemish cities. Our results show that the networks needed to be coordinated by a sport administrator, in the initial stage. Once the network is up and running, coordination can be shared so that the sport administration can rely on the experiences of other sectors. More sport initiatives and a better network structure were found in the cities with a community sport development program, through which the sport-for-all policy is implemented and coordinated, compared to a city without such a program.
Keywords
Introduction
It is widely acknowledged that people living in disadvantaged communities and people with lower socio-economic status (SES) are less physically active and less engaged in sports (Cleland et al., 2012; Skinner et al., 2008; Sleap and Duffy, 1982). Disadvantaged communities are defined as ‘communities that suffer acute social problems such as increasing population densities, low SES, high rates of chronic disease, high levels of migration and young people at risk of exclusion from society’ (Skinner et al., 2008: 264). However, the European Union (Council of Europe, 2014) stated that sport must be accessible for all citizens through ‘sport-for-all’ programs and that all governments should promote sport at all levels of society. Sport-for-all refers to the guidelines of European politicians to encourage sport participation for all citizens, including older people, disabled people and people in socially deprived groups (Council of Europe, 2014; Skille, 2011).
Sport-for-all, especially among the disadvantaged and the inhabitants of disadvantaged communities, needs to be embedded in the community of those people (Vail, 2007). Promoting sports among disadvantaged people is, however, challenging and the results of local sport promoting initiatives have been disappointing (e.g. Hardcastle et al., 2012; Riley and Anderson-Butcher, 2012). Recent studies have indicated that partnerships and networks can help to engage disadvantaged people into sports (Marlier et al., 2014; Smith et al., 2006; Vail, 2007). However, those studies also indicated the difficulty of establishing effective partnerships and networks, as well as the importance of champions and coordinators in the community-development networks. Therefore, more understanding of the structure and operation of these networks is necessary to learn how the networks can become effective tools in achieving sport-for-all among disadvantaged people. Quatman and Chelladurai (2008) suggest expanding the horizons of the field of sports management through social network theory and social network analysis (SNA). Social network theory is regarded as a promising research approach that can untangle the complex network structures in different contexts. Currently, different scholars have conducted an SNA in the sport sector in a range of different contexts, such as in the study of personal networks (e.g. Day and McDonald, 2010) and organizational networks (e.g. Parent et al., 2015; Stern, 1979). However, none of these studies have applied an SNA to local networks to promote the sport participation of disadvantaged people, and consequently, detailed knowledge on the structure of these networks to promote sport-for-all or ‘sport-for-all networks’ is lacking.
The aim of this study is twofold. On the one hand, we want to provide descriptive information on the actors constituting these networks. On the other hand, we respond to the call to go beyond simply describing the relationship (Quatman and Chelladurai, 2008) and explore how the network is coordinated and which kind of network structure is more likely to better engage disadvantaged people in sport. We address the following three research questions: How is the sport-for-all network for disadvantaged people structured? Who takes a coordinating role in the network? Which network structure is most suitable to engage disadvantaged people in sport activities?
Context: promoting sports among disadvantaged people
Recent studies have shown that local networks contribute to the successful implementation of community-based sport-for-all initiatives for disadvantaged people (Marlier et al., 2014, 2015b; Smith et al., 2006; Vail, 2007). People living in disadvantaged communities or with low SES are less likely to engage in sports (Sleap and Duffy, 1982), despite the positive effects sport participation brings, such as social and health benefits (Penedo and Dahn, 2005). Disadvantaged people experience sport participation as too expensive, time-consuming and ‘not for them’ (Sleap and Duffy, 1982). Local bottom-up initiatives show more potential to increase physical activity and sport participation in disadvantaged communities than large-scale sport-for-all campaigns (Frisby and Millar, 2002; Lucidarme et al., 2013; Marlier et al., 2015b; Vail, 2007). Different strategies to increase sport participation in disadvantaged communities have been tested. However, studies on the effect of, for instance, sport-based development programs to improve, among others, participants’ social skills and pro-social behaviour showed little effect (Riley and Anderson-Butcher, 2012). It is indicated that not only sport organizations should be involved in promoting sports, but that a close collaboration among social, youth and health organizations is also needed (Frisby and Millar, 2002; Houlihan, 2005; Marlier et al., 2014). Moreover, societal issues such as increasing sport participation are multidimensional problems and cannot be handled by a single organization alone (Turrini et al., 2010). Knowledge and experience from different sectors are required to identify the needs and provide answers and solutions to these needs in communities. Local organizations are best positioned to define the needs in the community and, thus, to play an important role in sport-for-all networks (Frisby and Millar, 2002; Vail, 2007).
As the Council of Europe stated in its ‘Sport for All Charter’, sport must be accessible to all citizens, including inhabitants of disadvantaged communities. Thus, this charter validates and strengthens the assignment that national, regional and local governments have to promote sports among all layers of society (Council of Europe, 2014). Therefore, local governments increasingly engage in local networks together with other local public, non-profit and for-profit organizations to involve the non-active citizens in sport participation (Graddy and Chen, 2006; Houlihan, 2005; Vail, 2007). However, local governments not only participate in such networks, but also often take up a coordinating role for at least three reasons.
First of all, local government agencies are formally responsible for policy implementation and service delivery in their municipality (Hoeijmakers et al., 2007). Moreover, the ability to provide subsidies and public funding to organizations or program delivery designates them as the most powerful network member (Gazley, 2008). Therefore, in many cases, government agencies have the financial power in the network, which positions them in a central role.
Second, an economic perspective justifies government intervention due to market failure, in which a strong role for the private sector will not generate an optimal service delivery. Private sector organizations successfully satisfy individual demands but government intervention is needed to fulfil social desirable demands, such as socially desirable levels of sport participation (Hallmann et al., 2015; Késenne, 2000).
Third, a social perspective also justifies government intervention in sport delivery. Next to traditional sport delivery, sport is also used as a vehicle to deal with societal issues and improve life conditions (Skinner et al., 2008). Local authorities are concerned with public health and have to address major societal issues such as obesity and health risks due to inactive lifestyles (Hoeijmakers et al., 2007). Given the fact that such community needs should be identified locally, local governments are situated in an ideal position to address these needs and use sport as a means to tackle those societal issues (Vail, 2007).
Theoretical framework
This study applies a social network theory approach (Borgatti and Halgin, 2011; Keast et al., 2007; Quatman and Chelladurai, 2008) to understand the structure and characteristics of collaborations to promote sport among disadvantaged persons.
Networks are studied in several research disciplines, such as management, anthropology, policy and sociology, all with distinct purposes and methods (Berry et al., 2004; Tichy et al., 1979). The variety of underlying theories and objectives have created a complex and often confusing picture of network theory, a theoretical approach to assess networks, and network analysis, a specific methodology to study networks (Berry et al., 2004). Although the benefits of networks are well discussed in management literature (e.g. Agranoff, 2006; Meier and O’Toole, 2003), an interdisciplinary approach using sociological insights will improve the knowledge of these networks (Love and Andrew, 2012). In the present study, we apply social network theory from the viewpoint of a sociological tradition for several reasons. First, social network theory is chosen in this study because ‘it enables a detailed examination of the relationships between organizations’ (Provan et al., 2004: 174). Second, social network theory allows us to understand the structure of a network and the positions of organizations in the network. Third, SNA within social network theory is an appropriate method to study coordination in networks (Borgatti and Halgin, 2011; Cousens et al., 2012; Seippel, 2008).
The following paragraphs will define and describe the characteristics and measures applied in the social network theory approach. According to social network theory scholars, ‘a network consists of a set of actors or nodes along with a set of ties of a specified type’ (Borgatti and Halgin, 2011: 2). In sport, a node in a network can be both a person, such as an athlete or coach (Ferreri et al., 2014; Fransen et al., 2015), or organizations concerned with sports, such as governing bodies, sport clubs, sponsors or media (Cousens et al., 2012; Seippel, 2008; Wolfe et al., 2002). Different types of ties may exist between the nodes in a network. For instance, organizations might only share information and knowledge or they might share other resources such as staff, time, facilities and financial resources (Cousens et al., 2012). SNA allows properties to be measured as density, tie strength, centralization and centrality to help extend the knowledge of networks in sport (Quatman and Chelladurai, 2008).
Network density refers to the number of ties in the network, divided by the number of possible ties between the nodes, and thus refers to a structural characteristic of the network (Blanchet and James, 2012; Cousens et al., 2012; Quatman and Chelladurai, 2008). Moreover, a high network density implies a higher number of actors that are intensively engaging with each other (Hoeijmakers et al., 2007). Furthermore, linked to network density is the issue of strong and weak ties. Tie strength is a combination of the amount of time, intensity, intimacy and services shared between the partners (Granovetter, 1973).
Density and the strength of the ties are thus important network measures and are linked with characteristics such as commitment and trust in the network. Developing a dense network with strong ties between the members, which implies both trust between the organizations and commitment of all organizations, takes time to develop, as it needs to grow through a process of mutual learning or achieving shared objectives (Head, 2008; Marlier et al., 2015a; Parent and Harvey, 2009; Willem and Lucidarme, 2014). A network that over time has achieved high density and strong ties among members has highly committed members who have common missions and work toward system change. Keast et al. (2007) situated networks with these characteristics on the most integrated end of an integration continuum and called them ‘collaborations’. On the other end of the continuum is ‘cooperation’, which implies the partners in the network have no loss of autonomy but are ‘taking each other’s goals into account’. Coordination is positioned in between and occurs when there is a need to align resources, but partners retain full autonomy (Keast et al., 2007). This typology of Keast et al. (2007) is also known as ‘the 3Cs’, standing for cooperation, coordination and collaboration.
Centralization is, just like density, a characteristic that concerns the whole network and refers to the location of organizations within the network. It gives an idea of which organization plays a coordinating role within the network (Cousens et al., 2012). Coordination in literature is defined in different ways. In this study, we look at coordination as a form of leadership. The coordinator of a network shapes the overall conditions under which the network operates and guides the activities of the member organizations (Müller-Seitz, 2012). Note that ‘coordination’ here is a form of leadership and differs from ‘coordination’ as a network type in the typology of Keast et al. (2007), described above. A centralized network means that a clear boundary is visible between the centre and the periphery of the network (De Nooy et al., 2011). In other words, only one or a few organizations have most of the power or influence in the network and coordinate the network. A low centralization score implies that coordination is shared among all or many organizations.
Centrality is a node property, which means it is specific to every organization within the network and considers the number of ties that a specific organization has (Blanchet and James, 2012; Freeman, 1979). Degree centrality refers to the number of direct ties an organization has (Cousens et al., 2012). Thus, an organization with a high degree of centrality has a central role in the network (Hoeijmakers et al., 2007; Provan et al., 2005a).
In networks in which the direction of the ties is specified (directed networks), a difference between in-degree and out-degree centrality exists, with in-degree centrality defined as the number of ties that arrive in the specific node and out-degree centrality based on the ties that depart from the node. This implies that a higher in-degree centrality shows that the organization is more prominent and many other organizations try to tie directly with them (Hanneman and Riddle, 2005). Furthermore, out-centrality measures the extent of influence an organization can have on the other organizations in the network, and correlates stronger to coordination than in-centrality (Hanneman and Riddle, 2005; Hossain and Wu, 2009). An extension to degree centrality is provided by Bonacich (1987), who stated that centrality is not only a function of how many connections an organization has, but also of how many connections its connecting organizations have. Thus, an organization not only benefits from its own direct ties but also from the ties of the organizations with which they are connected. Beta centrality is a measure that includes these connections of connections and, although it is not an exact measure, it is presented as a proxy of power in the network. The more connections your connection has, the more central you are in the network and, thus, the more powerful you are. In other words, an organization with a high Beta centrality has ‘the right (sic) connections’ (Hanneman and Riddle, 2005).
Density, centralization and centrality as network and node measures provide sufficient information to create a map of the networks and to contribute to our understanding of coordination in the network (Cousens et al., 2012; Provan et al., 2004).
Each of the measures will be studied to learn how networks that engage disadvantaged people in sport are coordinated and structured.
Methodology
Study design
The study design is a cross-sectional, survey-based field study of whole networks, applying SNA methods. A cross-sectional field study implies that the researchers observe the network in its current status at a certain point in time, without interfering in the network functioning. Studying whole networks implies that we study the entire set of nodes and ties in the network, and not the ties and nodes of one specific organization (Borgatti et al., 2013). The SNA method is based on sociometric data. Such data consist of relationships (ties) and characteristics (i.e. density, tie strength) of these relationships between units (nodes) and the mapping of these in a sociogram. Throughout all parts of the research process (i.e. data collection, data management and analyses) we followed the guidelines of Borgatti et al. (2013), who presented a detailed introduction to SNA. The set of ties among all organizations in the networks are studied at a single point in time. The result is thus a picture of how the network looks at a given moment. We measured the flow of information and flow of resources between different organizations, resulting in two different networks per city: information networks and resources networks. Networks should be displayed and interpreted separately because scores of one type of link (for instance information sharing) might be different for other types (such as resource sharing) (Provan et al., 2005b). In order to develop theory on local sport-for-all networks, we carried out a multiple case study of three Flemish cities.
Sample selection
In Flanders, community sport development programs (CSDP) are developed to implement sport-for-all policy and, specifically, to engage disadvantaged citizens in sport (Theeboom et al., 2010). The programs were incepted through a bottom-up process by a collaboration among sport, social and health organizations who coordinate all sport-for-all initiatives for the presented target group (Marlier et al., 2014). However, not all cities and municipalities promote sport-for-all among the disadvantaged through this program – they prefer to organize several ad hoc and uncoordinated initiatives.
The case selection was based on two criteria. The first criterion constituted the program tenure of the CSDP: the aim was to select one city with a program tenure of 15 years (experienced city), one with a program tenure of six years (semi-experienced city) and one without CSDP (control city). Data on the tenure of the CSDP in the cities were acquired through interviews with sport administrations in 11 cities that implement CSDP. The second criterion constituted the comparability of these cities in size, age, percentage of immigrants, mean income and percentage of unemployment. Size was the main criterion to select the control city, as the debate on integrating disadvantaged people is most present in larger cities (Theeboom et al., 2010). Flanders is a Belgian region with about six million inhabitants in 308 municipalities. The selected cities were middle-sized, with 50,000 to 100,000 inhabitants.
To compare the sport initiatives in the three cities, we divided the organized activities in three categories. We differentiated between the ‘pure’ sport initiatives, the initiatives that combine sports with another social objective and the initiatives to promote exercise and/or healthy behaviour. In City A, the majority of the existing initiatives were pure sport initiatives, such as a series of lessons in one or more specific sport. Two examples are the Mobiel, which supplies sport equipment to different communities in the city, and Street Action, which is a regionally coordinated sports program. City B mostly focused on sport as a means to reach a social or health objective. For instance, children were guided to do their homework before they engaged in a sport activity together. Also cycling lessons for women were provided to encourage safe and healthy commuting. City C mostly emphasized health initiatives, such as relaxation, yoga or guided walks.
Data collection
Sample
Network actors were identified using a combination of reputational and snowball sampling. Sampling at the first or reputational stage of the research started with the sport administrators of the cities, who informed the researchers about the organizations they collaborate with to promote sports among low SES inhabitants. The sport administration was chosen as a starting point of the snowball sampling because it is the only organization that has a fixed role in the network, given their explicit task to promote sports among all layers of society (Council of Europe, 2014). Data collection thus started with semi-open interviews with these sport administrators in the three cities. Secondly, a questionnaire was sent to all organizations listed by these sport administrators. These organizations could nominate up to five additional organizations that they considered most important and not yet on the list provided by the sport administrators. When this occurred, the new organization received a questionnaire too. A rule was needed to set the network’s boundaries, and thus where to stop the survey. We adopted the approach used by Lewis (2006), who found that the number of new names started to drop after five rounds. She decided to stop snowballing at that point. In our research, the number of new names dropped remarkably after three rounds, which made us decide to stop at that point. For instance, in City A, only one extra name popped up after the third round of data collection, while in the second round, five new names still showed up. Also in City B, only one extra organization was added, while in City C no new names were mentioned.
Measurement
The semi-structured interviews and questionnaire were based on a modified version of Provan et al.’s (2005b) survey, who used network analysis to understand the relationship between public and non-profit organizations (Provan et al., 2005b). Interviews of 25 to 35 minutes were held with the sport administrators of our selected cities. These were recorded and transcribed. First, we asked about the organizations they collaborate with to promote sport among disadvantaged people. Second, we asked who initiated contact with the current partners and how the network developed. Next, we asked how often they had contact with the partners, both informally or formally (i.e. during meetings or official get-togethers) and if an agreement was established between the organizations in the network. Last, we asked them to give an overview of the activities they organized, how many activities they organized and how these were coordinated. Based on the responses from the interviews, we obtained more insight into the community sport program in the cities, or, as in the case of City C, of their strategies to reach low SES inhabitants and engage them into sports. Sport administrators provided us with names of organizations that were, according to them, essential in the community sport program. After these interviews, we collected eight names of organizations for City A, eight for City B and 10 for City C.
Subsequently, a questionnaire was developed for all organizations listed by the sport administrators and further added to this list during the data collection. The first part of the questionnaire included a grid in which all organizations, provided by the sport administrators, were listed. We asked the respondents to choose ‘yes’ or ‘no’ if they did or did not cooperate with the listed organizations. Cooperation was defined very broadly: ‘By cooperation, we mean the exchange of at least information/knowledge about the target group. For instance: communication with another organization that contributes to the promotion of sport among disadvantaged people is in this research seen as a cooperation’. If the respondents answered ‘yes’, further questions were asked on the type of exchange (information, resources or both). Sharing information included email correspondence, attending meetings and general knowledge. Resource sharing included shared facilities, staff, equipment or finances (Cousens et al., 2012). Next, we asked how often they have contact (from multiple times per week until once per year) as a proxy of tie strength (Granovetter, 1973), and on the formality of the network, to assess sustainability. Finally, we asked the respondents to indicate the organization(s) who, according to them, has/have the coordinating role in the network. The last five rows of the grid were blank, and respondents were asked to include other organizations that are, according to them, part of the network. The second part of the questionnaire examined the sport-for-all initiatives. A list of possible initiatives was provided and respondents were asked if they were involved in these initiatives, if they were the coordinating partner and how often these initiatives occurred. Again, five rows were blank to include additional initiatives. After three rounds of data collection, we collected information about 18 organizations in City A, 16 in City B and 19 in City C.
Data analysis
Data were analysed using UCINET 6 network analysis software to calculate network measures and NetDraw for visualization of the networks. We measured sharing information and sharing resources among the organizations in the network resulting in two networks per city, an information sharing network and a resource sharing network (Borgatti et al., 2013). The network measures of density and centralization are commonly reported measures which contribute to the understanding of coordination in the network (Cousens et al., 2012; Provan et al., 2005b). Node degree centrality was measured, using basic measures introduced by Freeman (1979), to increase understanding of the ‘prestige’ and influence of one organization in the network (Hanneman and Riddle, 2005). Freeman’s basic approach provides information on how prominent or influential an organization is. Additional information on how powerful an organization is, based on the number of connections an organization’s connection has in the network, is provided by Bonacich’s approach or Beta centrality (Bonacich, 1987). We calculated Bonacich’s power score for the out-centrality measures in the network (as a proxy for coordination).
Results
Network structure
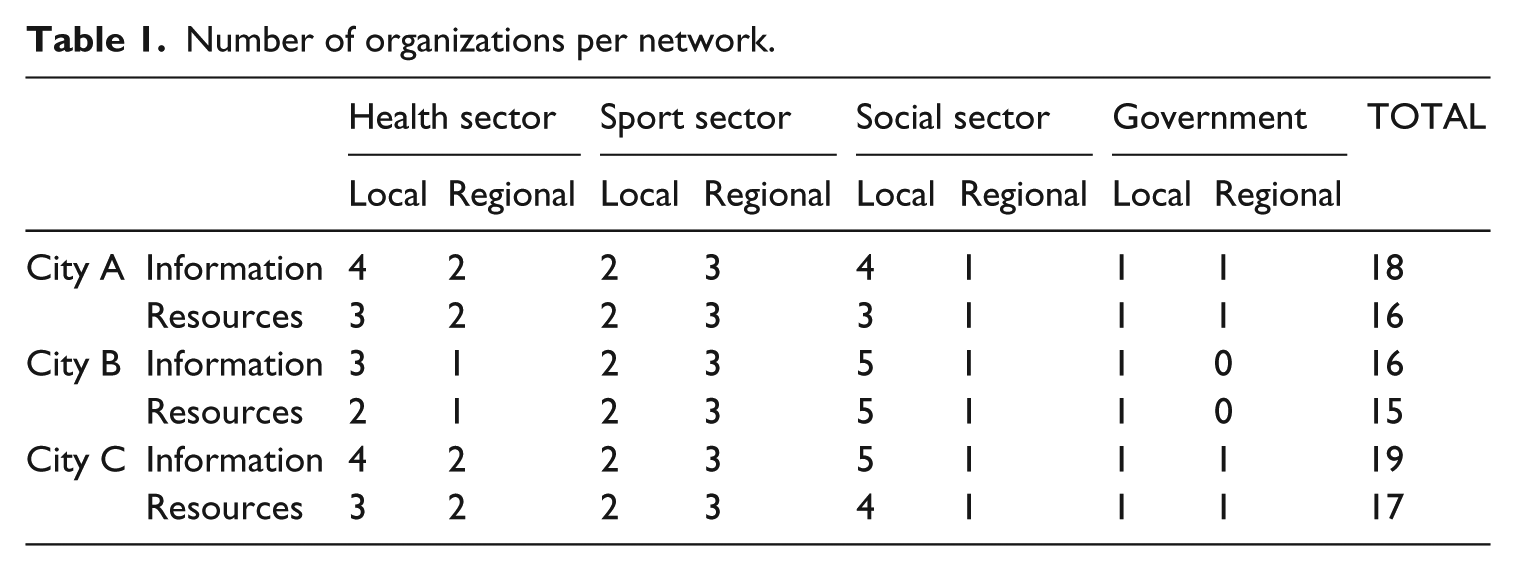
All organizations were categorized in either local or regional organizations, and in organizations from the health, sport or welfare sector or public (government) agencies. Local organizations are organizations that work within the boundaries of the city in which they are located. Regional organizations are active in multiple cities and municipalities or the entire region (Flanders) or country (Belgium). In the three cities, similar organizations were part of the networks. The social sector was represented the strongest, while the engagement of government agencies was, in most cases, limited to the local government. Especially for the social sector, mainly local organizations played a role (Table 1).
Number of organizations per network.
Figures 1 to 3 display the networks in the three cities with organizations from the sport (bottom), social (top), health (left) and government (right) sector.
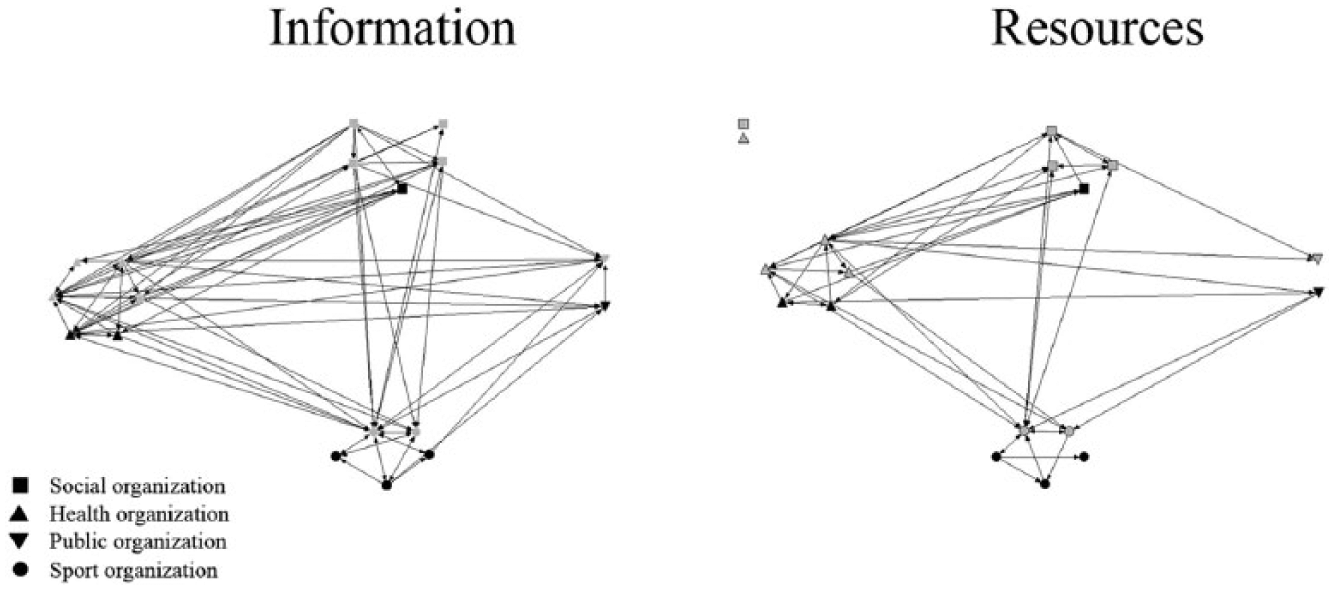
Network visualization of City A.
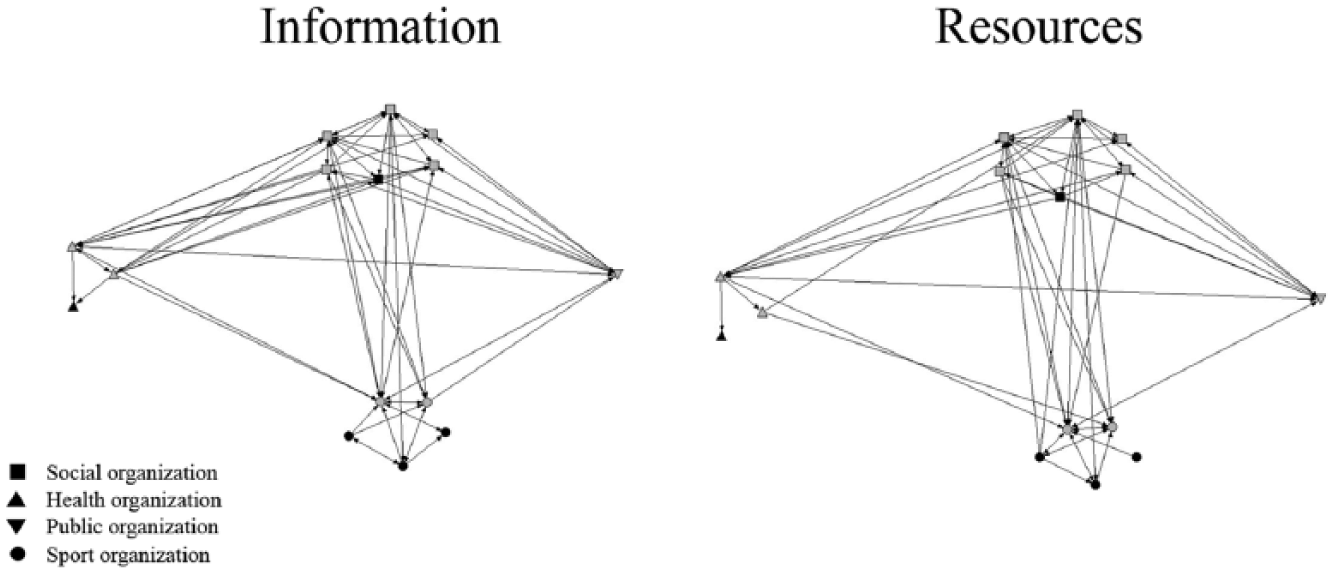
Network visualization in City B.
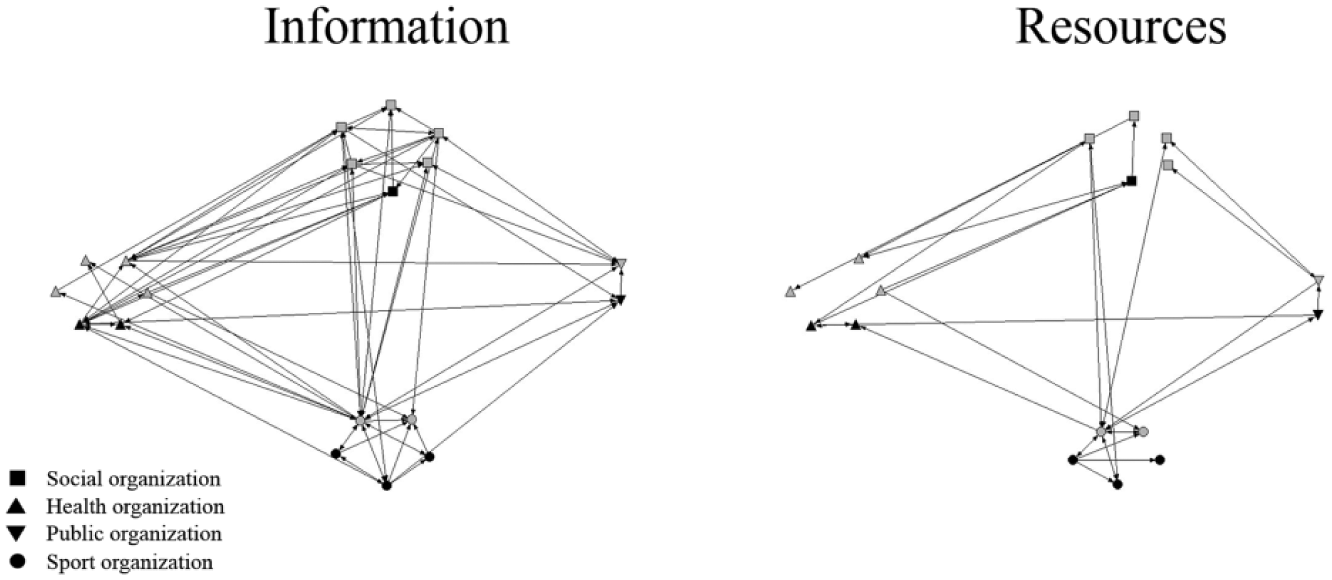
Network visualization of City C.
Figure 1 displays the networks in City A and shows many ties between the social and health sector. An apparent flow of information is noticeable within the different types of organizations, as well as between the social and health sector. Also, we noticed more flow of information compared with the flow of resources. The sport sector showed many ties among sport organizations, but inter-sectorial relationships seemed limited.
In the networks of City B (Figure 2), most ties also occurred between the social and health sector. However, the networks in the figure show that the sport sector collaborated more with the health sector than compared with City A, where this type of collaboration is much less present. Both the flow of information and the flow of resources are marked by the same specific pattern.
In City C (Figure 3), the information network showed many ties between the sport sector and both the social and health sector. This pattern is clearly visible in the portrayal of the information flow. On the contrary, the resources network, with only a few ties, was clearly not fully developed. This is different from the pattern on resource flow distinguished in the networks of City B.
Table 2 displays the centralization and density measures of our networks. When interpreting centralization scores according to the indications of Poole (2008), our results were generally low (< 40%) to average (between 40% and 60%), which means that coordination in the networks was shared (cf. Cousens et al., 2012; Provan and Kenis, 2008). In City A, the information network showed a rather low out-degree centralization, while the in-degree centralization was lowest in the resources network. In City B, both networks showed a lower out-degree centralization, compared to the in-degree centralization. In City C, the out-degree centralization in the information network was higher than average (69,44), which means that only a few organizations exchanged the majority of the information. In the resources network, centralization was low, which shows a fragmentation of resource sharing.
Overview of density and centralization scores in the networks.
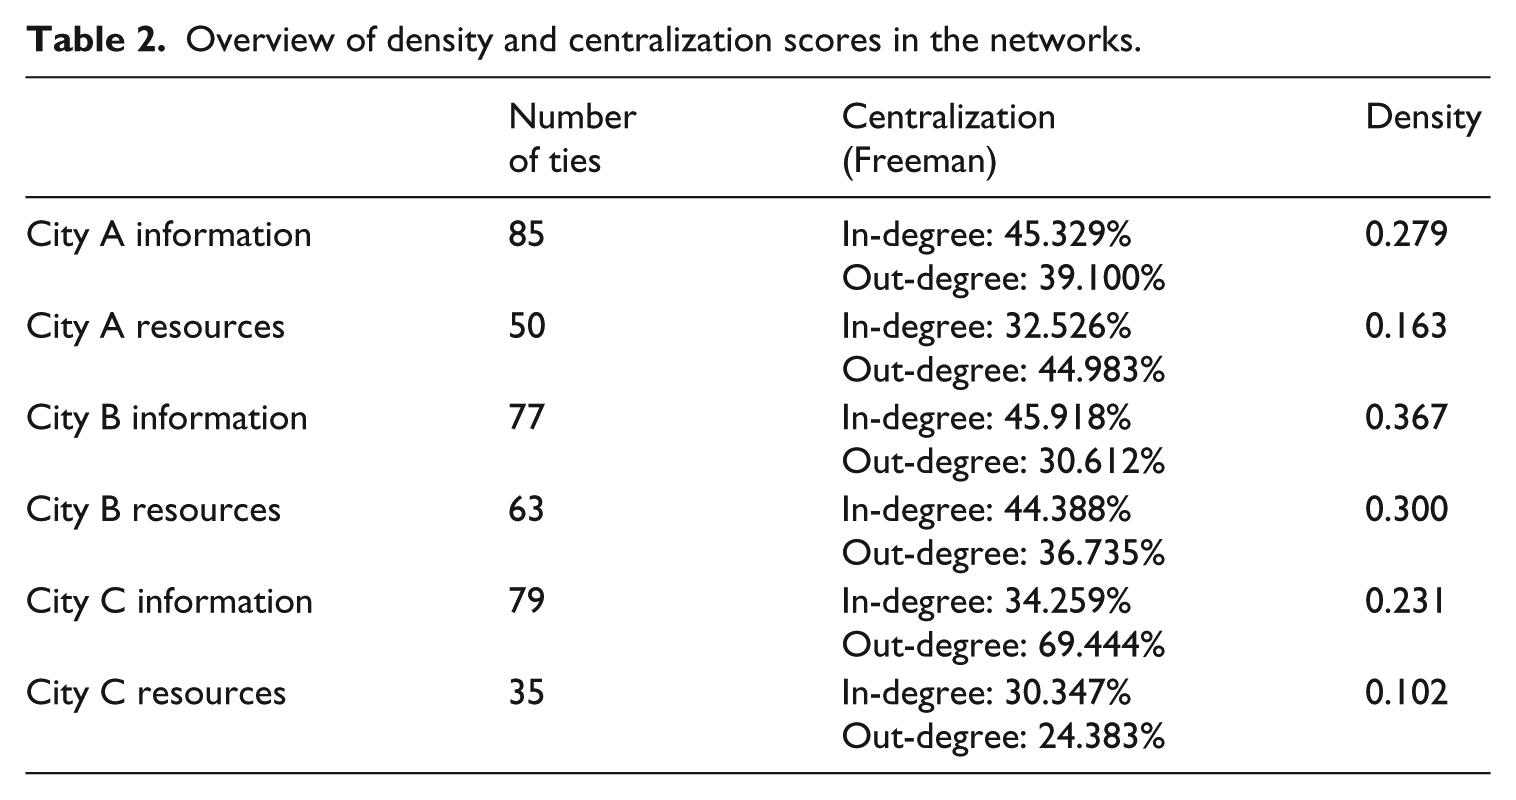
Density scores in all networks were generally low (Cousens et al., 2012), which implies only a few ties between the organizations in the networks. In the three cities, density scores of the resource sharing networks were lower than in the information networks. The visualization of the networks (Figures 1 to 3) also displays that several organizations are not connected yet. For instance, in all cities, regional sport organizations are not connected with other sector organizations.
Network coordination
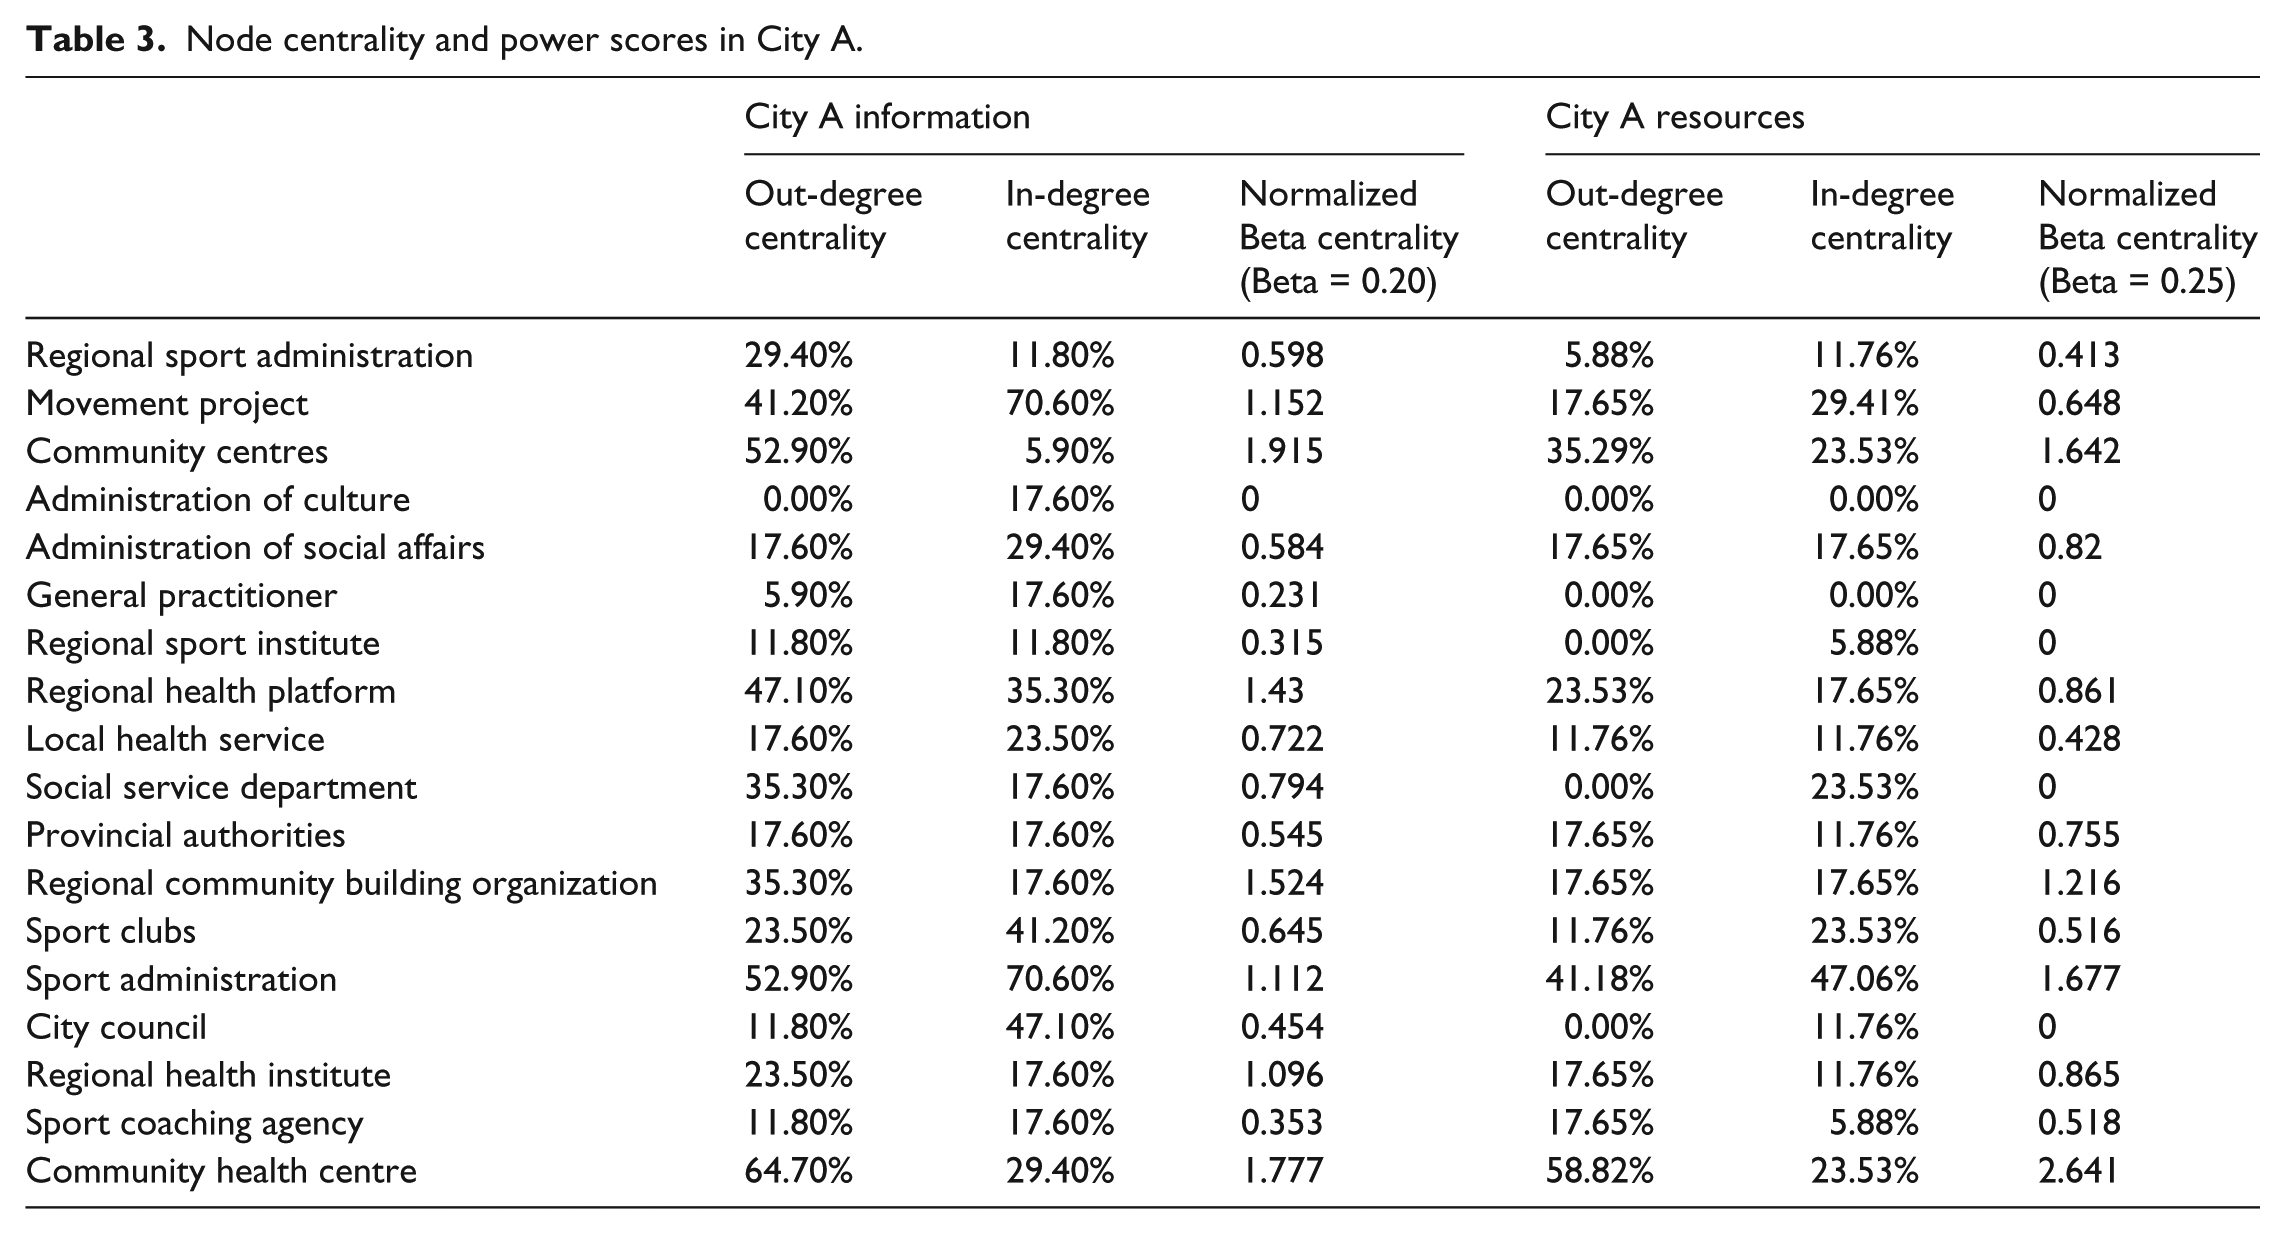
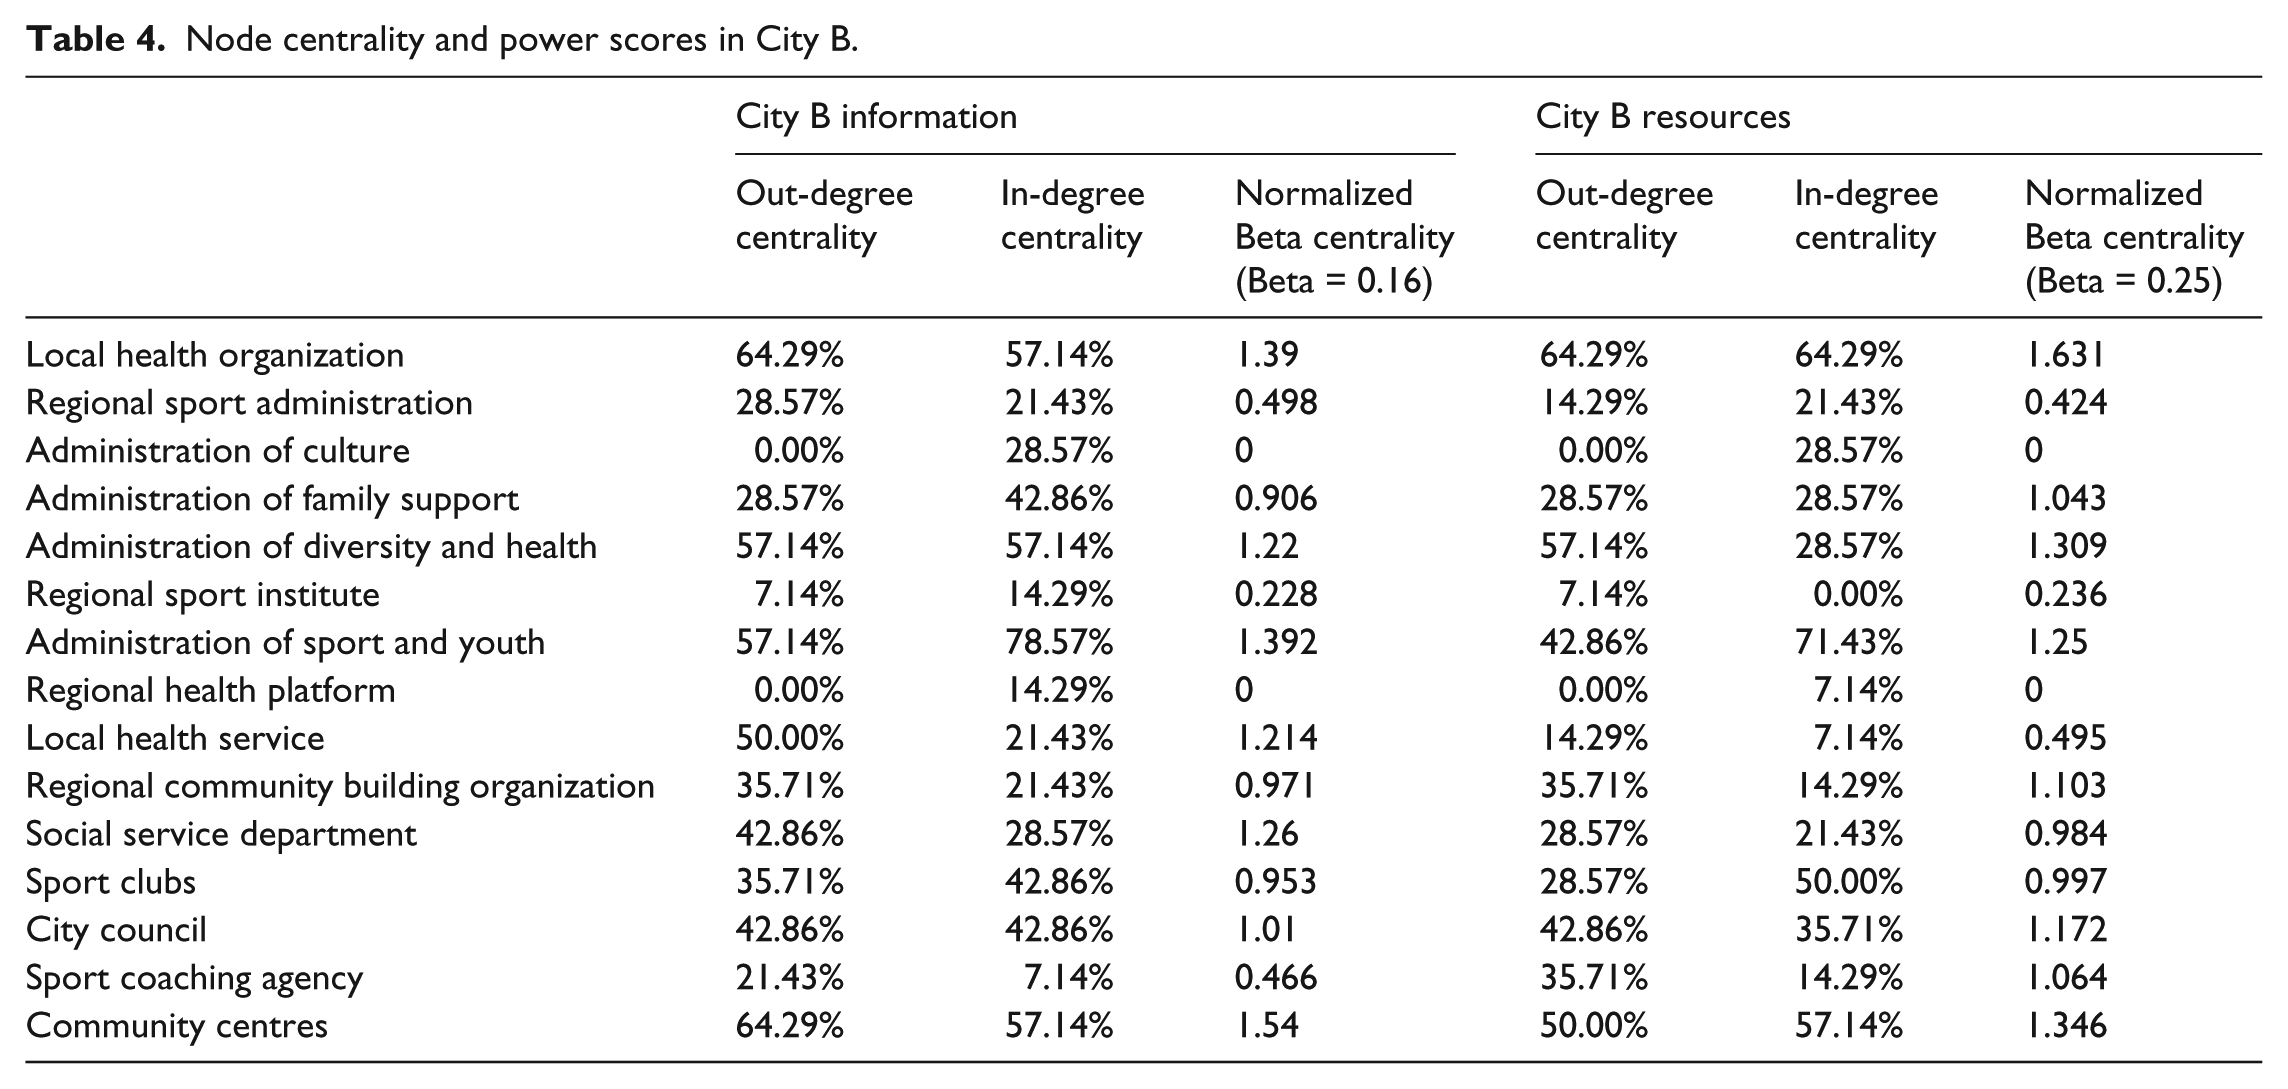
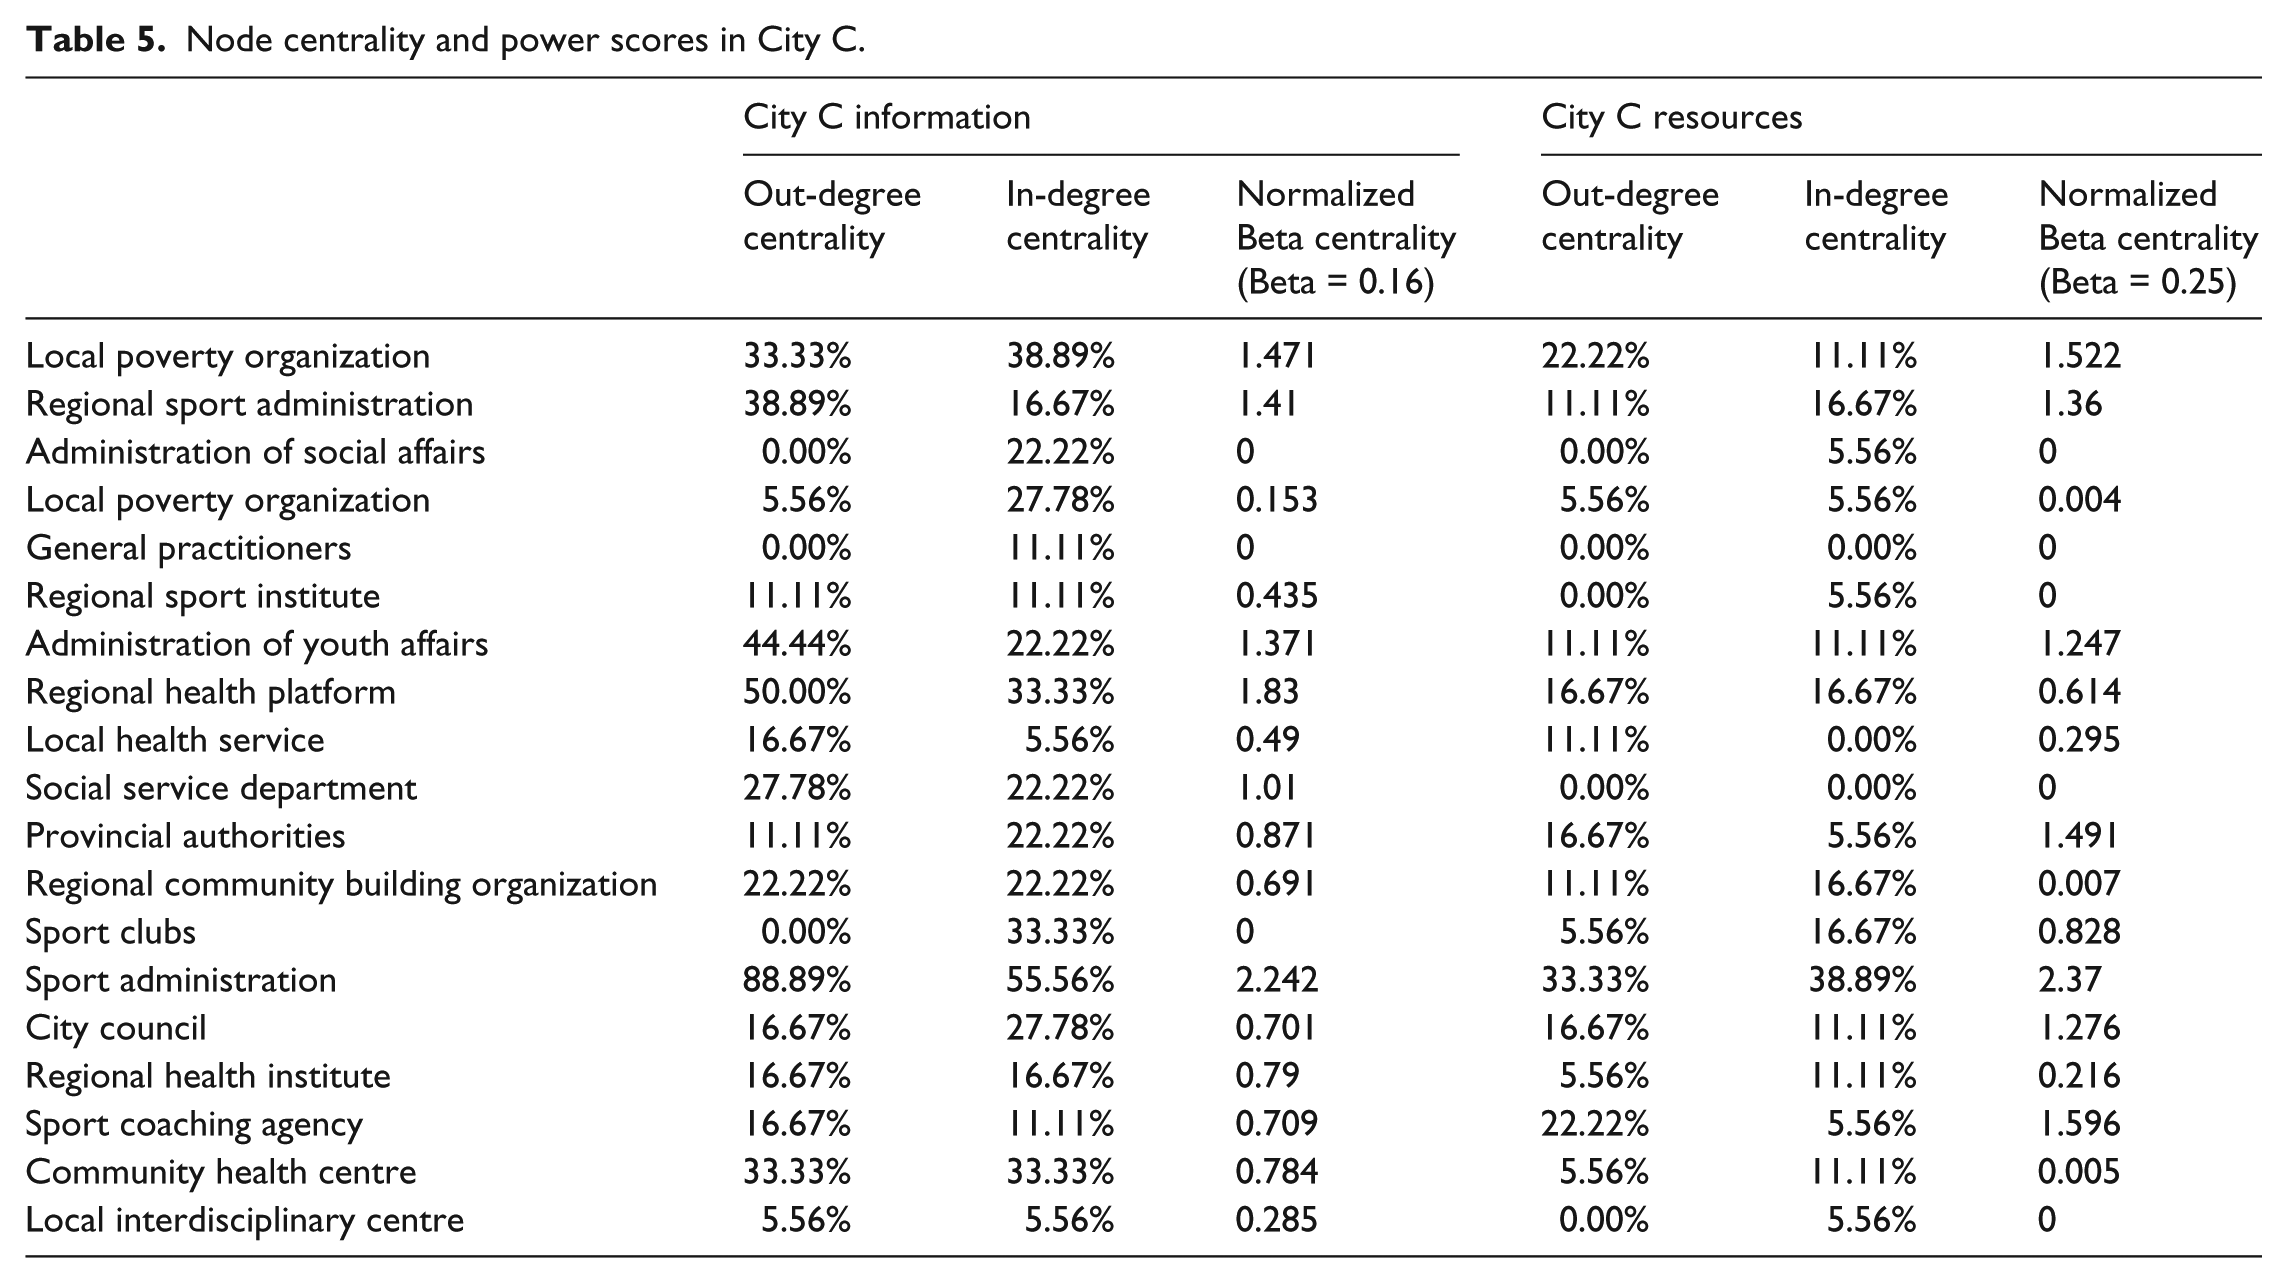
Tables 3 to 5 present the centrality scores per city and, thus, give an overview of the most influential (highest out-degree centrality) and most prominent (highest in-degree centrality) organizations in every network. Subsequently, Beta-centrality scores display the power for every organization in the network.
Node centrality and power scores in City A.
Node centrality and power scores in City B.
Node centrality and power scores in City C.
In City A, the local sport administration (LSA) is the organization with the highest in-degree centrality in both networks. Concerning out-degree centrality, the LSA scored lower than the community health organization, which was, according to its Beta value, also the most powerful organization. Power measures showed that the LSA was only ranked sixth and second in the power ranking of the information and resources networks, respectively.
In City B, the LSA had the highest in-degree centrality in both networks. Concerning out-degree centrality, the LSA scored lower. Social organizations tend to exchange more information and, especially, more resources with other organizations. In both networks, social organizations were most central and most powerful. The power score of the LSA ranked second in the information network and fourth in the resources network.
In City C, the LSA has the highest in-degree centrality, out-degree centrality and Beta value in both networks. Although resource sharing was lacking in general, the sport administration is the organization that is both sending and receiving most resources.
Discussion
Structure and coordination of a sport-for-all network for disadvantaged people
Previous research emphasized the importance of inter-sectorial collaboration to improve sport participation of disadvantaged people (Frisby and Millar, 2002; Houlihan, 2005; Marlier et al., 2014; Vail, 2007). Our data confirmed the inter-sectorial nature of the networks with organizations from the sport sector, health sector, social sector and government agencies. The fact that the social and health sector organizations were strongly involved in the sport-for-all network suggests that they emphasized the importance of sport participation to reach their main goals, namely health and social welfare. This implies that sport delivery, as such, is not the only objective, but that sport is also used as a vehicle to deal with societal issues that facilitate social inclusion and other policy goals (Skinner et al., 2008).
Although we expected a coordinating role for the LSA, the role of social and health organizations suggested a different network structure. Based on our centrality measures, we can say that in the control city (City C), the LSA adopted the role of coordinator and is the most powerful organization in the network. The LSA shared information with many other organizations, but resource sharing still needed further development. Given the high centrality of the LSA, it seemed that they acted as a broker in the network by establishing new, although weaker, ties. An organization that is able to lead other organizations to each other is crucial in network formation, and is defined in the literature as ‘a broker’ (Kadushin, 2002; Quatman and Chelladurai, 2008). Moreover, without a broker, some organizations would never be connected. The few ties, low density and strong role of the LSA as broker imply that the networks in City C were still in their infancy and needed to be developed further. Furthermore, as opposed to the other cities, City C did not have a program in place to promote sport participation among disadvantaged people. This could explain why organizations were less encouraged to establish a network to coordinate all activities that attempt to engage disadvantaged people in sport. The CSDP can act as a means to effectively engage other organizations in the sport-for-all objective.
In cities that implement sport-for-all policy through the CSDP (A and B), the sport administrator did not adopt a role as a broker or coordinator. The low out-degree centralization scores of the networks implied a shared coordination with one or more other organization in the network. Previous studies on sport delivery networks also indicated a rather low centralization score (< 40%), which is explained by the member organizations’ desire for control over decision-making, implying that organizations do not trust other organizations to coordinate the network activities (MacLean et al., 2011). In City A, we noticed that the LSA shared information with many organizations but organizations did not disperse the information through the network. It thus seemed that the LSA was connected with the wrong (sic) organizations in the information network (Hanneman and Riddle, 2005). An opportunity to share knowledge and expertise was missed. In City B, the most central and powerful role in the network was adopted by social organizations. The LSA shared a lot of information, but in the resources network, they were in a weaker position. These results reflect the findings of Cousens et al. (2012), who show that more often than not, youth or health organizations, rather than sport organizations, have the highest centrality score and, thus, take on the coordinating role in the network (Cousens et al., 2012).
Network density is a measure that reflects the network’s type (Keast et al., 2007). Our network measures showed that although density in the six studied networks was rather low, the density of the information networks was higher, compared to the resources network. This confirmed the literature view that in sport delivery networks the density of networks is rather low, which results in a fragmented network and sport organizations that often work autonomously or in only dyadic relationships (Cousens et al., 2012; MacLean et al., 2011). The need to control decision-making, the desire to remain autonomous, the lack of specialized managers, the lack of initiative to establish new relationships and rivalry between the organizations in the network are mentioned as reasons for low density (Cousens et al., 2012; MacLean et al., 2011; Vail, 2007). Information is, however, shared easier and needs a less intense engagement of different organizations. Especially in the digital age, sharing information does not require a lot of effort (Cousens et al., 2012). Based on the 3Cs typology, we classified the information networks under ‘cooperation’. Cooperation is typified as short term and informal. The organizations in the network do not work towards a system change but voluntarily try to solve joint problems and, thus, share necessary information (Keast et al., 2007).
The resources networks were characterized by fewer ties (lower density), but the sharing of resources implies that ties between the organizations are stronger with more personal contact. Moreover, in order to share resources, such as staff or money, in the context of networks, a minimum of trust between the organizations needs to be present (Willem and Lucidarme, 2014). Cousens and Barnes (2009) addressed the notion that many strong ties in a small, dense network imply a high degree of trust and commitment of all organizations, but can be detrimental for new initiatives and alternative actions. However, a small group of organizations in charge might also create pressure for conformity, which diminishes the chance of innovation and, thus, provides only conservative, often inadequate, sport delivery (Cousens and Barnes, 2009). Many weak ties in a sport delivery network might then initiate new information sharing, indicate ties that should be strengthened and contribute to the development of new sport opportunities (Cousens et al., 2012). We classified the resources networks under ‘coordination’, in which partners align to leverage each other’s expertise or resources and work towards a specified joint objective (Keast et al., 2007).
Our networks, thus, can be mainly classified as coordination or cooperation, with a shared coordination or the LSA as a broker in developing networks. In what follows, we compare the network structures with the network outcomes (i.e. organized activities) to explore the most suitable network typology to engage disadvantaged people in sport.
Several authors describe the different roles sport might adopt in society (Coalter, 2010; Skinner et al., 2008). On the one hand, we had ‘pure’ sport activities, in which increasing sport participation was the main objective, and local sport clubs could benefit from more members, such as through sport lessons or sport camps, and providing sport equipment in communities to facilitate transfer of disadvantaged target groups to the local sport clubs (in City A). On the other hand, sport was used as a vehicle to include certain target groups in society, such as the activities in cities B and C that focused on improving health or increasing people’s social capital. In the latter approach, the emphasis is on the pursuit of social objectives, while increasing membership in sport clubs is only marginally important. Considering the fact that we are studying the networks from a sport-for-all perspective or the objective to increase the number of disadvantaged people practising sport, a discussion on which network structure is most suitable should be viewed in the light of increasing sport participation.
Although the important role of a broker is stressed in the literature (Kadushin, 2002), our study suggested that shared coordination does not necessarily harm the network’s objectives. Moreover, in City A, which uses the CSDP to implement their sport-for-all policy, the network was well coordinated, plenty of sport initiatives were organized and transfer to sport clubs was facilitated to engage the minority groups in the local sport offer. By means of sport vouchers or discount club membership, the organizations in the network attempted to facilitate transfer of participants in the activities to local sport clubs. However, centralization and centrality scores implied a shared coordination. Moreover, and surprisingly, neither the LSA nor another sport organization, but rather social and health organizations were most central and powerful in the networks, which seems to contradict with the ‘pure’ sport objective. The type of activities, namely ‘pure’ sport activities, thus seems to contradict the main objectives of the most powerful organizations (i.e. health or social objectives). However, the literature in this field already showed that sport participation contributes to reaching a health or social objective, since sport club membership as such contributes to increased social capital and inclusion in society (Putnam, 1995; Seippel, 2006). Engaging disadvantaged people in local sport clubs is the best possible outcome of a sport-for-all policy implementation, since sport clubs are seen as the ‘prime setting’ for sport participation, given their benefits of good quality sport training and appropriate equipment and facilities (Scheerder et al., 2005; Vandermeerschen et al., 2015).
In City B, coordination was also shared, with social organizations in the most central role and lower centrality scores for the LSA. Existing activities showed a focus on social projects to include minority groups in the community, with the use of sport as an attractive vehicle to ‘bond’ the people to their projects. In this case, the LSA may have chosen to stay more in the background and settle with the social objectives or they may still need to work on key networking characteristics, such as trust and interdependence, to attain a stronger role in the network. If the LSA adopts a stronger role in the networks, they can contribute to guiding participants to ‘pure’ sport activities, which also have potential to promote social inclusion and, thus, contribute to the social objectives (Seippel, 2006).
Last, in City C, both the information and resources networks were still under development. The LSA acted as a broker and attempted to coordinate the partners. Information exchange was already ongoing; sharing resources and organizing joint initiatives can, therefore, occur in the (near) future or networks might become stuck in the developing phase, since they miss the coordinating structure of the CSDP.
Our findings suggest that a community program that overarches all activities, such as the CSDP in our case, contributed to more ties and a denser network. Furthermore, more (sport) activities were organized. To stress the ‘sport’ in the policy implementation, guide the participants towards sport clubs and increase sport participation in the communities, the LSA might want to adopt a strong role in the network; however, coordination can also be shared with other organizations that acknowledge sport participation as a means to contribute to social and health objectives. Nevertheless, to effectively increase lifelong sport participation and really work towards a system change in which minority groups have the same sport chances as others, a collaborative network is desirable, which implies stronger linkages, a high degree of trust, common objectives and members moving outside their traditional function to adopt a more external focus (Keast et al., 2007). A study by Marlier et al. (2015a) already showed that large amounts of trust, commitment, interdependence and complementary skills are needed in a network that aims to engage ‘hard-to-reach’ target groups in sports, such as disadvantaged people.
Conclusions
Although the literature suggests that a network with a key role for one organization as a broker will achieve better results (Kadushin, 2002), our findings indicate that a shared coordination in the network might help to successfully implement a sport-for-all policy. From a ‘pure’ sport viewpoint, with the increase of sport participation as the main objective, the LSA should adopt a strong role in the network, but should take on a coordinating role together with other organizations and other sectors. Ultimately, network members should aim to reach common objectives and work towards system change.
Our findings on the relevance of network structure and type of coordination of sport networks help to expand the literature in two ways. First of all, we demonstrate the importance of inter-sectorial collaboration to reach minority groups and the important role of the social and health organizations for sport-for-all networks. Secondly, we pinpoint different types of networks with different roles for the organizations and show how the roles of brokers (to initiate the network) and coordinators (to guide network activities) in different network types are linked with successful policy implementation. Furthermore, network managers might use our findings to establish efficient and effective networks with the most suitable partners and adopt the most suitable role in the network.
Although interesting conclusions could be drawn, we need to address some limitations of the study. First, boundary specification is a common issue in SNA. We chose to stop when new names dropped remarkably, but a chance of missing organizations remains. Further, we rely on the goodwill and knowledge of respondents. It is possible that some organizations are, on purpose or unwillingly, not mentioned and, thus, not included in the study. Third, an issue with network research is that networks continually change (Mandell and Keast, 2008). Our research provides a picture of networks at a given moment, but findings of the exact same study on a different time might differ and, therefore, multiple points of measurement over a period of time would allow us to see whether the network features are stable for a period of time. Furthermore, the evolutions in the resource and information networks, and in the coordinating roles of organizations, can only be discovered in a longitudinal study. However, through the SNA technique, we obtained data from the different organizations in the network and are, therefore, not limited to a single data source. Fourth, the network measures related to coordination and power (degree centrality and Beta centrality) provide us with a quantitative interpretation of which organization adopts a coordinating role or is more powerful, but it does not provide us with detailed information. Also, the measurement of tie strength by the frequency of contacts excludes qualitative aspects of tie strength such as emotional attachment. Qualitative methods are needed to examine complex features, such as power and power distribution, in more detail. Finally, in general the SNA caveats apply here. The method is quantitative in nature and has the ability to map networks, to quantify and measure relationships, to uncover the ties of an organization’s connections, to objectify relationships, to provide measures to compare networks and to discover which organizations are central in the resources and information flows. However, it does not allow rich in-depth insights into the qualitative nature of the relationships and the perceptions of these relationships by the different organizations in the networks.
Future research should further explore the different ties between the organizations in a more qualitative manner. Personal networks, from the individual’s point of view, might also provide interesting additional information. This concerns both the perspective of certain employees of the organization and the perspective of the targeted inhabitants. It could be worthwhile to study how they find their way in the sport-for-all network. Next, a viewpoint from the non-collaborating sport organizations might inform us about the reasons why some organizations are still reluctant to collaborate. Finally, a qualitative study might provide more detailed information about the quantitative measures presented in this study. Network features such as power, trust and tie strength can be studied in a more detailed manner with qualitative data.
Footnotes
Funding
The authors received no financial support for the research, authorship, and/or publication of this article.