
Abstract
Existing literature has extensively examined the determinants of firms’ research and development (R&D) investment and the effects of financialisation on physical capital formation. By contrast, evidence on how financialisation affects R&D investment is scarce, concentrated in a few country case studies, and mixed in its findings. We contribute to this literature by presenting cross-national evidence that dividend payouts are negatively correlated with firm-level R&D investment, using a large sample of 6,787 publicly listed non-financial firms from 72 countries over 2010–2018. This pattern is consistent with the argument that shareholder-value-oriented corporate governance reduces R&D investment. In addition, our comparative capitalism analysis shows that the trade-off is strongest in liberal market economies, average in emerging economies, weaker in mixed market economies, and essentially absent in coordinated market economies. These findings suggest the need for corporate governance and financial regimes that do not systematically favour high dividend payouts over long-term R&D investment.
Keywords
Introduction
It is widely acknowledged that innovation and technological progress are crucial for economic growth (Kaldor, 1961; Pasinetti, 1993; Romer, 1990; Schumpeter, 1934). Alongside other factors such as human and physical capital formation and internationalisation, research and development (R&D) has been identified as a critical driver of innovation and technological progress (Audretsch and Belitski, 2020). However, countries are prone to underinvest in R&D (Jones and Williams, 1998), which makes understanding the factors influencing R&D investment a matter of academic and policy concern.
The existing literature has demonstrated that external financing constraints are a major obstacle to firm-level R&D investment. Given the intangible nature of R&D, uncertainty about its outcomes, and limited disclosure practices, information asymmetries between firms and external finance providers are prevalent. As a result, R&D investment is primarily financed through internal funds (Hall, 1992; Harhoff, 1998). Moreover, it is well established that shareholders attempt to reduce agency costs by pressuring managers to distribute dividends (Easterbrook, 1984; Jensen, 1986). Modern executive pay structures and the threat of hostile takeovers further align management’s interests with those of shareholders (Carberry and Zajac, 2021; Crotty, 1990; Lazonick & O’Sullivan, 2000). This shareholder orientation can lead to internal financing constraints, as dividend payouts and investment expenditures compete for internal funds.
Such constraints are likely to have increased over the last four decades due to the predominance of shareholder value-oriented corporate governance and the growing size and scope of financial markets – a process often referred to as financialisation (Van der Zwan, 2014). As a result, managers are frequently guided by financial performance indicators and tend to use retained earnings for share buybacks and dividend payouts rather than for investment activities (Hein, 2012; Lazonick & O’Sullivan, 2000; Stockhammer, 2004). Theoretical arguments in this regard have been confirmed by many empirical studies showing that financialisation in general, and dividend payouts in particular, have negatively affected physical capital accumulation (see Davis, 2017; Tori and Onaran, 2018, 2020, 2022). Yet, some recent studies have argued that the effect of shareholder value orientation on the accumulation of cash holdings and financial assets has been limited (Rabinovich, 2019; Rabinovich and Pérez Artica, 2023; Reddy, 2025).
Compared with physical investment, empirical studies on the effects of financialisation on R&D are scarce. The few existing contributions mainly provide descriptive evidence for the United States, with some suggesting that R&D has been negatively affected (Lazonick, 2007; Shaikh and Randhawa, 2022; Tulum and Lazonick, 2019) and others pointing to the opposite (Liagouras, 2023). A notable exception is Seo et al. (2011), whose regression analysis indicates that dividend payouts lower R&D investment in Korean firms. By contrast, Hahn (2019), based on interviews with a small representative sample of innovating German firms, finds no evidence that shareholder pressure reduces R&D investment. Overall, the evidence remains inconclusive and limited in scope, with most studies restricted to single-country contexts.
The novel contribution of this paper is to be the first to present empirical evidence from a large international sample on whether dividend payouts negatively correlate with firm-level R&D investment. Our analysis covers 6,787 publicly listed non-financial firms across 72 countries over the period 2010–2018. This broader perspective is crucial, given the global diffusion of shareholder value practices (Bortz and Kaltenbrunner, 2017; Karwowski and Stockhammer, 2017), and allows us to assess whether the financialisation R&D investment trade-off that has been identified in case studies is observable on a global scale.
The rest of this paper is structured as follows. It first develops the theoretical background on financialisation, corporate governance, and the R&D–dividend nexus. It then reviews the existing empirical literature. The paper next outlines the research design and presents the data, before discussing the regression results. The final part concludes.
Financialisation, corporate governance, and the R&D–dividend nexus
Dhrymes and Kurtz (1967) were among the first to formalise the insight that dividend payouts are relevant for investment. Their theoretical framework shows that ‘dividend disbursals and investment outlays represent competing demands on the resources available to the firm; thus … investment activities of the firm will be affected by its dividend activities; postponement or curtailment of investment could conceivably result because of the inability of the firm to carry out a given investment program, “optimally” determined by some “rational” criteria, and at the same time continue to make “satisfactory” dividend payments’ (ibid., 435).
There exists no consensus in the theoretical literature regarding whether dividend payouts affect investment though. A seminal argument against the importance of dividends was made by the Modigliani–Miller irrelevance theorems (1958, 1961), which state that investment is the sole determinant of firm value and dividend payouts are irrelevant when capital markets are efficient and no information asymmetries exist. The assumptions of this theorem are highly questionable, however, since a large body of literature has shown that market imperfections, such as asymmetric information, are common. In such cases, especially for financially constrained firms access to external funds is restricted, and external and internal finance are no longer perfect substitutes (Fazzari et al., 1988; Hubbard, 1998). Accordingly, the pecking-order model predicts that the preferred financing option for investment is internal finance, the second-best option is debt finance, and the last option is equity finance (Myers, 1984).
Moreover, empirical evidence shows that dividend payouts tend to be sticky (Lintner, 1956). One reason for this stickiness is that managers use historical payout ratios and future earnings expectations as benchmarks and seek to avoid dividend changes that might trigger strong reactions from shareholders and financial markets (Ha et al., 2017). This mechanism is closely related to the argument that many firms employ a shareholder-oriented form of corporate governance that disciplines managers and uses performance-based executive compensation to avoid strategies that might be perceived as insufficiently shareholder-oriented (Easterbrook, 1984; Jensen, 1986).
In line with this agency-based view of corporate governance, a large strand of the financialisation literature argues that shareholder-value orientation and capital market pressures incentivise managers to use free cash flow for dividend payouts and share buybacks rather than for long-term investment (Van der Zwan, 2014). However, this literature goes beyond a simple agency-based view and embeds these mechanisms in a broader structural analysis of how the growing power of financial markets and investors builds different layers of pressure and shapes corporate strategies. The financialisation process is generally seen to have started in Anglo-Saxon countries in the 1970s, where a shareholder revolution, deregulation, the development of markets for corporate control, and the rise of institutional investors increased the influence of financial actors over corporate decision-making, and to have intensified and spread globally over time (Bortz and Kaltenbrunner, 2017; Karwowski and Stockhammer, 2017).
The strengthening of the alignment of managerial incentives with shareholder interests and the increasing importance of short-term performance benchmarks for financial markets has reinforced the use of earnings-per-share targets and total shareholder return metrics in corporate decision-making (Lazonick & O’Sullivan, 2000; Van der Zwan, 2014). At the firm level, this process of corporate financialisation is commonly operationalised either through the increasing weight of financial assets and income on the balance sheet or through rising financial payments, such as dividend payouts, relative to internal funds. Real investment, by contrast, is argued to have become a secondary concern in corporate financial strategies, even in the presence of profitable investment opportunities (Hein, 2012; Stockhammer, 2004).
Some recent studies have put into question that financialisation has led to the accumulation of financial investment. Rabinovich (2019) argues that much of the reported rise in financial assets among non-financial companies reflects goodwill, other intangibles, and FDI, while for most firms financial income remains a relatively small share of total income. Furthermore, his analysis suggests that real investment has not been displaced by financial investments. Reddy (2025) deepens this critique by arguing that the financial accumulation thesis rests on problematic measures that overstate the importance of financial income. Therefore, this paper focuses specifically on dividend payouts as a key channel through which financialisation may crowd out investment, since the internal funds used for dividends could otherwise be retained and reinvested in the business instead of being distributed to shareholders.
Typically, the discussion of the negative effect of shareholder-value orientation on investment focusses on physical capital formation. However, the similarities in the investment decision processes for R&D and physical capital projects (Hall and Hayashi, 1989) suggest that R&D investment can be expected to be equally affected by dividend payouts. In fact, R&D investment might be even more significantly impacted, considering it faces particularly high external financing constraints. These constraints arise because R&D projects tend to have uncertain outcomes and returns and produce an intangible capital stock that is often embedded in workers’ knowledge (who can leave the firm). Hence, R&D investment provides few collateral assets. Moreover, lenders have difficulties assessing firms’ repayment capabilities because information asymmetry in R&D projects is often high, partly because firms are unwilling to reveal many details to outsiders since confidentiality is vital for innovation (Hall, 1992; Harhoff, 1998).
Accordingly, Lazonick (2007, 2010) argues that the shift in the US corporate governance regime from a ‘retain-and-reinvest’ to a ‘downsize-and-distribute’ approach came at the expense of firm-level investment in R&D and innovation capabilities. Tulum and Lazonick (2019) and Shaikh and Randhawa (2022) advance similar arguments for the US pharmaceutical industry, showing that a strong focus on stock-price performance and dividend yields has been associated with a substantial erosion of innovative capacity. Rather than financing internally organised ground-breaking innovation, major corporations increasingly rely on acquiring already developed products and technologies to meet shareholder expectations. In this view, financialisation shifts corporate strategy from building productive capabilities towards extracting and distributing financial rents, with adverse consequences for long-term innovative performance.
Taken together, theories related to the funds-flow identity, the presence of external financing constraints, and shareholder-value-driven pressures suggest that dividend payouts and R&D investment represent competing claims on firms’ internal funds. Accordingly, we propose the following hypothesis:
There exists a trade-off between dividend payouts and firm-level R&D investment on a global scale.
The existence and strength of such a trade-off are likely to differ across countries. According to the comparative capitalism literature, countries differ in terms of social relations, institutional configurations and business systems, and these differences shape the behaviour of firms and foster different economic activities (Jackson and Deeg, 2019). For advanced economies, the varieties of capitalism (VoC) framework prominently distinguishes between liberal market economies (LME) and coordinated market economies (CME), which vary their corporate governance and financial systems. Firms operating in LME tend to prioritise shareholder value and dividend payouts more than those operating in CME, which tend to rely more on long-term management decisions and relationship-based bank lending (Aguilera and Jackson, 2003; Hall and Soskice, 2001). Accordingly, Lazonick (2010) contends that the shareholder-value orientation in the US liberal market economy has generated inequitable and unstable economic performance and has undermined the country’s innovative capability, whereas the Japanese CME-aligned business model has incentivised managers to undertake profitable long-term innovative investments.
Subsequent literature has challenged some of VoC’s arguments (e.g. Hay, 2020; Kinderman, 2017; Wood et al., 2014) and identified additional market economy types across different regions of the world (e.g. Fainshmidt et al., 2016; Schneider, 2013; Witt and Redding, 2013). In particular, emerging market economies often combine elements of state-led development, family ownership, and foreign financial integration in complex ways that do not fit neatly into the LME/CME distinction. Nevertheless, there is broad agreement that firms in LME operate in institutional environments in which shareholder value norms and capital market pressures are particularly strong, and where dividend payouts play a central role in corporate financial strategies.
Building on this literature, we expect the dividend–R&D trade-off to be shaped by the institutional configuration of the market economy in which firms operate. Specifically, we expect dividend payouts to exert the strongest negative effect on R&D investment in LME, where shareholder value orientation and arm’s-length finance are most pronounced, and a weaker or absent effect in CME, where coordinated forms of finance and corporate governance give more weight to long-term investment relationships. Accordingly, we formulate a second hypothesis:
The size of the trade-off between dividend payouts and firm-level R&D investment differs depending on the type of market economy in which a firm operates and is most pronounced in LME.
Existing empirical evidence
Despite its importance for technological progress and economic growth, few empirical studies have attempted to verify whether dividend payouts negatively affect R&D investment. Instead, existing literature tends to focus on the effects of cash flow, ownership structure, managerial compensation schemes, and the interplay of various corporate governance practices on innovation.
With respect to ownership, the evidence is mixed: some studies find that family ownership lowers R&D investment (e.g. Munari et al., 2010), while others report that family-controlled firms have higher R&D intensity than those controlled by dispersed investors (e.g. Sakawa and Watanabe, 2021; Schmid et al., 2014). For ownership concentration, Tribó et al. (2007) show that R&D is higher when ownership is more concentrated, whereas Minetti et al. (2015) find that ownership concentration can negatively affect innovation. Regarding state-owned enterprises, Clò et al. (2020) show that privately owned firms innovate more than state-owned ones when institutional quality is low, but the opposite is true in countries with high institutional quality.
Corporate governance practices and board characteristics have also been shown to influence R&D investment. Ahmad et al. (2023), for instance, find that board reforms leading to independent audit committees and boards positively impact R&D intensity. Asad et al. (2023) find that cognitive board diversity positively affects firm-level R&D investment, whereas demographic diversity is not significant. Research on managerial compensation suggests that CEOs reduce R&D investment when they have short-term concerns about the price of their stocks or options (Coles et al., 2006; Edmans et al., 2017), and Honoré et al. (2015) report that corporate governance practices designed to align managerial incentives with shareholder interests are negatively correlated with R&D intensity. Overall, this literature supports the view that shareholder-oriented governance arrangements can have adverse consequences for long-term, risky investment in innovation.
A related strand of research studies the role of cash flow and internal funds for R&D. Brown and Peterson (2011) and Brown et al. (2012) show that cash flow and cash holdings are important determinants of R&D investment, while Beladi et al. (2021) find that firms with high cash flow uncertainty tend to be more cautious and conservative in their R&D decisions, particularly when they face stronger financial constraints. This research does not directly address the effects of dividend payouts on R&D, but its results suggest that cash flow effects on R&D investment are more significant for firms that do not pay dividends (Brown and Peterson, 2011), and that firms with powerful CEOs and high cash flow volatility may pay high dividends to improve their reputation in capital markets, resulting in lower R&D intensity (Sheik, 2022).
The direct empirical evidence on the effects of dividend payouts on R&D investment is limited to a small number of countries and sectors. For the United States, Lazonick (2007) presents data suggesting that, between the mid-1980s and mid-2000s, US firms distributed enormous amounts of funds to their shareholders – mainly via large-scale stock buybacks but also via dividend payouts – while R&D investment was muted. Tulum and Lazonick (2019) and Shaikh and Randhawa (2022) provide similar data, showing that over the last four decades in particular US pharmaceutical companies have distributed large parts of their profits to shareholders via stock buybacks and cash dividends, with negative consequences for drug innovation, drug prices, and the US innovation system more broadly.
This descriptive evidence from the financialisation literature is consistent with Bushee’s (1998) logit regression results, which indicate that between 1983 and 1994 CEOs in US firms behaved myopically by reducing R&D investment to meet the earnings expectations of short-term-oriented transient shareholders. More recently, however, Liagouras (2023) presents descriptive data suggesting that aggregate business-funded R&D in the United States has not been negatively affected by the rise of the short-term logic of financial markets, pointing to the need for more nuanced and disaggregated analyses of investment categories and highlighting the difficulty of measuring intangible assets.
Empirical evidence from other countries is equally limited and mixed. Seo et al. (2011) study the effect of shareholder value orientation on R&D investment in 470 publicly listed Korean non-financial firms from 1994 to 2009. Using a Generalized Method of Moments (GMM) estimator, they find that, from 2001 onwards, dividend payouts and stock buybacks reduced firm-level R&D investment substantially. In contrast, Hahn (2019), based on interviews with a small representative sample of innovating German firms, does not find evidence that shareholder pressure has systematically curtailed R&D investment. Jibril et al. (2025) examine the effects of shareholder value orientation on intangible investment in 94 Brazilian manufacturing firms between 2011 and 2016 using a difference GMM estimator. They do not focus specifically on R&D, but their findings suggest that financial asset holdings crowd out intangible investment and that dividend payments are associated with lower levels of intangible assets.
A further set of studies exploits changes in dividend taxation to analyse how payout incentives affect R&D. Thomas et al. (2003) examine the effects of dividend payouts and taxation on firm-level R&D spending in Canada, France, Germany, Japan, the United Kingdom, and the United States between 1993 and 1997. Their results suggest that dividend payouts reduce R&D investment and that this effect becomes stronger when countries offer dividend-encouraging imputation credits. Cleaveland (2013) presents similar results for Australia and New Zealand, showing that dividend-paying firms increased their payouts when tax incentives for dividends were introduced, and that this increase reduced R&D investment in both countries. Billings et al. (2018), in turn, study how the lowering of dividend taxes in the US Jobs and Growth Tax Relief Reconciliation Act affected firm-level R&D spending in the United States and find that lower dividend taxes induced higher dividend payouts, which led to a decline in R&D investment.
This overview shows that empirical studies on the effects of shareholder value orientation and dividend payouts on R&D and innovation are scarce, often limited to one or a few countries, and present mixed findings on the impact of dividend payouts on R&D investment. Moreover, most of the existing research focuses either on specific sectors or on advanced economies, and there is no large-scale international evidence on whether, and to what extent, dividend payouts affect firm-level R&D investment across different types of market economies. The remainder of the paper aims to fill this gap by providing an international firm-level analysis of the dividend–R&D trade-off that examines whether this trade-off varies across different institutional configurations of capitalism.
Research design
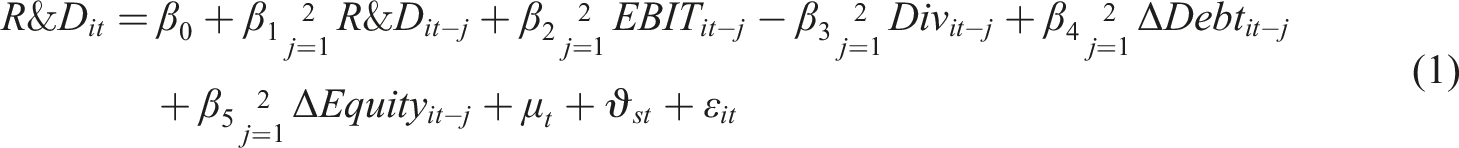
Investment is a positive function of retained earnings (i.e. profits minus dividends), debt finance, and equity finance (Stockhammer, 2004). Hence, we use the following baseline regression model to empirically verify the existence of a trade-off between dividend payouts and R&D investment:
R&D investment decisions may influence dividend payouts, as well as decisions on how much external finance to acquire. In addition, Auvray et al. (2021) argue that over the last two decades a lack of profitable investment opportunities meant that tangible and intangible capital formation by non-financial corporations was low, which in turn led to high dividend payouts. Hence, using
The use of a difference GMM estimator is common in the empirical literature that analyzes the effects of financialisation on investment (e.g. Asad et al., 2023; Tori and Onaran, 2018, 2020, 2022). Apart from addressing endogeneity, the GMM estimator is well suited to data structures such as ours: it is designed for dynamic panels with many firms and relatively few time periods, allows for persistence in R&D investment through the inclusion of a lagged dependent variable, and removes time-invariant firm-specific effects through first differencing (see Arellano and Bond, 1991; Kiviet, 2020). The latter implies that unobserved, time-constant differences in corporate governance and other firm characteristics are absorbed by the fixed effects, while time dummies and country–sector dummies capture common macroeconomic and sector-specific shocks. We prefer difference GMM as the baseline estimator over system GMM because the latter relies on additional moment conditions for the level equation, which impose stronger assumptions regarding the relationship between the fixed effects, the initial conditions, and the stochastic properties of the variables (Kiviet, 2020). Since the plausibility of these additional assumptions is not guaranteed in our setting, we adopt difference GMM as the baseline estimator and use system GMM as a robustness check.
Concerning the instrument set,
All data are obtained from the ORBIS database, which provides harmonised financial firm-level data on a global scale and has much broader coverage than similar databases (such as Compustat). ORBIS categorises firms according to the statistical classification of the European Community economic activities (NACE Rev. 2), which comprises 19 industries at the one-digit level and 88 divisions at the two-digit level. We only consider firms from five industries (45 divisions), though, because these constitute approximately 98% of the R&D expenditure of the whole ORBIS sample. Furthermore, to create a more balanced and homogenous dataset, we only include publicly listed firms that are medium to large and for which R&D investment data is available for at least three consecutive years. 1 In line with the European Commission (2020), we classify all firms whose annual balance does not exceed EUR 10 million as small. The justification for omitting small firms from the sample is that these are under-represented in ORBIS (see Kalemli-Ozcan et al., 2015).
Moreover, to avoid outlier bias, we exclude extreme outliers from the sample (i.e. eighteen firms that report variable-to-asset ratios above 100 or below −100). The resulting sample comprises 6,787 firms from 72 countries from 2010 to 2018. Most of these firms are located in developed countries (88.4%) and the manufacturing sector (77.5%). The second largest sector is information and communication (11.0%). In comparison, only relatively few of the sample firms are active in wholesale and retail (4.6%), professional, scientific & technical activities (4.4%), and mining and quarrying (2.5%) (see Table A1 in the Appendix for sample details).
It is also important to note that ORBIS reports our measure for R&D investment, firms’ R&D expenditure relative to total assets, according to the accounting standards applicable in each country. Under IFRS, for example, research expenditure must be expensed and only development costs that meet strict recognition criteria may be capitalised, while national GAAPs may differ in the extent to which development expenditure is capitalised and in disclosure thresholds for R&D. As a result, reported R&D expenditures are not fully comparable across countries and accounting regimes. In our empirical analysis, we mitigate these concerns by focussing on within-firm variation over time and by including country- and year-fixed effects, but we cannot eliminate all cross-country differences in reporting practices. Still, we think R&D intensity is the best available measure for our endeavour, given that alternative indicators, such as patent counts, are difficult to implement in a way that is both consistent and informative.
Descriptive statistics.
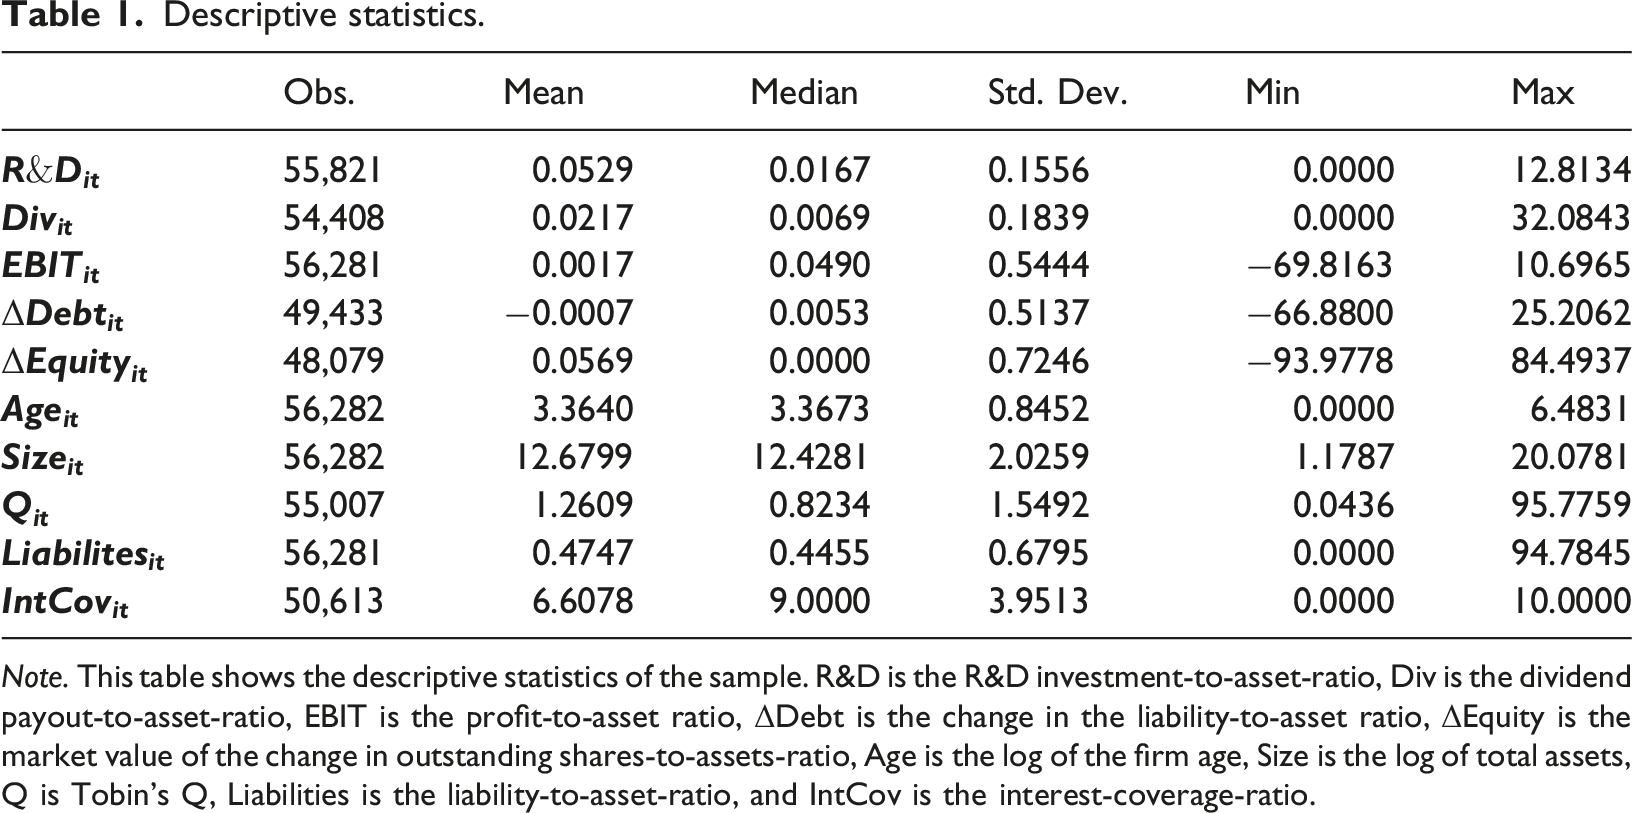
Note. This table shows the descriptive statistics of the sample. R&D is the R&D investment-to-asset-ratio, Div is the dividend payout-to-asset-ratio, EBIT is the profit-to-asset ratio, ΔDebt is the change in the liability-to-asset ratio, ΔEquity is the market value of the change in outstanding shares-to-assets-ratio, Age is the log of the firm age, Size is the log of total assets, Q is Tobin’s Q, Liabilities is the liability-to-asset-ratio, and IntCov is the interest-coverage-ratio.
Figure 1 plots the evolution of both variables, indexed to 2010, to facilitate comparison of their dynamics over time. The figure shows that R&D intensity exhibits a moderate upward trend over the sample period, particularly after 2014, while dividend payouts follow a markedly different pattern. Dividend payouts decline initially, increase temporarily around 2013–2014, and then fall back and stabilise below their initial level. Although the two series do not display a simple aggregate relationship over time, the temporary rise in dividend payouts coincides with a period of stagnation in R&D intensity, while the subsequent increase in R&D from 2015 onwards occurs when dividend payouts remain comparatively subdued. This descriptive pattern is consistent with a negative association between dividend payouts and R&D investment. However, it is not conclusive in itself, since it is based on unconditional annual averages that may mask substantial heterogeneity across firms and over time. Average R&D and dividend payouts (Index, 2010 = 100). Note. The figure plots annual sample means of R&D expenditure and dividend payouts, each measured as a percentage of total assets and indexed to 2010 = 100, for the firms included in the baseline regressions.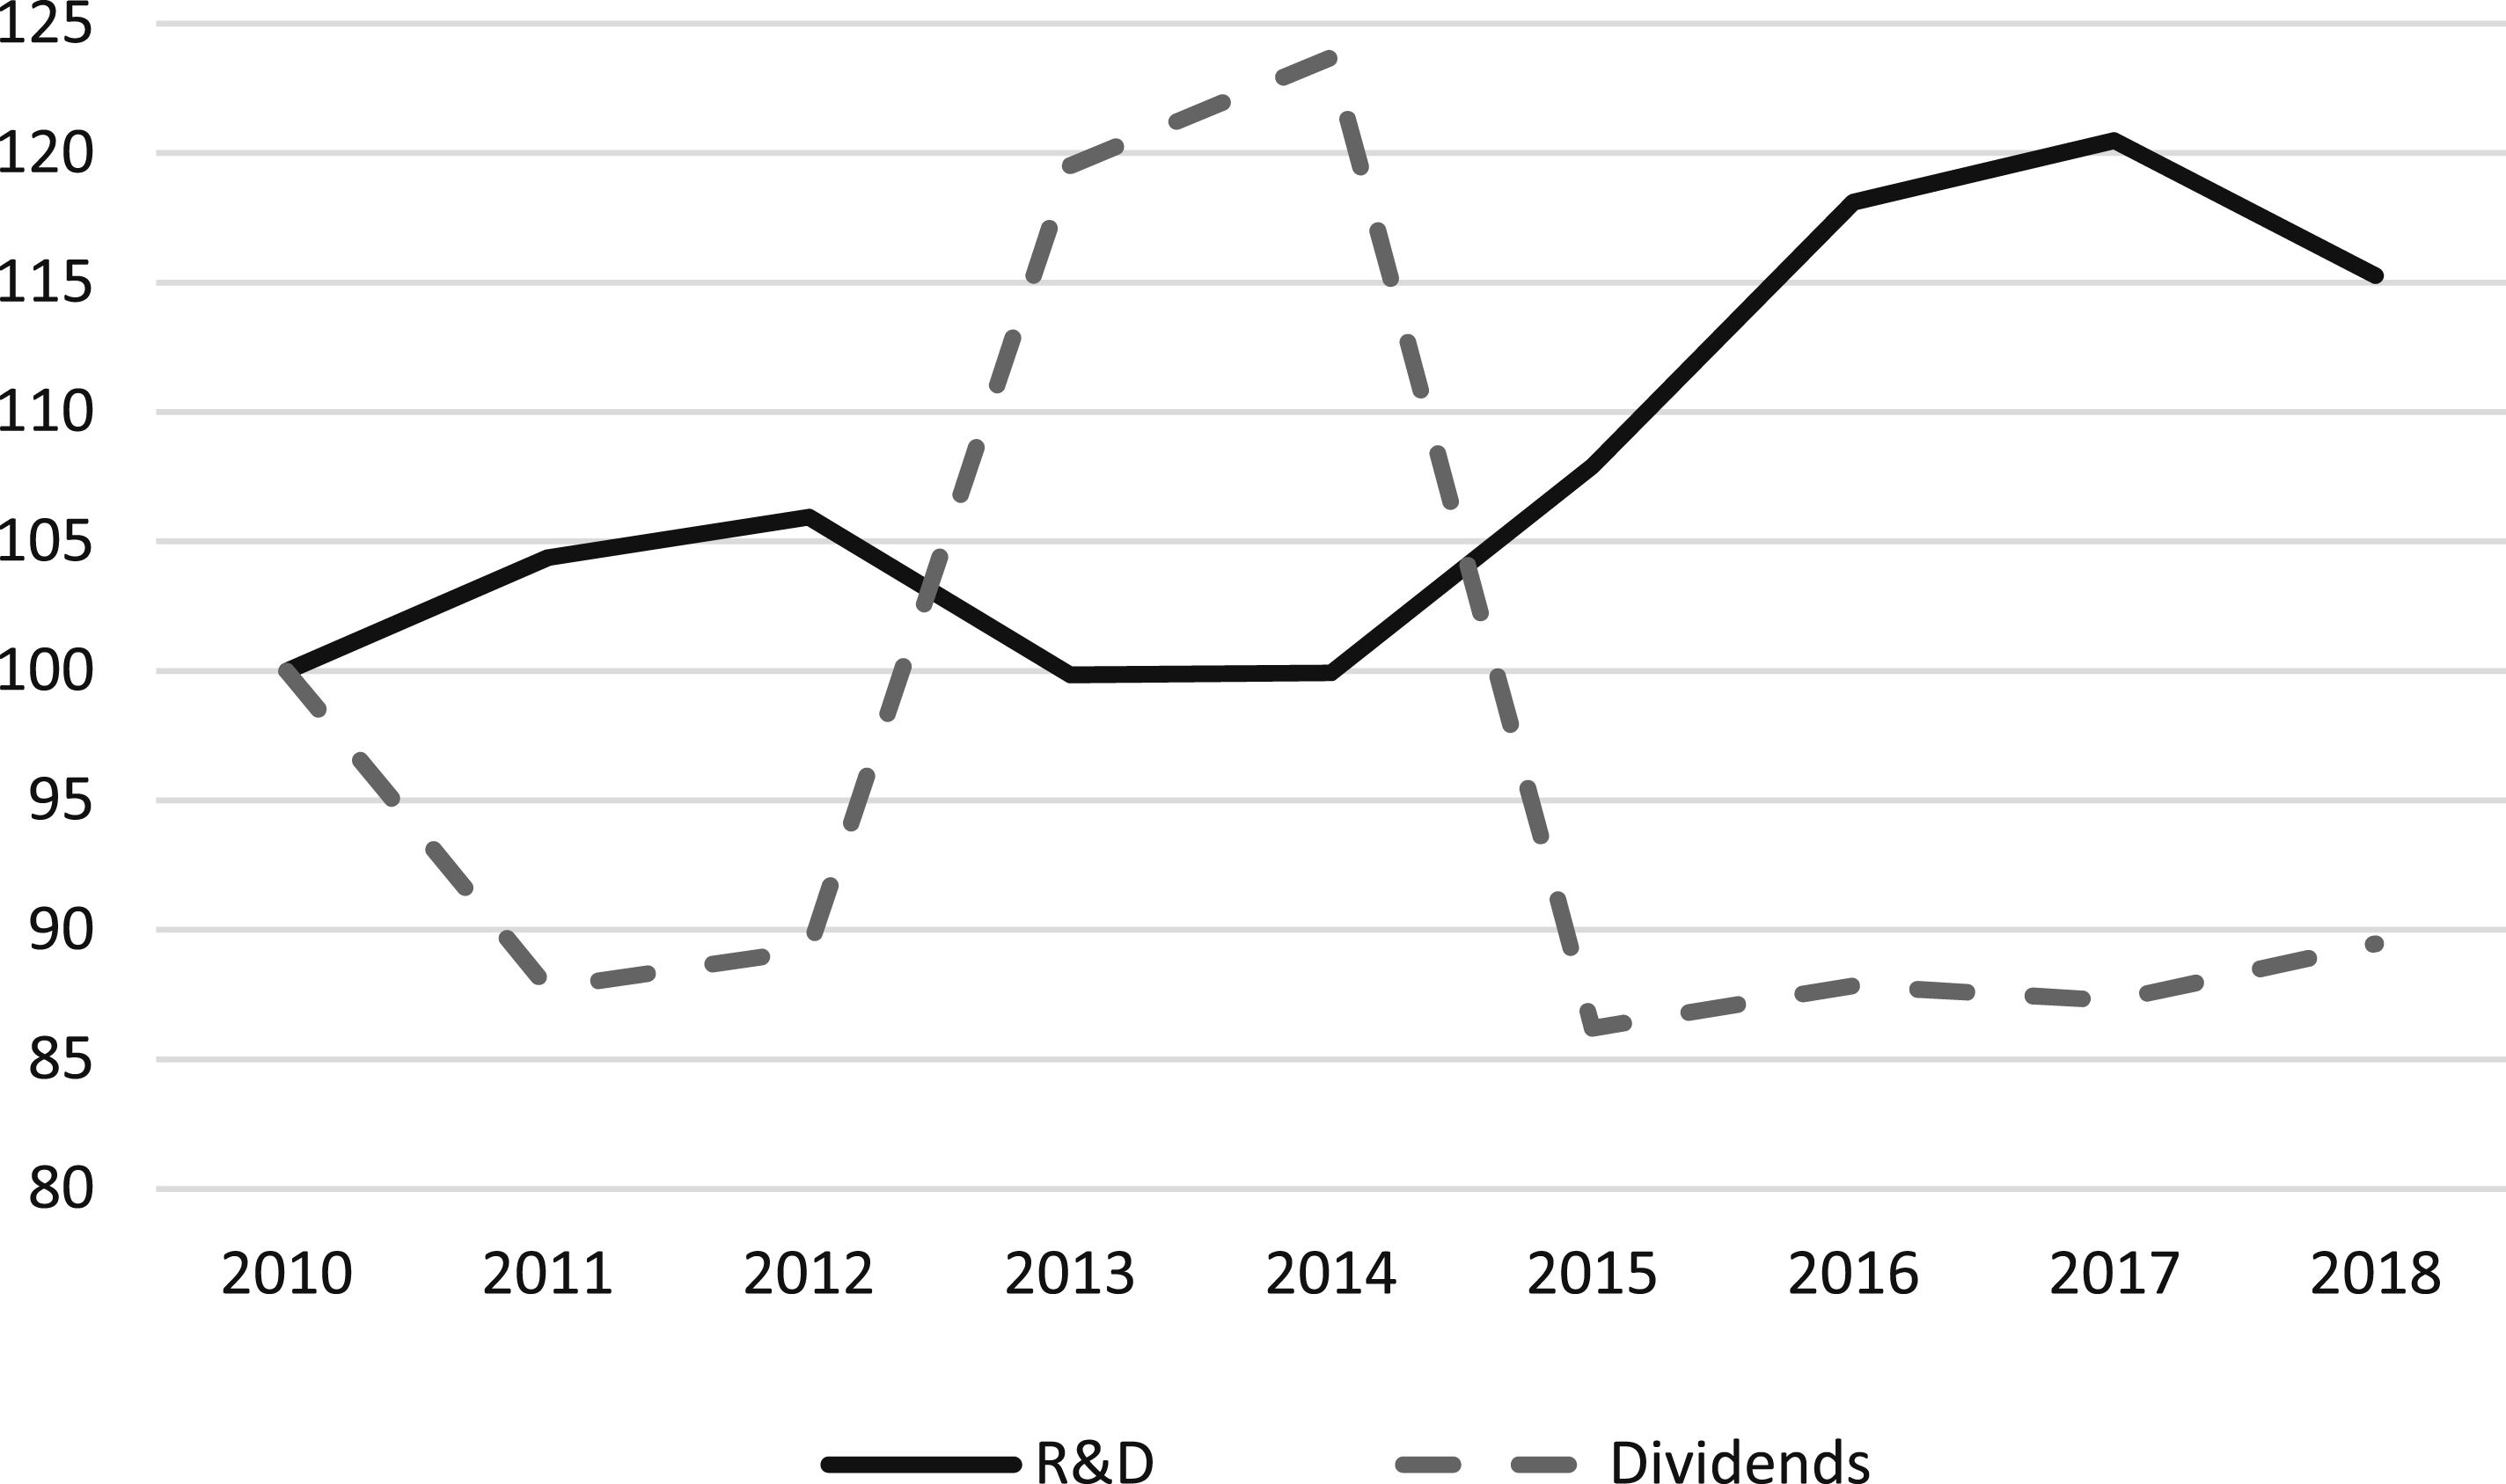
Regarding access to external financing, Table 1 shows that the mean change in the liability-to-asset ratio is nearly constant, while the mean ratio of the market value of the change in outstanding shares to total assets is 5.7%. The latter does not signify that most firm-year observations report a change in outstanding shares: only 36% of the observations issued new ones, while 9.6% bought back shares. On the other hand, the mean total liability-to-asset (47%) and interest coverage (6.6) ratios indicate that most sample firms are financially healthy and that interest obligations do not represent a significant constraint on available cash flow. Finally, the mean (1.3) and median (0.8) values of Tobin’s Q suggest that new investment would not be very profitable for most sample firms but that the opposite is true for some.
However, these aggregate patterns are based on unconditional annual sample averages and do not control for firm-level characteristics and therefore cannot be interpreted as evidence for any systematic relationship between R&D and dividend payouts. The firm-level trade-off between dividend payouts and R&D investment is analysed below using panel GMM estimations that exploit within-firm variation and control for sector and time effects.
Results
Baseline results
Baseline regression results.
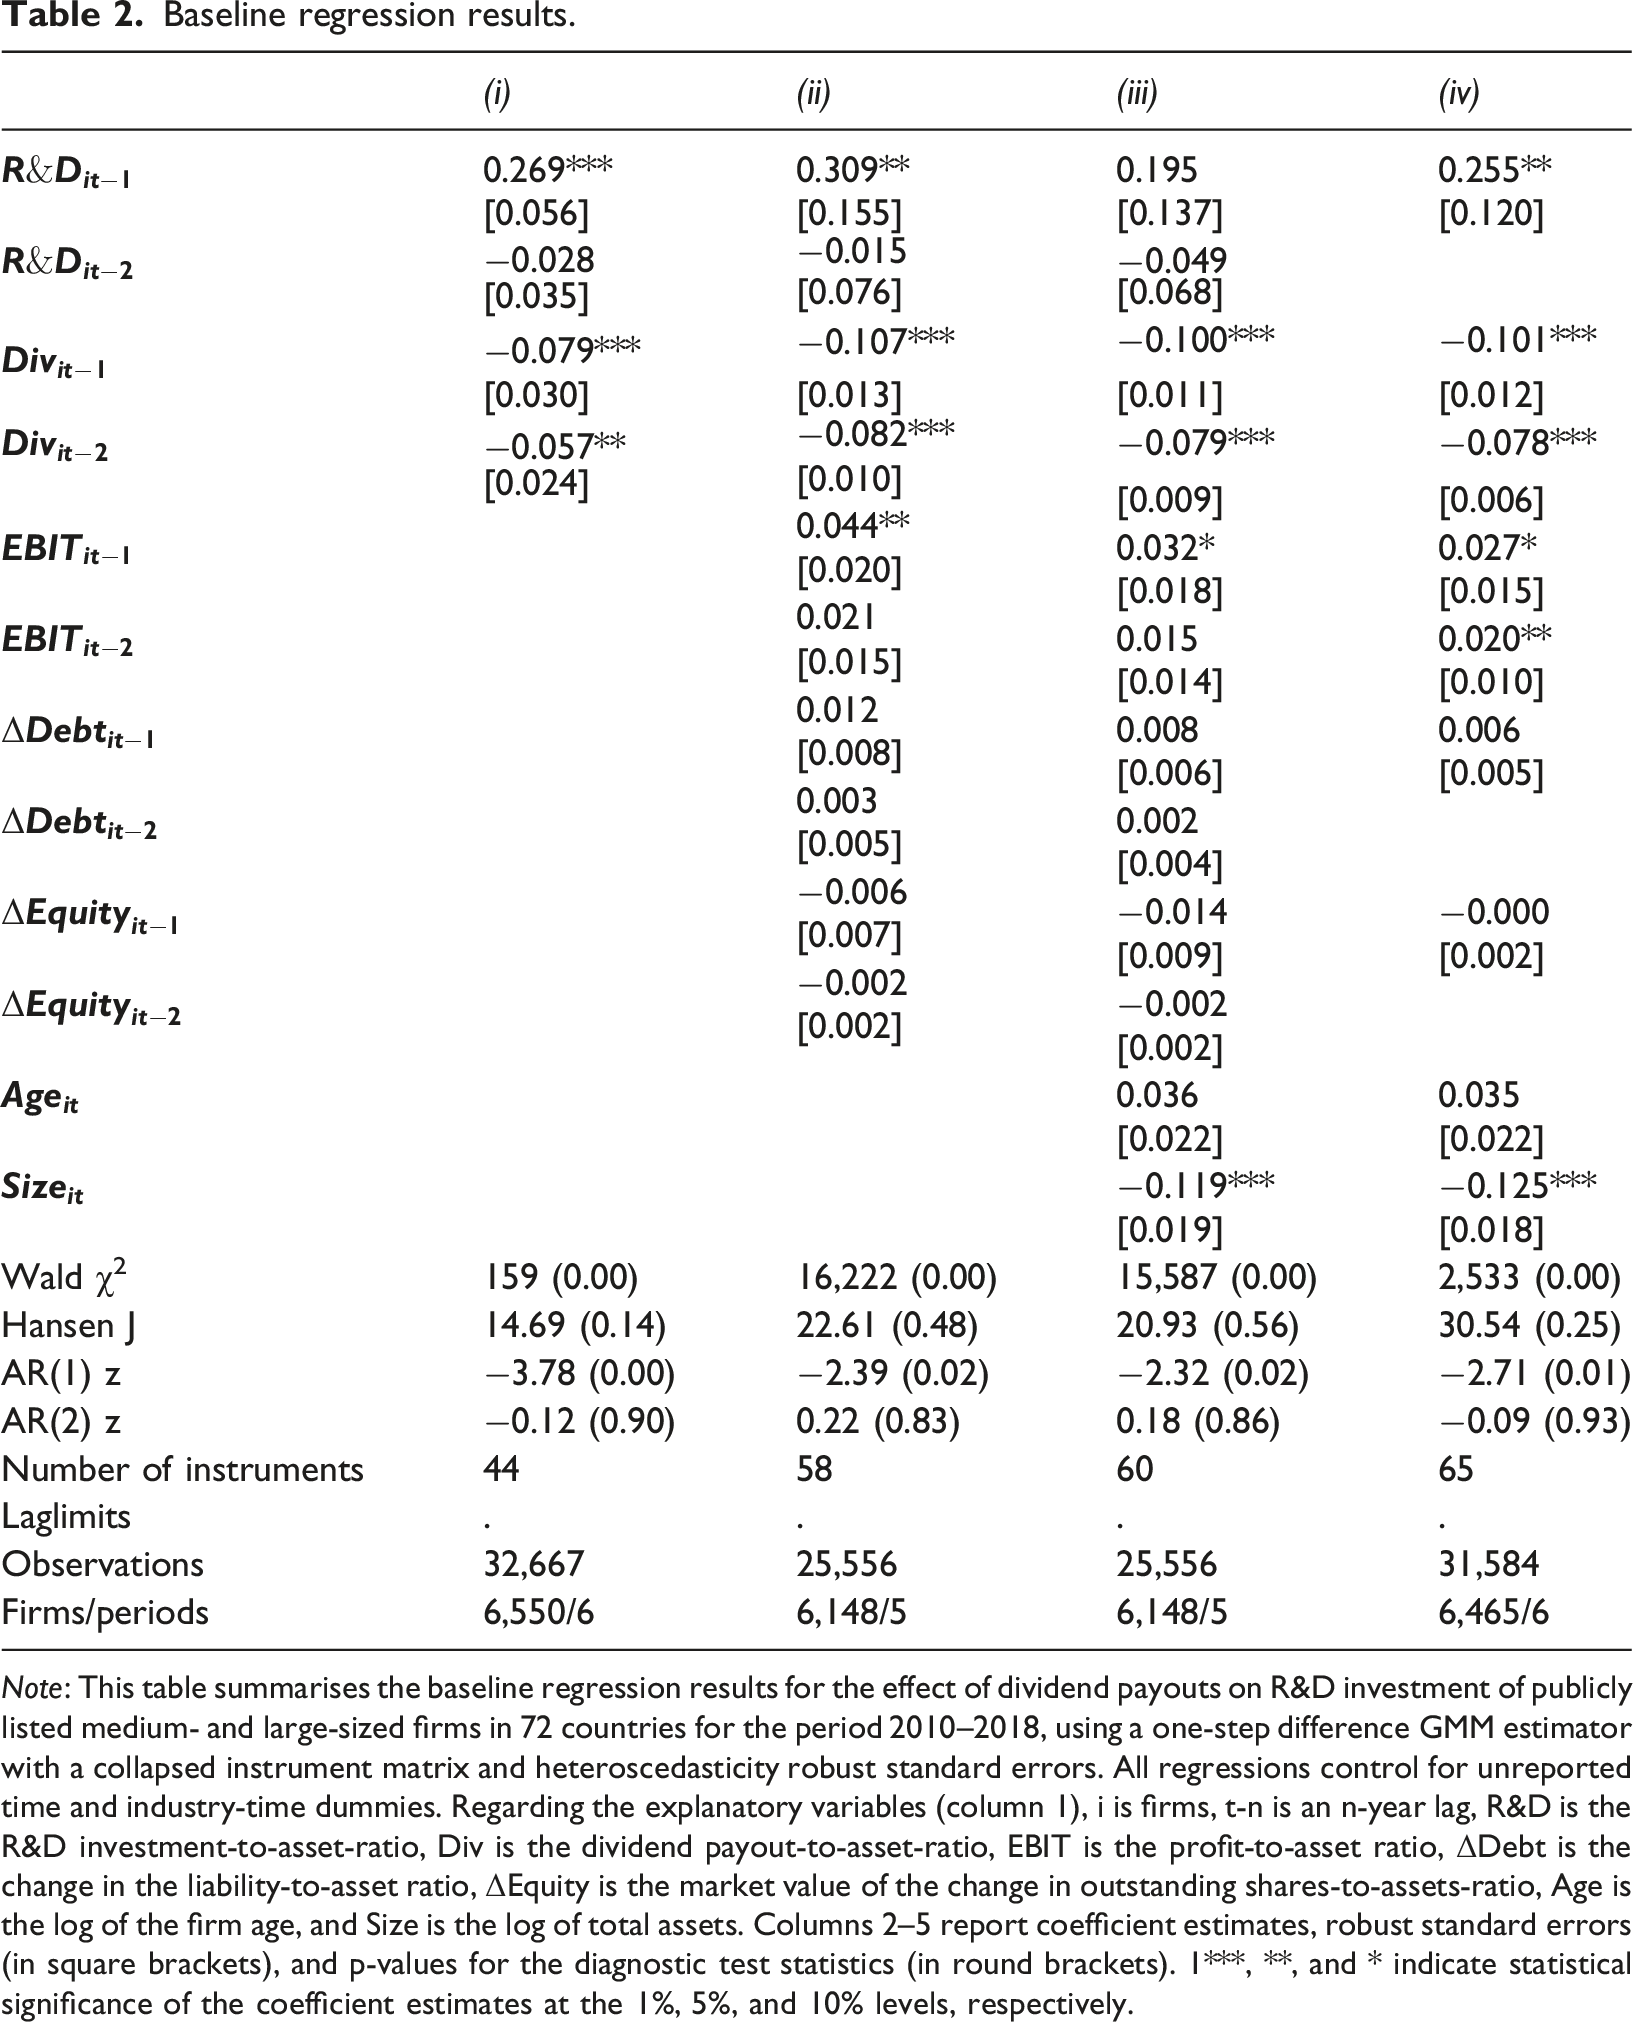
Note: This table summarises the baseline regression results for the effect of dividend payouts on R&D investment of publicly listed medium- and large-sized firms in 72 countries for the period 2010–2018, using a one-step difference GMM estimator with a collapsed instrument matrix and heteroscedasticity robust standard errors. All regressions control for unreported time and industry-time dummies. Regarding the explanatory variables (column 1), i is firms, t-n is an n-year lag, R&D is the R&D investment-to-asset-ratio, Div is the dividend payout-to-asset-ratio, EBIT is the profit-to-asset ratio, ΔDebt is the change in the liability-to-asset ratio, ΔEquity is the market value of the change in outstanding shares-to-assets-ratio, Age is the log of the firm age, and Size is the log of total assets. Columns 2–5 report coefficient estimates, robust standard errors (in square brackets), and p-values for the diagnostic test statistics (in round brackets). 1***, **, and * indicate statistical significance of the coefficient estimates at the 1%, 5%, and 10% levels, respectively.
In line with Hypothesis 1, all regressions indicate that higher dividend payouts significantly reduce firm-level R&D investment (with the highest p-value of the dividend variables being 0.018). The reduced model (i) only controls for time and industry–time fixed effects (and implicitly also for firm-fixed effects, as mentioned in Section 4) to ensure that the negative effect of dividends on R&D investment is not explained by contemporaneous collinearity with other explanatory variables. Model (ii) additionally considers the investment financing constraint of a firm and indicates that, next to the adverse effects from dividend payouts, profits are a positive correlate of R&D investment (t–1 p = 0.031 and t–2 p = 0.150). In contrast, the external financing variables – that is, changes in the liability-to-assets and shares-to-assets ratios – have p-values above 10% (t–1 p = 0.137 and 0.457, and t–2 p = 0.481 and 0.209, respectively). This finding is in line with the assertion of the pecking-order model that internal funds are the preferred finance option for investment (Myers, 1984) and with the literature that shows that R&D investment faces external financing constraints.
To account for the well-known argument that R&D intensity is related to firm size (Shefer and Frenkel, 2005) and age (Fan and Wang, 2021), model (iii) additionally controls for these two variables. The results suggest that larger firms invest less in R&D as a percentage of assets (p = 0.000), whereas firm age is less significant (p = 0.101). The former finding aligns with Shefer and Frenkel’s (2005) results. Finally, model (iv) drops the jointly insignificant second-order lags of R&D, ΔDebt, and ΔEquity (prob > chi2 = 0.375) to present a more parsimonious specification. In this specification, along with the other variables mentioned above, the lagged value of R&D is also significant (p = 0.033) and has the expected positive sign. This finding confirms that R&D investment is an intrinsically dynamic phenomenon and implies that using a dynamic model is warranted.
Concerning the magnitudes of the observed dividend effects, model (iv) indicates that a 1-percentage point increase in the dividend payout-to-asset ratio decreases the R&D investment-to-asset ratio by 0.10 percentage points after one year and an additional 0.08 percentage points after 2 years, ceteris paribus. These values are similar to those reported by Thomas et al. (2003) and Billings et al. (2018) and seem reasonable and economically meaningful. According to our results, a 1-percentage point increase in the dividend payout-to-asset ratio reduces the samples’ median R&D investment-to-asset ratio by 10.8% (from 1.67% to 1.49%), ceteris paribus.
Differential effects according to market economy type
In this section, we test Hypothesis 2, namely, that the size of the trade-off between dividend payouts and firm-level R&D investment differs depending on the type of market economy in which a firm operates. To do so, we group the sample countries into four broad market economy types, in accordance with Witt et al. (2018). Witt et al. derived this classification by considering eight institutional dimensions and applying Calinski–Harabasz cluster analysis. 2
The four country groups are (i) six Anglo-Saxon economies (LME), (ii) ten Northern European economies and Japan (CME), (iii) sixteen Eastern and Southern European economies and advanced emerging economies (mixed market economies, MIX), and (iv) thirty-two emerging market economies (EME). Eight countries could not be assigned to a specific group. The number of firms in each group is as follows: LME = 1,577, CME = 2,176, MIX = 1,871, and EME = 674 (see Table A1 in the Appendix for more details). Based on this classification,, we create four market economy type dummy variables. The LME dummy, for example, takes the value 1 when the firm is based in an LME country and 0 otherwise. 3 We then interact these dummies with the dividend payout-to-asset ratio and add the resulting interaction terms to specification (iv) in Table 2.
Differential effects according to market economy type.
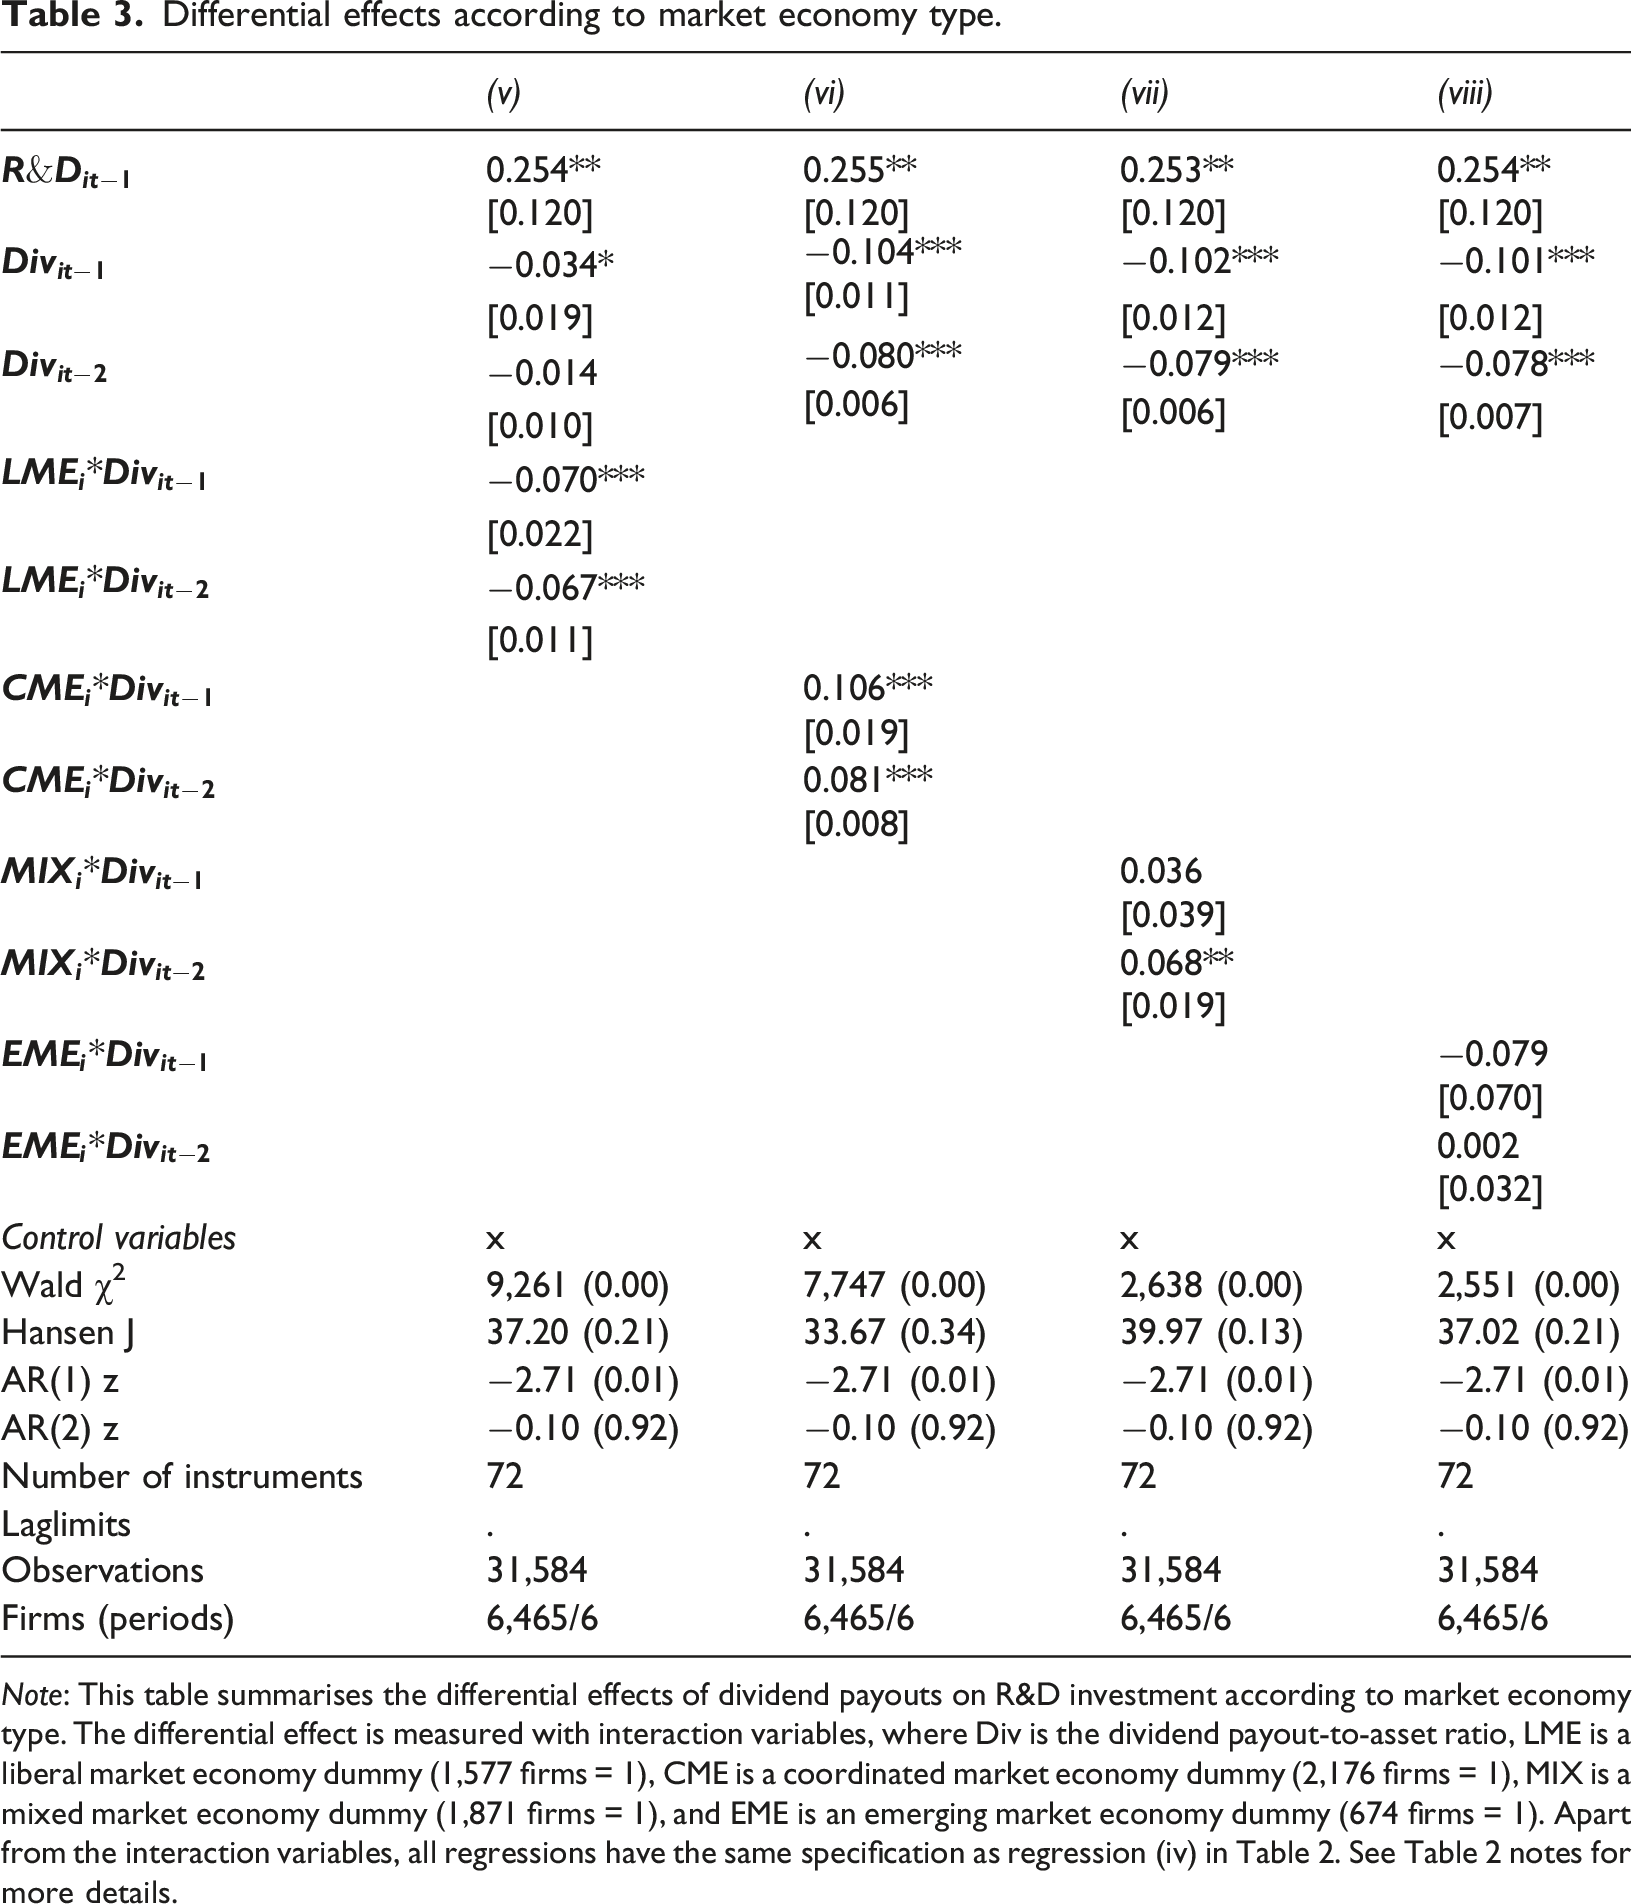
Note: This table summarises the differential effects of dividend payouts on R&D investment according to market economy type. The differential effect is measured with interaction variables, where Div is the dividend payout-to-asset ratio, LME is a liberal market economy dummy (1,577 firms = 1), CME is a coordinated market economy dummy (2,176 firms = 1), MIX is a mixed market economy dummy (1,871 firms = 1), and EME is an emerging market economy dummy (674 firms = 1). Apart from the interaction variables, all regressions have the same specification as regression (iv) in Table 2. See Table 2 notes for more details.
By contrast, the model (vi) results indicate that in CME firm-level R&D investment is not affected by dividend payouts, given that the significant positive coefficients on the two interaction terms (p = 0.000 and p = 0.000) are nearly the same size as the negative coefficients on the dividend ratio (p = 0.000 and p = 0.000). This finding is in line with Aguilera and Jackson's (2003) proposition that firms in CME tend to pursue long-term strategic interests instead of maximising shareholder value.
Regarding the other two market economy types, in MIX the sum of the negative and significant dividend coefficients (p = 0.001 and p = 0.001) is larger in absolute value than the significant positive coefficient on the second-order lag of the interaction term (p = 0.001), whereas the first-order lag of the interaction term is not significant (p = 0.362). This indicates that in mixed market economies the negative dividend effect is significant, but smaller than in LME. Finally, in EME, both interaction terms are not significant (p = 0.260 and p = 0.958), indicating that the magnitude of the R&D-reducing effect of dividend payouts in EME is the same as the pooled average effect found in model (iv). The latter is not surprising, given that the comparative capitalism literature has identified a multitude of different market economy types within EME, sometimes with contradictory typologies for specific countries. For example, the literature has categorised Brazil as state-led (Bizberg, 2019), mixed market (Rajeev, 2014), family-led (Fainshmidt et al., 2016), or a hierarchical market economy with LME forms of corporate governance (Schneider, 2013).
As in the baseline models, the size of the identified effect of dividend payouts on R&D investment seems reasonable and economically meaningful. To obtain a clearer picture of the differences in the magnitude of the impact of dividend payouts on R&D investment between LME, MIX and CME, we calculate long-run dividend payout elasticities by dividing the sum of the dividend ratio and interaction coefficients by one minus the coefficient on the lagged dependent variable. The long-run estimates show that in LME the dividend elasticity is approximately 50% larger in absolute value than in MIX (−0.23 vs. −0.15), and close to zero in CME (0.005).
Robustness tests
Robustness tests.
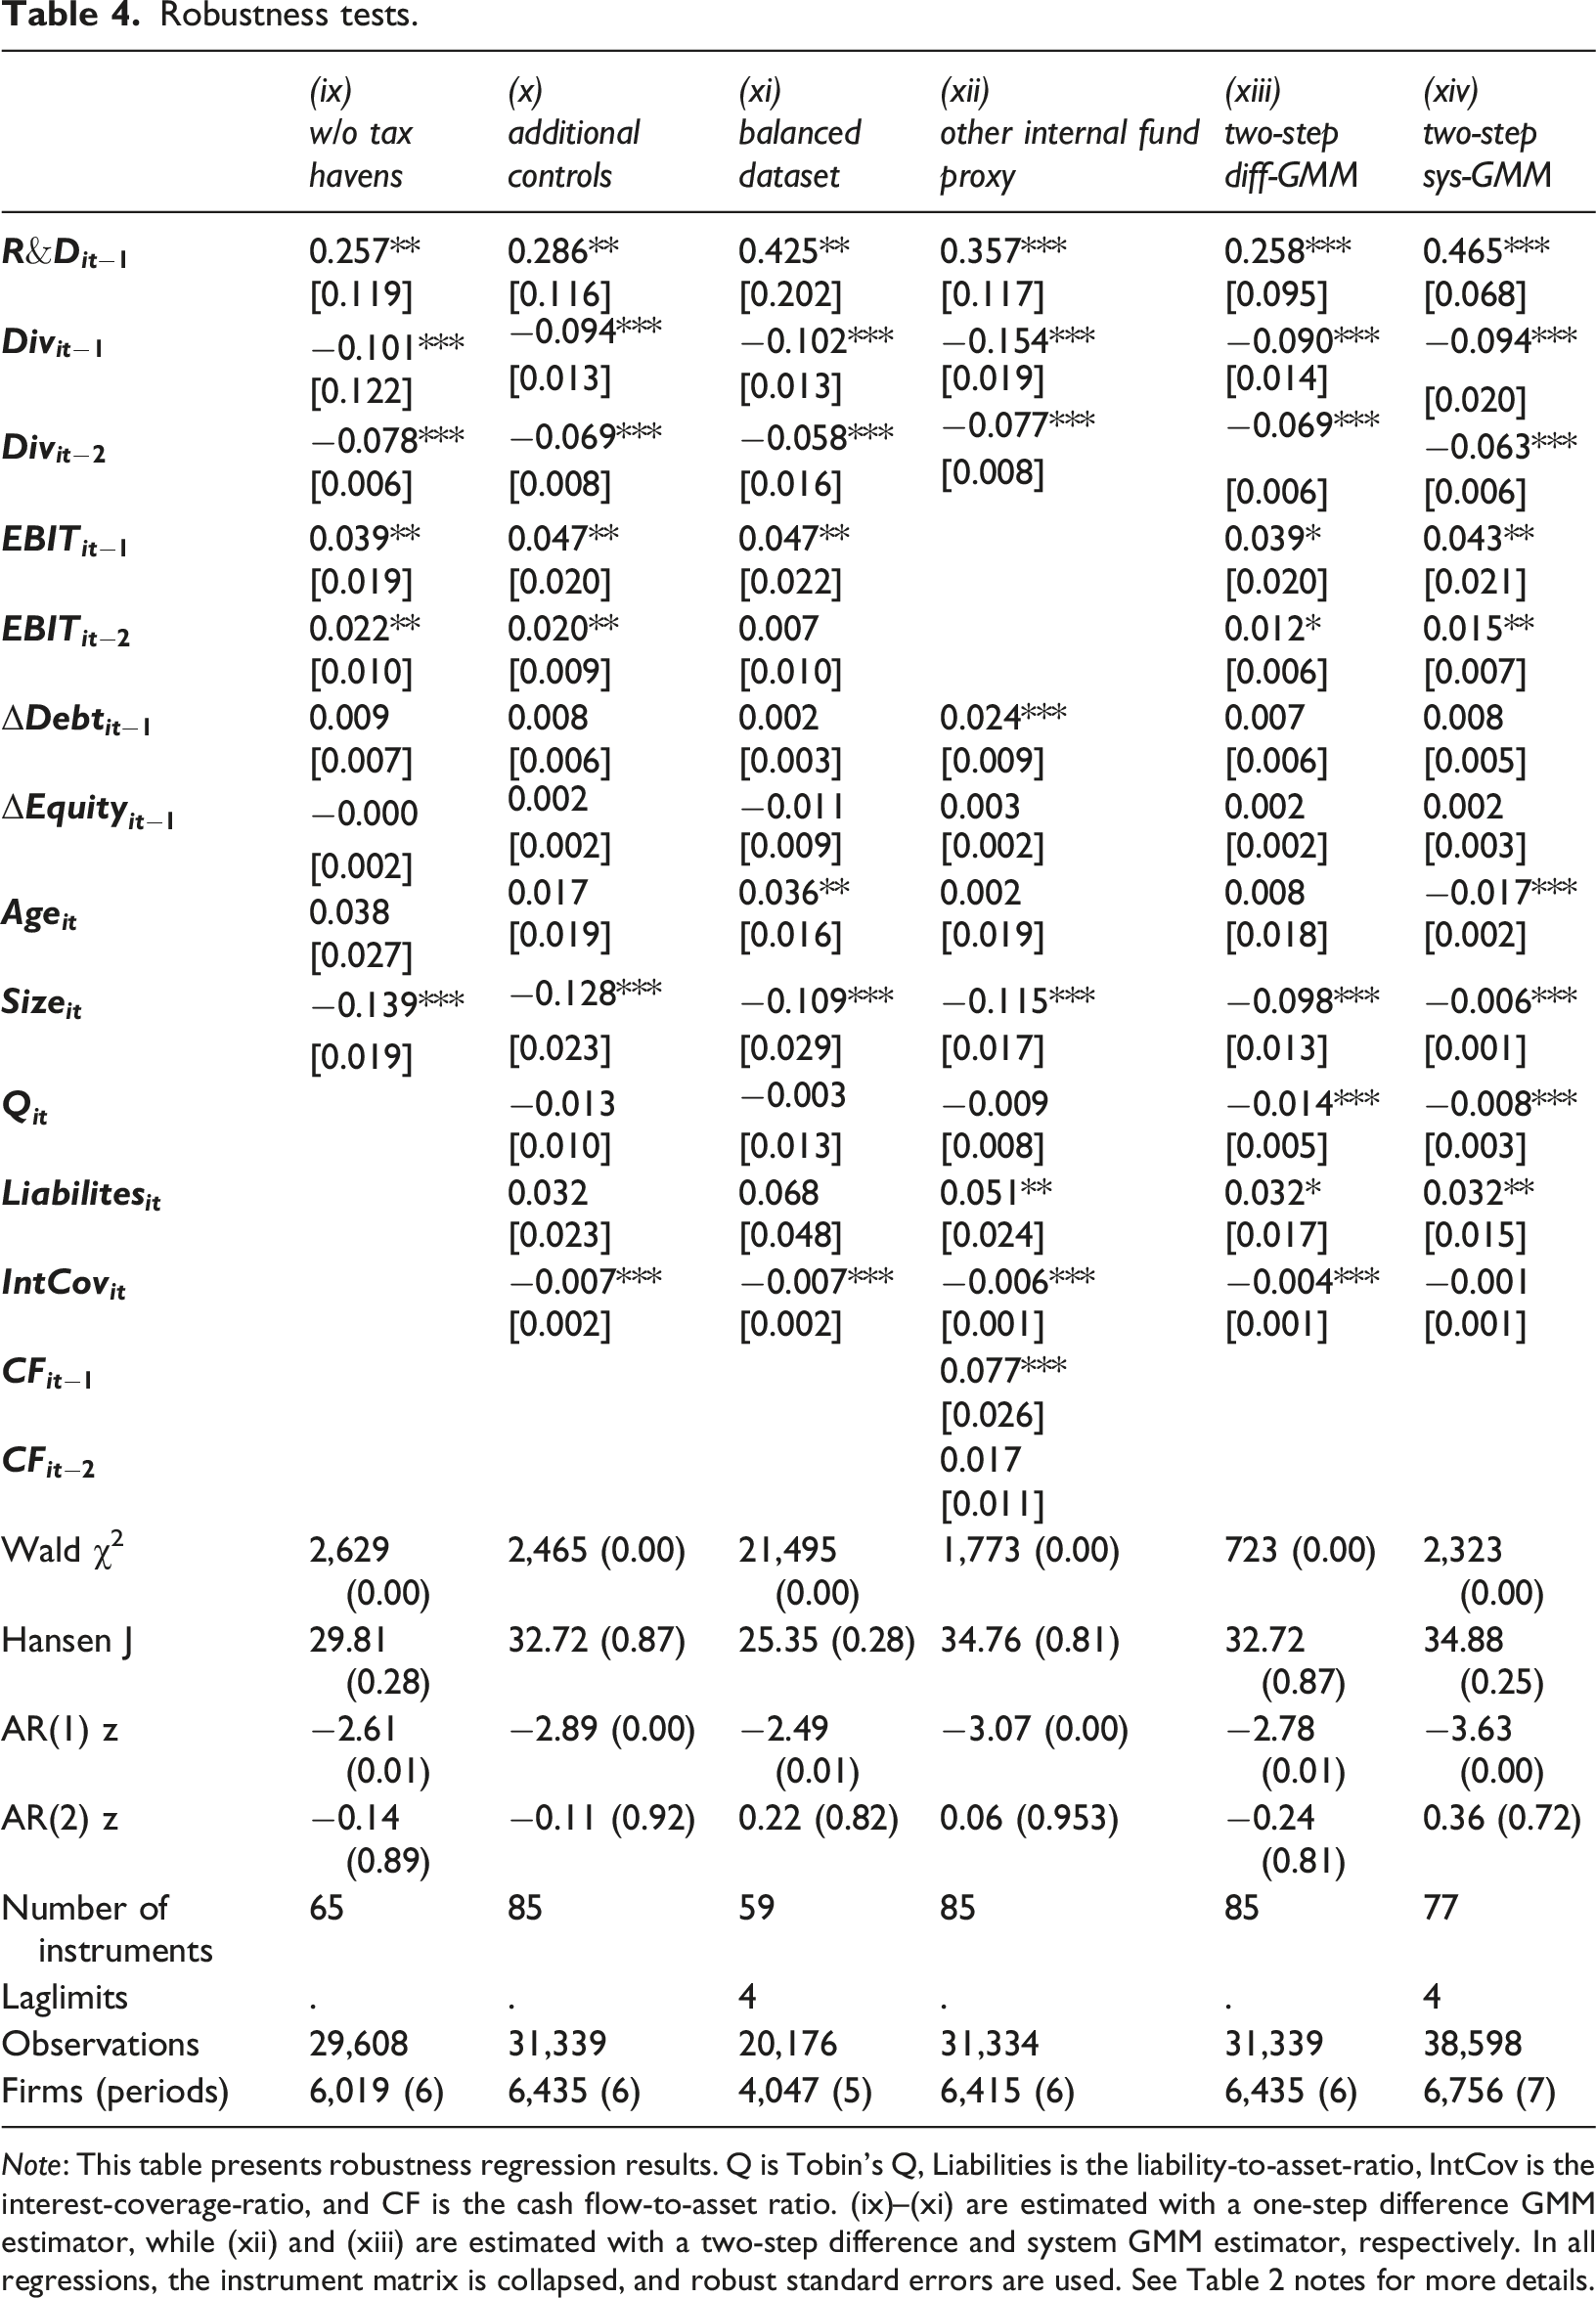
Note: This table presents robustness regression results. Q is Tobin’s Q, Liabilities is the liability-to-asset-ratio, IntCov is the interest-coverage-ratio, and CF is the cash flow-to-asset ratio. (ix)–(xi) are estimated with a one-step difference GMM estimator, while (xii) and (xiii) are estimated with a two-step difference and system GMM estimator, respectively. In all regressions, the instrument matrix is collapsed, and robust standard errors are used. See Table 2 notes for more details.
One might argue that firms incorporated in jurisdictions with very particular financial and tax regimes could distort the results. To address this concern, we re-estimate our baseline specification after excluding all firms incorporated in Bermuda, the Cayman Islands, the British Virgin Islands, Curaçao, and Luxembourg from the sample. Model (ix) shows that the estimated coefficients remain very similar to our baseline results. The coefficients on the first and second lag of the dividend-payout-to-asset ratio are still negative and highly significant, and their magnitudes are even slightly larger than in the baseline regressions. The GMM diagnostic statistics also remain satisfactory. These results show that our main finding is not driven by the small number of firms incorporated in tax-haven jurisdictions.
With respect to the additional control variables, we consider whether interest payments reduce the available cash flow for investment and that indebtedness can influence access to external financing (Fazzari and Mott, 1987; Ndikumana, 1999), and we take into account that Hayashi (1982) showed that a high ratio of a firm’s market value to the replacement cost of its capital stock can stimulate physical investment due to high expected profitability of new investment – a similar mechanism can also be expected for intangible investment (Peters and Taylor, 2017). Tobin’s
Model (x) shows that adding these variables does not change the main findings from the baseline regression results from Table 2. The same is true when only those firms are considered that report data in each year of the period under study (model (xi)), or when cash flow is used as a proxy for profits instead of EBIT (model (xii)). In the latter case, the only noteworthy change is that the liability-to-asset ratio becomes significant, with the expected positive sign.
Finally, we verify whether the results are robust when we use two-step difference GMM and the Blundell–Bond system GMM estimator (models (xiii) and (xiv)), instead of a one-step difference GMM estimator. Although two-step difference and system GMM estimators are asymptotically more efficient, their finite-sample performance may be less reliable. Moreover, system GMM augments the differenced equation with a level equation and therefore relies on additional moment conditions not required by difference GMM (see Kiviet, 2020). For these reasons, we treat the two-step and system GMM estimates solely as robustness checks.
The results in Table 4 show that the main findings are essentially unaffected: the coefficients on the lagged dividend-payout-to-asset ratios remain negative and statistically significant, their magnitudes are very similar to those in the one-step difference GMM specification, and the GMM diagnostics (Hansen J and AR(1)/AR(2) tests and instrument counts) remain satisfactory. This indicates that our conclusions are not sensitive to the choice between one-step difference GMM, two-step difference GMM, and system GMM.
Conclusions
This study contributes to the growing literature on the adverse investment effects of shareholder value-oriented corporate governance. It addresses a gap in this literature by presenting international empirical evidence indicating that dividend payouts and R&D investment represent competing demands on firms’ internal funds. This finding is robust across various model specifications and samples and economically meaningful: a 1-percentage point increase in the dividend payout-to-asset ratio decreases the samples’ median R&D investment-to-asset ratio by 10.8% (ceteris paribus).
Furthermore, our comparative capitalism analysis shows that the trade-off is strongest in liberal market economies, average in emerging economies, weaker in mixed market economies, and essentially absent in coordinated market economies. Additionally, firm profits and size are significant determinants of R&D investment, whereas debt and share issuance are not. These findings indicate that internal finance is the preferred financing option for R&D investment and that firms face external financing constraints. They further indicate that dividend policy is relevant for R&D investment in liberal, mixed, and emerging market economies.
In addition to contributing to academic debates, our findings also have implications for economic policy. They suggest that policies aimed at fostering innovation and R&D, such as tax incentives, subsidies, or mission-oriented industrial strategies, need to be considered alongside prevailing corporate governance and payout regimes. Otherwise, a non-trivial part of the additional cash flow generated by such policies risks being returned to shareholders rather than reinvested in R&D, particularly in liberal market and emerging economies.
At the same time, reforms of corporate governance and dividend taxation are themselves politically and institutionally constrained. Shareholder-value-oriented norms are deeply embedded in legal frameworks and market practices, powerful financial actors have a strong interest in maintaining high payouts, and international tax competition limits the scope for unilateral changes in dividend and capital gains taxation. In this context, current debates on innovation and industrial policy, including recent innovation initiatives on the social, digital, and green transition in OECD countries (Einhoff & Paunov, 2025), would benefit from paying more explicit attention to how corporate governance and payout norms shape firms’ willingness to commit internal funds to R&D.
It is important to point out that more research on this topic is necessary. A general limitation of existing studies (including ours) is that R&D investment is difficult to measure, and the accounting standards for reporting R&D activities differ across countries. Therefore, future research might want to consider corroborating our results with distinct R&D measures. Another interesting avenue for future research would be to complement our panel GMM results with quantile regression approaches to study how the impact of dividend payouts on R&D investment varies across the firm distribution, in line with recent contributions by Rabinovich (2023) and Sündal (2023) that use quantile methods to analyse heterogeneity in firms’ growth and investment behaviour across the distribution of firms.
Moreover, corporate governance structures and business systems differ across countries and industries (Aguilera and Crespi-Cladera, 2018; Witt et al., 2018). In this paper, we address these differences by combining country and sector fixed effects with an explicit analysis of heterogeneity across market economy types. Future work could go further by identifying more directly how far specific corporate mechanisms influence the relationship between dividend payouts and R&D investment. It could also examine more closely how outsourcing and offshoring of R&D, international knowledge sourcing, and the acquisition of start-ups shape the relationship between financialisation and innovative activity. Existing research shows that firms increasingly use contract development (Mishra et al., 2026), international knowledge sourcing (Laursen and Santangelo, 2017), and acquisitions to obtain innovative knowledge (Cunningham et al., 2021). Such strategies may allow firms to sustain innovative outcomes even when reported in-house R&D expenditure is reduced, which further complicates the measurement of innovation effort. Attention to these structural changes may be particularly important for a more comprehensive understanding of financialised market economies.
Footnotes
Acknowledgements
We thank the two anonymous referees and the participants of the 35th Annual Society for the Advancement of Socio-Economics (SASE) Conference, 26th Conference of the Forum for Macroeconomics and Macroeconomic Policies (FMM), and IPE-MIE Research Seminar for their comments, which helped us to improve earlier versions of this manuscript.
Funding
The authors received no financial support for the research, authorship, and/or publication of this article.
Declaration of conflicting interests
The authors declared no potential conflicts of interest with respect to the research, authorship, and/or publication of this article.
Data Availability Statement
The data underlying this article is obtained from the ORBIS database and we do not have permission to share it.
Notes
Appendix
Country information. Note. R&D and Dividends are the mean ratios of R&D and dividend payouts relative to total assets, respectively. B: Mining and quarrying, C: Manufacturing, G: Wholesale and retail trade, J: Information and communication, and M: Professional, scientific and technical activities.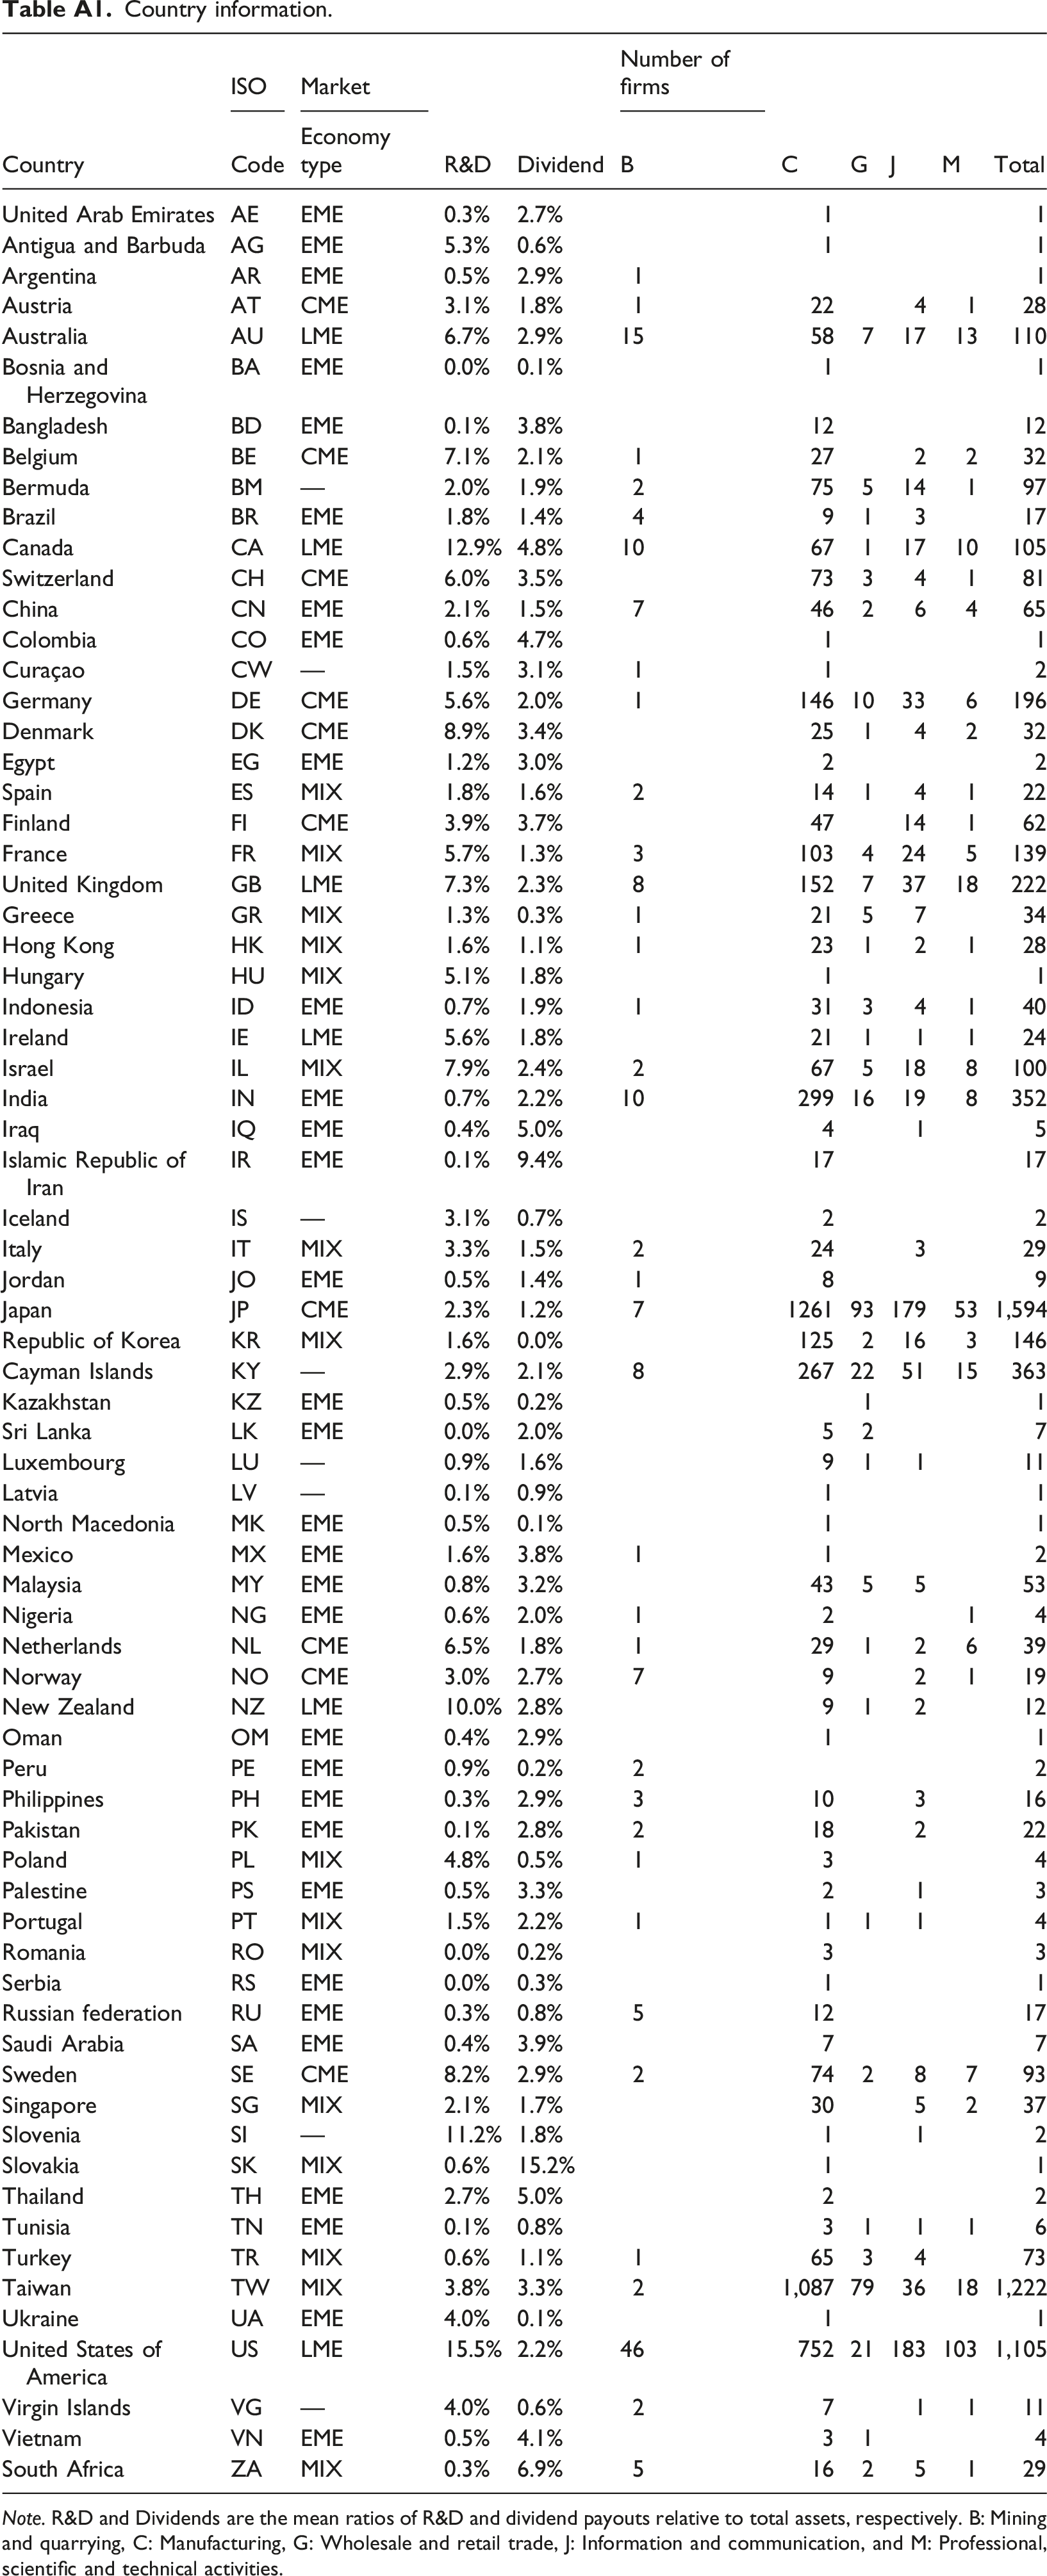
Country
ISO
Market
R&D
Dividend
Number of firms
C
G
J
M
Total
Code
Economy type
B
United Arab Emirates
AE
EME
0.3%
2.7%
1
1
Antigua and Barbuda
AG
EME
5.3%
0.6%
1
1
Argentina
AR
EME
0.5%
2.9%
1
1
Austria
AT
CME
3.1%
1.8%
1
22
4
1
28
Australia
AU
LME
6.7%
2.9%
15
58
7
17
13
110
Bosnia and Herzegovina
BA
EME
0.0%
0.1%
1
1
Bangladesh
BD
EME
0.1%
3.8%
12
12
Belgium
BE
CME
7.1%
2.1%
1
27
2
2
32
Bermuda
BM
—
2.0%
1.9%
2
75
5
14
1
97
Brazil
BR
EME
1.8%
1.4%
4
9
1
3
17
Canada
CA
LME
12.9%
4.8%
10
67
1
17
10
105
Switzerland
CH
CME
6.0%
3.5%
73
3
4
1
81
China
CN
EME
2.1%
1.5%
7
46
2
6
4
65
Colombia
CO
EME
0.6%
4.7%
1
1
Curaçao
CW
—
1.5%
3.1%
1
1
2
Germany
DE
CME
5.6%
2.0%
1
146
10
33
6
196
Denmark
DK
CME
8.9%
3.4%
25
1
4
2
32
Egypt
EG
EME
1.2%
3.0%
2
2
Spain
ES
MIX
1.8%
1.6%
2
14
1
4
1
22
Finland
FI
CME
3.9%
3.7%
47
14
1
62
France
FR
MIX
5.7%
1.3%
3
103
4
24
5
139
United Kingdom
GB
LME
7.3%
2.3%
8
152
7
37
18
222
Greece
GR
MIX
1.3%
0.3%
1
21
5
7
34
Hong Kong
HK
MIX
1.6%
1.1%
1
23
1
2
1
28
Hungary
HU
MIX
5.1%
1.8%
1
1
Indonesia
ID
EME
0.7%
1.9%
1
31
3
4
1
40
Ireland
IE
LME
5.6%
1.8%
21
1
1
1
24
Israel
IL
MIX
7.9%
2.4%
2
67
5
18
8
100
India
IN
EME
0.7%
2.2%
10
299
16
19
8
352
Iraq
IQ
EME
0.4%
5.0%
4
1
5
Islamic Republic of Iran
IR
EME
0.1%
9.4%
17
17
Iceland
IS
—
3.1%
0.7%
2
2
Italy
IT
MIX
3.3%
1.5%
2
24
3
29
Jordan
JO
EME
0.5%
1.4%
1
8
9
Japan
JP
CME
2.3%
1.2%
7
1261
93
179
53
1,594
Republic of Korea
KR
MIX
1.6%
0.0%
125
2
16
3
146
Cayman Islands
KY
—
2.9%
2.1%
8
267
22
51
15
363
Kazakhstan
KZ
EME
0.5%
0.2%
1
1
Sri Lanka
LK
EME
0.0%
2.0%
5
2
7
Luxembourg
LU
—
0.9%
1.6%
9
1
1
11
Latvia
LV
—
0.1%
0.9%
1
1
North Macedonia
MK
EME
0.5%
0.1%
1
1
Mexico
MX
EME
1.6%
3.8%
1
1
2
Malaysia
MY
EME
0.8%
3.2%
43
5
5
53
Nigeria
NG
EME
0.6%
2.0%
1
2
1
4
Netherlands
NL
CME
6.5%
1.8%
1
29
1
2
6
39
Norway
NO
CME
3.0%
2.7%
7
9
2
1
19
New Zealand
NZ
LME
10.0%
2.8%
9
1
2
12
Oman
OM
EME
0.4%
2.9%
1
1
Peru
PE
EME
0.9%
0.2%
2
2
Philippines
PH
EME
0.3%
2.9%
3
10
3
16
Pakistan
PK
EME
0.1%
2.8%
2
18
2
22
Poland
PL
MIX
4.8%
0.5%
1
3
4
Palestine
PS
EME
0.5%
3.3%
2
1
3
Portugal
PT
MIX
1.5%
2.2%
1
1
1
1
4
Romania
RO
MIX
0.0%
0.2%
3
3
Serbia
RS
EME
0.0%
0.3%
1
1
Russian federation
RU
EME
0.3%
0.8%
5
12
17
Saudi Arabia
SA
EME
0.4%
3.9%
7
7
Sweden
SE
CME
8.2%
2.9%
2
74
2
8
7
93
Singapore
SG
MIX
2.1%
1.7%
30
5
2
37
Slovenia
SI
—
11.2%
1.8%
1
1
2
Slovakia
SK
MIX
0.6%
15.2%
1
1
Thailand
TH
EME
2.7%
5.0%
2
2
Tunisia
TN
EME
0.1%
0.8%
3
1
1
1
6
Turkey
TR
MIX
0.6%
1.1%
1
65
3
4
73
Taiwan
TW
MIX
3.8%
3.3%
2
1,087
79
36
18
1,222
Ukraine
UA
EME
4.0%
0.1%
1
1
United States of America
US
LME
15.5%
2.2%
46
752
21
183
103
1,105
Virgin Islands
VG
—
4.0%
0.6%
2
7
1
1
11
Vietnam
VN
EME
0.5%
4.1%
3
1
4
South Africa
ZA
MIX
0.3%
6.9%
5
16
2
5
1
29