
Abstract
This article reports a pair of studies that test two opposing hypotheses derived from music theory scholarship with regard to chord durations in popular music. The first hypothesis is that, regardless of tempo, chords will tend to last on average an ideal span of relative time, such as a bar. The second hypothesis is that, regardless of tempo, chords will tend to last on average an ideal span of absolute time, such as 2 s. Given the subjectivity of these parameters, three large encoded collections of harmony in popular music, each based on different musical styles and annotated by different musicians, were used to study the evidence for and against these two hypotheses. Average chord lengths were calculated for each song in the corpora based on geometric mean length in bars, geometric mean length in seconds, median length in bars, and median length in seconds. Following a description of the data-wrangling stages, the article reports the use of analysis of variance and linear regression models to examine the validity of each hypothesis. Although neither hypothesis was supported consistently, more evidence was found to support the second hypothesis that chord lengths tend to last on average an ideal span of absolute time, regardless of tempo. This finding suggests the existence of a perceptual ideal for chord durations in popular music that should be quantified in seconds rather than bars.
As the tempo of a particular song increases, the chords of that song become shorter in terms of absolute time (e.g., seconds). The 1966 recording of “Steppin’ Stone” by the Monkees, for example, has a moderate tempo of around 132 beats per minute (bpm), and the first chord of the song lasts about 0.91 s. In contrast, the 1984 cover by Minor Threat has a much faster tempo of around 180 bpm, and thus its first chord lasts only about 0.67 s. Based on this observation, we might hypothesize that chord durations in songs at faster tempos are, on average, significantly shorter in terms of absolute time than chord durations in songs at slower tempos.
Further grounds for this hypothesis can be found in the writings of music theorists. Allan Moore, for example, writes that tempo in popular music is determined primarily by the standard rock drum pattern, in which the snare is played on beats 2 and 4 of the bar (the “backbeat”), given a meter of 4/4 (Moore, 2012, p. 51). A similar method for determining tempo can be found in the empirical literature (Schellenberg & von Scheve, 2012, p. 198). Moore (2001, p. 42) goes on to state that harmony in popular music tends to change every bar, a claim that also finds support in my own recent corpus work (de Clercq, 2017, p. 160). If we put Moore’s two observations together, we might reasonably conclude that since bar lengths (by definition) become shorter in terms of absolute time as tempo increases, and since harmony tends to change every bar, then chord durations as measured in seconds will decrease as tempo increases, generally speaking. For the sake of brevity, this view will be referred to as the relative hypothesis, since it presumes that chord lengths tend on average to last an ideal span of relative time (e.g., a bar), whether or not the tempo of the song is fast or slow.
A contrasting hypothesis could be developed by examining a different set of songs. Consider, for instance, three songs that utilize the so-called Axis progression of vi–IV–I–V (Richards, 2017): “You’re Not Sorry” by Taylor Swift (2008), “Love Me” by Justin Bieber (2009), and “The Kids Aren’t Alight” by The Offspring (1998). If we use the standard rock drum pattern as a guide, these three songs have rather different tempos, the Taylor Swift song at about 67 bpm, the Justin Bieber song at about 125 bpm, and The Offspring song at about 201 bpm. Yet in contrast to the relative hypothesis, the pacing of the Axis progression in terms of bars is different in each song. In the Taylor Swift song, each chord of the Axis progression lasts half a bar; in the Justin Bieber song, each chord lasts a bar; and in The Offspring song, each chord lasts two bars. Chord durations as measured in bars thus appear dependent on tempo, with faster tempos corresponding to longer relative chord durations (and vice versa).
These three songs alone do not provide enough evidence to refute the relative hypothesis, but they serve to exemplify a contrary view that I have espoused in previous work (de Clercq, 2016). According to this view, chord durations in popular music generally have a moderate pacing as measured in absolute time, regardless of the tempo implied by the drum pattern, with about 2 s as the average chord length. For the sake of brevity, this view will be referred to as the absolute hypothesis, since it posits that chord lengths tend on average to last an ideal span of absolute time (e.g., 2 s), whether or not the tempo of the song is fast or slow.
To summarize, the absolute and relative hypotheses are in direct opposition: The relative hypothesis posits that chord lengths in bars tend on average to be independent of tempo, whereas the absolute hypothesis posits that chord lengths in seconds tend on average to be independent of tempo. This issue involves what music theorists refer to as harmonic rhythm, or the pacing of chord changes in a musical work (Lester, 1986). So does harmonic rhythm in popular music tend, across various tempos, to be more stable in terms of seconds or bars?
The pacing of a song has traditionally been encapsulated by the single, all-encompassing parameter of tempo, which has been the subject of numerous empirical studies. Based on this work (e.g., Duke, 1989; Warren, 1993), it is clear that absolute time has some influence on tempo perception, if only by imposing constraints on the upper and lower limits of viable rates, which range from about 30 to 240 bpm. Preferred tempo presumably lies somewhere in the middle of this range, although the exact rate may be contingent on context. While earlier work has identified preferred tempo as approximately 100 bpm (Fraisse, 1982; Parncutt, 1994), more recent work focusing primarily on popular music suggests that preferred tempo may lie closer to 120 bpm (de Clercq, 2016; Moelants, 2002). These details aside, the interaction of absolute time, tempo, and meter undoubtedly shapes the hierarchy of regular rhythmic values in a musical work (London, 2012).
One recent area of research on tempo involves automatic estimation from audio recordings (Alonso et al., 2004; Davies & Plumbley, 2008; Percival & Tzanetakis, 2014), which could be used by streaming music services to match songs by beats per minute so as to auto-generate playlists based on a particular mood or activity (e.g., up-tempo music for workouts). Such studies are challenged, however, by the difficulty of establishing a ground truth for tempo, since even human listeners are subject to tempo disagreement in crowd-sourced annotations (Levy, 2011). For example, some listeners prefer to report tempos as close to 120 bpm as possible, regardless of other features in the music such as the drum pattern (Moelants & McKinney, 2004).
Another challenge is that using a single parameter for measuring overall speed may fail to capture rates of change in multiple musical domains. In particular, harmonic rhythm may induce a sense of speed in the listener that conflicts with other musical features such as the drum pattern. Indeed, Lerdahl and Jackendoff suggest that identification of the beat rate is associated with the pacing of the chord changes, such that a piece with frequent harmonic changes is heard as having a faster beat than a piece with equal note values but less frequent harmonic changes (Lerdahl & Jackendoff, 1983, p. 74). Experimental work has also shown that listeners are more likely to identify meter—and thus perhaps indirectly, tempo—on the basis of chord changes than temporal accents (Dawe et al., 1993). But although a relationship between harmonic rhythm and tempo has been suggested, no large-scale study has yet been carried out to investigate the strength or nature of this relationship. Unfortunately, harmonic rhythm in popular music has until now been a “somewhat neglected topic” (Temperley, 2018, p. 80). An empirical study of harmonic rhythm in popular music thus seems warranted.
The current article reports such a study, using the two opposing hypotheses described above as motivating conjectures. Since tempo perception and harmonic rhythm are both subjective features, it was decided not to conduct a single corpus study but instead to test the hypotheses using three large corpora of harmony in popular music (described below), each corpus having been encoded by a different musician or set of musicians. The following sections describe each corpus, the structure of the raw data, and the preliminary data-wrangling steps. As will be shown, the results of various statistical tests refuted neither hypothesis. That said, more evidence was found for the absolute hypothesis when comparing tempo differences on a large scale, even if the relative hypothesis seems to better explain average harmonic rhythm based on small-scale tempo differences. In other words, chord lengths across various tempos tend on average to last an ideal span of absolute time rather than an ideal span of relative time.
Materials and methods
To be useful for investigating harmonic rhythm versus tempo, a corpus must include complete harmonic encodings for each song, chord lengths in both relative and absolute durations (i.e., bars and seconds), information on meter, and indications of song tempo. Few available corpora of popular music satisfy these criteria, especially ones that include a large number of songs. The three corpora used in this study could thus arguably be considered a convenience sample, although the methodology used to create each corpus was originally motivated by an attempt to create a representative sample of popular music.
The first corpus was created from a set of 200 songs drawn from the 2004 Rolling Stone magazine list of the 500 greatest songs of all time—hereafter, the RS corpus. 1 As described in the original articles using this corpus for research purposes (de Clercq & Temperley, 2011; Temperley & de Clercq, 2013), the included songs are meant to represent rock music in its broadest sense. Song release dates span from 1949 to 2002, although the sample tends to be biased somewhat toward songs from the 1960s and 1970s. Each song in this corpus contains two independent encodings of harmony, but for reasons to be explained in the next paragraph, the current study uses only those encodings by David Temperley.
The second corpus was created from the 200-song set of harmonic transcriptions in my Nashville Number System Fakebook of country music—hereafter, the NN corpus (de Clercq, 2015). 2 A corpus of country music provided a helpful complement to the RS corpus, since country is a style of popular music that rarely overlaps with rock (Temperley, 2018, p. 255ff). The songs in this corpus represent a broad history of country music, with song dates ranging from 1933 to 2014 and an average date of 1981. Because I myself created the transcriptions in the NN corpus, my encodings were not included in the RS corpus used here, so as to not let my own judgments unduly bias the overall results.
The third and final corpus was a much larger body of songs drawn from a random sampling of the Billboard Hot 100 charts between 1958 and 1991—hereafter, the BB corpus. 3 As such, this third corpus could be considered more representative of pop music and thus a complement to both the rock (RS) and country (NN) corpora. After removing duplicate entries (due to the nature of the sampling procedure), the BB corpus consists of 732 unique transcriptions. Unlike the encodings in the RS and NN corpora, each file in the BB corpus represents the work of multiple annotators, and no single annotator appears to have been involved in the transcription of every song (Burgoyne et al., 2011).
An important preliminary consideration is the question of what exactly constitutes a chord change. Music scholars have identified root motion, especially between chords in root position, as a strong indicator of harmonic change (DeVoto, 2003; Swain, 1998). These scholars were describing harmonic rhythm primarily within the context of classical music, however, and thus, while root motion is certainly an important criterion for chord changes in popular music, other factors may also be important, such as with so-called “slash chords” for which there is no clear root (Schenkius, 2011). Indeed, the issue of what is or is not a chord in popular music has been the subject of debate among music theorists (Doll, 2013a, 2013b; Swain, 2013a, 2013b). In the present study, a chord change was taken to be any difference between two consecutive encoded chord symbols. As such, a chord change may involve a change of root (e.g., C to F), a change of quality (e.g., C to Cm), a change of bass (e.g., C to C/E), or a change of extension (e.g., C to C7). Admittedly, this approach uses a very inclusive definition of a chord change, but it seemed like the best way to represent the perception of the human annotators. That is to say, if the annotator(s) saw fit to use a different chord symbol, there was apparently something important enough happening in the harmony to warrant indicating a difference.
The next important determination was the tempo for each song. As discussed above, tempo ratings are—like chord changes—inherently subjective. Because the encodings were used to determine what constitutes a chord change, it also seemed preferable to let the encodings (and thus the original annotators) determine the tempo for each song. The NN corpus includes explicit tempo indications, but the RS and BB corpora do not. Instead, these two corpora provide timing data, either for the start of each bar (RS) or the start of each hypermeasure (BB). This timing data can then be combined with the encoded time signature to calculate a local tempo for each bar or phrase, as implied by the original annotator(s). Averaging these local tempo values gives a single value for each song in the RS and BB corpora that approximates the song’s overall tempo. 4 A single tempo value for each song is not always appropriate, however, such as when a song has changing meters (defined here as a change in time signature lasting more than a bar) or changing tempos (defined here as those songs in which more than 10% of the bars have local tempos that deviate more than 10% from the average tempo). As a result, songs for which no single tempo value could be meaningfully determined were discarded.
To give a sense of how tempo ratings are distributed in these corpora, Figure 1(a) shows the quantile–quantile plots (or Q–Q plots) for each corpus, with tempo in beats per minute plotted versus the theoretical Z scores for normally distributed data. Were the data normally distributed, we would see straight lines with a positive slope, which is not the case here. As Figure 1(b) shows, however, a logarithmic (log) transformation of tempo produces a more normal distribution. 5 Note also that these plots show some extremely fast tempo values in the BB corpus (Figure 1[a]). Because previous empirical research has shown that the range of viable perceived tempos has an upper bound of about 240 bpm (London, 2012, p. 30), songs in the BB corpus with calculated tempos exceeding this value were taken to be incorrectly encoded and thus discarded.
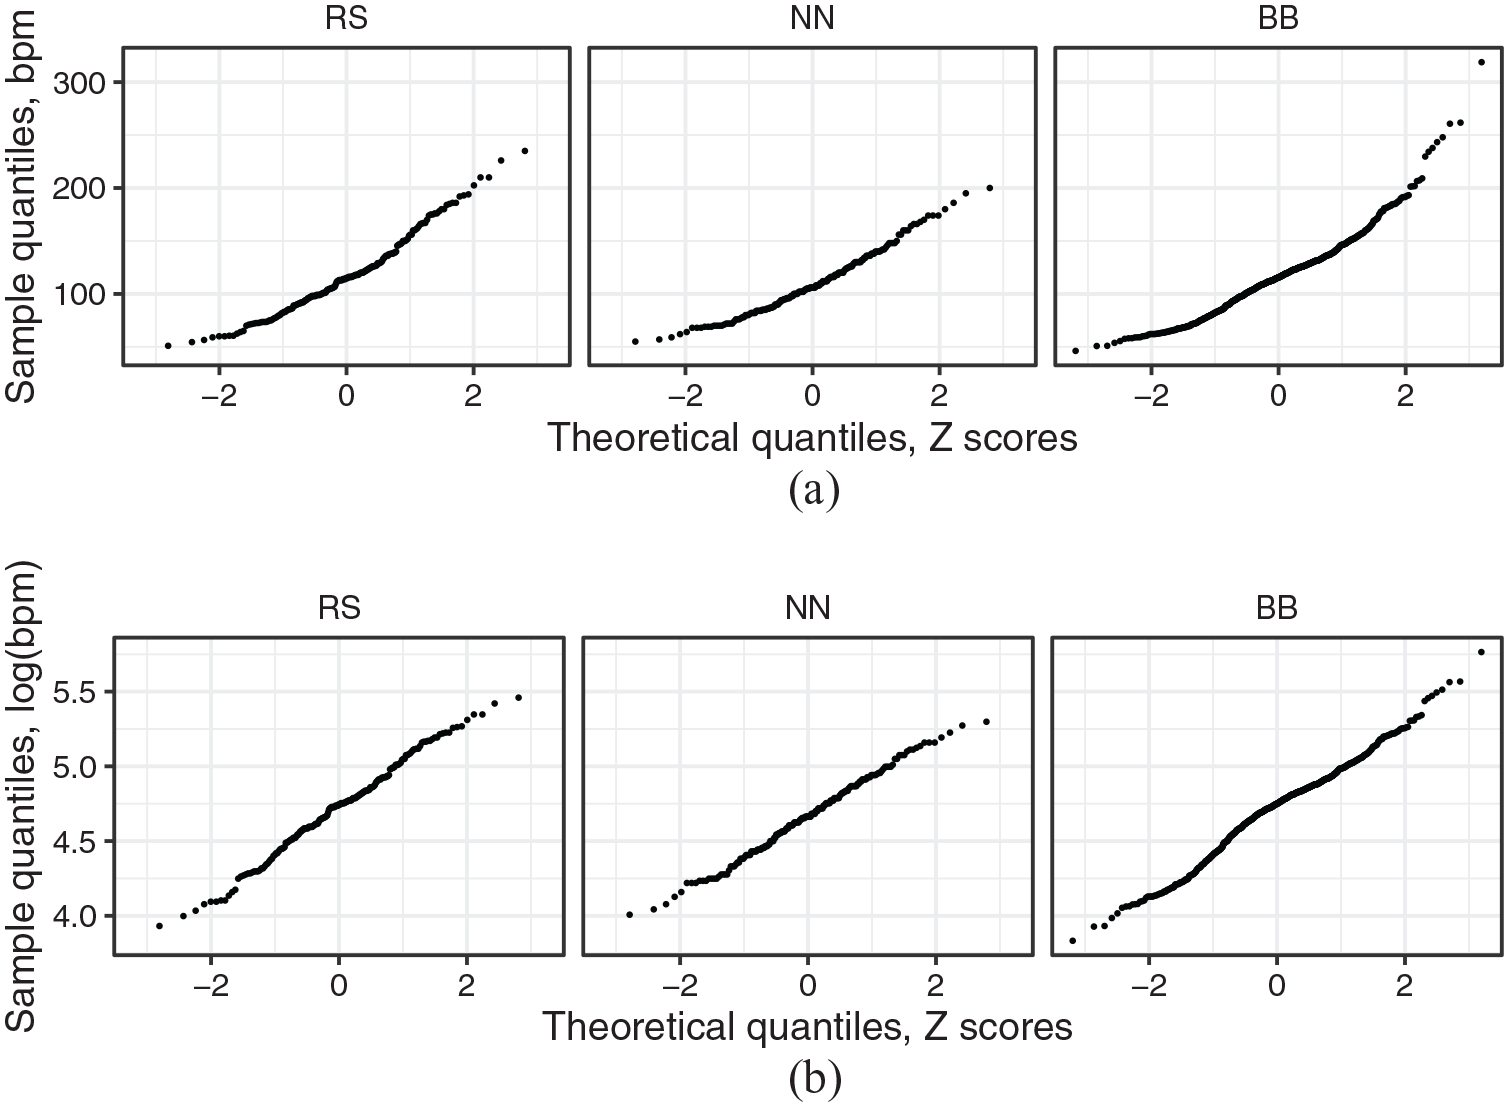
Q–Q plots of tempo data for each corpus, as measured in beats per minute. Graphs in (a) are the raw data and in (b) show the data after log transformation.
Another necessary data-wrangling step was to calculate the duration of each chord. Since both the RS and BB corpora include explicit timing data, chord lengths in seconds could be computed directly. The NN corpus does not include timing data, but the tempo information for each song could be combined with chord lengths in bars to calculate time spans. Figure 2(a) shows Q–Q plots for all chord lengths in the three corpora, as measured in seconds. The upward curvature on the right sides of these plots implies that a similar data transformation as used for tempo would be appropriate. Indeed, the Q–Q plots for the log-transformed chord durations, shown in Figure 2(b), appear much closer to a normal distribution. But while the plot for the NN corpus has essentially straightened out, some upward curvature remains in the RS and BB plots, indicating that the data contain some extremely long chord durations. Indeed, if the longest 0.5% of chord durations are removed, as shown in Figure 2(c), the Q–Q plots conform much more closely to a straight line. The underlying issue is that some songs were encoded as consisting of just a single chord (e.g., “California Love” by 2Pac in the RS corpus). Since these songs were encoded with no chord changes, they were not of interest in the current study and were also discarded.
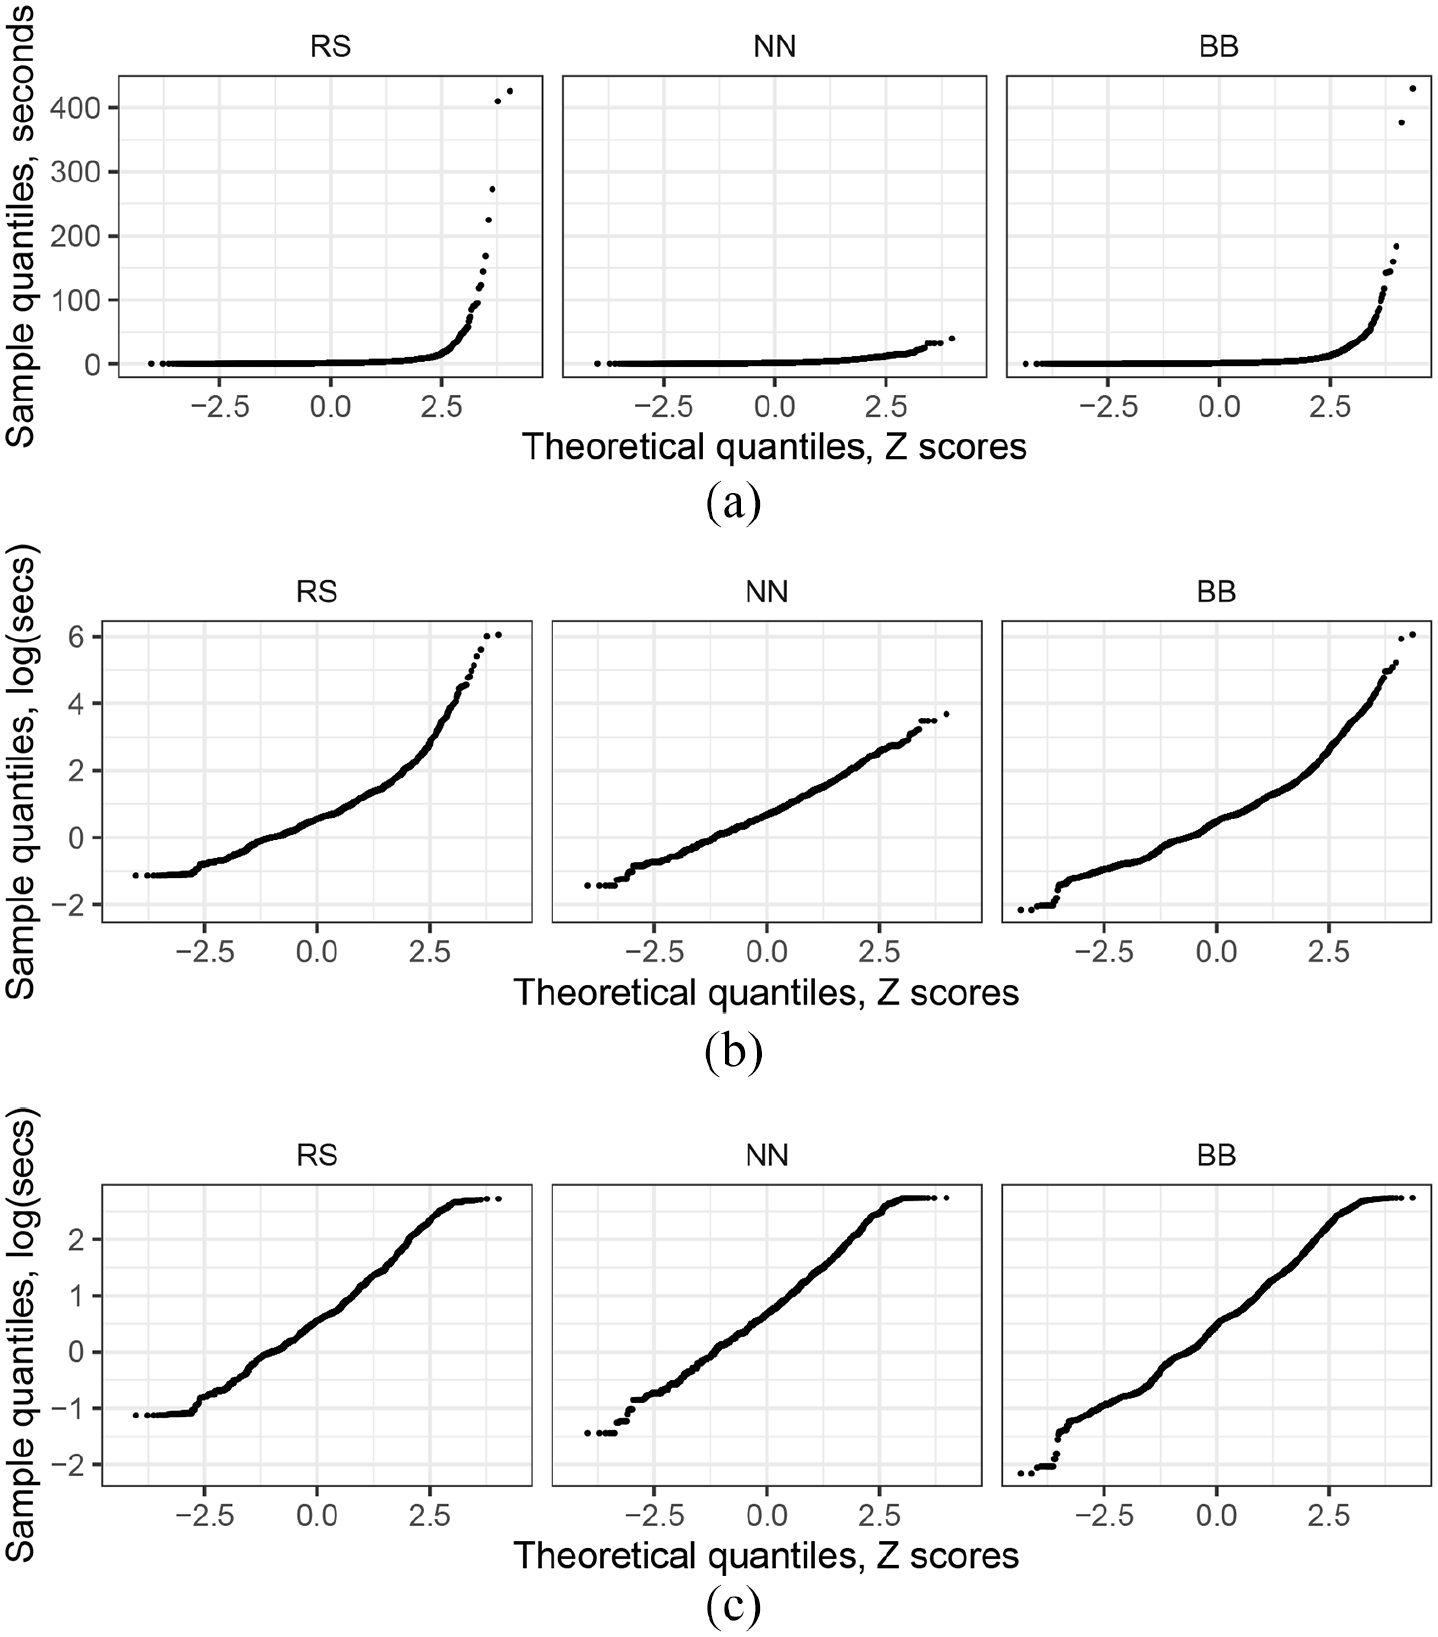
Q–Q plots of all chord durations, as measured in seconds. Graphs in (a) are the raw data, those in (b) show the data after log transformation, and those in (c) show the log-transformed data with the longest 0.5% of chords removed.
Because these raw chord data do not represent independent observations, they cannot be used in any standard statistical test. Instead, each song is taken here to be a single observation, represented by its overall tempo and its average chord length. 6 Average chord length was assessed in several ways, including the median chord duration in both bars and seconds. The mean chord duration for each song was also calculated, both in bars and seconds, but since the raw chord durations overall (shown in Figure 2[a]) indicate a non-linear distribution, the geometric mean (geomean) was used rather than the arithmetic mean.
The final step in data preparation was to discard any songs that did not have a meter of 4/4. It would have been interesting to study the relationship between perceived tempo and chord duration in songs with meters other than 4/4, but these three corpora do not include enough songs in other meters to allow for any strong inferences in that regard. The RS corpus, for example, includes only one song encoded in 3/4, one in 9/8, and six in 6/8. Moreover, tempo markings in meters other than 4/4 do not clearly correspond to tempo markings in 4/4, so there lurked the danger of making an apples-to-oranges comparison. Despite the various rounds of discarding songs described above, the remaining data set still comprised a large sample: after removing songs not in 4/4, songs with tempos greater than 240 bpm, and songs with no chord changes, the final data set included 158 songs from the RS corpus, 160 songs from the NN corpus, and 656 songs from the BB corpus. 7
Results
With data preparation complete, the two hypotheses described above could be tested. For the sake of fairness, it seemed worthwhile to investigate scenarios in which each of these hypotheses served as the null hypothesis. 8 The results of two sets of statistical tests are therefore reported. The first set of tests takes the null hypothesis to be that average chord length in bars is independent of tempo—that is, the relative hypothesis that chord lengths tend, on average, to last an ideal span of relative time, such as a bar. The second set of tests takes the null hypothesis to be that average chord length in seconds is independent of tempo—that is, the absolute hypothesis that chord lengths tend, on average, to last an ideal span of absolute time, such as 2 s.
Study 1
As one perspective, we can consider the extent to which the median chord length in bars predicts tempo. Taking the relative hypothesis as the null hypothesis, the median chord length in bars should provide no predictive value for tempo, since chords presumably tend to last a bar regardless of tempo. The absolute hypothesis offers the alternative, since it predicts that chords will tend to last a specific amount of time in seconds, regardless of tempo. By this alternative hypothesis, the median chord length in bars will be dependent on tempo, since songs with shorter chord lengths in bars will be slower on average, for example, so as to optimize chord duration in absolute time.
Exploratory data analysis showed that almost all median chord lengths in the three corpora took one of only three values: 0.5, 1.0, or 2.0 bars. It seemed reasonable, therefore, to consider the median chord length in bars as a factor with three levels. Summary statistics for songs with median chord lengths corresponding to 0.5, 1.0, and 2.0 bars are shown in Table 1. Note that roughly 90% of the songs in each corpus have median chord lengths that fall into these three categories. As Table 1 also shows, the most commonly occurring median chord length for a song is 1 bar, which verifies one of the central assumptions of the relative hypothesis.
Summary statistics for songs with median chord lengths of 0.5, 1.0, and 2.0 bars.
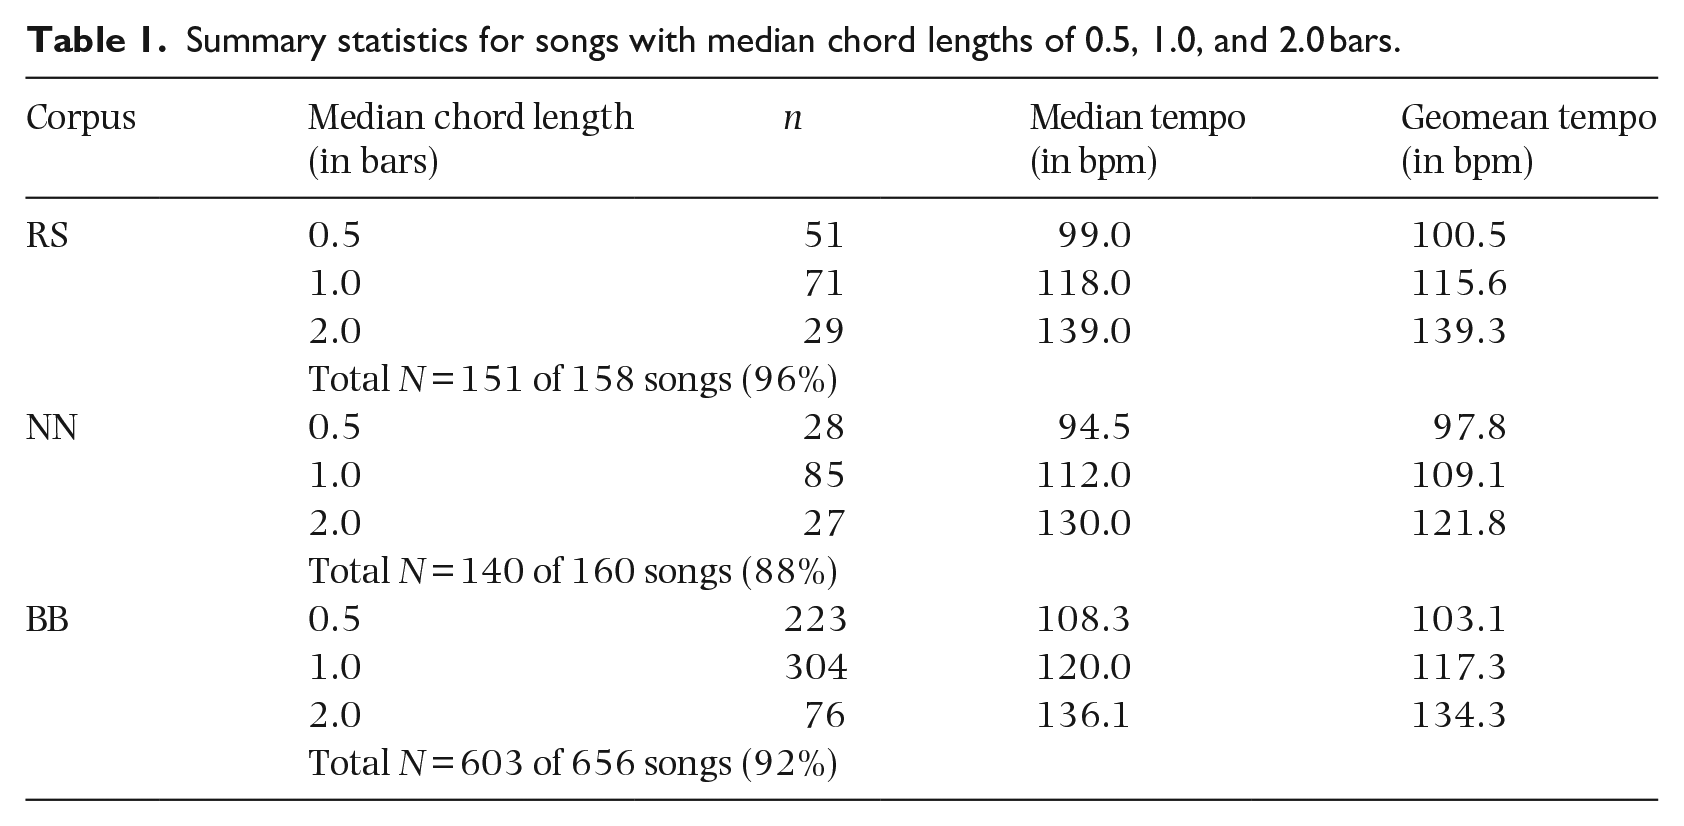
Looking at both the median tempo and geomean tempo for each level of median chord length shown in Table 1, however, it appears that as the median chord length in bars increases, the average tempo increases as well. 9 This observed trend offers some indication to reject the relative hypothesis, since the average chord duration in bars appears to not be strictly independent of tempo. Figure 3 shows boxplots for the quartile groups of each corpus, so as to visualize the distribution of tempo for each median chord length in bars. According to the relative hypothesis (the null hypothesis here), each boxplot should be expected to show a fairly similar median tempo and range of tempos for each median chord length. But the noticeable ascending trend of both the interquartile range and median tempo for each level of median chord length illustrates the apparent tendency for faster tempos to be associated with longer relative chord lengths (and vice versa), as predicted by the absolute hypothesis. In other words, as the average chord length in bars increases, the tempo increases as well.
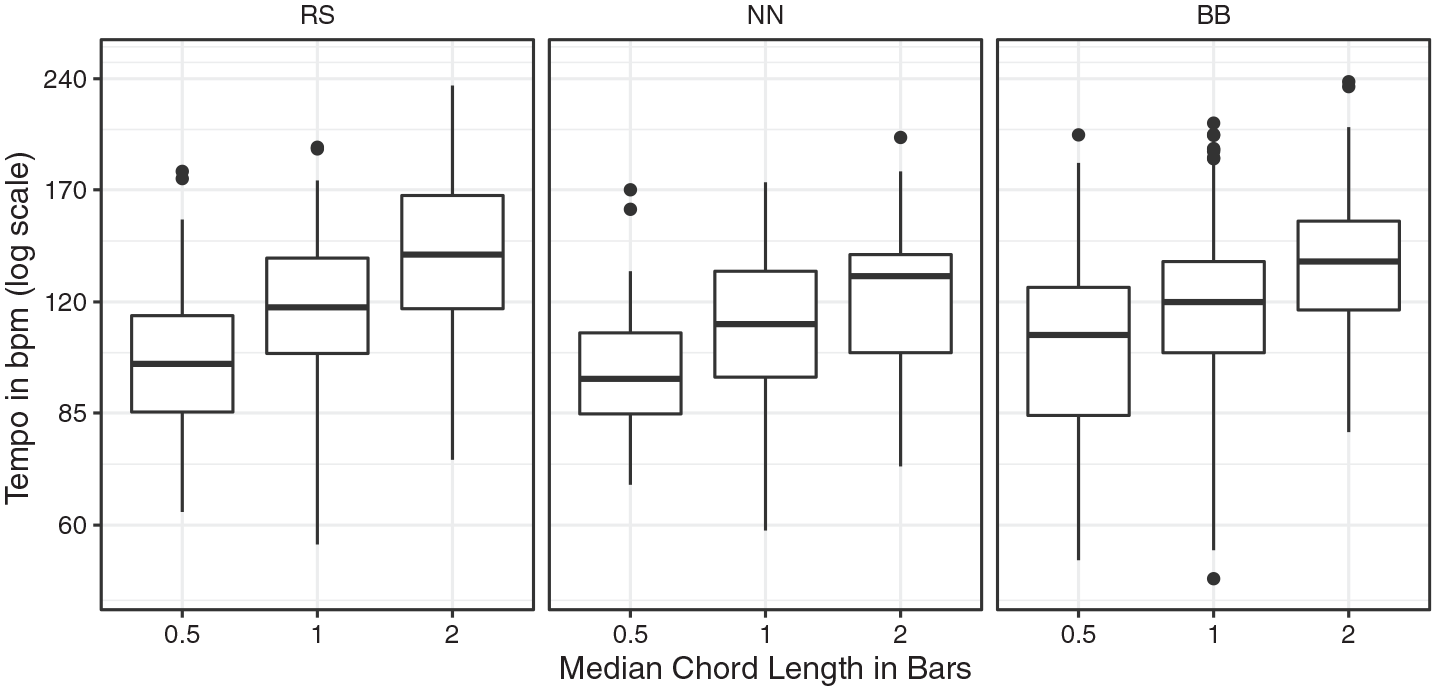
Quartile distributions of tempo (on a log scale) versus songs with median chord lengths of 0.5, 1, and 2 bars.
To investigate the trend illustrated in Figure 3 more rigorously, the results of a one-way analysis of variance (ANOVA) using the median chord length in bars as a predictor of the log transformation of tempo is shown in Table 2. As the p values in the rightmost column of Table 2 indicate, there is significant evidence to reject the null hypothesis that no difference in geomean tempo exists between the three levels of median chord length in bars. Note that an inspection of a Q–Q plot of the residuals reveals no strong departure from the assumption of normality for the error term, and an inspection of the residuals plotted against the fits reveals no strong departure from the assumption of homoscedasticity in the distribution of the error term. 10
One-way analysis of variance for factor levels based on median chord length in bars (0.5, 1.0, and 2.0) as a predictor of the log transformation of tempo.
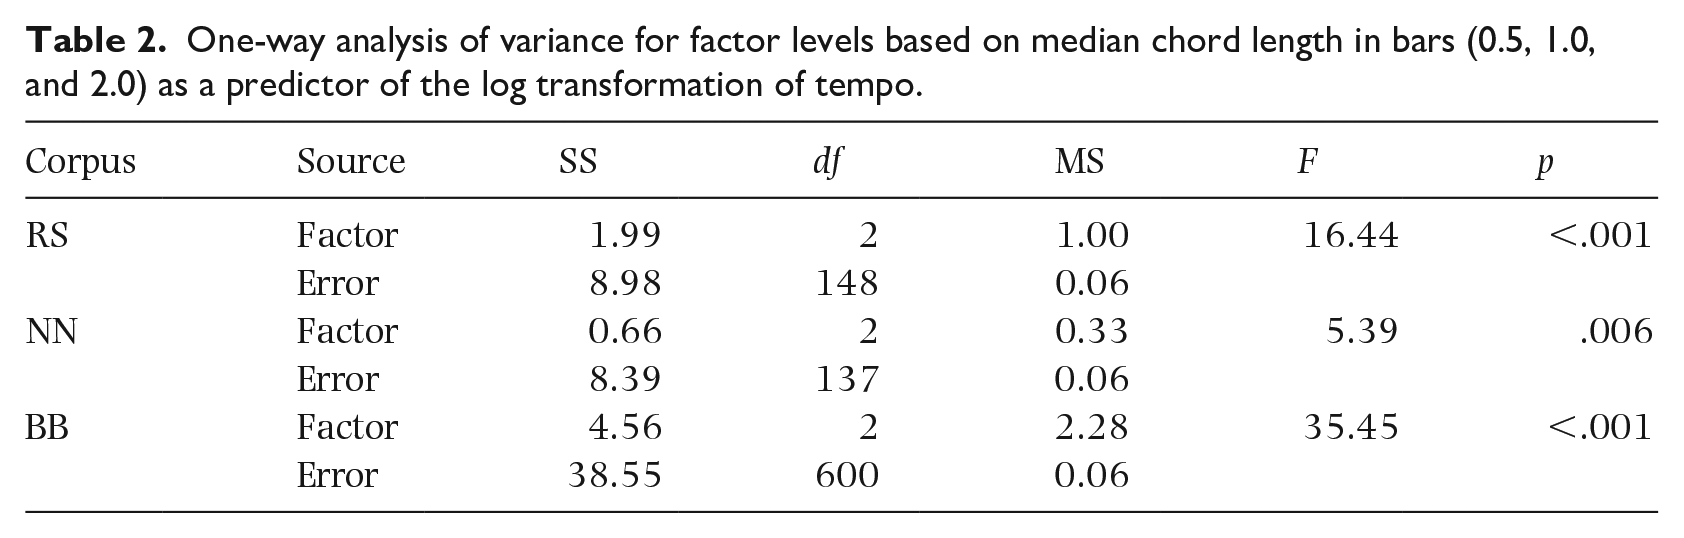
Before accepting the results shown in Table 2, however, it is worth discussing the appropriate α level here. Traditionally, an α level of .05 is used as the threshold for rejection, but this level typically presumes a single statistical test. Table 2, though, shows the results of three statistical tests, thereby increasing the probability of a Type I error. Moreover, three more three-part inferential tests were carried out, as described in the paragraphs that follow, for a total of 12 p values to be reported by the end of this section (excluding post-hoc tests). A conservative adjustment for these multiple comparisons would be a Bonferroni correction, bringing the α level for each individual test to about .004 (.05 divided by 12). With this revised threshold, the test results from the NN corpus appear to be on the verge of statistical significance. In this case, the results from the RS and BB corpora are perhaps enough to interpret the NN results as following a similar trend. Indeed, while post-hoc analysis of the NN corpus using Tukey’s honestly significant difference (HSD) test showed no significant differences between the geomean tempo for a median chord length of 1.0 bar as compared with median chord lengths of 0.5 or 2.0 bars, there was a significant difference (adjusted one-way p = .002) when comparing the geomean tempo for median chord lengths of 0.5 to 2.0 bars. In other words, the large-scale trend of increasing tempo with the increase in relative chord duration is present in the NN corpus, even if the variation within each group obscures a consistent pattern. Note that all three factor levels in the RS and BB corpus showed significant differences (adjusted one-way p < .004) in post-hoc testing.
But while the ANOVA results shown in Table 2 provide evidence to reject the hypothesis that the average chord length in bars is independent of tempo, its apparent dependence on tempo is not as strong as that implied by the absolute hypothesis. If songs were to employ average chord lengths that strictly adhered to some ideal length of absolute time, we would expect the median and geomean tempo values in Table 1 to double with a doubling of median chord length. This is not the case, however. Even the increase in average tempo from songs with a median chord length of 0.5 bar to those with a median chord length of 2.0 bars represents only about a 40% gain (e.g., from 99 to 139 bpm). Therefore, while there does appear to be a relationship between the tempo and the chord length in bars, it is not a one-to-one correspondence.
To assess this relationship better, Figure 4 shows a scatterplot of median chord length in bars versus tempo in beats per minute (both on log scales). Tempo is plotted on the X-axis, as though it were the predictor variable, primarily for ease of visualization. Note that Figure 4 includes all values of median chord length in bars, although the typical values of 0.5, 1.0, and 2.0 bars stand out clearly via the clustering of data points along those lines. The trend of increasing tempo with the increase in median chord length, observed in Figure 3, is seen here through the shifting density of the median chord length lines. For example, the line for a median chord length of 0.5 bar in the BB corpus is denser at slower tempos and sparser at faster tempos. Overall, there is a noticeable tiered effect, where the three horizontal data lines in each corpus shift up and to the right.
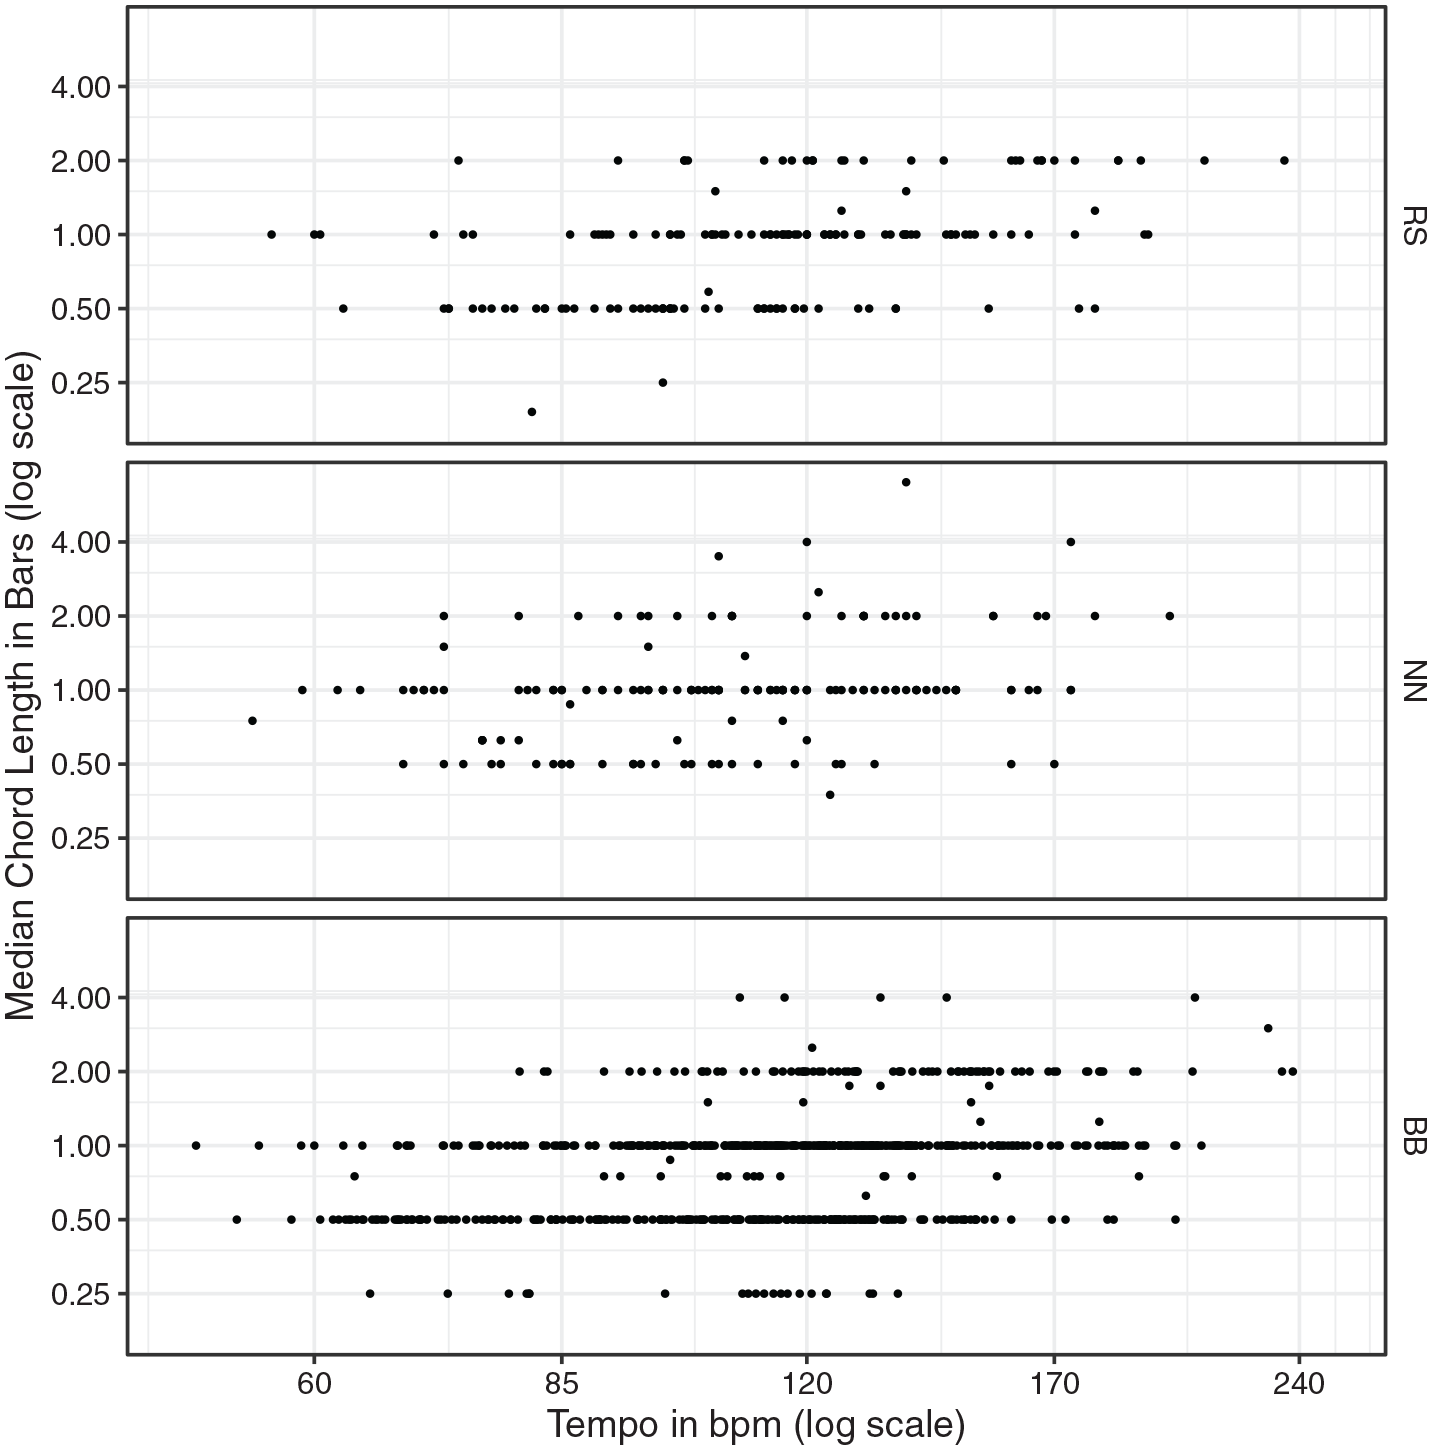
Scatterplot of median chord lengths in bars (on a log scale) versus tempo in beats per minute (on a log scale).
Although it would have been possible to conduct a regression analysis on the data shown in Figure 4, the clumping of values for the median chord length in bars creates some complications. A standard regression analysis was therefore carried out on the continuous set of data points provided by the geomean chord length in bars for each song. Figure 5 shows a scatterplot of geomean chord length in bars as predicted by the tempo in beats per minute, along with the ordinary least squares (OLS) regression line based on the log transformation of both variables.
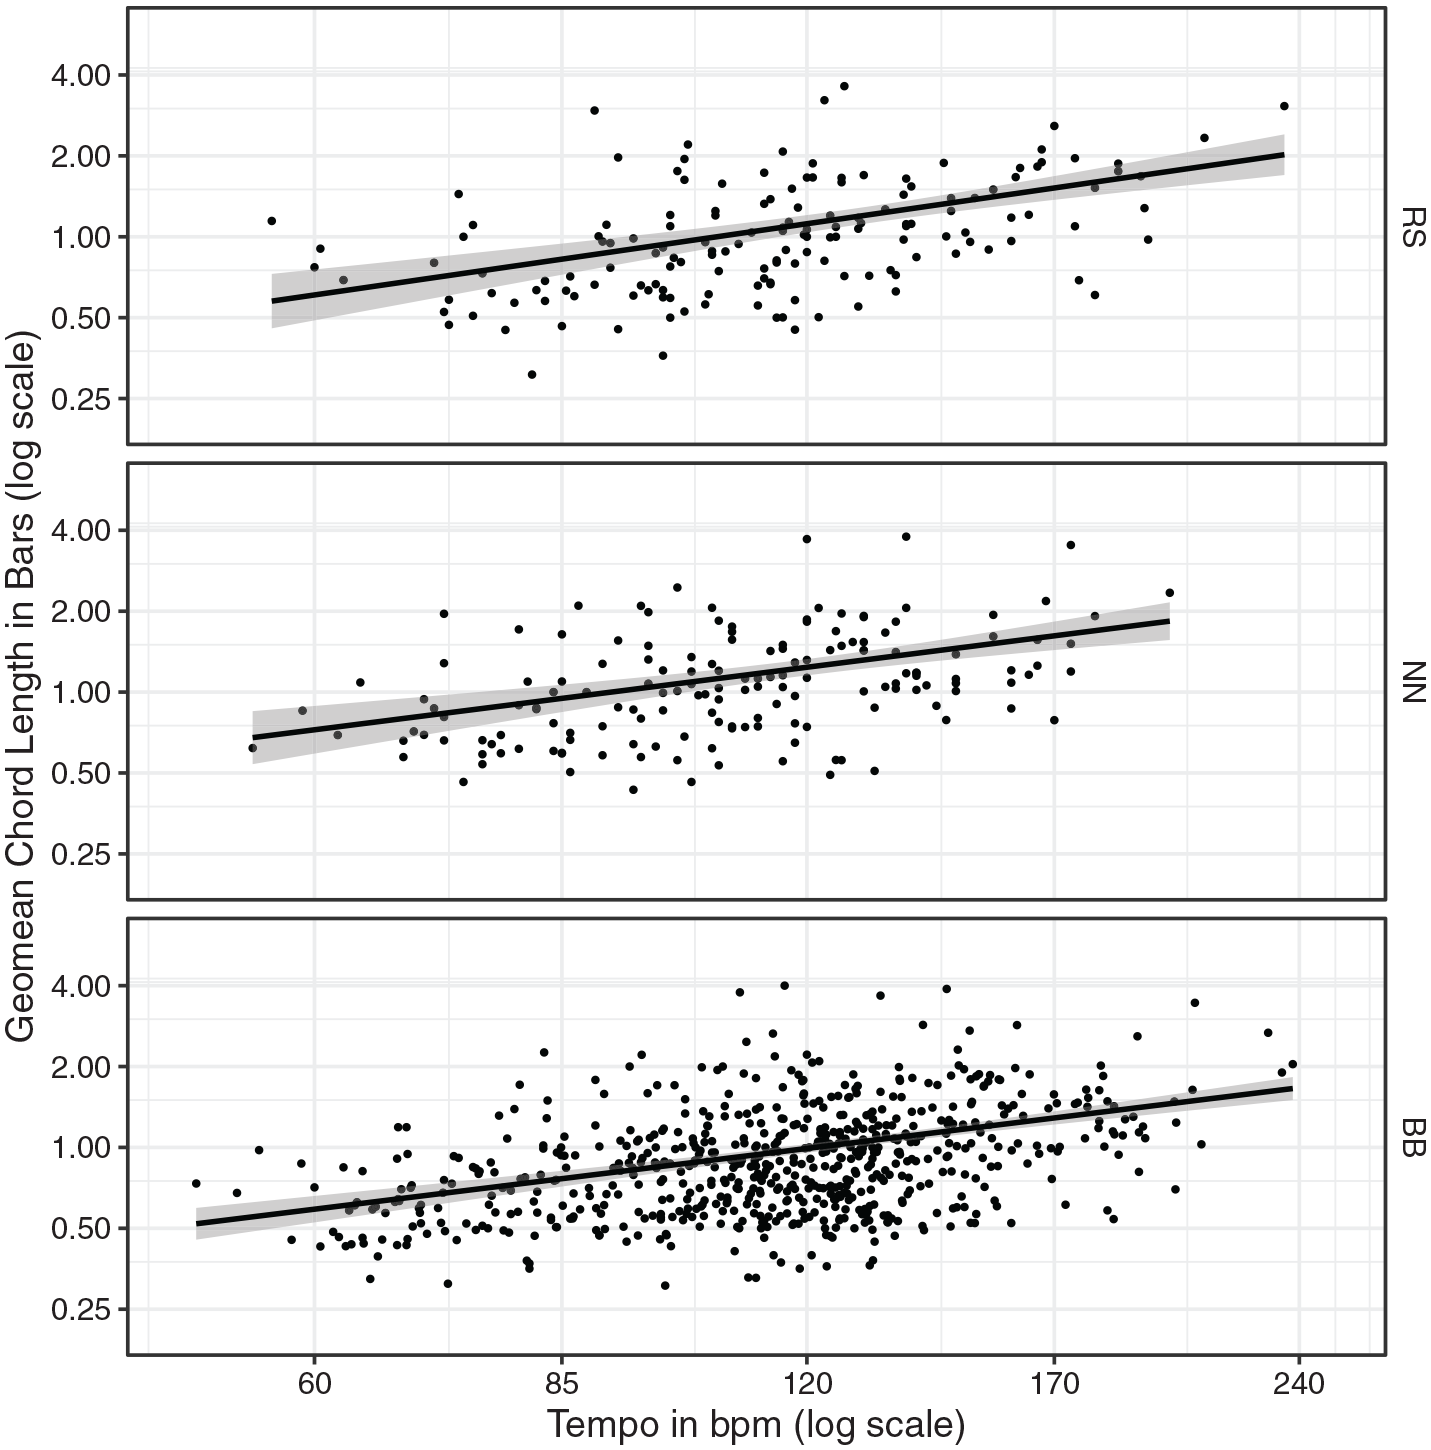
Scatterplot of geomean chord lengths in bars (on a log scale) versus tempo in beats per minute (on a log scale), showing the OLS regression line based on the log transformation of geomean chord length in bars as a function of the log transformation of tempo.
As the regression lines in Figure 5 indicate, there is a clear upward trajectory for chord length with the increase in tempo, as predicted by the absolute hypothesis. Table 3 shows the results of a simple linear regression analysis for the log transformation of geomean chord length in bars as predicted by the log transformation of tempo in beats per minute. The value for the Y-intercept estimate (a) is somewhat meaningless (i.e., the prediction for a tempo of 0 bpm), so the reported p value in the rightmost column refers to the slope coefficient estimate (b) alone.
Simple linear regression analysis of the log transformation of geomean chord length in bars as a function of the log transformation of tempo in beats per minute.
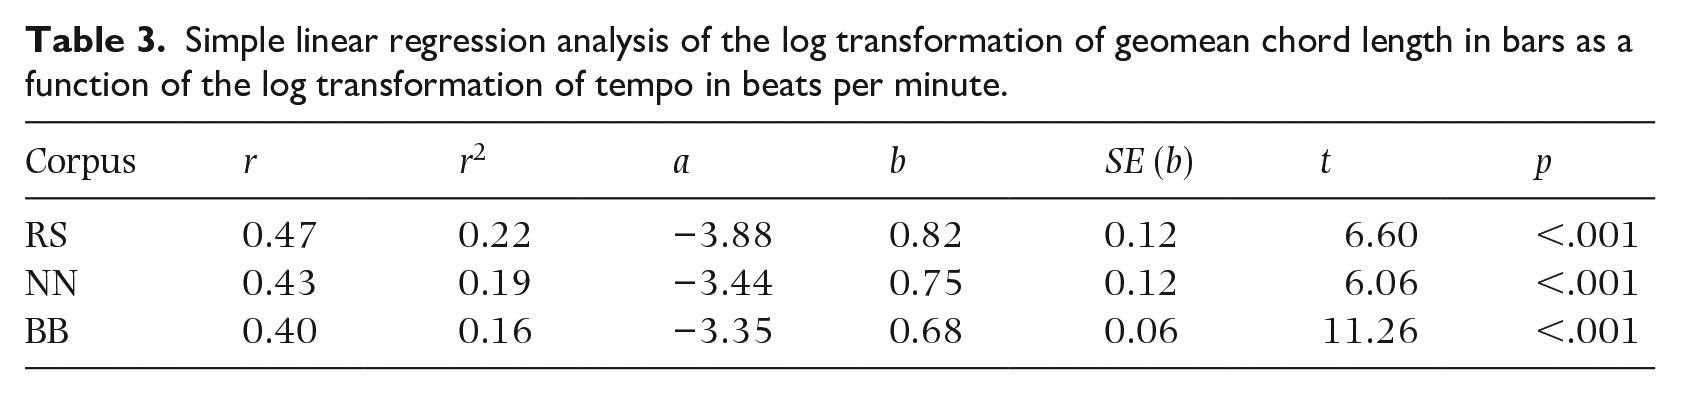
Even with the Bonferroni correction, these p values are low enough to provide evidence for rejecting the relative hypothesis that the average chord length in bars is independent of tempo. Be aware that the coefficients reported in Table 3 are based on log transformations of the variables, so they require some conversion to make a prediction in the original units. For a doubling of tempo in the RS corpus, the model predicts about a 76% increase in the geomean chord length in bars; for a doubling of tempo in the NN corpus, the model predicts about a 68% increase in the geomean chord length in bars; and for the BB corpus, the model predicts about a 60% increase in the geomean chord length in bars for a doubling of tempo. While the absolute hypothesis would predict a 100% increase in the geomean chord length in bars for a doubling of tempo, the percentage increase in relative chord length is closer to a doubling than a constant bar length as predicted by the relative hypothesis. Finally, note the r2 value, which indicates that a moderate amount of the variance—about 20%—in the geomean chord length in bars can be explained by tempo.
Study 2
In the first study, tempo was examined with respect to the average chord length in bars. But tempo can also be examined with respect to the average chord length in seconds. Taking this approach, the null and alternative hypotheses are swapped. The absolute hypothesis is now the null hypothesis, because it predicts that the average chord length in seconds will be independent of tempo. In other words, the null hypothesis now predicts that average chord lengths will tend to last some particular span of absolute time, such as 2 s, regardless of tempo. The relative hypothesis is now the alternative hypothesis, that average chord lengths as measured in seconds will be dependent on tempo. Specifically, this new alternative hypothesis predicts that faster songs will have shorter chord lengths in seconds (and vice versa), since the length of a bar becomes shorter in absolute time as the tempo increases.
One basic way to investigate the new null and alternative hypotheses is to group the songs into different tempo bins—for example, slow, medium, fast—and examine the average chord length for each bin. Do slower songs, for example, tend to have average chord lengths (in seconds) that are the same as faster songs? Admittedly, the binning process involves some loss of information, but musicians have historically grouped tempos into categories, such as Largo, Andante, and Allegro. The songs were thus divided into five tempo bins, which allowed for a “slower” bin (bin 1), a “medium” tempo bin (bin 3), and a “faster” bin (bin 5), as well as unused buffer bins (bins 2 and 4) that isolate the medium tempo bin from the other two bins. 11 Using this methodology, slower tempos ranged up to 90.5 bpm, medium tempos from 108.8 to 122.7 bpm, and faster tempos from 138.3 bpm upward.
Summary statistics for the three tempo bins of slower, medium, and faster are shown in Table 4. The rightmost column shows the grand geomean chord length in seconds for each tempo bin, which represents the geomean of the geomean chord lengths for all songs in that bin. The column to its left shows the grand median chord length in seconds for each tempo bin, which is the median of the median chord lengths for all songs in that bin. As the two rightmost columns show, average chord length, whether calculated via the median or the geomean, generally tends to be around 2 s, irrespective of the tempo bin. The results shown in Table 4 thus provide some initial, if not entirely conclusive, evidence in support of the hypothesis that average chord length in seconds is independent of tempo, that is, evidence against the relative hypothesis.
Summary statistics for songs with slower, medium, and faster tempos.
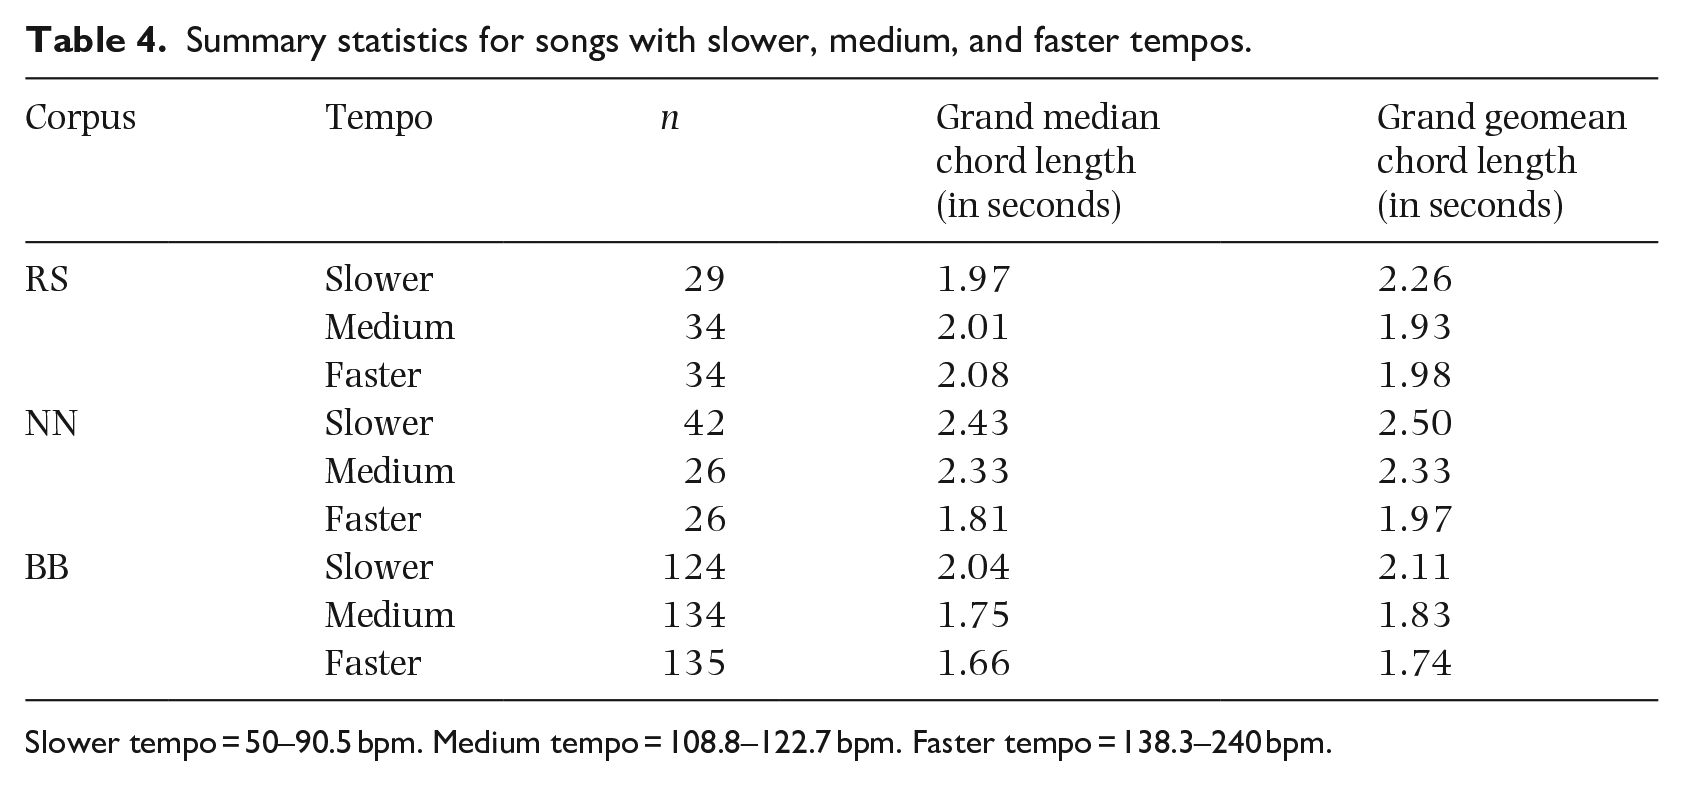
Slower tempo = 50–90.5 bpm. Medium tempo = 108.8–122.7 bpm. Faster tempo = 138.3–240 bpm.
To visualize the overall distribution of geomean chord lengths as it relates to tempo, Figure 6 shows boxplots of the quartile groups for each bin. Were the absolute (null) hypothesis to be supported, each boxplot would be expected to show a fairly similar distribution of geomean chord length in seconds for each tempo bin. Indeed, the boxplots tend to be roughly similar, especially in the case of the RS corpus. But some shifting can be observed, especially when looking at the faster tempo bin versus others in the NN corpus as well as the slower tempo bin versus others in the BB corpus.
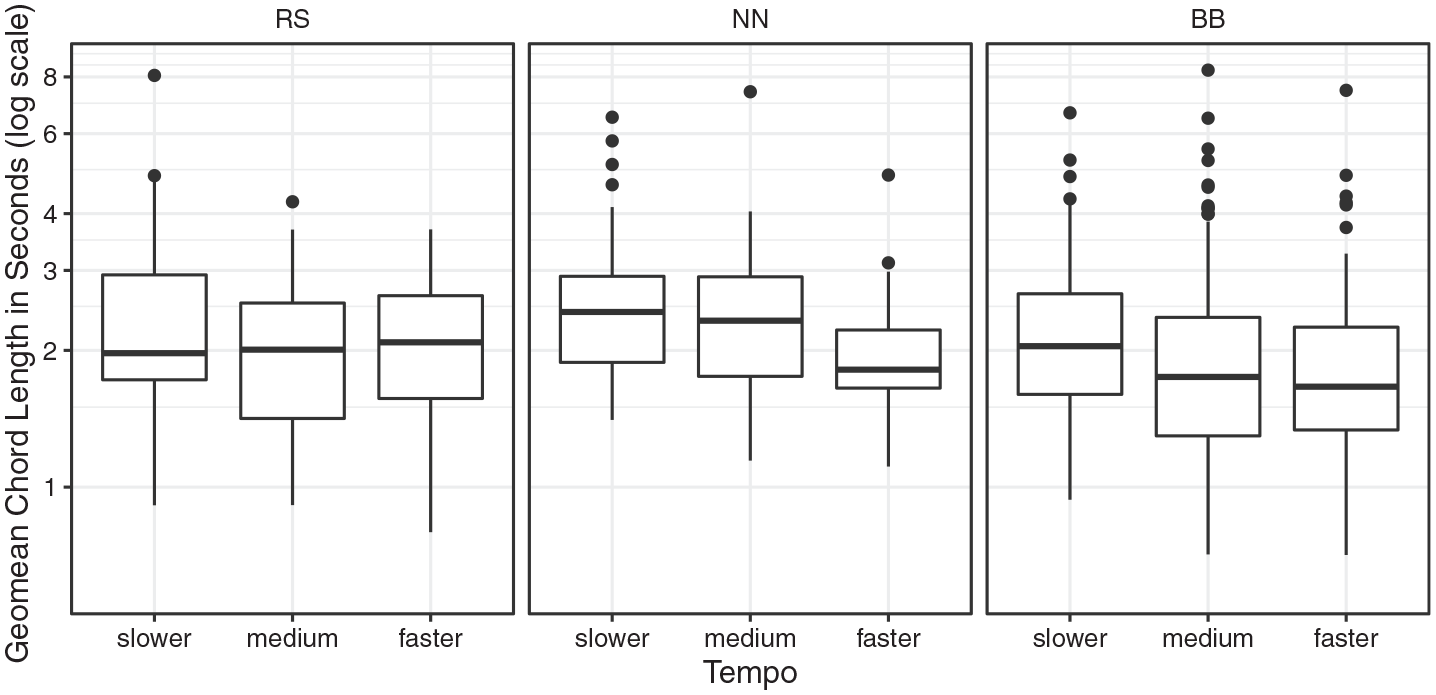
Quartile distributions of geomean chord lengths in seconds (on a log scale) versus three levels of tempo as factor (slower, medium, faster).
To find out whether the differences illustrated in Figure 6 were statistically significant, a one-way ANOVA was carried out using tempo as a factor with three levels (slower, medium, and faster) versus geomean chord length in seconds. The results are presented in Table 5 and, as the p values in the rightmost column indicate, there is no evidence (using the Bonferroni-corrected α level of .004) in the RS or NN corpus of a significant difference in the grand geomean chord length in seconds given different bins based on tempo. 12 In other words, there is no evidence to reject the null hypothesis that average chord length in seconds is the same regardless of tempo bin. That said, the ANOVA results do show evidence of a significant difference in average chord length between tempo bins for the BB corpus. In a post-hoc analysis using Tukey’s HSD test, the low p value in the ANOVA table is due entirely to the significant difference between the slower tempo bin and the other two bins (adjusted p < .001), with no significant difference found between the medium and faster bins.
One-way analysis of variance for factor levels based on tempo (slower, medium, faster) as a predictor of the log transformation of geomean chord length in seconds.
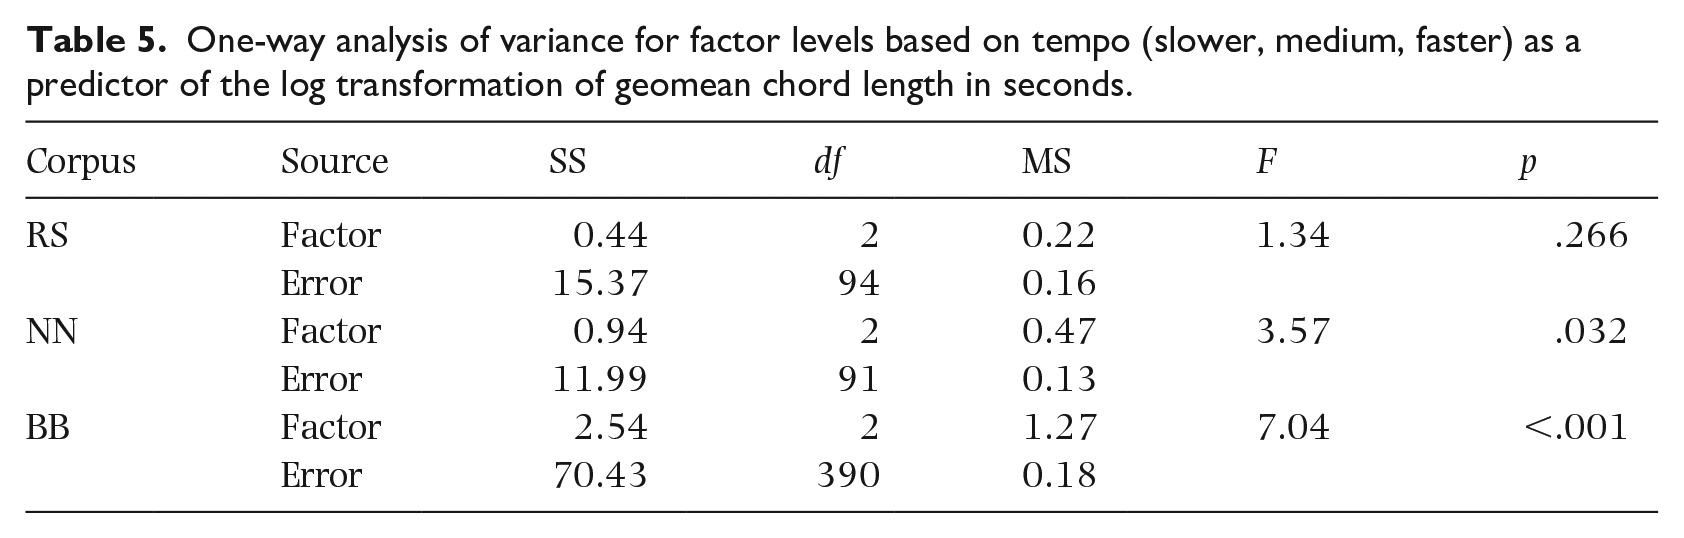
Out of the three sets of three tempo bins, therefore, only a single bin has a grand geomean chord length in seconds that differs significantly from the others in its set. Moreover, while this difference is statistically significant, Table 4 shows that it does not represent a very large difference in terms of seconds (specifically, 2.11 as compared with 1.83 and 1.74). So taking these results as a whole, there does not seem to be strong evidence to reject the null hypothesis that the average chord length in terms of absolute time tends to be independent of tempo.
Further evidence for this conclusion can be seen in Figure 7, where the median chord length in seconds is graphed versus tempo in beats per minute. The scatterplot in Figure 7 should be reminiscent of Figure 4, since they are essentially transformations of one another. Here again, we see the clustering of the data points along clear trend lines, representing median chord lengths of 0.5, 1.0, and 2.0 bars. If we follow any one of these lines in Figure 7, the median chord length in seconds appears to get shorter as the tempo increases (and vice versa). With this narrow perspective, therefore, the relative hypothesis appears to be supported.
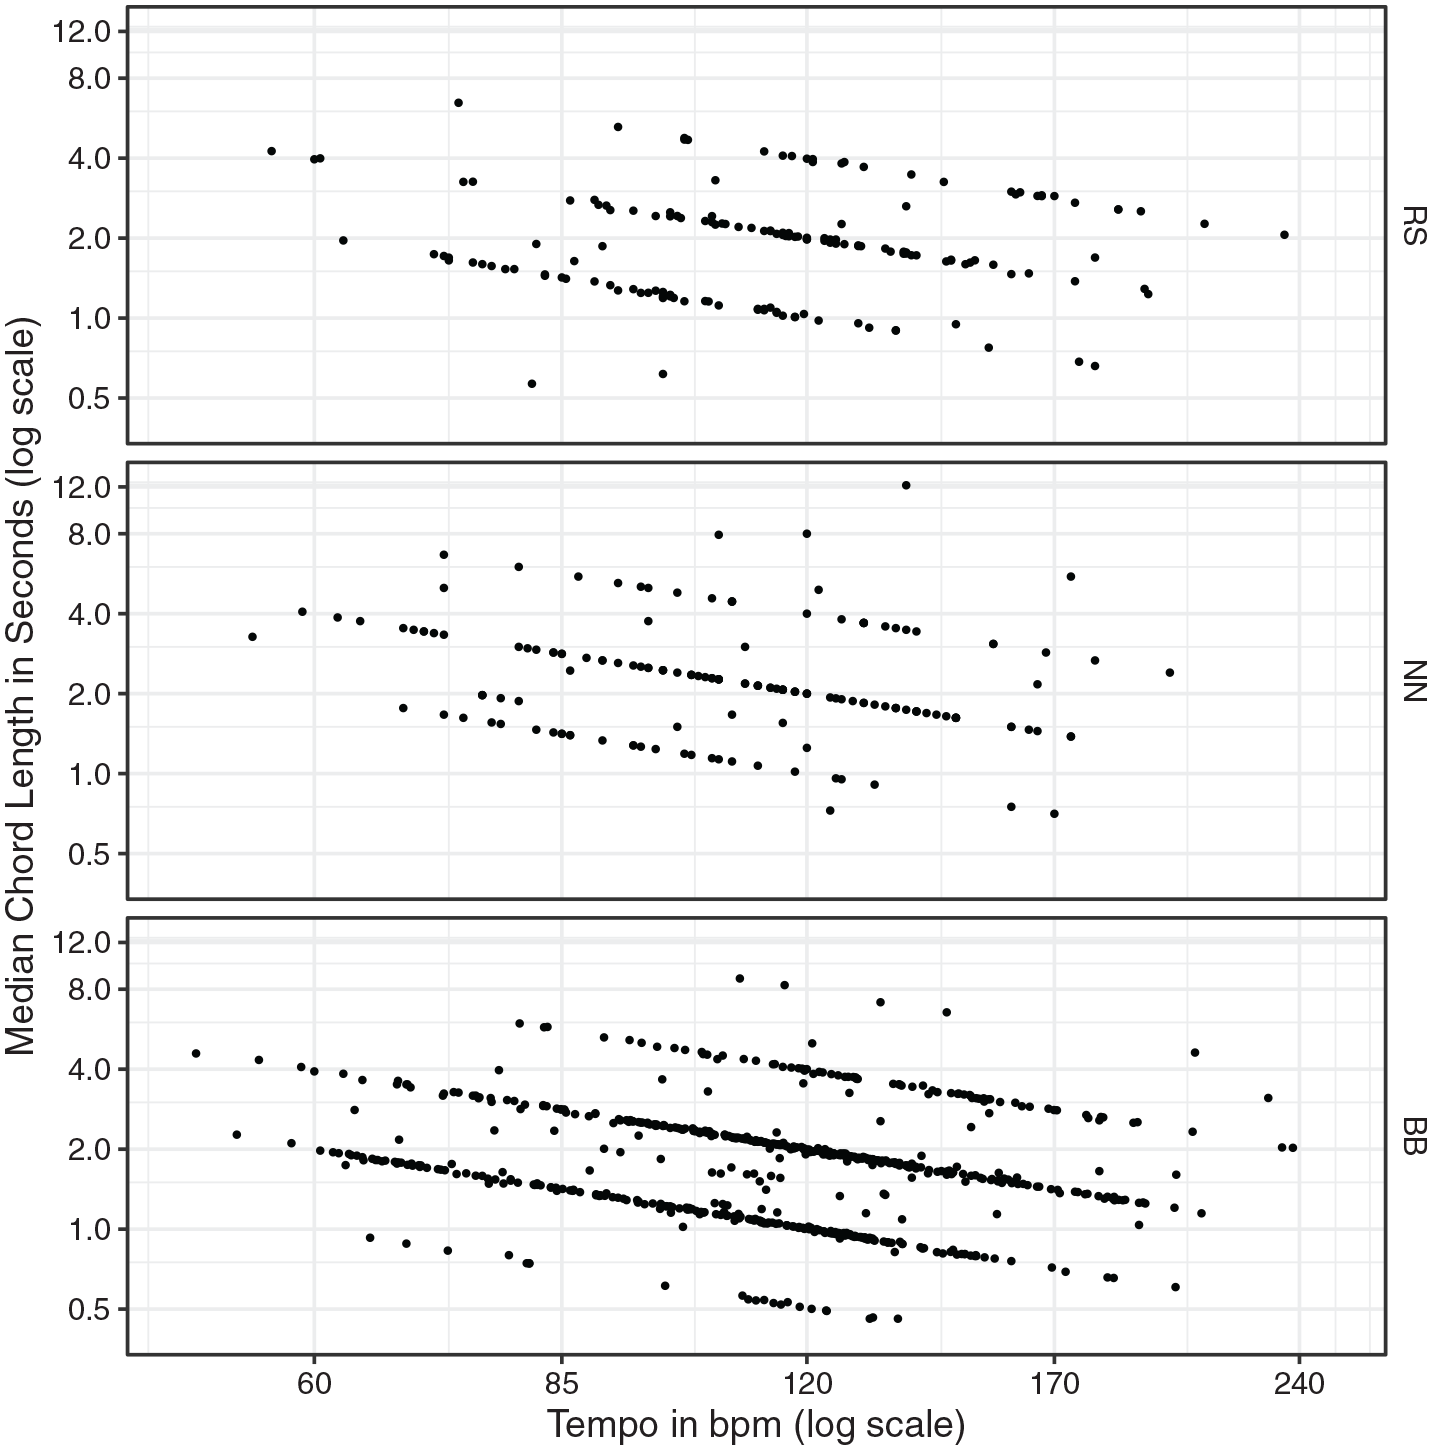
Scatterplot of median chord length in seconds (on a log scale) versus tempo in beats per minute (on a log scale).
Notice in Figure 7, however, that median chord lengths tend to stay bounded by about 1.0 s on the lower limit to about 4.0 s on the upper limit (with 2.0 s as the logarithmic midpoint), such that each descending group line for median chord length in seconds starts to significantly thin out (if not disappear) once it begins to stretch beyond these upper and lower limits. There are exceptions, of course, especially the cluster of songs in the BB corpus with median chord lengths around 0.5 s and tempos of around 120 bpm. But absolute time seems to be affecting average chord length, generally speaking, such that more songs have a longer median chord length in bars as the median chord length in seconds becomes unreasonably short with the increase in tempo (and vice versa).
As a final analysis, Figure 8 shows another scatterplot of average chord length versus tempo, but now using geomean chord length in seconds. According to the null hypothesis that average chord length in seconds is independent of tempo, the regression line would be expected to be flat. Yet for each corpus, the OLS regression line seems to have a slight downward trajectory, implying that chords do in general get shorter in terms of absolute time as tempo decreases. That said, the slopes do not appear to be very extreme in the negative direction, and thus the visual evidence against the absolute (null) hypothesis does not seem particularly strong.
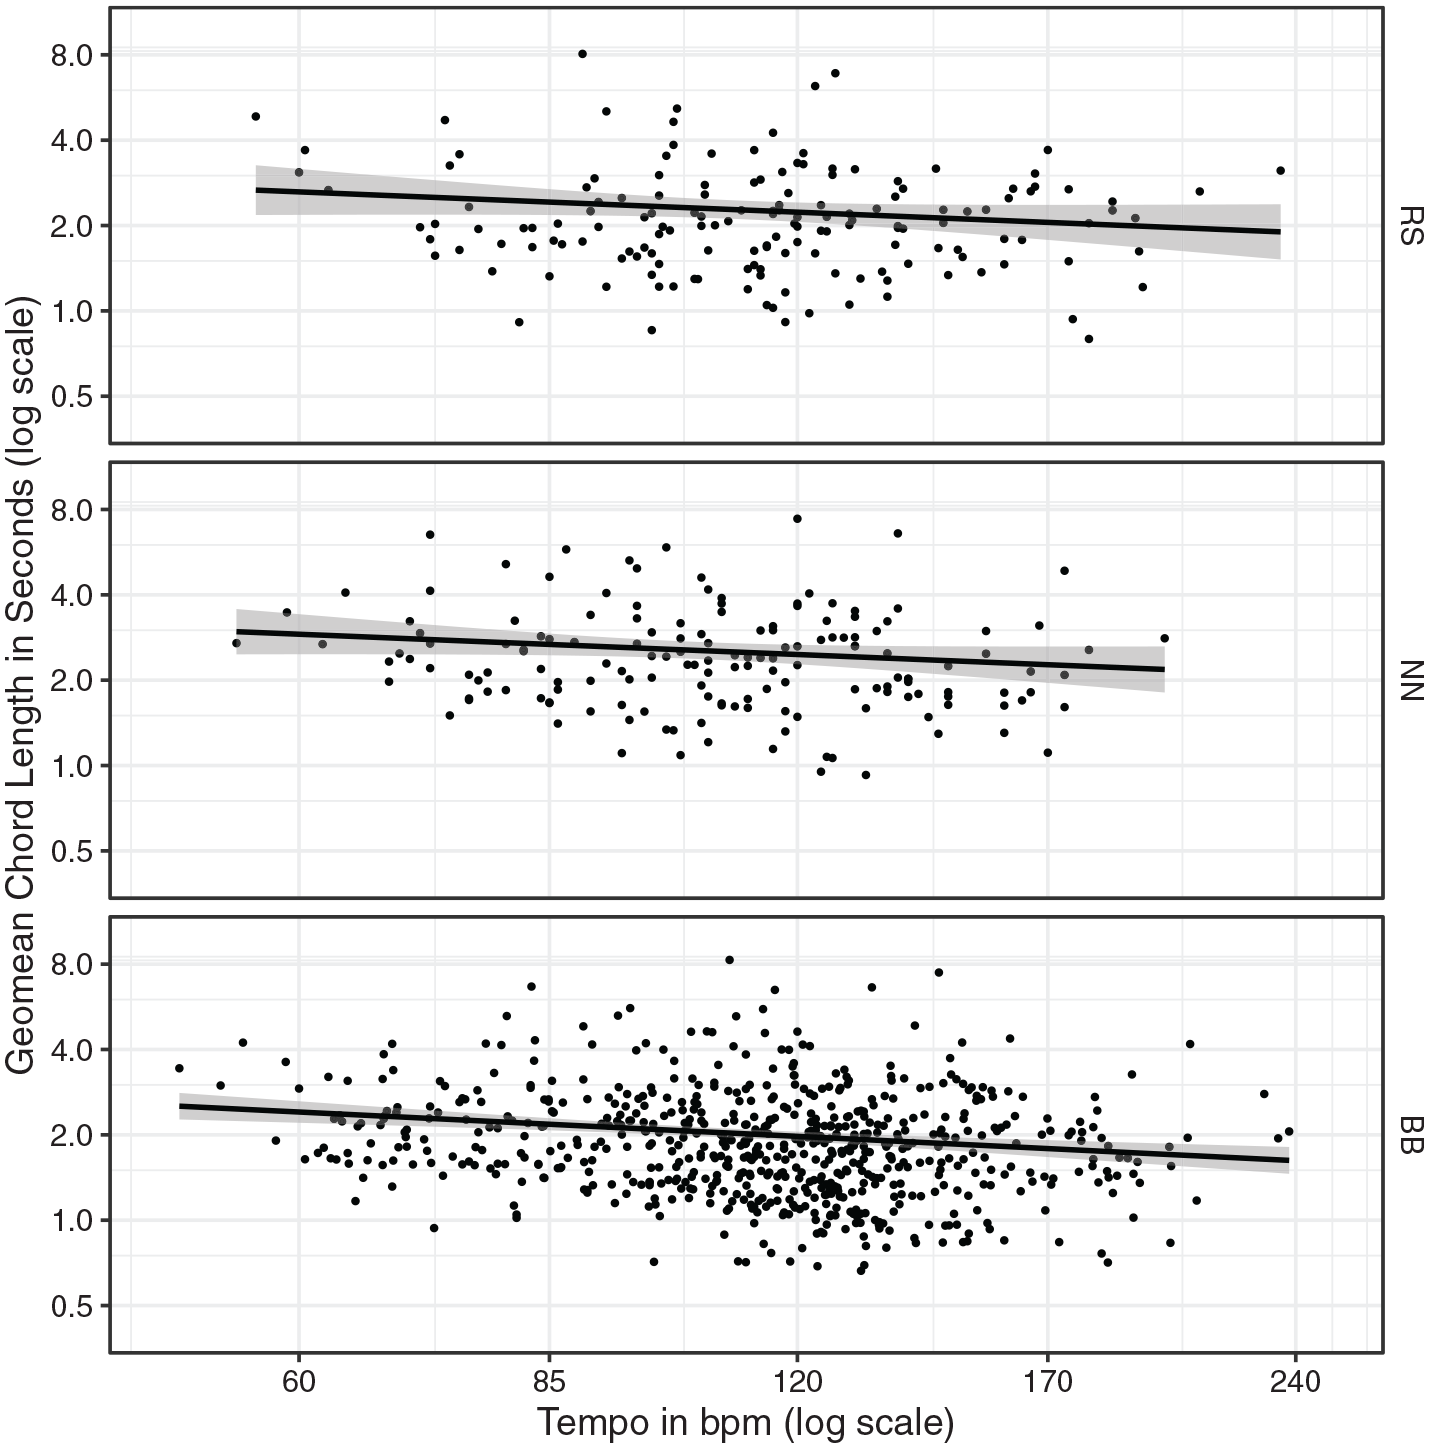
Scatterplot of geomean chord lengths in seconds (on a log scale) versus tempo in beats per minute (on a log scale), showing the OLS regression line based on the log transformation of geomean chord length in seconds as a function of the log transformation of tempo.
To assess the regression slopes shown in Figure 8 more formally, a simple linear regression analysis of the log transformation of geomean chord length in seconds as a function of the log transformation of tempo in beats per minute was conducted, with the results shown in Table 6. As in Table 3, the Y-intercept estimates (a) are essentially meaningless, and so the p values reported in Table 6 refer only to the slope coefficient estimates (b). Using the Bonferroni-corrected α level of .004, neither the slope coefficient for the RS or the NN corpus appears to be statistically significant. In other words, the downward slopes visible in Figure 8 for these two corpora are not sufficiently different from zero, given the variation in the data, to reject the null hypothesis that the true slope is zero. With the BB corpus, though, the slope is sufficiently extreme (and the data sufficiently numerous and lacking variance) to reject the null hypothesis, thus indicating that some consistent decrease in geomean chord length occurs with increasing tempo.
Simple linear regression analysis of the log transformation of geomean chord length in seconds as a function of the log transformation of tempo in beats per minute.
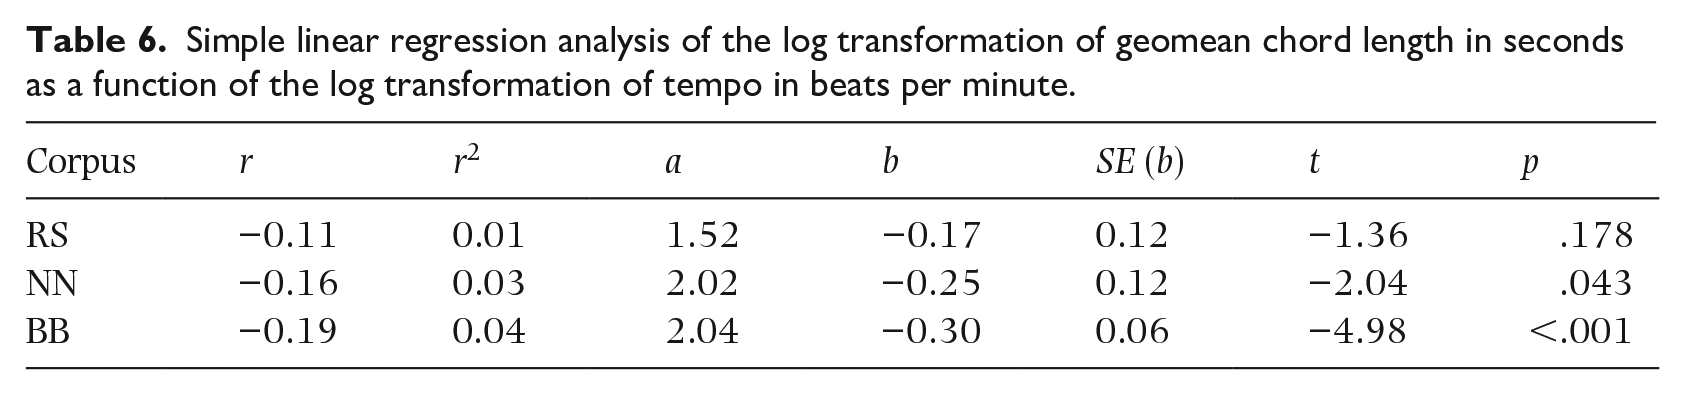
But while the slope for the BB corpus may be different enough from zero to show statistical significance, the magnitude of this slope (the effect size) is rather modest. As in Table 3, the regression coefficients in Table 6 are based on log transformations of the variables and thus require conversion for interpretation on the original scales. For a halving of tempo in the BB corpus, the model predicts only about a 23% increase in the geomean chord length in seconds. Compare this increase, for example, with the 60% increase in the geomean chord length in bars for the BB corpus given a doubling of tempo, as reported above. Stabilizing the average duration of chords in seconds thus appears to be a greater compositional priority than stabilizing the average duration of chords in bars.
The other result worth noting is how little of the variation in the absolute time data is explained by the variation in tempo. Recall that in Table 3, the r2 values showed that somewhere around 20% of the variance in geomean chord length in bars can be explained by tempo. As shown in Table 6, however, the r2 values indicate that only about 2% or 3% of the variance in geomean chord length in seconds can be explained by tempo. This result adds further evidence in support of the hypothesis that average chord length in seconds tends to be independent of tempo.
Discussion
Although this study was conducted to investigate the relationship between tempo and average chord length using a data set consisting of almost a thousand songs, it would be unreasonable to draw any definitive conclusions from it. Presumably, many factors influence the average chord lengths of songs, not limited solely to possible perceptual preferences for ideal chord lengths.
That said, the statistical tests described above show evidence that chord lengths in popular music tend on average to last an apparent ideal span of absolute time, somewhere in the vicinity of 2 s, regardless of tempo. This tendency is most notable when considering songs on a broad scale, such that slower songs tend to have average chord lengths that last shorter amounts of relative time (e.g., half a bar) and that faster songs tend to have average chord lengths that last longer amounts of relative time (e.g., two bars). When comparing smaller tempo differences, this tendency is noticeable only in the proportion of songs at a particular amount of relative time, since chord length is typically constrained by musical norms.
It is difficult at this stage to theorize why chord lengths would, on average, tend to last an ideal length of absolute time, regardless of tempo. Given that the music in these corpora are songs with vocal melodies and thus involve the delivery of lyrics, perhaps constraints on the rate of melodic change—such as ideal rates in the delivery of text—affect the rate of harmonic change. A follow-up study thus seems warranted on the rate of melodic change as compared with tempo. Unfortunately, few corpora exist that encode popular music melodies, given the time-consuming nature of encoding the exact rhythmic and pitch content of melodies in popular music.
A number of other questions remain unanswered. The fact that time signatures other than 4/4 had to be ignored in the current study suggests the need for a data set specifically designed to address non-standard meters in popular music. Also, different chord types such as tonic (I) or dominant (V) were not distinguished, and thus a follow-up study examining chord durations by harmonic function could be interesting. Future work might also investigate other grouping factors, such as musical style, mode (i.e., major vs minor keys), and the section of a song.
The aspect of the current study possibly most open to criticism is the categorization of a chord change as any difference in the encoded symbol. Using another definition, such as a change in bass only, might reveal results that less strongly support those found here; or maybe the findings would be even more strongly confirmed. Perhaps, though, the results reported above might offer some insight into this exact question. Looking at these three different corpora, average chord length for a song tends to be between 1 and 4 s. Examples outside this window exist, although anything less than half a second or greater than 8 s is extremely rare in this data set. These ranges might offer automatic chord transcription algorithms as well as music theorists a reality check on what may or may not be a chord, given the overall results of a particular chord change threshold on the average chord length for a song.
Another issue this research highlights is the potentially problematic nature of a single tempo designation. The main takeaway from the results reported above is that chord lengths in seconds tend on average to be independent of tempo, at least when examining these three corpora of popular music. It seems counterintuitive, though, that tempo ratings of popular music would appear to ignore harmonic rhythm, since tempo is supposed to capture the speed of a musical work and thus the pacing of its constituent components. Indeed, these results contradict previous music theory and music cognition work (discussed in the Introduction section) that posits a relationship between harmonic rhythm and tempo. Perhaps the contradiction arises because other musical elements, such as the drum pattern, are stronger factors, and these stronger factors are uncorrelated with harmonic rhythm. Ultimately, it is not clear that the speed of the various harmonic, melodic, and rhythmic layers in a song can (or should) be distilled into a single value such as tempo, even though listeners (and music annotators) are often asked to do so. More work thus remains to be done with regard to the tangled issue of speed and measurements of speed in popular music more generally.