
Abstract
The evolution of digital listening technologies continues to impact the way we think about music consumption and music listening practices. Krause and North’s (2016) findings suggest that, in addition to demographic characteristics, psychological constructs should be considered when investigating listening practices and technology use. The present study used latent profile analysis (LPA), a statistical technique that identifies latent subgroups within a population, to explore profiles of music listening in younger adults. We drew on data collected from 584 adults aged 17−35 (Mage = 19.61) residing in Australia (74.1% female and 23.3% male). Participants completed an online questionnaire that included demographics questions and established measures of musicianship, music engagement, music identity and format use. LPA identified four distinct profiles of listeners: disengaged consumers (5.8% of the sample), enthusiasts (14.2%) and two mainstream listening profiles differentiated by paid (52.6%) versus free streaming use (27.4%). Format use, music identity and music engagement were relevant differentiators of the listener profiles. Our findings indicate heterogeneity in young adult music listeners, pointing to how the constellation of these indicators shapes distinct patterns of engagement with music. Study findings further our theoretical understanding of how individuals consume music in everyday life with implications for future research aiming to unpack the distinct psychological and behavioural characteristics that shape different listeners.
Keywords
The continual evolution of digital music listening technologies influences music consumption practices (Greb et al., 2019; Krause et al., 2025), such that music listening is technologically mediated (Avdeeff, 2012). Even though listening technologies greatly impact listening practices, much of the research on their use is descriptive (e.g., in terms of demographics and usage) and does not consider consumer psychology theory (Krause & North, 2016). However, music psychology research demonstrates that identity (Krause & Brown, 2021; Krause & North, 2016), music engagement style (Brown & Krause, 2020; Heye & Lamont, 2010), and lifestyle factors (Assael, 2005) are associated with technology use. Furthermore, personality traits are associated with music consumption (Chamorro-Premuzic et al., 2012) and entertainment preferences (Rentfrow et al., 2010). Moreover, constructs from consumer psychology, including opinion leadership, innovativeness and self-efficacy, are associated with listening practices and technology use (Krause & North, 2016). Indeed, based on those findings, Krause and North (2016, p. 142) argued that ‘to understand how people interact with music in everyday life it is insufficient to merely map the demographic characteristics of the individuals concerned or to know how much time people spend with different listening devices’. Rather, psychological and behavioural constructs are informative for understanding broader listener practices.
However, there is no ‘one-size-fits-all’ approach to research on music consumption (Krause & Brown, 2021, p. 563). Often, young adults (18–35) are at the forefront of shifts in listening technology use. Yet, given the previous findings highlighting the impact of behavioural and psychological variables on music consumption, it is reasonable to expect that even within this cohort, there will be subgroups. Thus, we wanted to use a statistical approach to examine young adults’ contemporary listening experiences and practices to consider the nature of potential subgroups. One statistical approach that can be used is latent profile analysis (LPA).
LPA is a person-centred approach that aims to identify latent subgroups in a population based on continuous indicators (Spurk et al., 2020). LPA is a form of mixture modelling that identifies subgroups by modelling observed distributions of data as a combination of underlying, distinct distributions. LPA offers several advantages over traditional clustering methods, such as k-means and agglomerative clustering (Magidson & Vermunt, 2002; Stanley et al., 2017), because it consistently outperforms traditional methods at identifying the correct number of clusters (Magidson & Vermunt, 2002). LPA is also probabilistic in nature, thus allowing explicit modelling of classification uncertainty (Spurk et al., 2020). Thus, LPA provides a robust, data-driven and model-based approach for identifying heterogenous subgroups within a population. To our knowledge, only Ter Bogt et al. (2011) have used mixture modelling to identify music listener typologies. However, this study was limited in that it categorised listeners solely on the various ways they used music (e.g., for coping reasons, or for mood enhancement). Thus, adopting a wider range of psychological (e.g., music identity and engagement style) and behavioural indicators (i.e., listening amount and format usage) is warranted. Our overarching question asked whether it is possible to categorise younger adult music listeners. We aimed to identify possible typologies of music listeners through applying LPA on a range of psychological and contextual indicator variables. As this study was exploratory in nature, we made no hypotheses regarding the number, or nature, of possible latent profiles.
Method
Design
The current study sits within a larger research project examining people’s everyday listening behaviours pre- (collected August–October 2019) and peri-COVID-19 (collected March–November 2022) (see Krause, Glasser, Osborne, 2021, 2025; McKenzie et al., 2025). Individuals were asked to complete an online survey.
The Human Ethics Research committee at The University of Melbourne approved this research (HREC numbers: 1953591.1 and 2022-23129-24935-3). Convenience sampling was used, with participants recruited through SONA, a web-based platform for managing and recruiting participants for research studies, as well as through word of mouth and social media (e.g., Facebook and Twitter posts).
Participants
Individuals voluntarily took part in the research; however, those who participated through a university research participation scheme received course credit for participating. Given the focus on examining younger adults, data from individuals aged above 35 and residing outside of Australia were excluded. The pre-COVID19 dataset included data from 310 individuals and the peri-COVID19 dataset included data from 296 individuals.
As LPA requires complete cases, we used listwise deletion to remove participants with at least one missing data point across the chosen indicators. The final sample for LPAs consisted of n = 288 in the pre-Covid sample and n = 296 in the peri-Covid sample. To increase power for the analysis, we combined these two samples (N = 584). This combined sample had a mean age of 19.61 years (SD = 2.66; Mdn = 19), and consisted of 433 females (74.10%), 136 males (23.30%) and 15 nonbinary or gender nonconforming individuals (2.60%).
Materials and procedure
Survey administration and materials were hosted online using Qualtrics and were the same for both surveys. Individuals accessed the survey via a direct weblink to the information sheet and only completed the survey following their consent (indicated as a positive response to a direct question). Participants progressed through the survey as a series of webpages and were debriefed on the final page. Each survey took approximately 15 min to complete.
Participants were first asked to report their gender, age and postcode. Participants rated how important they considered music to be on a 7-point scale (1 = not at all, 7 = extremely; Krause, North, & Davidson, 2021; Krause et al., 2023) and indicated their highest level of musicianship, selecting from Kreutz et al.’s (2008) options (professional, semi-professional, amateur, occasional and hardly ever play or played).
We used the musicianship module of the MUSEBAQ (Chin et al., 2018, p. 393) as a brief measure of music background with respect to ‘both formal and informal music knowledge and practice’. Participants are asked to respond to two items regarding their training (e.g., ‘How many years of formal music training (theory) have you had?’) and use 5-point Likert-type scales to respond to four additional items (e.g., ‘How often did or do you practice or rehearse with an instrument or singing?’). Following Chin et al.’s (2018) recommendation, we used a principal components analysis on the six items to replicate a two-factor structure and derive scores for each component. This was performed on each subsample separately to examine whether both subsamples reproduced the original factor structure. Both subsamples demonstrated two components with similar loadings for the six items, in line with the original factor loadings shown by Chin et al. (2018) (Supplemental Table S1). Therefore, two component scores, one for formal music training (Cronbach’s α = .781) and one for music making (Cronbach’s α = .801; see Supplemental Table S1 for Cronbach’s α per subsample), were calculated, whereby higher scores reflect greater levels of music training and music making respectively.
Participants then completed Krause and Brown’s (2021) format use measure, which asks how often different formats are used to listen to music using a 7-point scale (1 = never, 7 = all the time). In this study, the formats included physical (i.e., CD, vinyl, cassette), digital files (e.g., mp3), free digital streaming, paid-for digital streaming, radio, YouTube and live music.
Participants completed Krause and Hargreaves’s (2013) musical self-images questionnaire. Krause and Hargreaves (2013) defined a two-factor structure, with four items addressing a ‘musical practitioner’ identity (e.g., ‘performer’, ‘composer’) and three items addressing a ‘music consumer’ identity (e.g., ‘listener’, ‘fan’). In our surveys, participants responded using a 7-point Likert-type scale (1 = clearly does not describe me, 7 = clearly describes me). Two average identity scores were produced, with higher scores indicative of stronger identity (Cronbach’s αs = .819 and .552 for the music practitioner and music consumer identities, respectively).
We measured listening styles using Greenberg and Rentfrow’s (2015) Music Engagement Test (MET). The MET uses 23 items to address five listening styles: cognitive (e.g., ‘When listening to music, I try to deconstruct the different elements of the song or composition’), social (e.g., ‘I feel a deep connection with my favourite musicians’), physical (e.g., ‘Music makes me want to jump up and down’), affective (e.g., ‘I am able to vent my frustrations through music’) and narrative (e.g., ‘When listening to music, I focus on the lyrics or sounds to understand the emotional content’). Participants rated how characteristic each item was concerning their general engagement with music using a 7-point response scale (1 = strongly disagree, 7 = strongly agree). Following Greenberg and Rentfrow’s (2015) coding, we produced five subscale averaged scores for each participant, where higher scores indicate greater propensity for listening in a given style. In the present study, Cronbach’s alphas for the cognitive, social, affective, physical and narrative subscales were .865, .798, .849, .839 and .881, respectively, consistent with previously reported reliability estimates (e.g., αs > .842 in Krause et al., 2023).
Data analysis
LPAs were conducted in R (version 4.4.2; R Core Team, 2024) using the mclust (version 6.1.1; Scrucca et al., 2016; Scrucca et al., 2023) and tidyLPA (version 1.1.0; Rosenberg et al., 2018) packages. The mclust package fits finite Gaussian mixture models for model-based clustering, while tidyLPA provides convenient helper functions around mclust. Maximum-likelihood estimation was used across all models. In total, 17 indicators were used in our LPA models: the music importance rating, two MUSEBAQ scores, seven music format usage ratings, two musical self-image scores and five MET scores. We standardised all indicators prior to fitting the LPA models to aid with interpreting the profiles.
We relied on the Bayesian information criterion (BIC), the integrated completed likelihood (ICL) and the bootstrapped likelihood ratio test (BLRT) to assess model fit. Lower BIC and ICL values indicate better model fit. Simulation studies suggest the BIC and ICL perform well at identifying the correct number of latent classes (Morgan et al., 2016; Nylund et al., 2007). The BLRT tests the change in minus 2 log likelihood (−2LL) between a model with k profiles and a model with k + 1 profiles (Nylund et al., 2007). Empirical p values for the BLRT are then estimated by bootstrapping a distribution for the change in −2LL between the two models. A nonsignificant (p > .05) change in −2LL indicates that the additional profile does not substantially improve model fit, and so the model with the lower number of profiles is preferred for parsimony.
To determine the final number of profiles, we fit models in three stages based on both theoretical considerations and empirical model fit. We aimed to balance statistical fit with interpretability and theoretical plausibility, in line with best practice for mixture modelling (Spurk et al., 2020). First, we fit models across all four model configurations available in tidyLPA, which specify whether the model variances and covariances are fixed to zero, equal or allowed to vary (Rosenberg et al., 2018). BIC and ICL values were examined to identify the best-fitting model configuration, taking into consideration the possible relationships between indicators (i.e., their variances and covariances). Second, after identifying the most suitable model configuration, we examined fit indices across models with varying numbers of profiles to identify an optimal number of profiles. Finally, we inspected visual plots of the models to assess their interpretability and opted for alternative models in cases where the model was not easily interpretable. The final model was reached via consensus among all authors.
Results
Model fit indices
Table 1 displays descriptive statistics for the 17 indicators used in the LPA for both samples, prior to standardisation. We then ran LPA models ranging from one to nine profiles and tidyLPA’s four model configurations to identify our initial model for refinement.
Descriptive statistics for the indicators in the latent profile analysis (N = 584).
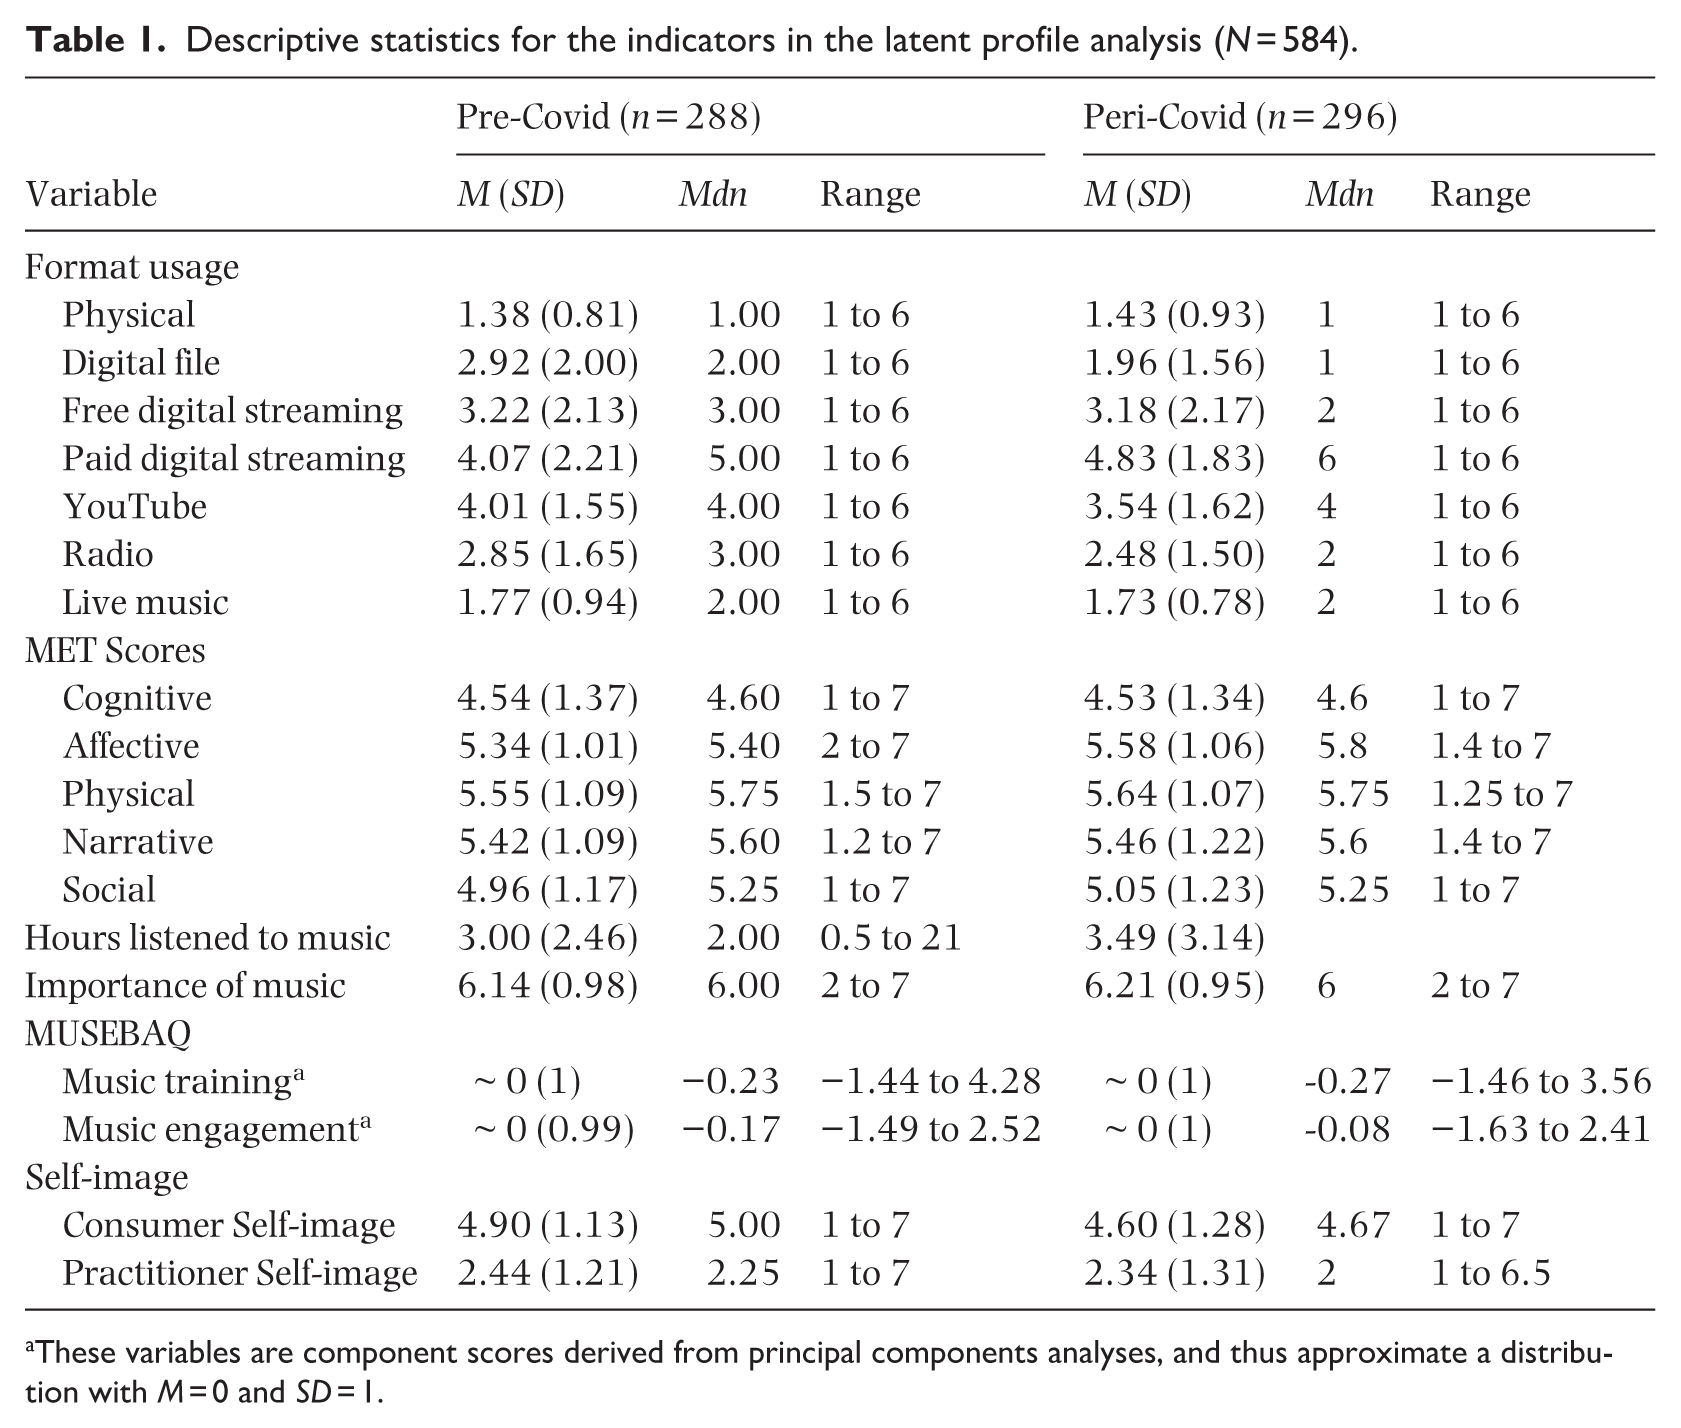
These variables are component scores derived from principal components analyses, and thus approximate a distribution with M = 0 and SD = 1.
BIC and ICL values across all models suggested that a five-profile model with free variances and zero covariances (‘VVI’ in mclust) provided the best statistical fit (Table 2). However, this model configuration assumes that the indicators within the model are completely uncorrelated (i.e., conditional independence of indicators). As we believed that this assumption was not realistic, we opted against using this model configuration for our analyses. Therefore, we opted for the next best-fitting model configuration. For a model with five profiles, an equal variance, equal covariance configuration (‘EEE’ in mclust) was the next best-fitting configuration.
Fit statistics for the LPA on the combined sample.
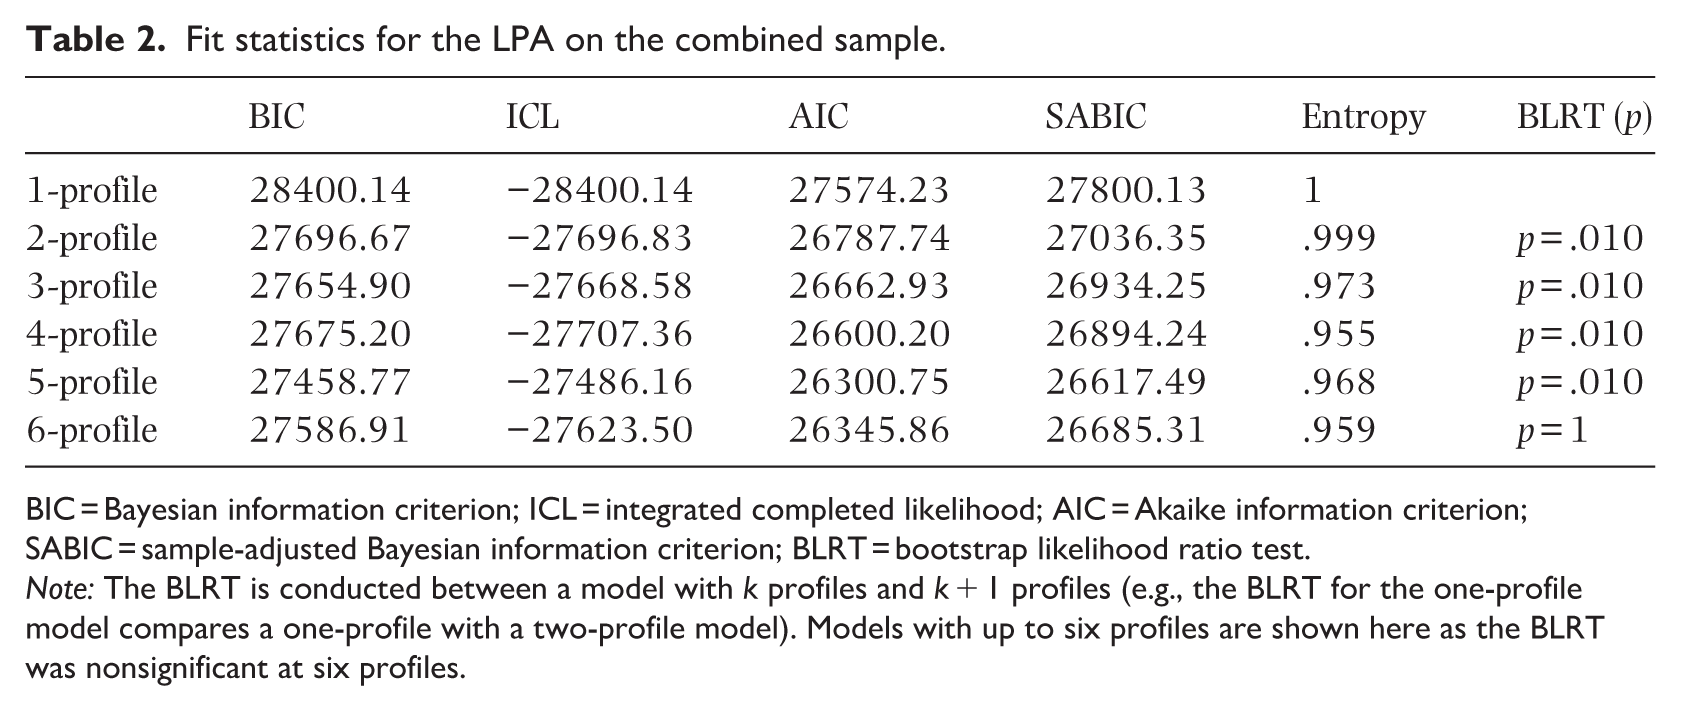
BIC = Bayesian information criterion; ICL = integrated completed likelihood; AIC = Akaike information criterion; SABIC = sample-adjusted Bayesian information criterion; BLRT = bootstrap likelihood ratio test.
Note: The BLRT is conducted between a model with k profiles and k + 1 profiles (e.g., the BLRT for the one-profile model compares a one-profile with a two-profile model). Models with up to six profiles are shown here as the BLRT was nonsignificant at six profiles.
Examining the fit indices for ‘EEE’ models ranging from one to nine profiles showed that a five-profile model provided optimal fit, as a six-profile model did not significantly improve fit (p = 1; Table 2). However, the resulting five profiles demonstrated substantial overlap. Visual inspection of a four-profile model yielded a more readily interpretable set of profiles (Figure 1). Thus, we opted to retain this four-profile model (with equal variances and covariances) to balance interpretability and theoretical considerations with adequate model fit. The final four-profile model maintained a high entropy (.955) with posterior classification probabilities between .963 and .999, indicating a sufficiently high level of separation between the profiles (Table 2).
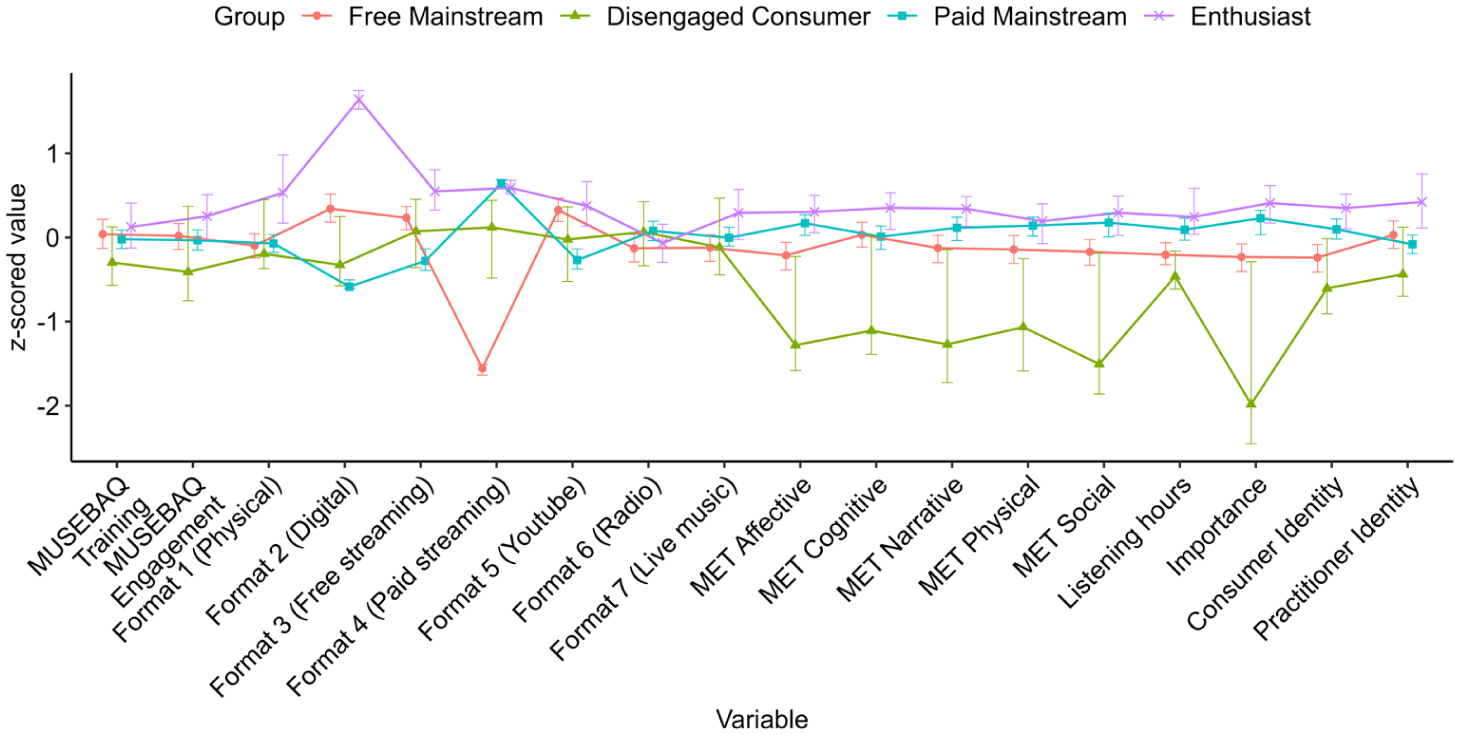
Profile plot of the four extracted latent profiles (n = 584).
Description of the model’s profiles
Figure 1 shows the profile plots for each profile across the indicators, with 95% bootstrapped confidence intervals. None of these profiles varied in terms of gender (Fisher’s exact test p = .126).
The ‘disengaged consumer’ (n = 34, 5.8%; depicted in green/triangles in Figure 1) was primarily characterised by lower engagement on the five MET dimensions compared with the three other profiles, as well as placing very low importance on music listening. In general, they were comparable with the other profiles on other measures, including format use, but were on the lower end for MUSEBAQ scores and self-image.
The ‘enthusiast’ profile (n = 83, 14.2%; depicted in purple/crosses in Figure 1) was largely defined by a greater usage of physical media for music listening. Participants in this group tended to have higher scores on the MET, reported slightly higher training and engagement, as well as a greater sense of importance and practitioner identity. Participants in this enthusiast group generally also had higher usage rates of other formats, except for radio usage (for which all profiles were similar).
The two remaining profiles constituted the greatest proportion of the total sample, and most of their average indicator scores fell between the enthusiast and disengaged consumer groups. These two groups also had very similar MUSEBAQ training and engagement scores, as well as that pertaining to a practitioner identity. Thus, we interpreted these profiles as being reflective of ‘typical’ or mainstream listeners. However, these two mainstream profiles were primarily differentiated by their use of free versus paid streaming services. One profile showed noticeably greater usage of both free streaming and digital file collections, while reporting the lowest amount of paid streaming usage. We, therefore, labelled this group as the ‘free mainstream listener’ (n = 160, 27.4%; depicted in orange/circles in Figure 1). This pattern of results was flipped in the other mainstream profile (n = 307, 52.6%; depicted in blue/squares in Figure 1), which we termed the ‘paid mainstream listener’. Namely, this ‘paid’ profile was characterised by greater usage of paid streaming and the lowest usage of both digital files and free streaming services. In other words, the primary differentiator between the two mainstream profiles appeared to be a willingness to pay for streaming services. The paid group also had slightly higher MET scores and listening hours, and rated music as being slightly more important than the free mainstream group.
Discussion
Our LPA results indicate that we can categorise younger adult listeners into four profiles: one disengaged group, one enthusiast group and two mainstream groups differentiated by streaming use. Notably, our findings imply that we cannot assume listeners are homogenous or that they behave the same way. Substantial and meaningful variation in listener habits is evident even in a sample of younger adults, who – largely from a technology use perspective – are often grouped together with an assumption that they engage in music quite similarly.
Importantly, the distinction between these profiles is not by listening amount, but by a combination of variables, including both technology use (notably format usage) as well as identity and engagement (including musical training) variables. The present findings advance Krause and North’s (2016) argument that understanding how people interact with music in everyday life demands more than simply mapping demographic characteristics of people or relying on hours of listening time alone. We also show that meaningful profiles can be delineated beyond the why of music use (see Ter Bogt et al., 2011). Our study reveals pertinent differences in music listening engagement arising from an interdependent constellation of behavioural and psychological variables. We suggest that these variables collectively shape younger adults’ listening motivations and practices – as reflected by the distinct listener profiles.
We also acknowledge that our final profiles depended on the variables we included in our models. Naturally, a different set of indicator variables would likely result in slightly different profiles. It is possible that future work may identify more typologies, particularly if more contextual and psychological factors are incorporated. Our variables were chosen for their possible relevance for differentiating listener habits based on prior research and provide a starting point for identifying and refining these typologies in future research. To that end, it is important to remember that people’s listening experiences are interdependent on individual differences, features of the music and contextual features (as outlined by the Reciprocal Feedback Model - Hargreaves, 2012). Thus, it is important that future research continue to consider the role of context in defining people’s listening experiences (Greb et al., 2019; Krause et al., 2015).
Our sample consisted of younger, predominantly female adults residing in Australia, and so our findings may not be representative of listeners of other genders, ages or those residing elsewhere. Future research may be refined through the use of a representative sample as well as data from multiple countries, which would afford an opportunity to consider any cultural differences in typologies (beyond investigations of universal responses to Western music as studied by Greenberg et al., 2022). In addition, though it is clear that music engagement is technologically dependent (Avdeeff, 2012), one drawback to the present analysis concerning format use is that digital listening technologies continue to evolve (e.g., artificial intelligence). Focusing on the uses and gratifications that different formats and technologies afford users may be a more robust strategy moving forward (Krause & Brown, 2021, 2022). Such careful consideration of technology is warranted, given prior research has demonstrated its influence on music listening experiences (e.g., Krause et al., 2015) and because why and how people listen to music are tightly linked. Thus, the continued use of data-driven modelling to understand listener profiles and habits will be fruitful.
Supplemental Material
sj-docx-1-msx-10.1177_10298649261419800 – Supplemental material for Latent profile analysis reveals four distinct younger adult music listener typologies
Supplemental material, sj-docx-1-msx-10.1177_10298649261419800 for Latent profile analysis reveals four distinct younger adult music listener typologies by Amanda E Krause, Daniel Yeom, Sabrina M McKenzie, Solange Glasser and Margaret S Osborne in Musicae Scientiae
Footnotes
Acknowledgements
The authors express sincere gratitude to all individuals who participated in this research and wish to thank participants of the Australian Music & Psychology Society’s 2024 conference for their early feedback on this project. As noted in the manuscript, this research is part of a wider programme of research concerning everyday music listening practices (see Krause et al., 2025; Krause, Glasser, Osborne, 2021; McKenzie, et al., 2025).
Ethical approval
The study was approved by the University of Melbourne Human Research Ethics Committee (IDs: 1953591.1 and 2022-23129-24935-3).
Author contributions
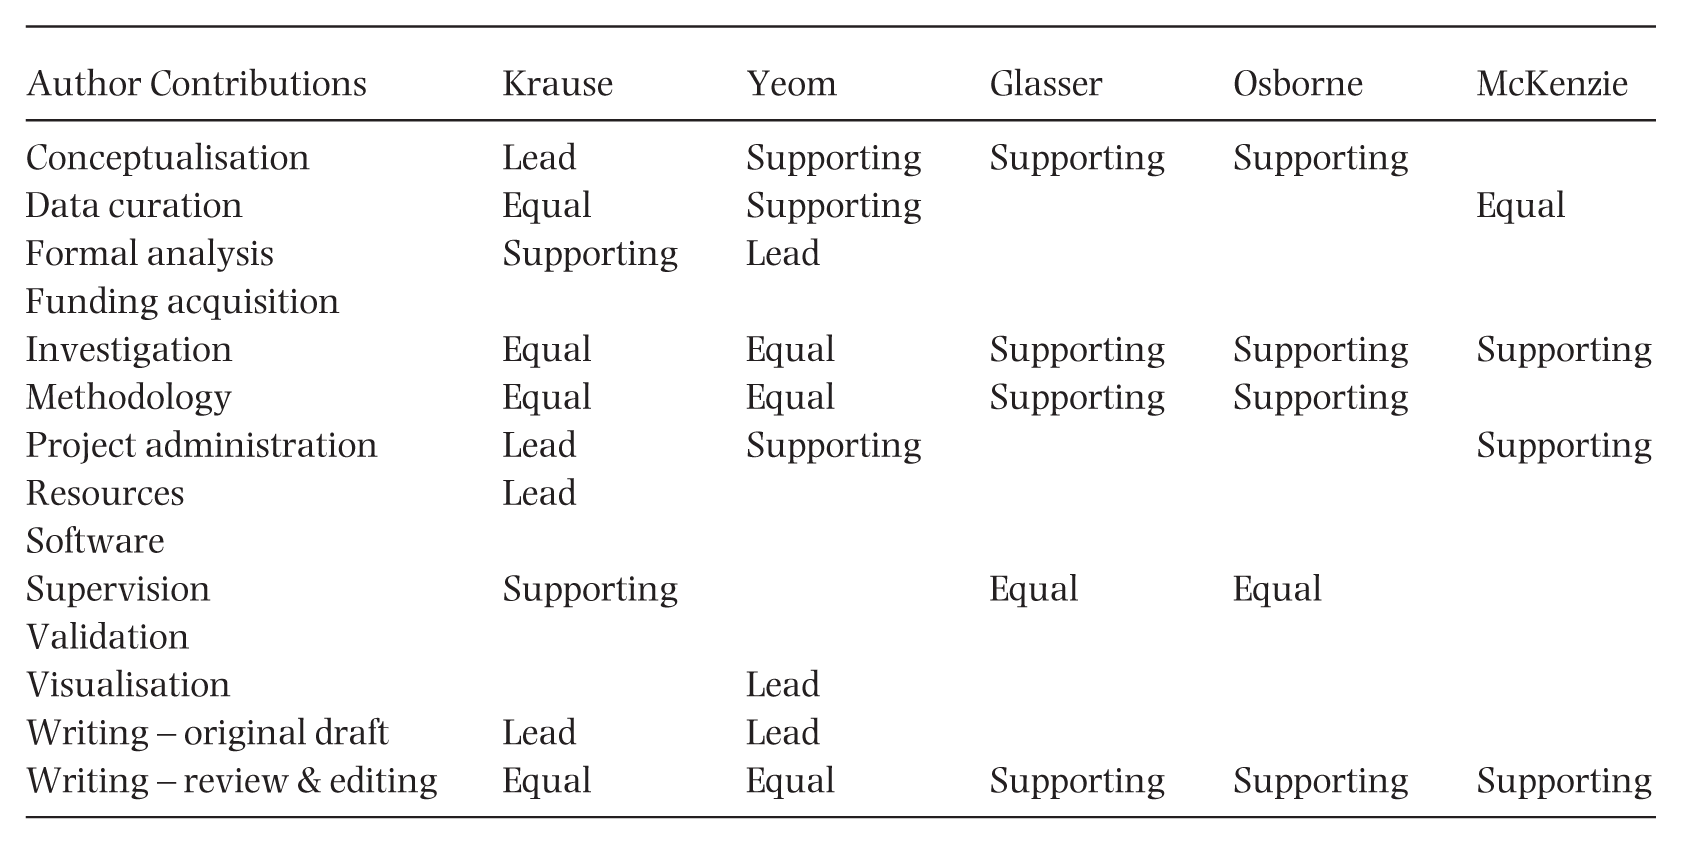
| Author Contributions | Krause | Yeom | Glasser | Osborne | McKenzie |
|---|---|---|---|---|---|
| Conceptualisation | Lead | Supporting | Supporting | Supporting | |
| Data curation | Equal | Supporting | Equal | ||
| Formal analysis | Supporting | Lead | |||
| Funding acquisition | |||||
| Investigation | Equal | Equal | Supporting | Supporting | Supporting |
| Methodology | Equal | Equal | Supporting | Supporting | |
| Project administration | Lead | Supporting | Supporting | ||
| Resources | Lead | ||||
| Software | |||||
| Supervision | Supporting | Equal | Equal | ||
| Validation | |||||
| Visualisation | Lead | ||||
| Writing – original draft | Lead | Lead | |||
| Writing – review & editing | Equal | Equal | Supporting | Supporting | Supporting |
Funding
The authors received no financial support for the research, authorship and/or publication of this article.
Declaration of conflicting interests
The authors declared no potential conflicts of interest with respect to the research, authorship and/or publication of this article.
Data statement
Supplemental material
Supplemental material for this article is available online.
References
Supplementary Material
Please find the following supplemental material available below.
For Open Access articles published under a Creative Commons License, all supplemental material carries the same license as the article it is associated with.
For non-Open Access articles published, all supplemental material carries a non-exclusive license, and permission requests for re-use of supplemental material or any part of supplemental material shall be sent directly to the copyright owner as specified in the copyright notice associated with the article.