






Abstract
Not all green collar work is created equal, yet measures of its sustainability, cast against the triple bottom line that underlies the Sustainable Development Goals (People, Planet, Prosperity) remain under-developed. We applied a published protocol for indexing sustainable livelihoods identifying, rating and ranking the 10 most sustainable green collar livelihoods in contemporary New Zealand. The resulting mini-index of sustainable livelihoods provides a proof-of-concept for combining with the remaining 12 livelihood collars identified in the Wheel of Work. Responding to the International Labor Organization's (ILO) identification of decent work, poverty eradication and environmental sustainability as most significant challenges for the twenty-first century, this pilot study is the first step in the development of a full Sustainable Livelihoods Index (SL-I). More than structures of decent work, an SL-I will help guide and incentivize multiple directly invested groups - students, organizations, and government workforce development agencies - towards comparatively sustainable forms of livelihood that protect, people, planet and prosperity.
Introduction
Work has long been at the core of calls for green initiatives, from green practices at work (Ones & Dilchert, 2012) to wider interfaces between the means of production and the preservation of our eco-system (Di Fabio, 2017; Jones, 2017). More recently, these calls have spread to jobs themselves, which have begun to be categorized as ‘green’, meaning ecologically sustainable (Bohnenberger, 2022). A wider ambit for such calls, though, is the concept of a ‘just transition’, in which jobs that require and produce excess carbon are gradually replaced by those that are net zero, or regenerative in a process that leaves no workers (e.g., miners, food producers, drivers) behind (Stark et al., 2023; Wang & Lo, 2021). Justly transitioning to green or circular economies means that work becomes enmeshed in economic systems that are designed to be regenerative through recycling, minimizing resource extraction, minimizing waste and pollution and ensuring long-term sustainability (ILO, 2015). Thus, green collar work can be seen as part of a wider change to the entire world of work, in which work needs to become more functional at social protection in the conduct of everyday life (Di Fabio, 2024; Di Fabio & Cooper, 2023; ILO, 2024).
There is no general agreement on a definition of a ‘green’ job or occupation but is largely understood as “decent work in a sustainable low carbon world” (UNEP/ILO/IOE/ITUC, 2008, p. vii). Green work can be seen in terms of the processes of how the work is actually done, and then what it produces at the end. At the base level, this is work that “…preserves or restores environmental quality” (Data Europa-EU, 2022), it protects biodiversity (our animals and plants), and wider ecosystems, including water, air and soil. It is work that is concerned with climate resilience and decarbonization through a focus on reducing non-renewable energy, resource consumption, especially water and energy as well as pollution and waste reduction (Stanef-Puică et al., 2022). At the broadest level it is work oriented towards sustainability. At the workplace level this may require specialized green expertise or skills, such as the Knowledge, Skills, Abilities, and Other Characteristics (KSAOs) possessed by a climate scientist, solar installer, sustainability consultant, landscape architect or ESG analyst. Green Collar work is also about direct outputs or the nature or type of work which produces particular goods and services (recycling; organic farming; electric car manufacture), and the supply functions for this work (driving a waste management truck, electric battery manufacture or planting) which indirectly contribute to environmental quality but may not necessarily require specialist green skills or expertise. Green work may also be about sustainability of operational or production processes where consideration is given to the protection of water, air, and soil. Attention is given within these processes-based jobs to energy efficiency, waste management and reduced pollution (Stanef-Puică et al., 2022).
We can further understand this work as
We can also understand green collar work as
At the heart of green collar work regardless of production or process, core or adjacent, is that work is decent, it is implicated in poverty eradication, it contributes to healthy communities and societies, and as such as sustainable work that connects the environment with the economy, wider society and future generations (Herzog & Zimmermann, 2025; Stanef-Puică et al., 2022). In short, work that is sustainable. Chambers and Conway (1991) argued that “a livelihood is sustainable which can cope with and recover from stress and shocks, maintain or enhance its capabilities and assets, and provide sustainable livelihood opportunities for the next generation; and which contributes net benefits to other livelihoods at the local and global levels and in the short and long term” (p. 6). Sustainable livelihoods must then be measurable in terms of social sustainability, environmental impact, and economic security.
In recent times there has been a staggering growth in the use and relevance of composite indicators, or ‘indexes’ (Greco et al., 2019). In the domain of green work, we have seen for instance indexes on corporate sustainability (the S&P Global Corporate Sustainability Assessment, or CSA; Naqvi & Jus, 2019), and a Global Job Vulnerability Index (Deloitte Economics Institute, 2022). These perhaps partly reflect that the need for greener working has moved from being a criticism of economically poorer, ‘developing’ countries (Chambers & Conway, 1991), to an issue of global relevance and concern (Chambers, 2009; Guo et al., 2023; Kamaruddin & Samsudin, 2014; Swaminathan, 1991). Responding to the growing climate crisis and the implications of this for the world of work has led to the creation of a new Sustainable Livelihoods Index (or SL-I) (Carr et al., 2025). The SL-I has been designed to rank order the most sustainable livelihoods in any given region, on an annual basis. These rankings are based on the three (people, planet, prosperity) dimensions of all 17 of the United Nations Sustainable Development Goals (SDGs; see, Carr et al., 2025). Yet at this stage, the SL-I is a recommended, albeit quality-controlled, protocol. This paper aims to outline a proof-of-concept pilot test for the processes contained in that protocol.
The protocol begins with taxonomy, which is the logical place for scientific measurement (Gould, 1994). It is also where existing approaches to measuring work began, with the International Standard Classification of Occupations (ISCO) (ILO, 2008). This classification scheme is a branch-and-limb structure with 130 (sub)-occupations (elements), ranging across 10 main branches from ‘Professionals’ to ‘Elementary occupations’, which includes for instance janitors and cleaners. In their proposed re-classification, Carr, Hopner et al. (2025) propose deleting this last, demeaning and potentially deleterious category, which is antithetical to the ethos of the SDGs in general, and to SDGs 8 (Universal Decent Work) and 10 (addressing systemic inequality) in particular. In its place, they propose a flatter, work ‘color collars’ system already in partial use in everyday work and organizational life.
These color collars are not arranged in any particular order, and they apply to both formal and informal work. There are in total 13 occupational collars, with four being added to the residual nine from the ISCO (above, and in italics below): Grey collar (skilled trades); pink for service work; red (for public service); khaki (for armed forces); yellow (for creative arts); gold for elite professional; brown for extractive industries; white (for clerical and administration); blue (for manufacturing and production); black (for transport); silver for automation/AI workforce); orange for unfree work; and finally, the focus in this paper, green for environmentally protective and/or regenerative.
In a subsequent paper, Hopner et al. (2025) have defined green collar work conceptually and empirically, in New Zealand, including core and adjacent green work, in which the ‘green’ in the work is either focused on greening or is incorporated into it, for instance through recycling initiatives during a production process. This conceptual and empirical work has thereby set the scene for a pilot test of the protocol in Carr et al. (2025), in this case in New Zealand.
In the next step outlined in the protocol, the 10 most common occupations (with the most consequential validity) in each occupation should be scored for sustainability. This is operationally defined using the triple bottom line which underlies all 17 SDGs (i.e., People, Planet, and Prosperity) in the Sustainability Agenda (Stockholm Resilience Center, 2024). Specifically, each of the 10 most common occupations, for example, from green collar work, should be rated, on a 3-point scale (detrimental for ecosystem −1, neutral with respect to it, 0, or regenerative for it, +1). For each of the 10 most common occupations under each collar, 1 there are 10 such items, drawing wherever possible from extant measures, such as carbon footprint (under Environmental bottom line, ibid).
This scaling procedure is designed to result in three equally weighted and then -aggregated scores, on three ten-point inventories, ranging from −10 to +10 (Greco et al., 2019). Scores are decided using Consensual Qualitative Ratings (Hill & Knox, 2021), to yield an overall score which can then be ranked against the remaining nine occupations, for each collar. The final result from the protocol is thus an index of sustainable livelihoods, the SL-I, which orders all 130 occupations into one integrated, applied, measure.
To demonstrate the viability of this protocol, we reasoned that a first step is to see if we can generate a mini index for one of the 13 collars, using the basic protocol in Carr et al. (2025). Although the number of elements in the protocol is the same as for the ISCO (n = 130, above), it could be argued that building an index from so many elements may be challenging. However, to the extent that it can be demonstrated using one of the 13 collars, we might consider this attainment to be a proof-of-concept. To conduct this test, we chose green collar work because, in New Zealand, it is not only the most conceptualized and researched of the 13 collars (Hopner et al., 2025), but also widely considered to be a hallmark of the country, and to that extent a beacon or lighthouse collar for occupational, organizational and governmental choices.
Method
Participants and Procedures
The present research uses an existing data source provided by Stats New Zealand (Stats NZ), a government agency that conducts national census surveys designed to be representative of the New Zealand population. The dataset consists of counts of the number of people employed in each occupation for the last three national censuses (2013, 2018, and 2023). The total number of employed individuals per census year for 2013 (N = 1,900,599), 2018 (N = 2,445,141), and 2023 (N = 2,622,723). Across all three censuses, the number of people employed in each occupation ranged from 3 to 108,702 (with an average of 2,318 per occupation). For more information on Stats NZ census data quality, metadata, and methods, please see https://www.stats.govt.nz/.
Measures
Occupation Codes
Occupation codes were provided by Stats NZ in the variable CEN23_TBT_IND_001 to identify all occupations using the coding system “oc” followed by a string of numbers associated with each occupation. These codes can be used to search the occupation description, skill level, and associated tasks on the Australian Bureau of Statistics (ABS) website. 2
Occupation
The list of occupations provided by Stats NZ is categorized under the variable Variable codes within the dataset. Examples of occupations appearing under this variable include “Corporate General Manager,” “Cotton Grower,” “Member of Parliament,” and “Sheep Farmer.” Using occupation code for any of these categories on the ABS website provides additional detail on occupation-specific descriptions, required skills, and tasks.
Census Year
Census year was recorded for each occupation in the variable CEN23_YEAR_001. This allowed the number of individuals employed in each occupation to be disaggregated by census year.
Number of Citizens
The total number of citizens employed in each occupation per census year was recorded in the variable OBS_VALUE.
Green Collar Occupations
To examine occupational trends in New Zealand, employment data from the 2013, 2018, and 2023 censuses were subset to include only occupational categories (those with CEN23_TBT_IND_001 codes beginning with “oc”). Observations representing total counts across occupations (e.g., “Occupation – total employed census usually resident population count aged 15 years and over” and “Total stated – occupation”) and cases with OBS_VALUE = 0 were excluded to ensure that only specific, non-aggregate occupations with non-zero counts were analyzed.
In a second step, we examined the most common green-collar occupations. Green-collar jobs were defined as occupations contributing either indirectly or directly to environmental protection, sustainability, and climate resilience. The identification process was guided by prior research (Carr et al., 2025; Ehmcke et al., 2009; Hancock, 2010; Hopner & Carr, 2024) and the International Labor Organization (ILO) definition of sustainable livelihoods, emphasizing work that benefits people, planet, and prosperity, including just transitions into environmentally sustainable forms of employment.
Building on this foundation, we treated green collar work as encompassing forms of decent work that support environmental goals either through the core nature of the job or through the means of production and consumption that surround it. Because the New Zealand occupational data include roles that vary in how directly they relate to environmental outcomes, this broader conceptualization allowed us to integrate both direct and indirect contributions into a unified operational definition and, in turn, to generate the keyword system used to identify green-collar occupations.
An initial set of keywords was generated based on established sustainability domains such as renewable energy, conservation, waste reduction, and environmental science. This list was then refined using a large language model (LLM) to remove overly broad or ambiguous terms (e.g., replacing “engineer” with “environmental engineer”).
The final keyword list used for classification was: “environment,” “environmental,” “conservation,” “renewable,” “solar,” “wind,” “recycling,” “waste,” “sustainability,” “sustainable,” “ecologist,” “ecology,” “climate,” “agriculture,” “horticulture,” “energy efficiency,” “water management,” “marine,” “ocean,” “environmental engineer,” “renewable energy engineer,” “sustainability engineer,” “environmental scientist,” “climate scientist,” “urban environmental planner,” “solar technician,” “wind technician,” “conservation forester,” “park ranger,” and “ecological restoration.”
Occupations whose titles matched one or more of these keywords were flagged as green-collar jobs. From this subset, the 10 most common green-collar occupations in 2023 were identified using the same ranking procedure applied to the full set of occupations. This analytic strategy enabled a systematic comparison between the most common occupations overall and those most strongly aligned with environmentally sustainable work.
Top 10 Green Collar Occupations
These are presented in Figure 1, along with definitions of each occupational definition.
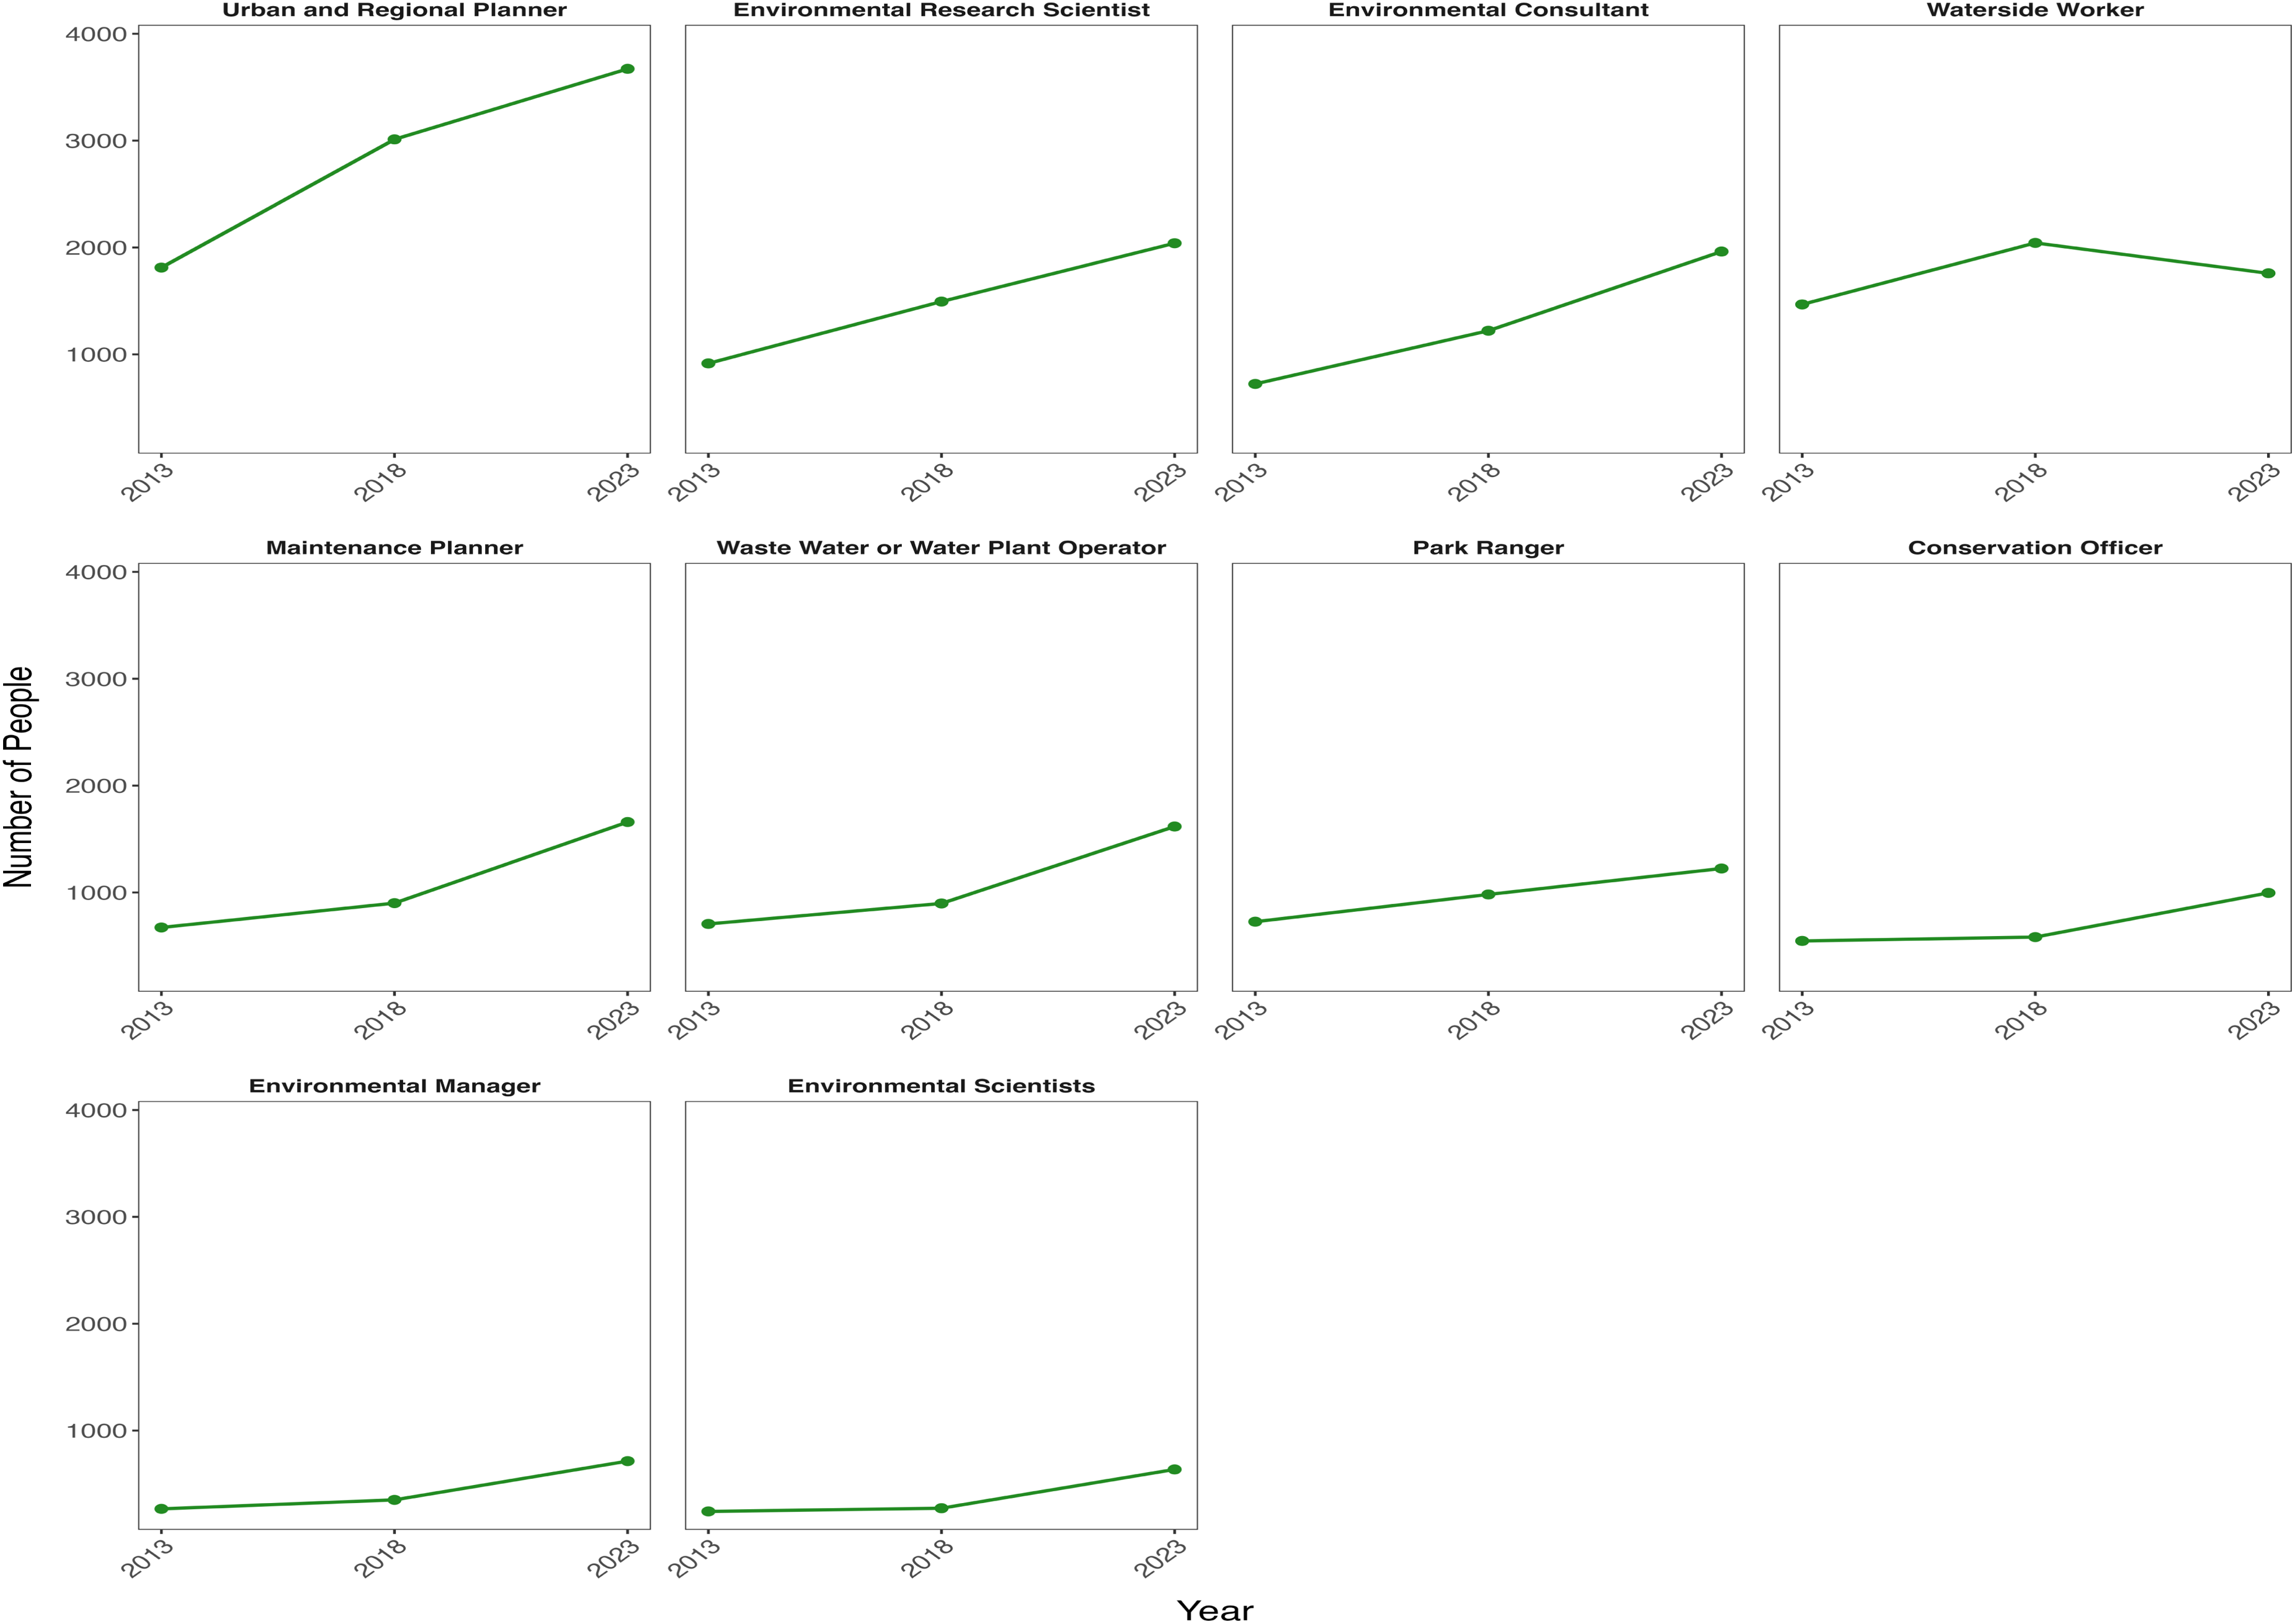
Top 10 green collar occupations in New Zealand. Panels ordered by number of employed people in 2023, descending.
Panels ordered by number of employed people in 2023, descending.
Urban and Regional Planner
Urban and Regional Planners develop and implement plans and policies for the controlled use of urban and rural land, and advise on economic, environmental and social factors affecting land use.
Environmental Research Scientist
Environmental Research Scientists study and develop policies and plans for the control of factors which may produce pollution, imbalance in or degradation of the environment.
Environmental Consultant
Environmental Consultants analyses and advises on policies guiding the design, implementation and modification of government or commercial environmental operations and programs.
Waterside Worker
Waterside Workers load and unload trucks, containers and rail cars, and transfer cargo between ships and other forms of transport and storage facilities with particular emphasis on environmental safety.
Maintenance Planners
Maintenance Planners develop maintenance planning strategies, and schedules, coordinates and monitors the maintenance of all plant equipment.
Waste Water or Water Plan Operators
Waste Water or Water Plant Operators operate plants to store, distribute and treat water including purifying water for human consumption and removing waste from sewage.
Park Ranger
Park Rangers assists in controlling a state or national park, scenic area, historic site, nature reserve, recreation area or conservation reserve in accordance with authorized policies and priorities.
Conservation Officer
Conservation Officers develops and implements programs and regulations for the protection of fish, wildlife and other natural resources.
Environmental Manager
Environmental Managers plans, organizes, directs, controls and coordinates the development and implementation of an environmental management system within an organization by identifying, solving and alleviating environmental issues, such as pollution and waste treatment, in compliance with environmental legislation and to ensure corporate sustainable development.
Environmental Scientists
Environmental Scientists study, develop, implement and advise on policies and plans for managing and protecting the environment, flora, fauna and other natural resources.
Criteria for Rating top 10 Green Collar Occupations in New Zealand
The criteria for rating these 10 occupations are provided in Table 1 (Carr et al., 2025).
Criteria for Sustainable Livelihoods: Description, Standard, and Indicator.
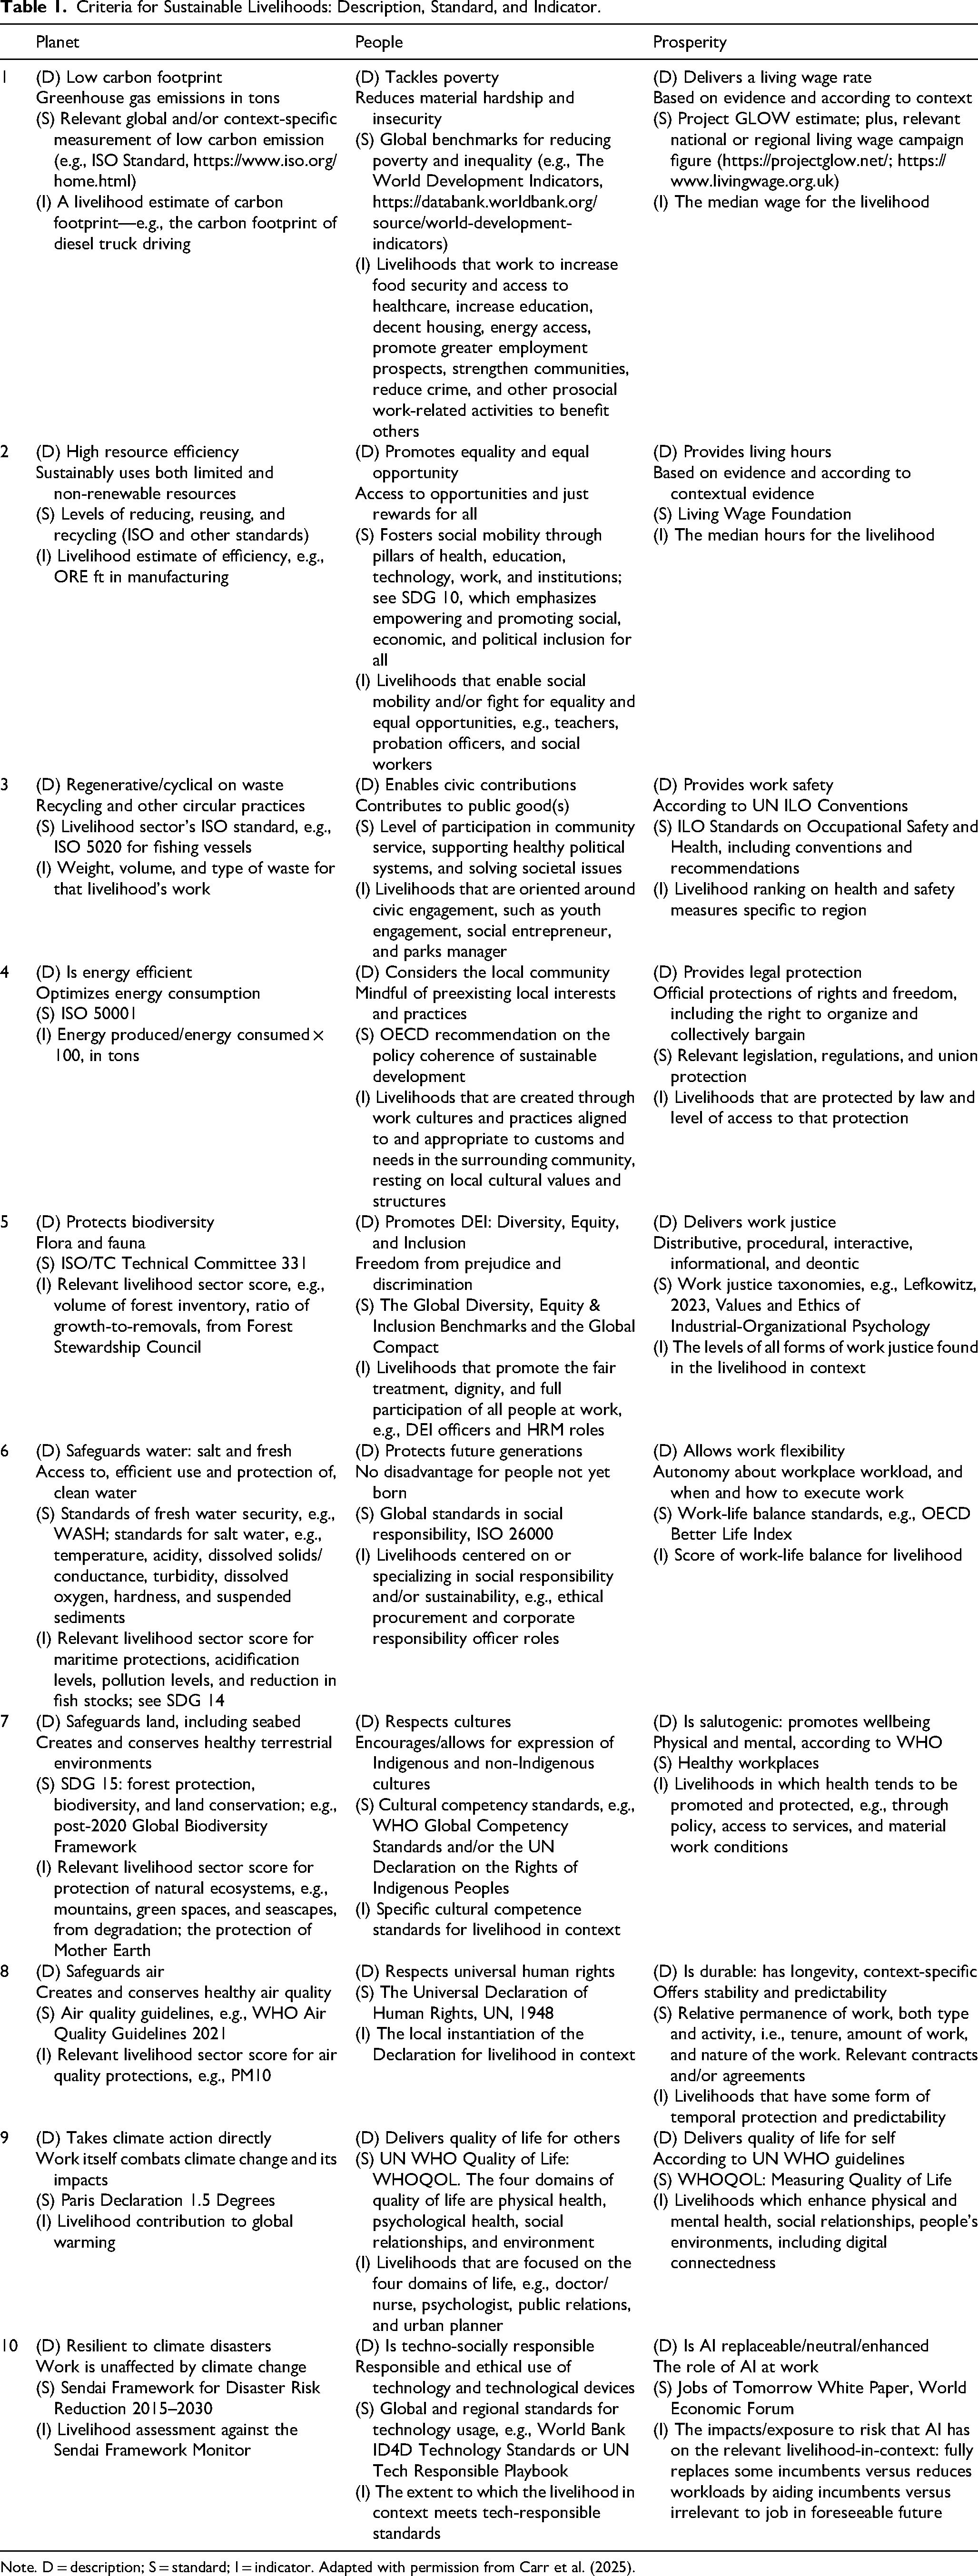
Note. D = description; S = standard; I = indicator. Adapted with permission from Carr et al. (2025).
Results
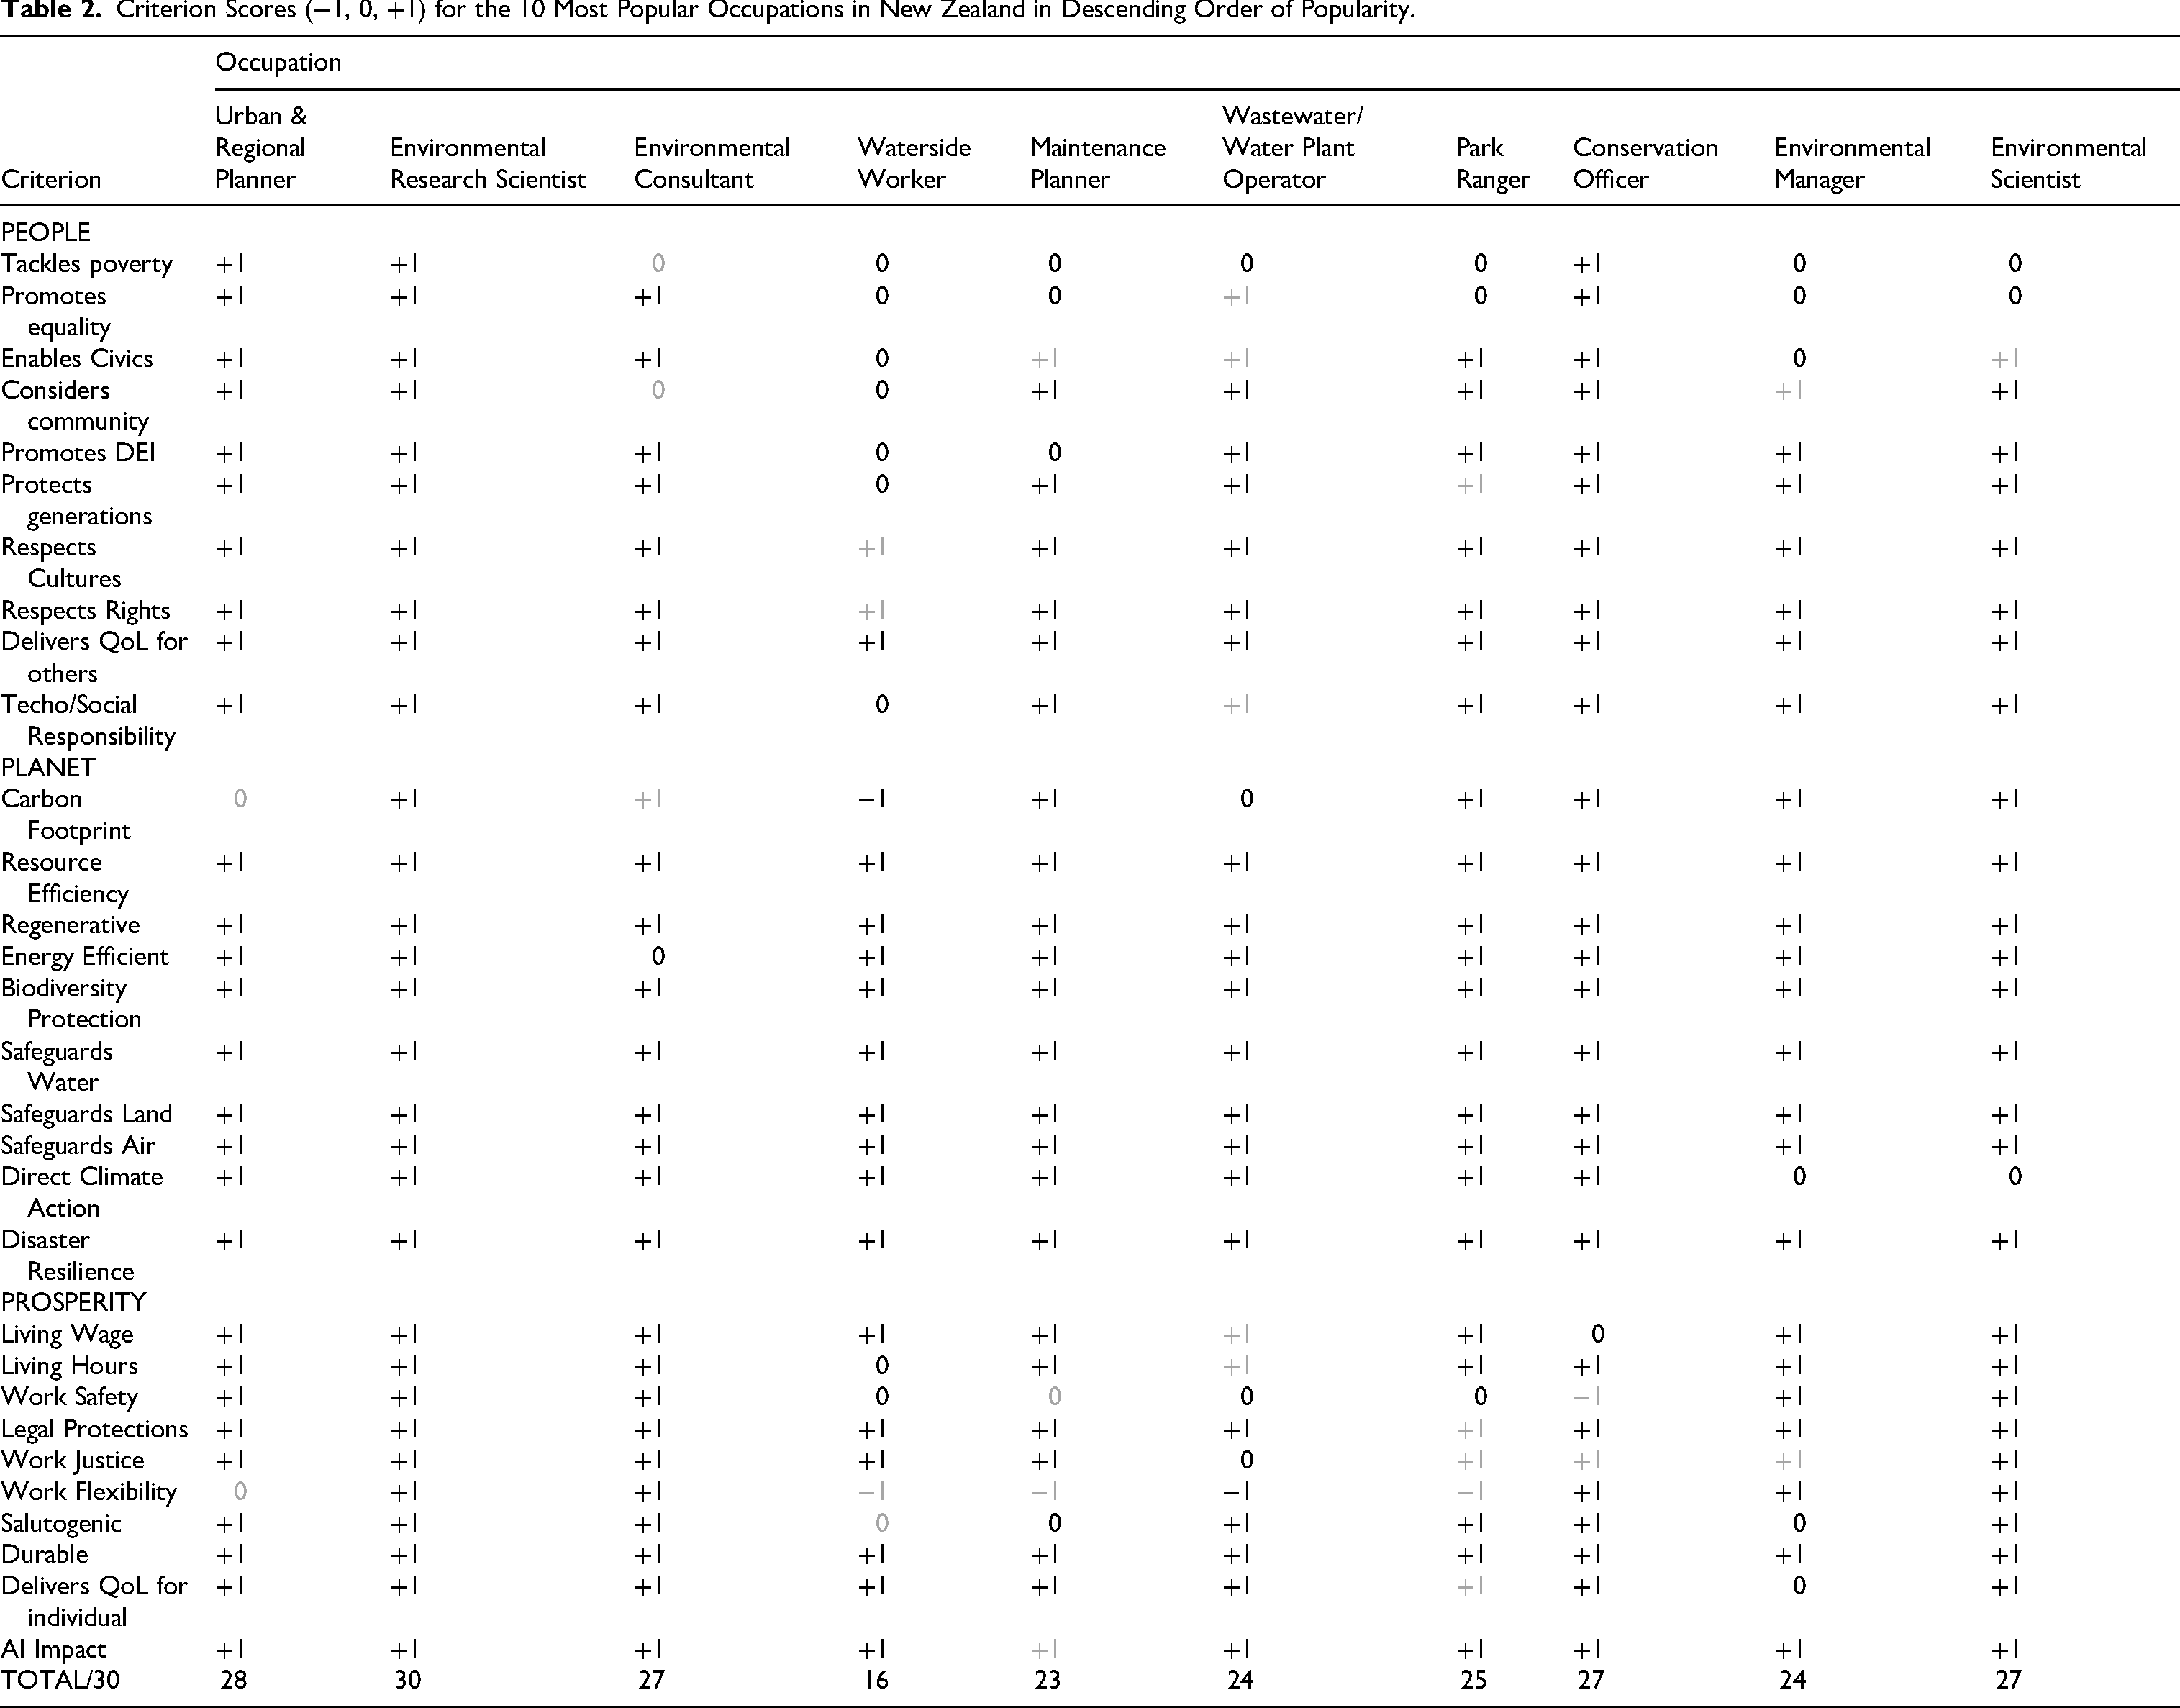
Table 2 contains the scores that were derived using CQA (above) conducted by the two of the authors, first separately (each AI-assisted) and then together (again AI-assisted), for each of the 300 elements (i.e., 10 occupations×10 criteria×3 bottom-lines). We sought triangulation on whether, in the New Zealand context, there was a deficit, neutrality or a benefit to the criterion in question (People, Planet, Prosperity criteria) on each of the measures indicated by Carr et al. (2025) and by AI (in the NZ context), on each of the top 10 green collar occupations identified from the process outlined above. Generative AI tools were used solely as decision-support instruments to assist information retrieval and comparative evaluation. Final ratings were determined through author consensus with AI outputs critically reviewed and not accepted without human verification. Once this AI-QCA generated a score for each-and-every criterion cell in Table 2, they were tallied to derive a score ranging in principle from −30 to +30. These total scores were then arranged to yield the SL-I for green collar work in New Zealand, in this context.
Criterion Scores (−1, 0, +1) for the 10 Most Popular Occupations in New Zealand in Descending Order of Popularity.
Discussion
The results of this process are presented in Table 3, which is effectively the proof-of-concept mini-SL-I (for green collar work in New Zealand), scored across all three criteria for sustainability. In principle, these equally weighted composite scores, in turn, reflect all 17 of the SDGs (Carr et al., 2025; Stockholm Resilience Centre, 2024). With the possible exception waterside workers, which are perhaps less focused on People than the remaining nine work roles, these green collar occupations all scored relatively highly on sustainability. Nonetheless, there were two main blocks, topped by Environmental Research Scientist, and Park Ranger, with tied ranks within each block.
Mini Sustainable Livelihoods Index (m SLI-I) – Green Collar Work in New Zealand.
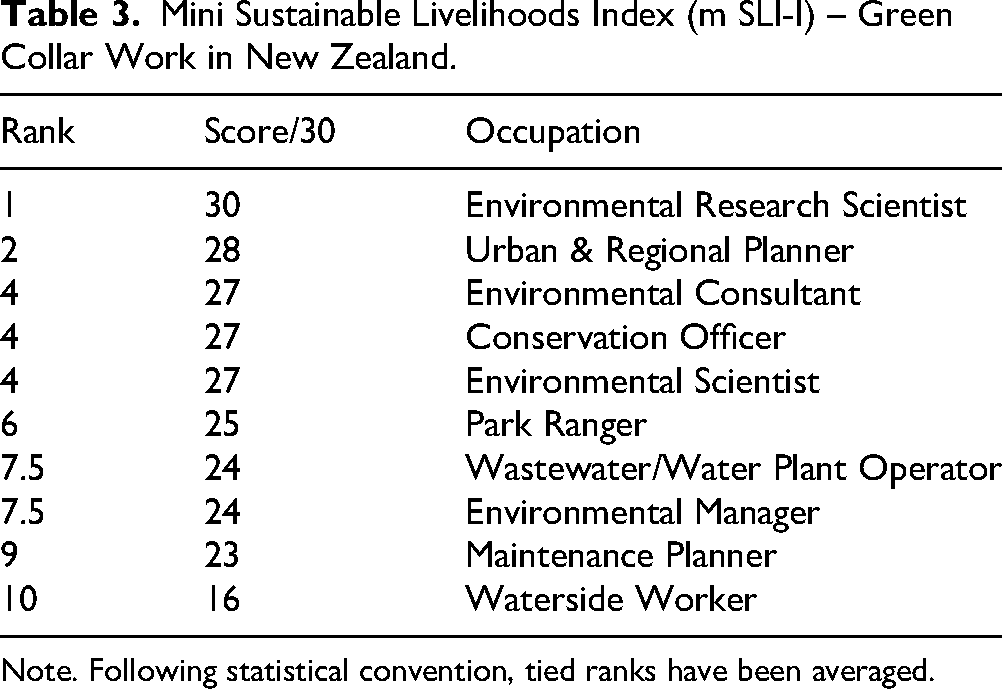
Note. Following statistical convention, tied ranks have been averaged.
This study is a pilot for the wider protocol presented in Carr et al. (2025). Our ability as human judges to sift the requisite information in that protocol, from localized databases, key legislation, treaty principles, workplace programs, and so on, was significantly aided, and we believe enhanced, by the availability of Generative Artificial Intelligence (Gen AI, in this case Chat GBT and Google AI mode). As Gen AI continues to evolve at rapid pace, no doubt more of the process that we followed, based on the protocol in Carr et al. (2025), will be automated. Nonetheless, as we found in this process, CQA remains fundamentally a Human process, in which AI is an assistant rather than an equal. Where AI added considerable value was in the efficiency of its search capabilities, to find active programs e.g., on DEI and safety, in particular occupations in contemporary New Zealand.
Green Collar occupations are perhaps the most likely collar from among the 13 in Carr et al. (2025) to be linked to sustainability, through their contributions to the environment (Planetary) and the social good (People). Yet because they are relatively well-recognized, valued and remunerated in New Zealand, they also tend(ed) to contribute towards wider Prosperity. Thus, to the extent that New Zealand earns its reputation as a ‘green’ nation, the index that we have compiled in this paper is unlikely to replicate in other, less environmentally focused settings.
Such an index has a potential, under Systems theory and thinking, to serve a range of stakeholder groups, at the following, different but functionally inter-connected levels of the system (Carr et al., 2025):
Micro level: Individual job seekers and counsellors (for instance students and older workers seeking just transitions, and their career/vocational advisors). Jobseekers can examine the sustainability in three different areas as to what best fits with their skills and aspirations. This index can work as a map for individuals starting out in employment or those rethinking careers as to where they best might fit in pursuit of green collar work.
Meso level: Organizations and employers (who seek to recruit, motivate, and retain human talent). Increasingly job seekers are scrutinizing the environmental practices of prospective employers when making career decisions. Visibly promoting sustainability and corporate social responsibility alongside decent work is associated with higher organizational attractiveness and can help attract candidates. In particular, environmental initiatives within organizations can support job satisfaction and wellbeing, therefore improving worker retention (Kühner et al., 2025).
Macro level: Governmental departments of workforce planning (with the fiscal responsibility to invest in relatively sustainable forms of work, and workforce training and education). In order to facilitate just transitions to green collar work and low carbon economies there will need to be continuous investment in training and education which enables individuals to reskill and transition across sectors (Kühner et al., 2025). Indexing common green collar livelihoods provides a spotlight on workforce investment in terms of most optimum return on investment in public spending.
Conclusion
At an inter-governmental, multi-lateral level, the United Nations itself has set the SDGs as its grand plan for human development, under the aegis of Sustainability, and the Sustainability Agenda. The development of SL-I's for major regions of the world, on a recurring, e.g., annual basis to reflect and capture changing realities, such as Gen AI, has the potential to incentivize and accelerate that Agenda. Given that qualifier, and ultimately context-sensitivity, we call on other researchers to begin to identify the most sustainable livelihoods in their country and regions (where there are single market standards). Only by starting this process can we end up in a place where all 13 collars are ranked for their sustainability of people, planet and prosperity. Lastly, we call on the UN itself to support the continuing development of useful, responsive, and ultimately regenerative SL-Is.
Footnotes
Acknowledgements
This project was supported by a grant from the Massey University Research Fund (MURF), RM27107 – Measuring Green Collar Livelihoods for Sustainability in Aotearoa/New Zealand: A Proof-of-Concept for Indexing Just Transition and Workforce Development.

Funding
The authors disclosed receipt of the following financial support for the research, authorship, and/or publication of this article: This work was supported by the Massey University Research Fund, (grant number (MURF RM 27107)).
Declaration of Conflicting Interests
The authors declared no potential conflicts of interest with respect to the research, authorship, and/or publication of this article.