
Abstract
We posit that environmental hostility exhibits an inverse U-shaped relationship with a firm’s entrepreneurial orientation. We suggest a nuanced perspective on the threat rigidity argument that firms generally retrench from entrepreneurial capital allocation behaviors as hostility increases. We argue that firms are likely to act opportunistically and increase EO, but only to the point where the marginal costs of such activity outweigh the marginal benefits, at which point EO drops precipitously. Analyzing 60,440 observations from 6,481 firms across 373 industries from 1998 through 2017, our results indicate that EO exhibits a generally negative relationship with environmental hostility. Further, we examine a potential moderating influence of recoverable slack on the hostility–EO relationship, arguing that recoverable slack represents a meaningful buffer on behavioral change stemming from changing environmental hostility.
Keywords
There is an interesting paradox in the entrepreneurial orientation (EO) literature. In hostile operating environments, firms behaving entrepreneurially tend to perform better then firms behaving conservatively (Covin & Slevin, 1989; Lee et al., 2019). Yet, these same environments can lead firms to retrench, abandoning their entrepreneurial activities (Tang & Hull, 2012). This leads to a paradox where, at the very time firms should be increasing their EO, many firms become more conservative. Admittedly, there are mixed findings on the relationship between EO and hostility. As Rosenbusch et al., 2013 commented, “there has been a controversy in the literature as to whether hostility has a positive…or negative effect on EO…”. What is clear is that EO and environmental hostility exist in a complicated space, and while ample research exists on EO and a firm’s task environment, the lack of generally agreed upon findings suggest that more work remains.
The threat rigidity thesis suggests that, ceteris paribus, organizations tend to constrain their strategic actions when faced with threatening operational environments (Staw et al., 1981). The logic is that firms begin restricting their information processing as environmental threats increase, restricting the range of options under consideration, and thereby increasing rigidity and inaction (Osiyevskyy & Dewald, 2018; Slyngstad, 2016). Research further suggests that firms in these environments emphasize capital management and conservation of resources (Chattopadhyay et al., 2001; Osiyevskyy & Dewald, 2015; Sarkar & Osiyevskyy, 2018; Shimizu, 2007), which in extreme cases leads to organizational paralysis (George et al., 2006). Given this evidence, it is reasonable to expect a predominantly, even linear, negative effect of environmental hostility on a firm’s EO.
Yet the paradox remains—we observe some firms pursuing entrepreneurial activity despite facing hostile environments. We suggest a more nuanced perspective on the threat rigidity perspective as it relates to entrepreneurial behavior. We build on recent research on the interplay between environmental threats and opportunities, wherein firms perceive threats as negative situations where loss is likely, while also perceiving opportunities as positive situations where gains are likely (Chattopadhyay et al., 2001; Saebi et al., 2017). We posit that firms embrace EO when attempting to exploit environmental opportunities, but retrench from EO when firms judge the marginal cost of opportunity pursuit as too high in an increasingly resource-scarce environment (Osiyevskyy & Dewald, 2015). We argue for a curvilinear, inverse U-shaped relationship between hostility and EO. Specifically, we suggest that firms increase their entrepreneurial behaviors to the point where the apparent cost of these behaviors outweigh the competitive gains to be made, at which point the firm rapidly retrenches toward more conservative behaviors (Aghion et al., 2005).
A curvilinear relationship between hostility and EO addresses part of the paradox, but potentially not all. Chattopadhyay et al. (2001) suggest a variety of moderating factors that influence the effect of environmental threats on strategic behaviors, organizational slack being among the most prominent (Slyngstad, 2016). We argue that a firm’s recoverable slack—the excess capital embedded within an organizational cost structure (George, 2005)—acts as a buffer to a firm’s inclination to diminish its EO when faced with increasing levels of hostility. As we will argue, recoverable slack—differentiated from other forms of slack—provides accessible strategic options across a range of possibilities, increasing its strategic utility as a buffering mechanism in ways that surplus liquid assets do not provide (Singh, 1986). As such, we contend that recoverable slack attenuates the inverse U-shaped relationship between hostility and EO.
We offer three contributions with this study. We first contribute to threat rigidity theory, suggesting that entrepreneurial behaviors defy the general tendency for entrepreneurial behavior retrenchment in the face of increasing environmental hostility (Staw et al., 1981). For many firms, increasing hostility exposes new opportunities worthy of pursuit, but only as far as the potential gain outweighs the cost. We also contribute to our nomological understanding of hostility, EO, and slack resources. As discussed previously, the mixed research on these variables suggests that a fresh perspective may shed new light on how firms leverage their internal resources to adjust their level of EO in response to changing environmental exigencies, and that a nonlinear view may help address a paradox in the EO literature (Wales, 2016). Our final contribution is methodological. In looking at a behavioral perspective on EO among large, publicly traded firms, we build from prior research suggesting that we may capture a firm’s corporate-strategy level entrepreneurial behaviors by observing the firm’s capital allocation decisions that proxy investment in entrepreneurial activities (Miller & Le Breton-Miller, 2011). As such, we extend behavioral EO research into contexts where collecting primary data, or even data on corporate communications, is not readily feasible. For transparency, we posted all analyses and code online at http://bit.ly/2XK7Rou.
Theoretical Development
Threat Rigidity, Environmental Hostility, and Entrepreneurial Orientation
At its core, the threat rigidity thesis suggests that exogenous organizational threats such as competition or resource constraints lead firms to favor well-known or well-established strategic options through three mechanisms. The first mechanism is the reliance on prior knowledge, which results in information restriction; the organization focuses its attention on things that it knows, or thinks it knows, rather than actively searching for new sources of information (Staw et al., 1981). The second mechanism is a tendency toward centralization; senior leadership consolidates power and strategic decision-making in an attempt to narrow potential courses of action (Shimizu, 2007). The third mechanism is a purposeful attempt to conserve resources; as extant resources diminish, the firm seeks to preserve its valuable resource stock (Chattopadhyay et al., 2001). Threat rigidity arguments thus suggest a negative linear change in a firm’s entrepreneurial behaviors when faced with increasing organizational threats. Limiting information search, centralizing decision-making, and restricting resource expenditures are all behaviors that diminish EO (Anderson et al., 2009; Covin & Slevin, 1991). We suggest a more nuanced perspective as we later discuss, but it is important to highlight why we focus on hostility as the most meaningful predictor for our study.
Dess and Beard (1984) conceptualized a firm’s task environment along three dimensions: dynamism, munificence, and complexity. Briefly, dynamism refers to unpredictability in the rate and magnitude of environmental change. Munificence refers to the ability of the environment to support organic growth, and complexity refers to the range of activities necessary for participation in the environment. There is some debate as to whether munificence is the inverse of hostility (e.g., Rosenbusch et al., 2013), but the perspective we adopt here is that a hostile environment is one in which the environment provides little opportunity for organic growth, and that firms grow primarily by taking market share from other actors (Dess & Beard, 1984). While all three dimensions may represent a threat to the firm, and thus may lead to rigidity, hostility closely approximates Staw et al. (1981) conceptualization of the most salient threat being “a simple, direct effect of the extent of potential loss…”. Hostility, in its extreme, requires a firm to grow solely by beating its competition (Chen, 1996); a strategic mistake results in a clear and compelling threat to organizational survival and is the reason why we focus on hostility in this study.
As previously discussed, the threat rigidity thesis suggests a negative relationship between hostility and EO. That said, to start unpacking this hypothesis we must first consider how we conceptualize EO. As Covin and Wales (2019) outline, among the three primary EO conceptualizations, the perspective offered by Anderson et al. (2015) makes a sharp delineation between what are the behavioral elements of EO—what the firm does—and the general attitude or disposition toward entrepreneurial activity among senior managers. The distinction between behavior and disposition is central, we argue, to understanding hostility’s effect on EO, as Anderson et al. (2015, p. 1586) explain:
…we posit that hostility is causally adjacent to EO, although it does so by influencing entrepreneurial behaviors, while likely exhibiting no significant influence on managerial attitude towards risk. We predicate our argument on the observation that hostile environments constrain strategic choice and favor the pursuit of more conservative strategies (Miller & Friesen, 1983). However, these environmental constraints act primarily to influence behavior; it is not likely that a firm’s task environment will induce discernible changes to a senior manager’s attitude towards…
That hostility differentially effects EO’s lower-order dimensions provides some insight into ambiguous findings in the hostility–EO literature. As Covin and Wales (2019) noted, there is no shortage of research connecting, in some way, EO and the firm’s task environment. That said, ample evidence exists for a positive relationship between the two variables (e.g., Laskovaia et al., 2019; Wales et al., 2013) and a negative relationship between the two (e.g., Miles et al., 1993; Tang & Hull, 2012). The Rosenbusch et al. (2013) meta-analysis on the EO–hostility correlation hints at a weakly negative association, r = −0.06, but the meta-analytic data are also consistent with a null effect or a slightly positive effect. We argue, consistent with Anderson et al. (2015), that only when we view EO through its constituent parts are we better able to identify the likely underlying relationship between hostility and EO. Further, we suggest that hostility is far more likely to influence entrepreneurial behaviors versus managerial attitudes, and so we focus on a behavioral manifestation of EO in this study.
Isolating a behavioral perspective on EO allows us to revisit the central prediction of the threat rigidity perspective of a negative linear relationship. While disentangling the behavioral versus dispositional effect may help, so too may considering a nonlinear effect of hostility on EO. Consider that a critical antecedent to engaging in new entrepreneurial behaviors is the existence of, or ability to create, a new opportunity (Eshima & Anderson, 2017). A key assumption of our model is that, up to a point, increasing hostility exposes new opportunities exploitable through the firm’s expansion of its entrepreneurial behaviors. However, opportunity pursuit remains feasible only as far as the marginal benefits of expanding EO outweigh the marginal costs of that expansion. Consider that when operating in nonhostile environments, conservative strategies may produce a similar return to those strategies that involve greater risk (Chattopadhyay et al., 2001; Covin & Slevin, 1989). As hostility increases from low to moderate, however, options for growth—and industry profitability—deteriorate with the constriction of resources and the decline in extant opportunities (Dess & Beard, 1984). Hence, the impetus to compete by taking market share from existing rivals (Chen, 1996).
One mechanism through which to take market share from rivals is to exploit underserved or underrepresented segments in the firm’s existing markets where marginal investment may yield meaningful gain (Banbury & Mitchell, 1995). While conservative strategies may also increase market share, often such gains are temporally constrained (Urban et al., 1986) and may place a firm at a long-term disadvantage in terms of new capital investment (Wiseman & Bromiley, 1996). Hence, entrepreneurial behaviors are a reasonable course of action as hostility increases, particularly when EO expansion occurs in an existing market where the firm reasonably understands customer needs and its basis for competition (Banbury & Mitchell, 1995).
That said, once the marginal costs of EO expansion begin to outweigh the marginal benefits derived from additional investments in EO, we expect EO to plateau, and eventually, to diminish. As extant opportunities decline and resources constrict, pursuing new entrepreneurial opportunities that take resources away from tried-and-true products, services, and business models becomes increasingly untenable (Singh, 1986). Thus, we expect rapid retrenchment in a firm’s EO past that marginal-cost inflection point. Consider that hostile environments generally discourage organizations from taking unnecessary risks (Goll & Rasheed, 1997). The employment of aggressive strategies in hostile environments erodes a firm’s limited resources, and may actually precipitate organizational decline (Wiseman & Bromiley, 1996). The preceding is consistent with prior research observing that hostile environments dissuade even the most aggressive managers and organizations from taking on significant strategic risk, despite the perceived benefits from doing so (Goll & Rasheed, 1997; Smart & Vertinsky, 1984). As such, high levels of hostility should result in a clear preference for conservative behaviors that do not threaten organizational survival.
We propose that hostility exhibits an inverse U-shaped relationship with EO. In nonhostile environments with abundant opportunities and a paucity of threats, there is diminished need to expend internal resources on entrepreneurial strategies because conservative courses of action are generally sufficient under such conditions (Chattopadhyay et al., 2001). As environments move from low to moderate levels of hostility, the entrepreneurial impetus increases, and firms increasingly adopt entrepreneurial behaviors to improve their competitive position (Covin et al., 2000). This desire to expand entrepreneurial behaviors exists, however, only up to the point at which managers judge the marginal benefits of expending firm resources in new and unproven areas to be more expensive than focusing on well-known and well-understood businesses. At that point, we would expect a firm to retrench and focus on its core and dependable revenue streams (March & Shapira, 1987), resulting in a rapid decrease in EO. We expect then:
Recoverable Slack as a Buffering Mechanism
Researchers have long theorized that organizational slack plays an important role in determining how organizations respond to changing environmental exigencies (Cheng & Kesner, 1997; Cyert & March, 1963). Further, in situations where threats prompt strategic change and “stimulate greater and greater risk-taking, presumably in an effort to escape threats” (March & Shapira, 1992, p. 172), organizational slack may lessen the impetus to restrict resource expenditures in response to these threats (Shi et al., 2018). Slack allows an organization to use “excess firm resources to experiment with new actions or explore new markets since the firm can absorb losses from such activities” and in turn change “the nature of the firm’s response to the threat” (Alessandri et al., 2014, p. 968–969).
Bourgeois and Singh (1983) delineated three forms of organizational slack—potential, available, and recoverable. Potential slack is the capacity of a firm to tap external sources of capital, such as through selling equity or taking on debt (Cheng & Kesner, 1997). Available slack is surplus cash and cash equivalents—excess liquidity—within a firm (Bourgeois & Singh, 1983). Recoverable slack is a firm’s excess capital already embedded in the firm’s cost structure (Tan & Peng, 2003). Recoverable slack—including such things as excess inventory, maintaining excess staff, and large technology expenditures relative to the industry norm—most “closely approximates Cyert and March’s notion of slack as a buffer” (Bourgeois & Singh, 1983, p. 46). As such, we focus on recoverable slack, because the notion of slack as a buffer directly relates to how the capacity of the firm to adjust its entrepreneurial behaviors in response to environmental hostility (Tan & Peng, 2003).
We propose that recoverable slack attenuates the curvilinear relationship between hostility and EO such that recoverable slack lessens the rate of change in EO in response to changing levels of hostility; thus, the curvilinear relationship “flattens” at high levels of recoverable slack. We predicate the logic for attenuation on the observation of recoverable slack as a buffering mechanism in response to deteriorating environmental conditions (Bourgeois & Singh, 1983). We build from our previous argument that as hostility increases from low to moderate, entrepreneurial behaviors increase as a mechanism to improve a firm’s competitive position (Covin et al., 2000). We suggest, however, that recoverable slack lessens this impetus by buffering the need to take on additional strategic risk in response to diminished extant opportunities and fewer industry-wide resources (Dutton & Duncan, 1987). High levels of recoverable slack provide a firm time and selectivity in determining which strategic modifications to pursue (Chattopadhyay et al., 2001). Therefore, while we would still expect a general increase in the level of EO as a function of hostility increasing from low to moderate, we anticipate a slower rate of change in EO for firms with high recoverable slack.
Similarly, we anticipate a slower rate of change after the inflection point in the EO–hostility relationship. Given that firms increasingly retrench as hostility increases from moderate to high, high levels of recoverable slack afford them the buffer to do so at a slower rate than slack-constrained rivals (Meyer, 1982). Firms with high levels of recoverable slack may exhibit less dramatic decreases in their entrepreneurial behaviors in increasingly hostile environments, where recoverable slack provides the necessary cushion against the risk of potential failure and the perceived costs associated with strategic actions (March & Shapira, 1992). Because recoverable slack allows firms to “ride out” inhospitable environmental situations while rival firms scramble to meet the need for additional resource requirements, recoverable slack allows a firm time and ability to harvest existing entrepreneurial strategies and take advantage of the few remaining opportunities in increasingly hostile environments (Covin et al., 2000).
In contrast, we expect low levels of recoverable slack to accentuate the curvilinear relationship between hostility and EO, such that the rate of change in EO increases dramatically as the level of hostility increases from low to moderate for slack-constrained firms. That is, the curve steepens at low levels of recoverable slack. Again adopting the perspective of recoverable slack as a buffering mechanism, the absence of excess capacity to deal with changing environmental exigencies heightens the motivation for strategic action (Deephouse & Wiseman, 2000). As hostility increases from low to moderate and profitability erodes, slack constrained firms are more likely to jettison their technological core and seek out new entrepreneurial opportunities (Wiseman & Bromiley, 1996). Thus, changes in EO occur at a faster rate for firms low in recoverable slack as these firms rapidly pursue new opportunities—albeit diminishing taken together—to stave off competitors from obtaining critical industry resources and establishing long-term technology leadership positions.
After the inflection point in the hostility–EO relationship, we expect the retrenchment from entrepreneurial behaviors to conservative behaviors to proceed at a more rapid pace for slack-constrained firms. Highly efficient firms are least able to redirect surplus resources toward pursuing rapidly depleting opportunities. Indeed, even small changes to existing products, processes, and business models in the face of significant industry resource constraints may threaten firm performance, because even minor disruptions to cash flow result in an immediate cash constraint (Wiseman & Bromiley, 1996). Thus, for firms with low recoverable slack, the only viable strategic option at high levels of environmental hostility is to focus heavily on current markets and current technologies (Cheng & Kesner, 1997) and the use of existing resources (Pérez-Luño et al., 2016). Consistent with the preceding observations, we therefore posit:
Research Design
Sample
We extracted financial data from all U.S.-based, publicly traded firms listed on the New York Stock Exchange, NASDAQ, and NYSE Amex from 1994 to 2017 using the COMPUSTAT North American Fundamentals Annual database. Our sample window is the 20-year period from 1998 to 2017, with the data from 1994 to 1997 used in part to construct our task environment measures. Before constructing our database, we set the following decision rules to eliminate some types of firms. Following McGahan and Porter (1997), we eliminated those firms in the financial services, insurance, and banking industries; public services sectors; and those firms without a primary reportable industry (two-digit SIC codes 60–69; 90; and 99; respectively). We eliminated those industries because financial reporting standards vary widely for these companies (McGahan & Porter, 1997). We also filtered out any firms reporting zero or negative annual sales. After eliminating records with missing data using listwise deletion, the final sample consisted of 60,440 observations from 6,481 firms across 373 industries (four-digit SIC code). Copyright restrictions prohibit making the Compustat data publicly available. However, we posted all code and analyses, including the scripts used to construct our database and measures, on the Open Science Framework at http://bit.ly/2XK7Rou. Table 1 contains the summary statistics and pooled (across firms and over time) correlation matrix for our final sample, and please note the log scale of the continuous variables. For illustration, we plotted the pooled median level of EO and of hostility over our sampling window in Figure 1 to show the change in both focal variables over the 20-year period.
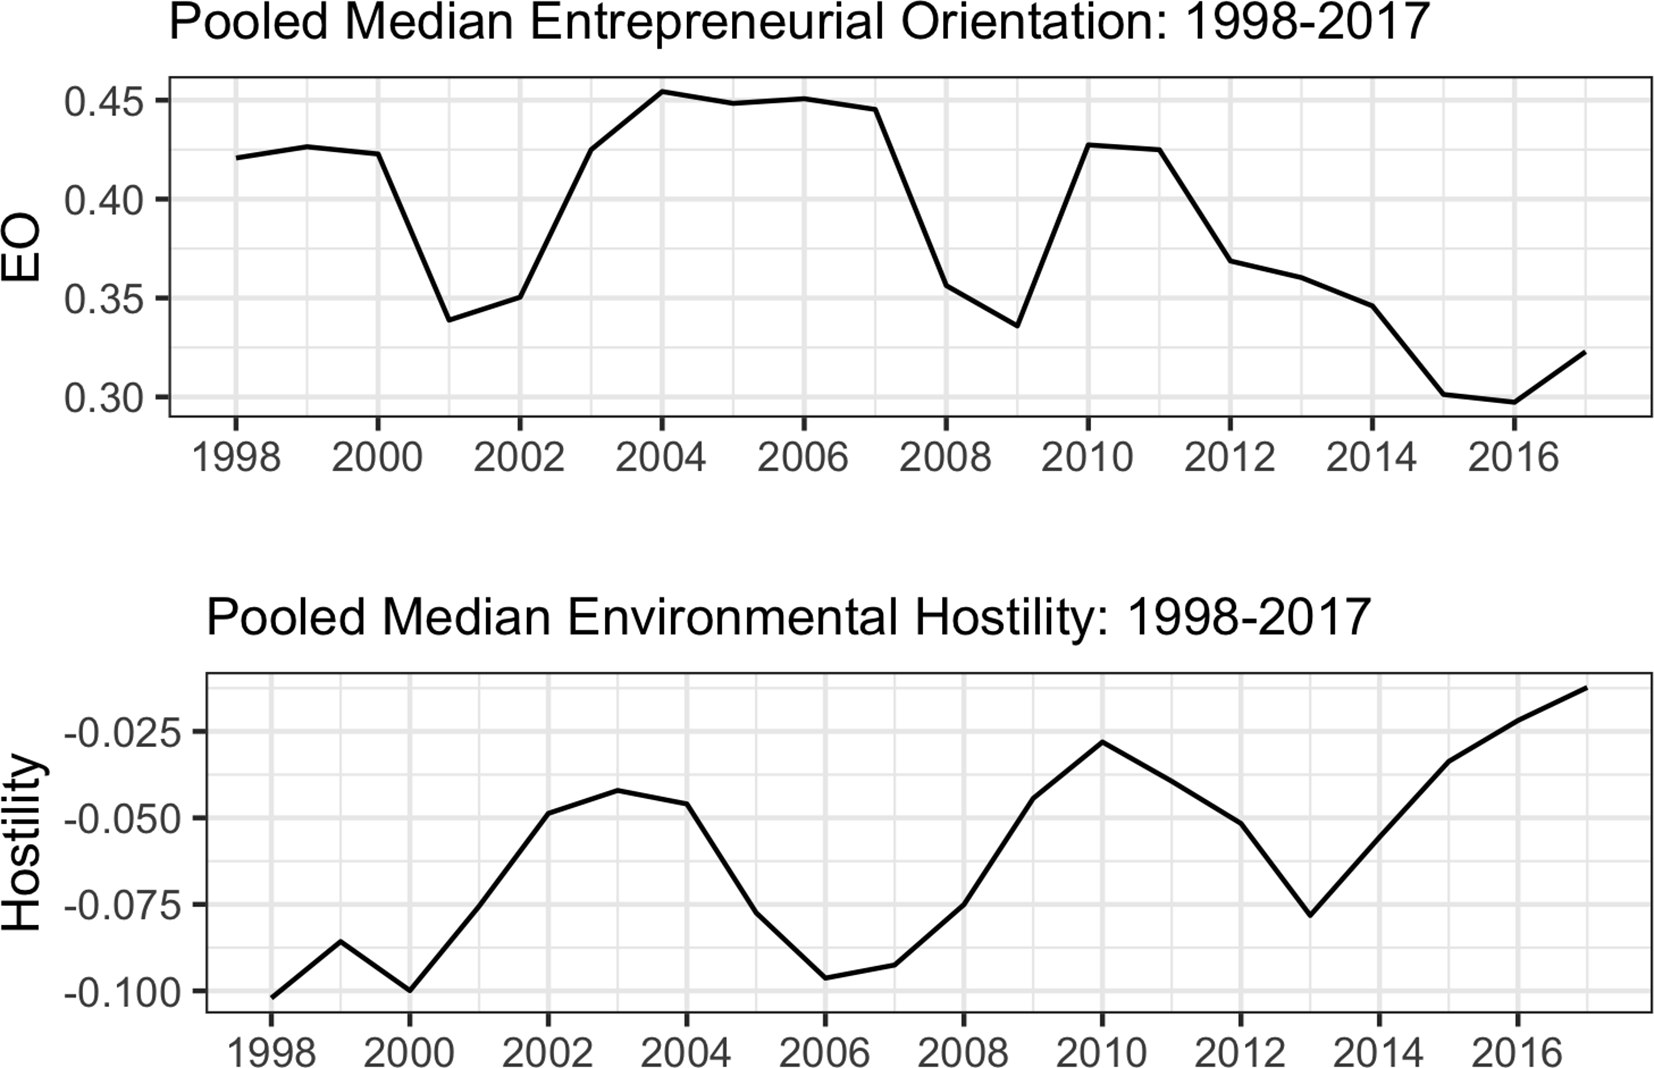
Median Entrepreneurial Orientation and Environmental Hostility over Time.
Summary Statistics and Pooled Correlation Matrix.a
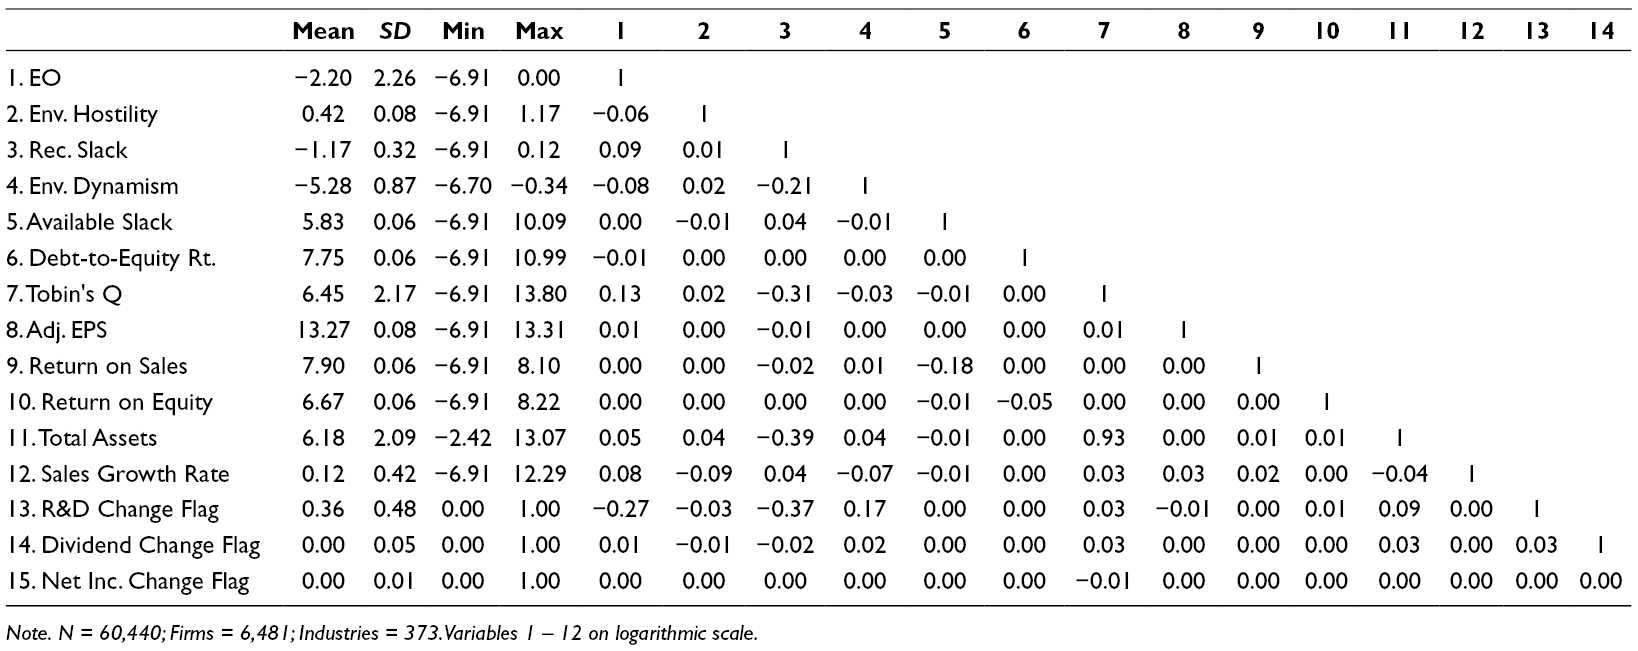
Note. N = 60,440; Firms = 6,481; Industries = 373. Variables 1 – 12 on logarithmic scale.
Dependent Variable
We drew inspiration from Miller and Le Breton-Miller’s (2011) use of financial ratio indicators to measure entrepreneurial orientation. As Covin and Wales (2019, p. 7) note, it is important for “researchers to continue their search for and use of theoretically defensible (albeit potentially imperfect) secondary data indicators of EO,” and we agree with this sentiment. There are, however, several challenges with measuring EO using secondary data, whether with financial metrics or with content analysis of security filings or annual reports (e.g., McKenny et al., 2018).
The first challenge is the level of analysis issue. Historically, EO exists at the business-strategy level, that is, the level at which firms make product-market decisions within the businesses they operate (Anderson et al., 2015). Measuring EO psychometrically and by sampling single-industry businesses aligns well with this perspective, and is one reason EO research mostly relies on survey-based data (Rosenbusch et al., 2013). Among larger, publicly traded firms, there are typically multiple distinct businesses within each corporate entity, which from a classical EO perspective suggests that the firm would have as many different measures of EO as it has distinct businesses. Because it is not feasible to collect primary data with any expectation of enough statistical power from publicly traded firms on their business unit-level EO, we must shift to a corporate strategy perspective and look for indicators that suggest entrepreneurial behaviors across a firm’s subsidiary businesses. This is where both financial indicators and content analysis of corporate documents are useful alternatives. That said, the resulting measure of EO would represent a corporate-strategy perspective, and the theoretical arguments underpinning a research model using these metrics should align with this perspective.
The second challenge with measuring EO using secondary data is the dispositional or behavioral question. As originally conceived, EO represents both the entrepreneurial behaviors pursued by the firms (what the firm does) and the dispositional or attitudinal perspective favoring entrepreneurial activities among the firm’s managers (Covin & Lumpkin, 2011). As Anderson et al. (2015) note in their EO reconceptualization, including both behavioral and attitudinal dimensions within a single construct implies that a given antecedent relates in the same way and of the same magnitude with a behavior and an attitude, which is not likely true for most antecedents to EO. Anderson et al.’s (2015) solution, which we largely adopt here, is to split EO into a behavioral element and an attitudinal element. We argue this is where financial ratios and content analysis diverge. As McKenny et al. (2018) note, content analysis provides a perspective on the ways in which a firm communicates its activities and intentions. Some of this communication explains what has happened, and some explains what the firm’s managers believe will happen in the future. As such, content analysis is, we argue, best suited for capturing a dispositional or attitudinal perspective on EO. In contrast, financial ratios reflect what the firm did with its resources in a given firm-year. We argue that financial ratios best capture a behavioral, corporate strategy perspective on EO, which aligns with our theoretical argument that hostility in the firm’s task environment causes a firm to retrench from its entrepreneurial behaviors.
The third challenge with using secondary data is dealing with measurement error, which is a source of endogeneity (Antonakis et al., 2010). While the EO dictionaries used for content analysis pioneered by Short et al. (2010) continue improving, as reported by McKenny et al., 2018, roughly 48% of the variance in the innovativeness measure is random noise and 45% of the proactiveness measure is random noise. McKenny et al. (2018) offer EO researchers several helpful suggestions to deal with measurement error using content analysis measures, but the low signal-to-noise ratio requires careful attention. While by no means without measurement error, secondary financial indicators represent accurate reflections of the firm’s financial condition, as mandated by securities law and verified by the firm’s external auditor (Miller & Le Breton-Miller, 2011). Further, Compustat data capture instances when the firm needed to restate financial reporting, improving measure reliability. While far from perfect, we argue that the reporting requirements for financial metrics, ceteris paribus, should result in a higher signal-to-noise ratio, at least with respect to the metric itself. Collectively, we are comfortable with our use of secondary financial metrics to proxy EO at the corporate strategy level.
We measured innovativeness as a firm’s industry-adjusted research and development intensity (R&D expenses / total assets), which is a commonly employed metric for innovation inputs (Lee & O’Neill, 2003). Reportable R&D expenditures include those activities directly associated with the development of new products, processes, or services, which encompass a significant percentage of a firm’s common innovation activities (Miller & Le Breton-Miller, 2011). Our measure of innovativeness is consistent with theoretical conceptualizations of innovativeness as being associated with product/service-based innovation (Covin & Slevin, 1989). Further, as Miller and Le Breton-Miller (2011) note, accounting standards require reporting of research and development expenditures that are material to a firm’s operations. We measured proactiveness as a firm’s industry-adjusted retention ratio (the percentage of profits a firm reinvests in the company each year [(Net Income – Dividends) / Net Income]). Proactive firms aggressively build through the reinvestment of profits rather than harvesting those businesses and returning profits to shareholders. We would thus expect to find higher retention ratios among firms employing proactive behaviors because such financial resources enable organic investment activity (Miller & Le Breton-Miller, 2011). Our proactiveness measure does not capture the specific investment activity pursued; our measure is a broad proxy for assessing proactive behaviors.
We excluded from our EO measure an indicator for risk-taking. This perspective aligns with Anderson et al. (2015) and Anderson et al. (2019) that a firm’s innovativeness and proactiveness best represent its engagement in entrepreneurial behaviors. As we mention in our control variable section, the firm’s debt-to-equity measure proxies a behavioral element to risk-taking, allowing us to isolate the corporate strategy-level proxies for capital allocation decisions that reflect the firm’s innovativeness and proactiveness. We include a discussion of our rationale for controlling managerial attitude toward risk rather than modeling it as a dependent variable in Appendix A.
There was a significant amount of missing data for the raw R&D expenses, dividend, and net income variables. In the case of R&D expenses, the missing data could mean that the firm did not incur any reportable R&D expenses in that year under generally accepted accounting principles. Similarly, for dividends, missing observations may mean that the firm did not pay a dividend that year, rather than simply reporting a “0” value. It is also possible for a firm, under specific conditions, to record a “negative dividend” or to record negative R&D expenses. To deal with these measurement issues, we set all missing observations, and all negative observations, of R&D expenses and dividends to be zero. For each observation changed, we set a variable called R&D change flag, or dividend change flag, as appropriate, to one and included these variables as controls. To avoid a division by zero error in the case of net income, we added .001 to any observation reporting exactly zero in net income for that firm-year. We set a variable called net inc. change flag to one for each observation we changed, and included this variable as a control. Lastly, to address substantial skewness, we set the upper bound for R&D intensity and for the retention ratio to one, and we lowered observations with calculated ratios above 1.0 to the upper bound. This process effectively Winsorizes extreme values, and sets the range of our final EO measure from zero (a firm with no reported entrepreneurial behaviors) to one (a firm pursuing the maximum entrepreneurial behaviors).
We took the firm-year mean of R&D intensity and retention ratio to construct our EO measure. The inclusion of a firm-mean EO variable, as we discuss in our model section, allowed us to avoid industry adjusting the measure, which makes for a more intuitive explanation of the model results. Our operationalization is consistent with a unidimensional reflective measurement model, which as Anderson et al. (2019) note, has the advantage of lowering measurement error and accommodating more robust estimation approaches. It is worthwhile to note that adding the indicators together, as in a summative, formative approach, would not change the results presented here because not adjusting for the unexplained variance in the resulting measure (e.g., setting the disturbance term equal to zero) makes the variance in the summative formative and reflective measures equivalent.
Predictor and Control Variables
We measured environmental hostility as the inverse of the 5-year average growth in net industry sales at the four-digit SIC code level (Keats & Hitt, 1988). To calculate our hostility measure, we used year variables as predictors with net industry sales for each industry as the criterion in a regression analysis with the following form: yt = β0 + β1t + ε t , where y = log-transformed industry sales; t = year; and ε = the disturbance term. Consistent with Bergh and Lawless (1998), we used 5 years of data for each regression (e.g., 2005–2009 data predicted hostility in 2010). The regression slope coefficient is a measure of environmental munificence, which represents the average expected change in industry sales over the period, with higher values representing environments that are more munificent and a wider availability of opportunities for growth (Heeley et al., 2006). As most studies conceptualize hostility and munificence as opposite sides of a continuum when assessing the characteristics of the external environment (Dess & Beard, 1984; Walters et al., 2010), we multiplied the munificence indicator by negative one to align with our theoretical argument that higher values corresponded to higher environmental hostility.
We measured recoverable slack as the mean of three indicators consistent with Bourgeois and Singh (1983) and Miller and Leiblien (1996): the ratio of accounts receivable-to-sales; the ratio of selling, general, and administrative expenses-to-sales; and the ratio of inventory-to-sales. To address substantial skewness, we set the maximum value of each constituent at 1.0; for example, if a firm reported that accounts receivable exceeded revenue in a given year, that firm-year observation would be 1.0 for the accounts receivable to sales ratio. This approach effectively Winsorizes extreme values, and ideally, reduces measurement error.
We included 12 control variables in our estimated model. In addition to the three dummy variables mentioned previously, we controlled for available slack, measured as cash and marketable securities, less current liabilities, divided by gross revenue (Bourgeois & Singh, 1983). Available slack represents liquid assets available to a firm, and its presence or absence may confound a firm’s use of recoverable slack when responding to increasingly hostile environments. We controlled for potential slack—a firm’s exogenous borrowing capacity—following Wiseman and Bromiley (1996) with the firm’s debt-to-equity ratio, which is a proxy for a firm’s ability to tap outside sources of capital to fund internal operations. A higher debt-to-equity ratio indicates reduced borrowing capacity, and hence lower potential slack; the debt-to-equity ratio also proxies managerial risk-taking, in that a high debt-to-equity ratio represents senior manager’s willingness to take on substantive financial and credit risk.
To better isolate hostility, we controlled for environmental dynamism, measured as the standard error of the slope coefficient from the environmental hostility regression (Keats & Hitt, 1988). The standard error represents the level of unpredictability in an industry’s growth, with higher values indicating higher levels of dynamism. We controlled for five measures of firm performance: Tobin’s Q (essentially a firm’s market-to-book ratio), earnings per share (adjusted for stock splits), return on sales, return on equity, and sales growth rate. The wide array of performance metrics accounts for the broad nature of performance among publicly traded companies, and parcels out performance variations that may confound the hostility–EO relationship (Rauch et al., 2009). Lastly, we controlled for firm size using the firm’s total assets.
Analyses and Results
We fit a Within-Between Multilevel Model (WB-MEM), also called a hybrid model, to test our hypotheses (Certo et al., 2017; McNeish & Kelley, 2019). A WB-MEM model combines the effectiveness of a fixed effects model in dealing with endogeneity, with the efficiency and shrinkage of a partial pooling (random effects) model. We refer readers to McNeish and Kelley (2019) for a thorough treatment of the model and its benefits, but we want to highlight several key points for readers unfamiliar with the approach. The strength of a fixed effects model is to effectively eliminate a significant endogeneity concern in a multilevel model—a correlation between the lower level (level 1) predictor and the entity level (level 2) disturbance term (Antonakis et al., 2010). Research with econometric data most often exhibits this correlation; failing to address it biases the parameter estimates, and therefore fixed effects models are common in economics and strategy research (Certo et al., 2017). However, the weakness of fixed effects models is to only estimate a constant within-firm change in the outcome variable; comparisons between firms are not possible, nor is it possible to include other level 2 (higher order) predictors. Random effects models allow within and between comparisons, and allow for level 2 or higher predictors. The downside of random effects models is that if the level 1 predictors correlate with the level 2 (or higher) disturbance term, the model will yield biased estimates (Antonakis et al., 2010).
The WB-MEM model incorporates random effects, but requires a firm (group) mean-centered predictor for each potentially endogenous variable, along with the firm (group) mean of that predictor as an additional variable. The mean centered predictor is exogenous to the firm-level disturbance term and we recover a consistent parameter estimate (free of this type of endogeneity) by including the firm-mean variable (McNeish & Kelley, 2019). The parameter of the firm mean-centered variable represents the estimated within-firm effect and is equivalent to a traditional fixed effect specification for that variable, while the parameter of the firm mean predictor represents the estimated between-firm effect (Certo et al., 2017). The WB-MEM model also allows for the estimation of random intercepts (the deviation from the grand mean for each firm) and random slopes (the deviation from the average slope for each firm; McNeish & Kelley, 2019). WB-MEM models can also incorporate more than two levels, which is the case with our model of observations nested within firms nested within industries. Importantly, WB-MEM models do not eliminate all sources of endogeneity. They do, however, address a significant endogeneity concern, and incorporating random intercepts and random slopes has the advantage of the model better resembling actual economic conditions (Certo et al., 2017).
We depict our equations testing our full research model, reported as Model 3 in Table 2. Note that while the hostility measure is at the four-digit SIC code level (level 3{k}) it varies by year, making these observations firm-year variant.
Model Results—Fixed Effects (DV: Entrepreneurial Orientation).
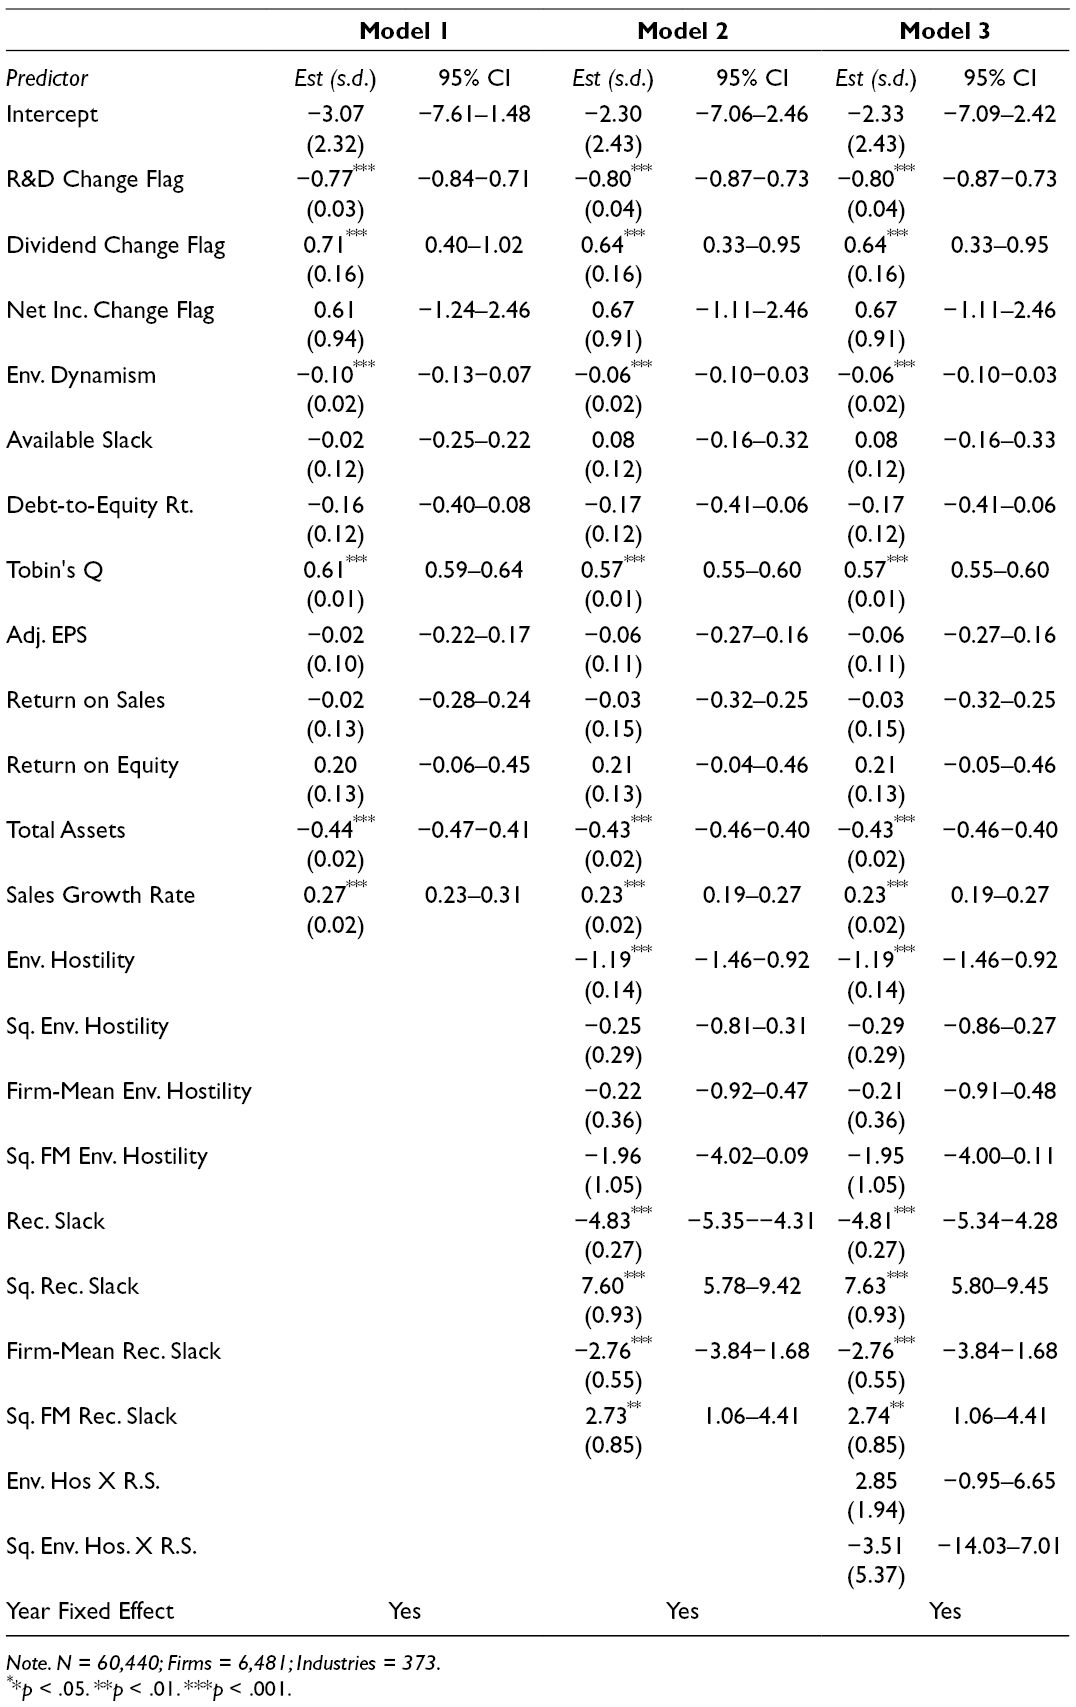
Note. N = 60,440; Firms = 6,481; Industries = 373.
**p < .05. **p < .01. ***p < .001.
Level 1:
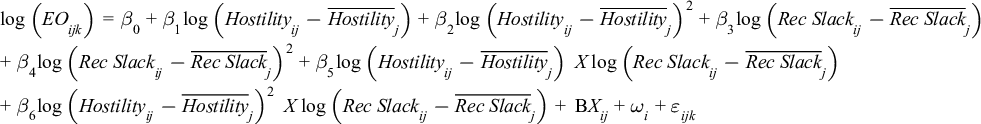
Level 2:

Our Level 1 equation predicts EO at time i for firm j in industry k; β0 is the overall Level 1 intercept, adjusted for the firm-mean value of hostility and recoverable slack and the squares of those values. β1 is the within-firm effect for hostility, adjusted for a firm-level random slope; β2 is the square of the within-firm effect with a random slope. β3 is the within-firm effect for recoverable slack, adjusted for a firm-level random slope; and β4 is the square of the within-firm effect with a random slope. γ01 is the between-firm effect for hostility; γ02 is the effect for the squared term. γ03 is the between-firm effect for recoverable slack; γ04 is the effect for the squared term. Xij is a vector of control variables with coefficient estimates Β; ωi is a year fixed effect, and εijk the disturbance term. We included the curvilinear terms for recoverable slack, reflecting that nonlinearity may be a source of spurious interaction effects (Aguinis et al., 2017).
As constructed, our measures of EO, hostility, and recoverable slack do not have an intuitive economic meaning. As such, we opted for a log–log modeling approach, with EO log transformed along with all our continuous predictors. For the transformation, we added the absolute value of the smallest value of the variable to the raw variable as a constant (effectively setting the minimum value at zero), and then added .001 to facilitate the transformation. A key benefit of a log–log model is interpretation, with the model parameters specified as elasticities. While technically an approximation, we can interpret the parameter estimates in terms of percent changes by percent change; for example, if βx = 2.5, we would say that for each 1% change in x, we expect approximately a 2.5% change in y, holding constant all other variables in the model.
We report the fixed effects (the coefficient estimates) of three models in Table 2. Model 1 is solely our covariates, Model 2 includes the effect of hostility and recoverable slack on EO absent the interaction terms, and Model 3 is the fully specified model. We prefer to interpret our results by looking at the strength of the estimated parameter while taking into consideration the standard error and 95% confidence interval (margin of error) around that parameter. This approach recognizes the limitations inherent to relying on pvalues for statistical inference (Anderson et al., 2019), and recognizes that with a sample size this large, very trivial effects may cross the p < .05 standard solely as a function of smaller standard errors (Wooldridge, 2010).
As Aguinis et al. (2017) note, scholars should generally not interpret a “direct effect” of a predictor in a moderation model absent the interaction terms itself. One reason that it remains popular to test a “direct effect” model and then an interaction model is the incorrect assumption that it is difficult to interpret the lower order parameter estimates in a model with higher order interaction terms. While we agree with Aguinis et al. (2017), we opted to evaluate Hypothesis 1 by comparing the estimates for Model 2 and Model 3. As reported in Table 2, the parameter estimates for hostility and slack remain demonstrably similar across models, and so we feel comfortable focusing on Model 2.
Looking first to the within-firm effect, we observed a roughly 1.2% decrease in EO for each one percent change in hostility (β = −1.19; SE = .14), and the marginal effect itself (the curvilinear term) changes by a small −0.3% change as hostility increases (β = −0.25; SE = .29). While our results are consistent with our hypothesis, the change in marginal effect is so small as to be trivial. As such, we find that within an average firm and over time, increasing hostility results in a monotonically decreasing level of EO. For the between-firm effect of hostility, we observed a trivial 0.2% change in EO as hostility increases by 1% (β = −0.22; SE = .36). While the change in the marginal effect is nearly 2% on average as hostility increases (β = −1.96; SE = 1.05), the margin of error around the estimate is such that we do not have confidence in drawing any substantive conclusions about the between-firm effect of hostility on EO.
We plotted the marginal effects for the within and between estimates of hostility across the range of observed values of hostility in Figure 2, with the 95% confidence interval in gray. Importantly, the use of a log transformation helps alleviate the concern of spurious curvilinear effects due to nonnormality in the data (Simonsohn, 2018), and visualizing the curvilinear relationship using the observed range of the predictor helps ensure that the predicted values of the model fall within the range of observed values in the data (Lind & Mehlum, 2010). Consistent with our model results, we observed only a trivial change in the linear effect of hostility on EO, and while the margin of error increases at the edge values of hostility, we are comfortable with our conclusion of a monotonically decreasing relationship for the within-firm average effect of hostility on EO over time. For the between-firm effect, the margin of error is large enough to temper any conclusion about the expected change across firms as hostility increases. The data are consistent with a range of possible changes in the between-firm marginal effect of hostility.
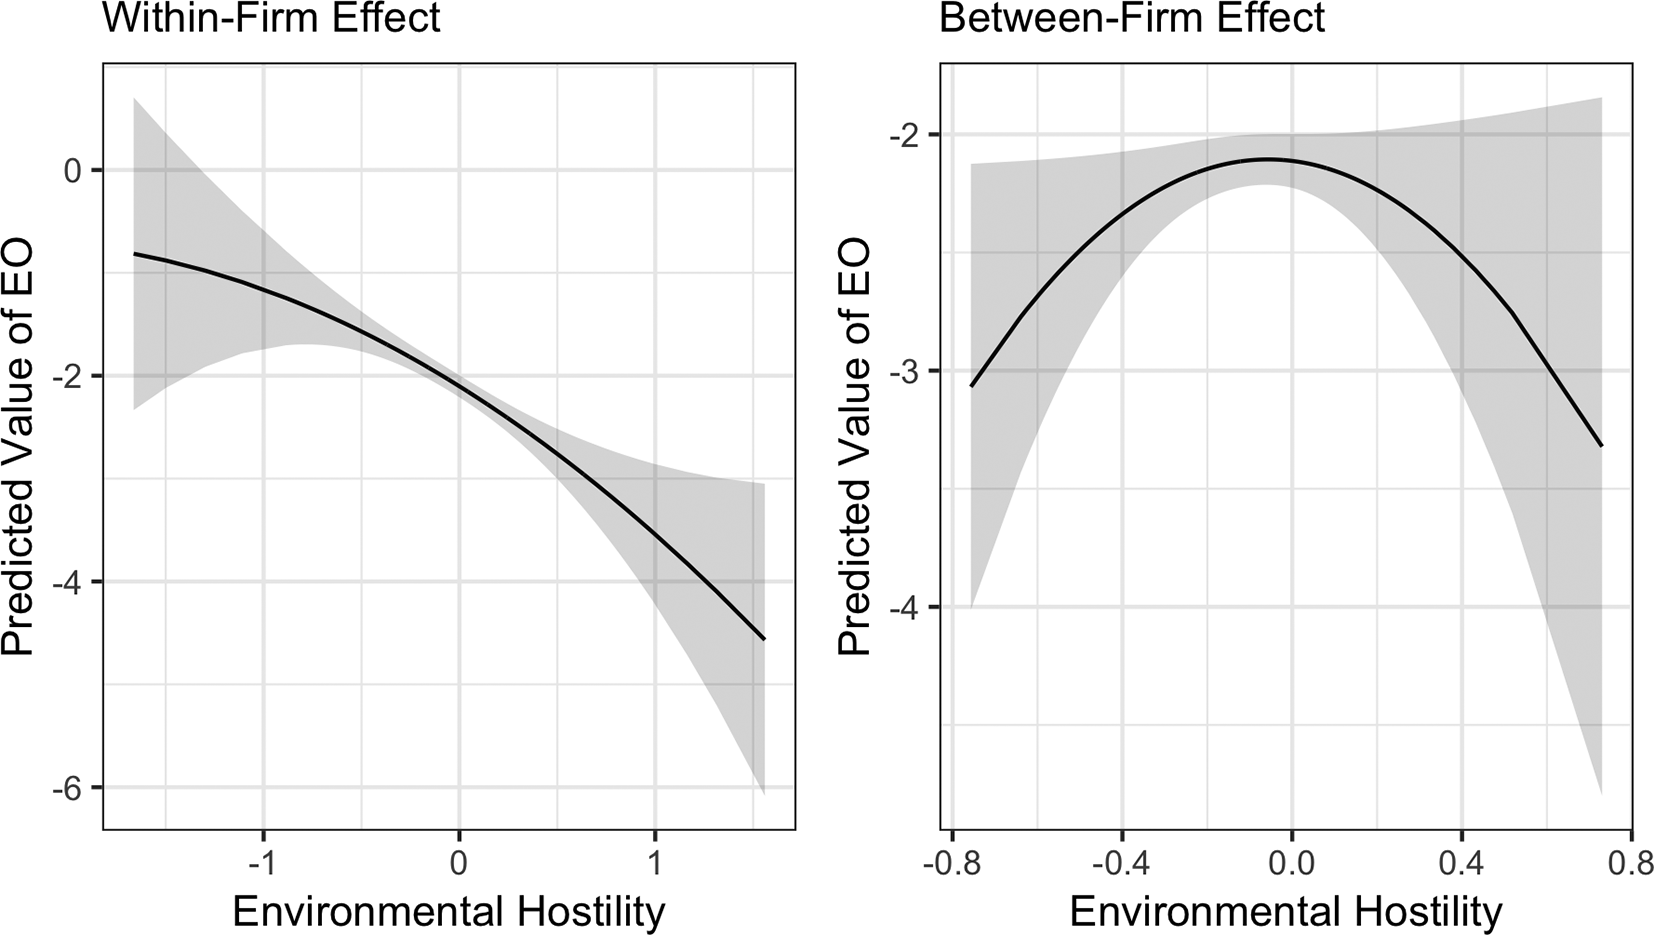
Effect of environmental hostility on EO.
Focusing on the interaction effect in Model 3, we observed a modest 2.9% change in the linear effect of hostility on EO in the presence of recoverable slack (β = 2.85; SE = 1.94), and we would like to note that the interaction effect specified is within-firm only. That said, the interaction differs from the hypothesized relationship, with lower levels of slack decreasing the negative linear effect of hostility on EO. For the change in the marginal effect (curvilinear interaction), the estimated parameter is a larger −3.5%, but the margin of error around this estimate is such that we do not have confidence in drawing substantive conclusions (β = −3.51; SE = 5.37). We plotted the interaction effect at the 25% and 75% quantiles of recoverable slack in Figure 3, along with a 95% confidence interval. The plot supports our conclusion that while lower recoverable slack results in a slight shift and tempering of the effect of hostility on EO, this change is quite modest.
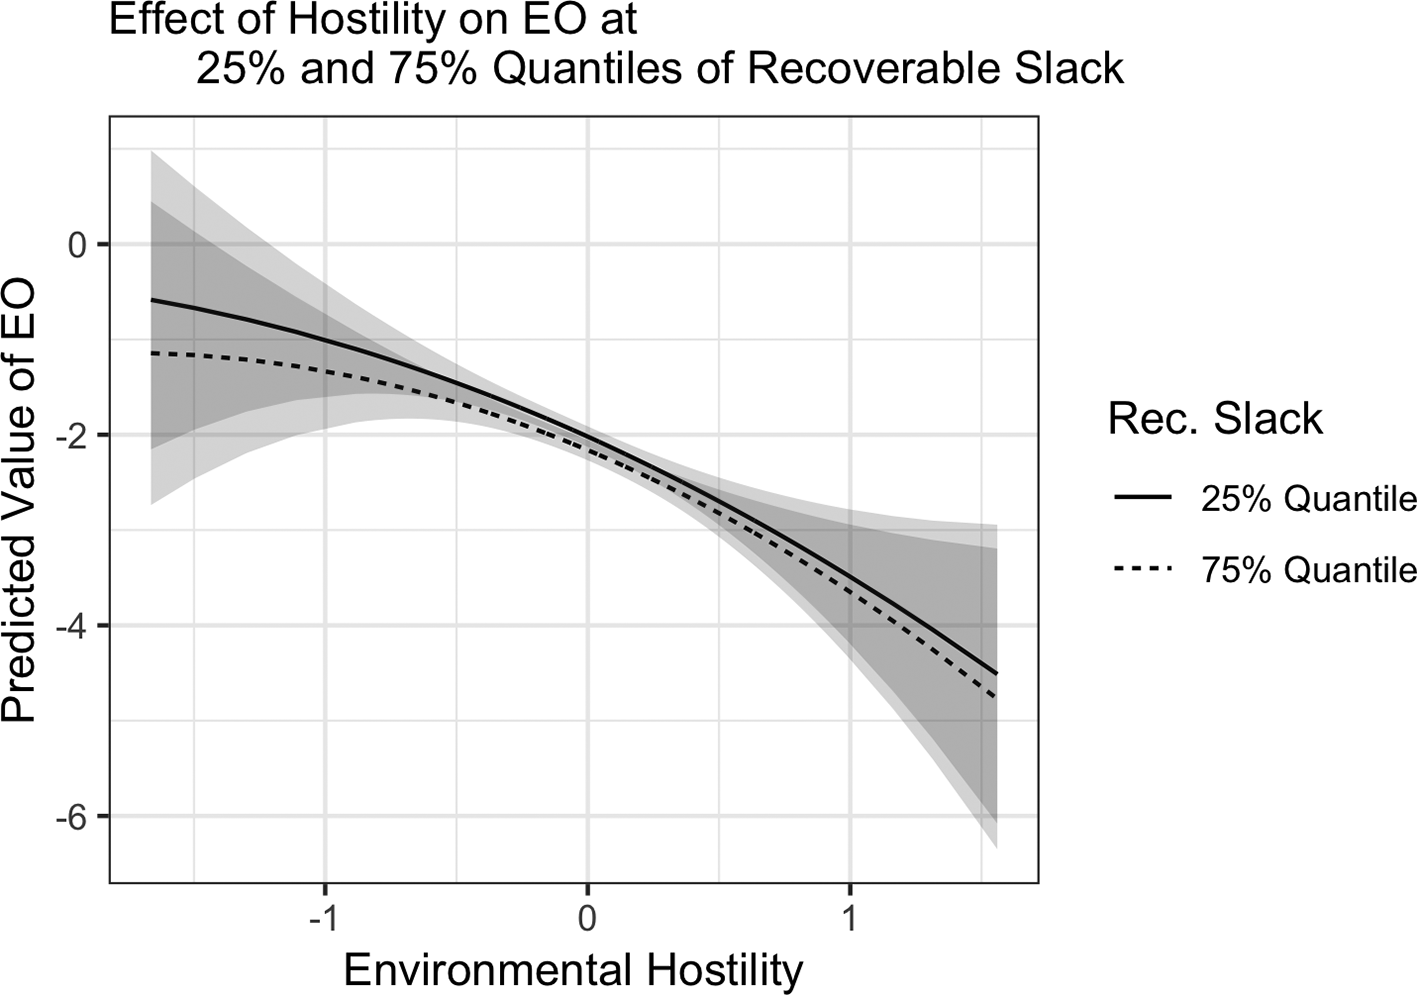
Interaction of environmental hostility and recoverable slack on EO.
In analyzing our model, we observed a relatively strong within and between effect of recoverable slack on EO, but in a differing manner from our theoretical model. We did not offer a hypothesis about recoverable slack’s relationship to EO, but conjectured that recoverable slack would act as a buffering mechanism allowing the firm to adjust to increasing environmental hostility. However, the within-firm effect of recoverable slack suggests a general linear decrease in EO as slack increases 5% on average for each 1% change in slack (β = −4.83; SE = .27). Further, the size of the change in marginal effect of more than 7% (β = 7.60; SE = .93) suggests the presence of a robust U-shaped relationship between slack and EO. Within-firm and over time, on average, moving from very low levels of recoverable slack decreases EO until a firm-specific inflection point, at which point increasing slack increases EO. We observed a similar pattern for the between-firm effect of recoverable slack on EO, with a roughly 2.8% decrease in EO for each 1% increase in slack (β = −2.76; SE = .55), but a nearly equivalent 2.7% change in the marginal effect of slack as slack increases (β = 2.73; SE = .85), again suggesting a U-shaped between-firm effect of slack on EO. We plotted the relationship between recoverable slack and EO in Figure 4. We observed a robust U-shaped relationship for the within-firm effect, which is consistent with our model results, and a relatively small margin of error around the estimate. While the between-firm effect exhibits a similar trend, the confidence interval is so large at higher levels of recoverable slack that the data are also consistent with a monotonically decreasing predicted level of EO at high levels of slack.
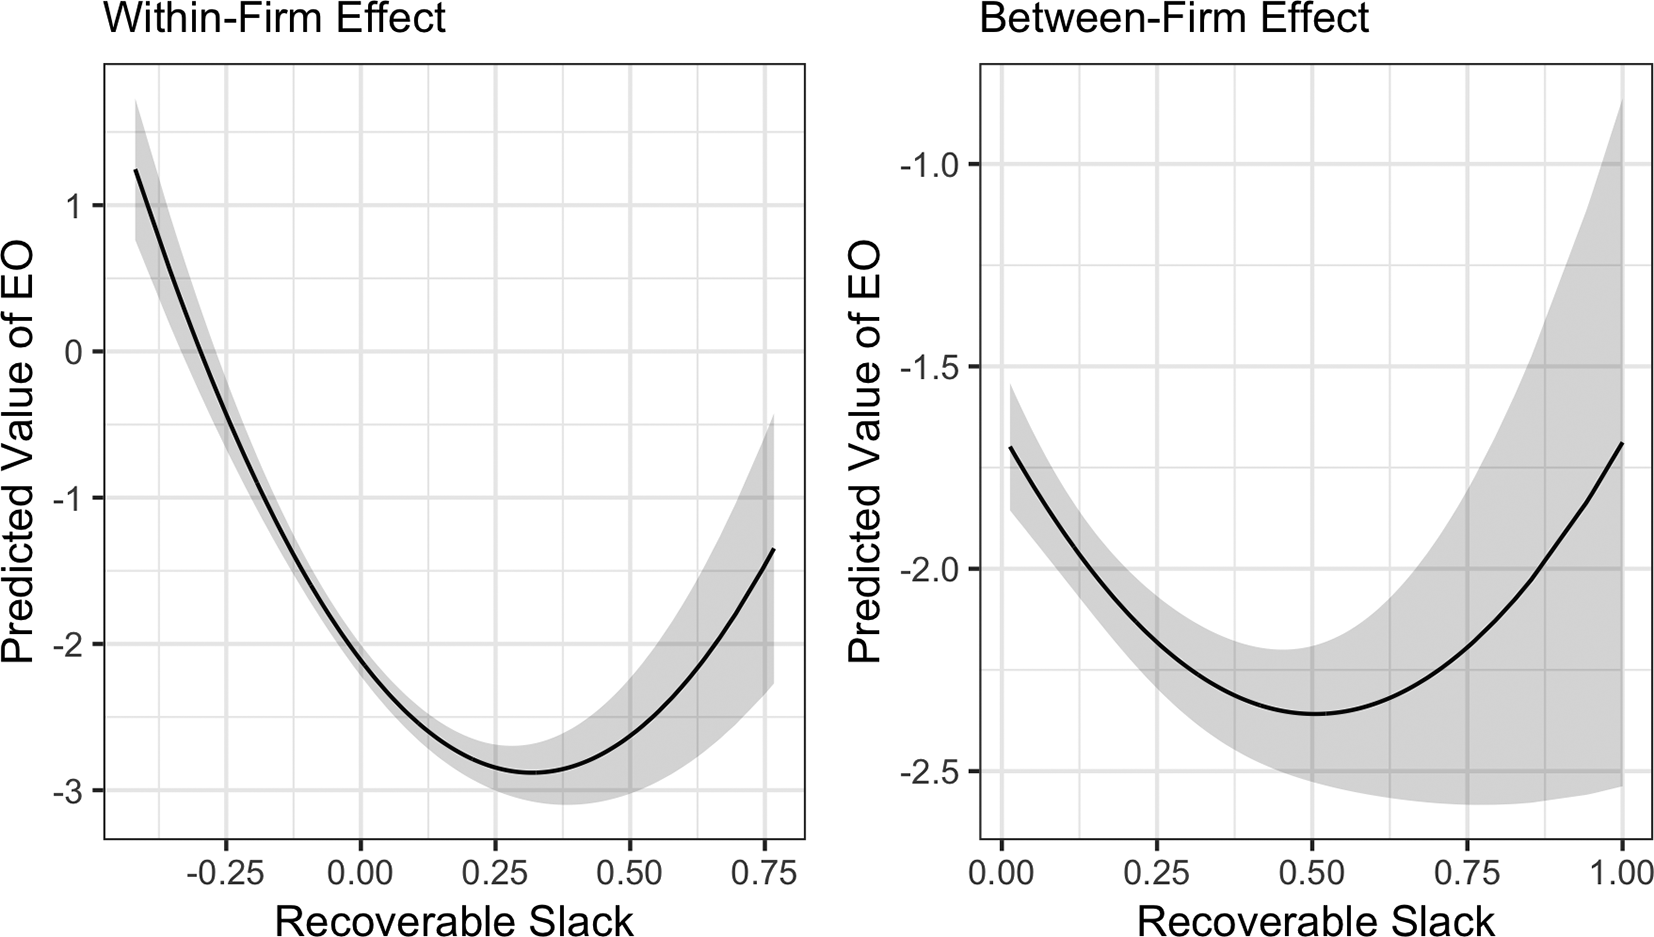
Effect of recoverable slack on EO.
We report the random effect parameters for each model in Table 3. Across our models, we found over 20% of the variance in EO attributable to the firm level, and over 8% attributable to the industry level (ICC values). These findings support the use of a WB-MEM model account for unobserved heterogeneity, but also support the observation that pursuing entrepreneurial behaviors is very much a firm-specific decision (Anderson et al., 2019). While the firm’s industry and task environment influence entrepreneurial behaviors, within-firm factors offer a fruitful area for EO researchers to investigate additional antecedents of a corporate-strategy manifestation of EO. Interpreting the random intercept-random slope correlations (ρ01), we find across models that firms with roughly the average slope for the linear trend of hostility (ρFirm x Hos) will see a demonstrable negative change in the marginal effect of hostility on EO as hostility increases (ρFirm x Sq Hos) and a lower expected mean level of EO. We observed a similar pattern for recoverable slack—firms with slightly larger than average slopes for the linear trend of recoverable slack (ρFirm x Rec Slack) will see a demonstrable negative change in the marginal effect of slack on EO as slack increases (ρFirm x Rec Sq Slack) and a lower expected mean level of EO.
Model Results—Random Effects (DV: Entrepreneurial Orientation).
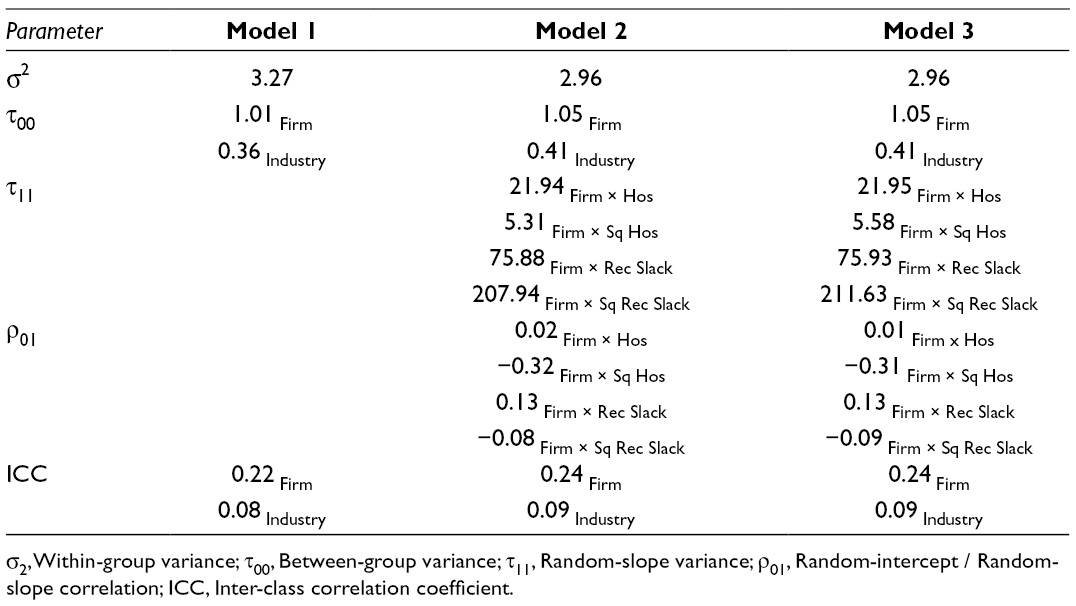
Abbreviations: σ2, Within-group variance; τ00, Between-group variance; τ11, Random-slope variance; ρ01, Random-intercept / Random-slope correlation; ICC, Inter-class correlation coefficient.
Robustness Evaluation
We conducted three main robustness tests on our model. In our first test, we estimated our models absent covariates, which resulted in only trivial changes to the estimated parameters. In the next test, we filtered out the observations flagged with a change to the R&D expenses, dividend, or net income variable, investigating the possibility that despite the inclusion of the covariate, the model may be sensitive to the inclusion of these observations. Reported in our online notebook, this model included 38,592 observations from 4,378 firms, a substantial drop in the sample. Nonetheless, we observed only trivial changes in the model parameters. Lastly, we estimated a model lagging our focal predictors by 1 year, to investigate the temporal stability of the model. As reported in our online notebook, we observed demonstrably similar parameter estimates for this model compared to our primary model. As such, we have confidence in the efficacy of our reported model.
Discussion and Implications
Contrary to our hypotheses, our results support a predominantly negative relationship between environmental hostility and EO. Consistent with a threat rigidity perspective, these findings suggest that firms quickly pull back from employing entrepreneurial behaviors as the external environment becomes more hostile. Further, while there is a small increase in the marginal effect of hostility on EO as hostility increases, contrary to our prediction, for an average firm and across time increasing hostility decreases EO at a mostly constant rate. This is consistent with Rosenbusch et al.’s (2013, p. 636) observation that “firms operating in hostile environments face difficulties in acquiring resources…. such resources are needed to pursue entrepreneurial strategies in firms with a high EO.” Although some studies suggest that entrepreneurial firms generally perform better than their conservatively managed peers while operating in hostile environments (e.g., Covin & Slevin, 1989), our results suggest that at the very time firms should be expanding their entrepreneurial behaviors to better deal with an inhospitable environment, this same environment may serve to depress these behaviors in practice. As such, the paradox in the EO literature remains.
We posited, however, that recoverable slack acts to buffer the negative effect of hostility on EO. Because recoverable slack acts as surplus resources embedded within the firm’s cost structure, we argued that high levels of recoverable slack allow the firm to slow its strategic modifications in the face of diminishing extant growth opportunities (Chattopadhyay et al., 2001). We observed no material change, however, in the marginal effect of hostility on EO as a function of the presence of recoverable slack. While our results suggested a trivial shift upward and slight attenuation in the presence of low levels of recoverable slack, this finding could just as easily be a function of measurement error as indicative of a true underlying condition. In the context of other slack research, our findings reflect that the effect of slack on organizational outcomes and as a boundary condition may simply be highly idiosyncratic to a firm (Wiseman & Bromiley, 1996). How senior managers deploy slack in the face of changing environmental exigencies may be a function of the specific strategic conditions facing that firm at that time, thus obscuring any generalizable trend across a heterogeneous sample (Deephouse & Wiseman, 2000). One implication for future research may be that mixed methods designs, employing both ethnographic and econometric approaches, may yield the finer-grained insights that likely typify how firms make resource allocation decisions among their various sources of slack resources.
As we mentioned in our results section, the analysis of the interaction effect prompted a further examination of the direct effect of recoverable slack on EO. We did not offer a hypothesis about this relationship, and in the spirit of Wennberg and Anderson (2019), provide the visualization in Figure 4 and our discussion here as exploratory post hoc analyses, and make no claims as to the veracity of these results except as a potentially valuable starting point for additional research. What sparked our interest was the relatively robust U-shaped relationship between recoverable slack and EO. As noted in the “Results” section, the within-firm effect is demonstrably stronger than the between-firm effect, which makes sense if we consider the employment of slack to be idiosyncratic to the firm’s specific strategic condition. If robust and generalizable, our findings situate recoverable slack as behaving in a similar way to available slack (Deephouse & Wiseman, 2000). Low levels of recoverable slack associate with high levels of EO as the firm aggressively pursues options for growth with very little excess capacity. The growth imperative diminishes as resources accumulate diminishing entrepreneurial behaviors, only to increase again as substantial resources enable excess risk-taking without much threat to organizational survival. A fruitful future study then is a causal model comparing the two, or potentially three, forms of slack on different operationalizations of EO at the corporate strategy level to understand the dynamics of this relationship (Anderson et al., 2019).
Certain caveats are prudent when interpreting the results of our study. While our findings lend credence to the threat rigidity perspective, there are alternate theoretical perspectives such as behavioral theory, prospect theory, and strategic reference point theory that may be valuable in explaining the influence of environmental exigencies on EO. Our arguments and empirical results help to augment such theories by suggesting that the external environment may be a primary driver in determining when organizations switch from entrepreneurial to conservative behaviors. For example, research on behavioral theory (Cyert & March, 1963) and prospect theory (Kahneman & Tversky, 1979) suggests that managers and organizations may increase their risk-taking behaviors when performance falls below a certain level. Likewise, strategic reference point theory acknowledges that both internal factors (such as firm performance) and external factors (such as the environment) serve as strategic reference points in transitioning organizations from risk-seeking to risk-averse behaviors (Fiegenbaum et al., 1996). Our results suggest one such external factor that may serve as a strategic reference point in pushing firms to switch from embracing entrepreneurial behaviors to diminishing such strategies.
Further, our EO operationalization departs from the preponderance of prior EO studies that have largely employed survey-based data (Covin & Wales, 2019; George, 2011; Wales et al., 2019). Our conceptualization exists largely at the corporate-strategy level and subsumes only the capital allocation decisions representing behavioral manifestations of innovativeness and proactiveness. As such, our findings are not directly comparable to EO research using psychometric measures, nor EO research using content analytic measures. We would suggest, however, that it is necessary to push the nomological boundaries of EO research into areas where survey data collection is not practical. As noted by Wales (2016, p. 13), the use of secondary measures of EO “represents a highly useful step toward the goal of advancing alternative operationalizations of EO. Hopefully, pioneering attempts to measure EO using secondary data will be further refined by future authors, reviewers, and gatekeepers such that EO conversations may be expanded into new areas.” Further, we derive our environmental measures—hostility as a focal predictor and dynamism as a control—based on the financial performance of industry participants. This is also a departure in that many EO studies measure hostility and dynamism with psychometric indicators of these variables drawn from the perceptions of the senior manager/respondent. There are likely differences in the nomological conclusions drawn from different operationalizations of EO and of a firm’s external environment, and future research in this area would be beneficial in determining the extent of such differences.
We think it worthwhile to mention that we do not believe that the financial indicators we selected represent the one “best” way to measure EO among large, publicly traded firms. Content analysis, which continues to improve in both sophistication and in dealing with measurement error, is a useful alternative for EO scholars (McKenny et al., 2018). We also believe that machine learning techniques offer possible approaches for measuring EO by combining financial ratios, content analysis, and other secondary sources. What we caution against, however, is the perspective that one of these approaches is fundamentally superior. As Covin and Lumpkin (2011) note, the dominance of the Covin and Slevin (1989) EO scale has, in some ways, led to the mindset that if a study does not use the scale, the resulting construct is not EO. This has been a limitation for the field, and has arguably hampered the adoption of new ways of measuring and conceiving of EO (Covin & Wales, 2019). As we look to deepen EO research among publicly traded firms, we are hopeful that scholars do not adopt a similar perspective on the validity of financial ratios or content analysis to the detriment of the other. We hope that scholars will find our EO operationalization, and our arguments for its validity, useful in thinking about new ways in which we might measure EO among a set of firms not easily studied as a compliment to, and not a replacement of, content analytic approaches.
Footnotes
Appendix A. Choice in Modeling Entrepreneurial Orientation
In this study, we adopted the Anderson et al. (2015) EO reconceptualization that splits EO into its constituent dimensions of entrepreneurial behaviors and managerial attitude toward risk. We did not, however, directly model risk, but rather controlled for its behavioral manifestation by including the firm’s debt-to-equity ratio as a covariate. There were two key considerations for this decision.
The first consideration was conceptual. As we argue, hostility is not likely to directly impact managerial attitudes, in the sense that we do not draw a clear linkage between the firm’s task environment and how that environment shapes managerial disposition. As Anderson et al. (2015) discuss, managerial attitude toward risk is likely a stable dispositional trait of the firm, similar conceptually to Covin and Lumpkin’s (2011) discussion of EO as an inherent attribute of a firm. In this way, we do not expect hostility, or other antecedents for that matter, to exhibit much of an effect on managerial attitude toward risk because these attitudes, at least theoretically, should not vary to a significant degree over time.
That said, because the presence of entrepreneurial behaviors and managerial attitude toward risk jointly define EO’s conceptual space, both are necessary in a model (Anderson et al., 2015). However, and we believe that this is valuable for future EO scholars looking to build on our measurement approach, the researcher must conceptually delineate whether a given antecedent or consequence relates in the same way and of the same magnitude to EO’s constituent dimensions. In this study, we argued that hostility and recoverable slack jointly influence entrepreneurial behaviors but do not materially relate to managerial attitudes; another study may specify an antecedent that jointly differentially influences both dimensions; and so on.
That said, there is no empirical way to delineate whether the measures we offer here strictly capture a behavioral manifestation of EO. We can confidently say that these are the firm’s observable capital allocation decisions, although we are only able to offer conceptual arguments as to why these measures are valid proxies for entrepreneurial capital allocation decisions. While we believe they are valid, as Covin and Wales (2012) noted in their outstanding treatment of measurement issues in EO research, as a latent construct, EO exists independently from its measures, and as such, there are multiple ways in which researchers may measure EO. EO is not, then, the Covin and Slevin (1989) scale any more than EO is the measurement model we offer here. The conceptualization drives the measures, and not the other way around (Covin & Wales, 2019).
The second consideration was modeling complexity, and it relates to the previous consideration. Anderson et al. (2015) specified a relatively simple multiple dependent variable structural equation model to illustrate their measurement model. In this study’s case, to test a joint effect of hostility, including the interaction effect, on entrepreneurial behaviors and managerial attitudes toward risk we would have needed to specify a longitudinal Within-Between multiple dependent variable structural equation model—we do not know of examples in the literature where scholars have properly estimated such a model. We concur strongly with Anderson et al. (2019) that the more complicated the model, the higher the probability of model misspecification. We believe that this is an important consideration for EO researchers looking to our measurement model and other measurement models that capture EO at different levels of analysis and with nonpsychometric indicators.
We do, however, wish to highlight an area we feel may be fruitful for future EO research, particularly at the corporate-strategy level. We argue in this study that the content analytic measurement model developed by McKenny et al. (2018) is best situated to capture a dispositional perspective on EO. This is, admittedly, a perspective other EO researchers may not share. However, we do believe that creating space in the literature for two corporate-strategy level EO measurement models, one capturing a behavioral perspective and one capturing a dispositional perspective, creates valuable new pathways for EO research using nonpsychometric indicators.
Consider, for example, an unmodeled, but theoretically interesting, confound of how environmental changes influence top management team decision-making. We can observe, as we do here, what capital allocation decisions the firm made after observing changes in the environment, but we cannot observe in our model how senior managers went about making those allocation decisions. This is where we see studies integrating both EO measurement models as being potentially useful to the EO literature. For example, a paper may incorporate a mixed method design and model the same antecedent variable to a behavioral outcome in one study, and a dispositional outcome in another. With a large enough sample, it may be possible to collect data on both behavioral and dispositional EO measures, and then specify multiple models using different combinations of outcome and covariates. Over time, it may be possible to implement the multiple dependent variable model discussed previously, which if properly specified, could yield powerful new insights for EO research.
Authors’ Note
A condensed version of this manuscript appeared in the 2013 Academy of Management Conference Best Paper Proceedings.
Declaration of Conflicting Interests
The author(s) declared no potential conflicts of interest with respect to the research, authorship, and/or publication of this article.
Funding
The author(s) received no financial support for the research, authorship, and/or publication of this article.
Author Biographies