
Abstract
Digitization has enabled “testing-the-waters” in entrepreneurial finance whereby investors can make nonbinding commitments in equity crowdfunding prior to an actual campaign to ascertain interest in the project. We consider whether these nonbinding equity investment commitments are informative about actual investments during the campaign and, thus, ultimate startup funding success. The data indicate that only 18% of nonbinding commitments are, in fact, invested. The evidence is consistent with hypothetical bias. Hypothetical bias is significantly less pronounced among women and among investors living in higher income areas or in areas with higher levels of education. While investment intentions are only partially reliable at the individual level, the aggregate amount of collected investment intentions is a strong predictor of campaign success. We investigate alternative reasons for withdrawals, such as lying and informational motives, both of which we find implausible alternatives to hypothetical bias.
How entrepreneurs convey information to investors and how investors carry out due diligence have been widely studied topics in entrepreneurial finance from different perspectives, including, for example, venture capital (Manigart & Wright, 2013; Cumming & Zambelli, 2017), angel finance (Bonini et al., 2018, 2019), and crowdfunding (Butticè et al., 2017; Wright et al., 2016; Cumming et al., 2019). Innovations through digitization offer new approaches to explore the entrepreneurial fundraising process. Some of these approaches are highly debated in practice. In this article, we examine one such approach that is known in entrepreneurship practice and policy as “testing-the-waters.” In our examination of this new context, we introduce new theory and hypotheses pertaining to behavioral entrepreneurial finance.
“Testing-the-waters” (TTW) refers to soliciting indications of investor interest prior to filing disclosure material. While TTW is not permitted with equity crowdfunding in the United States, there is substantial policy debate concerning whether it should be. 1 This debate has expanded more generally toward allowing TTW to extend to all types of offerings. 2 This policy debate has been going on without the guidance of empirical evidence. On the positive side of the debate, TTW allows entrepreneurs to see whether going ahead to try to raise capital is worthwhile. On the negative side, TTW may unfairly induce investors to invest without proper disclosure (hence, the SEC Act of 1932 in the United States). Moreover, TTW may, in fact, not be that informative. Anecdotal evidence and the odd reported case suggest that the TTW rule can suffer from an upward bias in the evaluation of funding potential; for example, Elio Motors had indications of interest of $30 million but eventually raised just $17 million. In another example, investors made pledges of $30 million to Virtuix, which only raised $7 million. 3 This discrepancy between pledged and realized funding under a nonbinding commitment rule suggests that there are cognitive biases at play in the decision-making process of investors. This study fills this gap in the literature with a view toward guiding research and policy on the economic value of testing-the-waters in equity crowdfunding, where investment decisions play an important role. We try to explain the potential discrepancies associated with the TTW rule by building on a microanalysis, that is, from the viewpoint of the individual investors. Specifically, we address the following research questions: First, what drives individual crowd investors to deviate from their intended financial commitment to an entrepreneurial start-up? Second, are hypothetical investment commitments valuable predictors of future entrepreneurial fundraising success?
When making commitments to eventually invest in another’s business, individuals may later withdraw from their commitment, especially when there is no cost to do so. While in some situations this withdrawal may be due to deliberate lying, in other situations, it is due to the fact that individuals make different decisions in a hypothetical situation than in a real one, a phenomenon called hypothetical bias (Cummings et al., 1997; Döbeli & Vanini, 2010; List, 2001; Murphy et al., 2005). Hausman (2012) defines this bias as the simple fact that “what people say is different from what they do.” More formally, Murphy et al. (2005), in their meta-analysis, describe this bias as the “difference between stated and revealed values” when people answer surveys. In the context of consumer research Alexander et al. (2008) observe such a discrepancy for technological products: the interest consumers express at a given time does not transform into buying in the future. An explanation of this difference between intent and realization exists in the concepts of desirability and feasibility proposed in the Construal Level Theory by Liberman and Trope (1998). In a hypothetical, distant context, desirability is of great importance, but in a real, close situation, feasibility dominates.
In entrepreneurial finance, Tumasjan et al. (2013) find that individuals place different weights on the “desirability” and “feasibility” (two dimensions of the decision-making process; Schlaegel & Koenig, 2014) of an offered opportunity, whether the opportunity exploitation is in the future or in the present. While they did not study hypothetical situations, their framework helps us to understand the underlying mechanisms that lead to hypothetical bias. Indeed, once the opportunity is real, the feasibility (e.g., availability of funds) becomes more important, causing investors to revise their first evaluations. This revision is typically downward, since feasibility places extra constraints on the possibility of making the investment. Hypothetical bias leads individuals to withdraw from earlier commitments, either partially or entirely. When this behavior becomes significant, it may generate uncertainty for the entrepreneur in need of funding an ongoing project. TTW thus becomes an inefficient mean to assess funding outcome. In this article, we raise for the first time the question: When do individuals actually invest what they said they would invest? While this question is applicable to many areas of social and economic activity, we examine this research question in a novel context, namely, in a setting where investors are asked to make a nonbinding announcement about their intention to invest in a true entrepreneurial startup. 4 We aim to better understand what motivates individuals to withdraw their initial commitment concerning materializing their investment.
Recently, investments in entrepreneurial startups have become possible through crowdfunding platforms, including equity crowdfunding platforms where entrepreneurs issue financial securities to raise funds for their investments. To avoid too many “lemons” ending up on their websites, these platforms need to do thorough due diligence, far more than what is done on reward-based crowdfunding platforms, since their projects are more complex and involve securities issuances that are generally heavily regulated (Hornuf & Schwienbacher, 2017). To reduce their own screening costs, some platforms run a preinvestment phase (occasionally called the e-vote phase) where interested investors declare their investment intentions and provide feedback (e.g., grades) on the proposed project before the campaign is started. This approach allows entrepreneurs to “test the water” and provides useful information to the platform concerning whether to allow the startup to launch a campaign. The benefits for the platform are twofold: first, such testing enables the outsourcing part of the otherwise costly due diligence process to the crowd; and second, the platform is able to precollect investment commitments to better assess the likely supply of capital from some of its members. 5 However, the reliability of this preinvestment phase depends on the extent to which individuals really invest in what they said they will to support the startup being voted on. While we will control for several alternative possibilities (e.g., the fact that time passed and other opportunities were presented to investors, making them change their minds because of better opportunities), we will argue that voters are subject to a hypothetical bias, which causes many individuals to withdraw from their investment intention when a campaign is eventually started.
Hypothetical bias has already been studied in other contexts (Cummings et al., 1997; List, 2001), though mostly in experiments or through questionnaires. Our context offers several benefits and novel aspects that can offer new insights. First, our analysis is not performed in an experiment in which individuals are confronted with a hypothetical decision or a decision that offers only small monetary rewards. Rather, individuals are registered investors on the largest and oldest equity crowdfunding platform in France and invest their own money, on average over one thousand euro per investment, in an entrepreneurial startup. Thus, they are confronted with a true investment decision with meaningful financial consequences. Second, our setting involves a nonbinding commitment (something we will below call “investment intention”) in which there is no obligation to, in fact, make the investment later. Individuals can reconsider the level of their commitment or even completely withdraw without any consequences for their future participation on the platform or access to future investment opportunities. They may even continue to participate in future votes on other projects. Moreover, hypothetical bias may be particularly pronounced in equity crowdfunding, since the projects are difficult to evaluate. In the context of innovative consumer products, Hofstetter et al. (2013) find that individuals less able to evaluate a product’s utility exhibit stronger hypothetical bias. Since crowd investors are not professional investors, like venture capitalists, their capacity to evaluate these projects is presumably limited.
A novel feature of our analysis is that we examine factors that affect the extent to which hypothetical bias may differ from one individual to another. Based on the literature exploring the role of trust in investment decisions (Guiso et al., 2004; Harrison et al., 1997), we conjecture that hypothetical bias will be less pronounced among females and among individuals living in higher income areas or in areas with higher levels of education. The intuition behind this conjecture is that trust is at the origin of more cooperative behavior, which, in turn, mitigates hypothetical bias.
To test these predictions, we use individual investment and voting data from the equity crowdfunding platform WiSEED, which is the largest and oldest equity crowdfunding platform in France. 6 There, members can cast votes on projects by providing feedback on different project characteristics and by reporting an investment intention (starting with as little as €100). Projects with enough positive votes and accumulated investment intentions are then allowed to start their campaign. (More details on the different steps are provided, below.) Voting and nonvoting members can then invest. Our database enables us to investigate the sample of voters by comparing their nonbinding investment intention, reported during the voting period, and their actual decision in the event a campaign takes place.
We obtain the following results. First, on average, members who voted provide only approximately 18¢ for each euro they said they would commit, which is remarkably low. The data examined are consistent with hypothetical bias. These results are robust to controlling for various alternative hypotheses and econometric specifications. For example, voters tend to invest significantly less as the time gets longer between the voting period and the campaign start, suggesting a “‘fades” effect. Follow-up analyses suggest individuals’ decisions to withdraw are not driven by the fact that they would deliberately lie (for instance, for the sake of helping the entrepreneur) or inflate the investment amount to secure the campaign start (e.g., to receive more information when the campaign takes place), rather more that they are subject to a hypothetical bias. We obtain similar results when controlling for possible selection bias, as voting may not be random. We find this value is lower for men (16¢) than women (21¢), with these values being significantly different from each other. Moreover, members who just registered, live in a poor area (based on postal codes) or in an area where the average education level is low, tend to invest significantly less than what they said they would during their vote. These findings are consistent with the view that social trust (which is related to education and wealth, according to Alesina & La Ferrara, 2002) helps build trust, which affects the likelihood of fulfilling commitments. Finally, at the aggregate level, we find that the information collected during the e-vote phase by the platform offers little value for predicting campaign success, except for the cumulative amount of intended investments. In contrast, average grades have no predictive power for campaign success.
We make two key contributions to the existing literature. First, we contribute to the literature on cognitive biases. We apply the Construal level theory (CLT) of Trope and Liberman (2010) and expand the framework of “temporal distance” in opportunity evaluation by Tumasjan et al. (2013) to derive an explanation for why crowd investors (or any investor in risky, entrepreneurial firms) are subject to hypothetical bias. We further provide new empirical tests of the importance of hypothetical bias in the entrepreneurial context, based on a natural experiment rather than a laboratory experiment or the use of questionnaires (Döbeli & Vanini, 2010). To the best of our knowledge, this study is also the first to examine the presence of hypothetical bias in investment decisions of retail investors, which allows us to derive implications on the TTW policy currently being debated in the United States for equity crowdfunding. Second, we contribute to the crowdfunding literature by examining, for the first time, how crowd investors help the platform in screening the projects. Existing studies only consider crowd investors as individuals who provide funds to startups. Our study provides evidence that while some members participate in both roles (as feedback providers and as fund providers), others either vote or invest only. In fact, we show that voters only provide a small fraction of the funds, with the bulk coming from nonvoters. This outcome suggests the presence of distinct roles for members of the platform. Furthermore, in the context of crowdfunding studies, a unique contribution of our work provides evidence for the cognitive biases of contributors. Other studies have documented cognitive biases for crowdfunded entrepreneurs but not crowd investors. Our unique dataset allows us to shed light on these issues.
The rest of the article is structured as follows. In the next section, after performing a literature review, we formulate testable hypotheses. Thereafter, we describe the empirical setting, data, and summary statistics of the sample. The subsequent section provides the results of the multivariate analyses performed to test our hypotheses. In the final section, we discuss policy implications and provide concluding remarks.
Related Literature and Hypothesis Development
In the first subsection, we discuss the related equity crowdfunding literature to provide some background and institutional context and then present our theoretical hypotheses in the subsequent subsections.
Related Literature on Equity Crowdfunding
Equity crowdfunding has emerged as a new means of financing startups. Existing studies on equity crowdfunding have examined what happens during the campaign and its ultimate outcome, which helps explain determinants of success (see, e.g., Ahlers et al., 2015). Other studies examine the dynamics during the campaign, notably evidencing the presence of informational cascades (Vismara, 2017) and the impact of the share allocation mechanism (Hornuf & Schwienbacher, 2016).
An equity crowdfunding campaign typically involves many small investors (Hervé et al., 2019; Vismara, 2017) who are geographically dispersed (Guenther et al., 2017). Generally, crowd investors are not professional investors, a situation that is in sharp contrast with other forms of equity financing, such as venture capital and angel financing. Little is known about the capacity of crowd investors to select proper investments themselves. For reward-based crowdfunding of artistic projects, Mollick and Nanda (2015) find that the crowd selects projects qualitatively similar to those the experts select. However, these results cannot be directly applied to equity crowdfunding, since these projects are more complicated to evaluate than are artistic ones. As recently evidenced by Jame et al. (2016), Chen et al. (2014), and Avery et al. (2015), nonexpert investors are nevertheless good at predicting financial outcomes. These findings underline the value of peer advice in the area of investment. Budescu and Chen (2014) argue that relying on a large crowd alleviates the effect of extreme opinions that work as outliers. They thus speak in favor of some form of externalization of the due diligence process in equity crowdfunding (besides the fact that the platform also reduces its own costs). Crowd due diligence alleviates information asymmetry between entrepreneurs and funders, as entrepreneurs rely on their own social network (mostly “friends and family”) to attract the first backers (Agrawal et al., 2015). Finally, individuals may be “happy” with participating in voting activities, for instance, because they feel a sense of belonging to a community (Cumming & Johan, 2013).
Hypothetical Bias: Hypothesis Development
By organizing a vote among its members during the due diligence phase, the platform relies on the crowd to help screen projects before the campaign even starts. The fact that individuals make investment commitments is a valuable piece of information for the platform to assess chances of campaign success, independently of quality assessment of the startup itself. For instance, the aggregate amount of commitments may provide valuable information to the platform on the likely success of the crowdfunding campaign, similar to the book-building process prior to a company’s initial public offering or any other securities issuance (Vismara, 2017). For the startup, this process is truly a means to “test the water.” However, the usefulness of organizing votes hinges on whether the actions of crowd investors follow what they said they would invest. Otherwise, the recorded vote may simply be “cheap talk” and thus create “noise” with little value for the due diligence process.
Several elements in the literature, in particular in the field of psychology, make us expect deviations between initial interest in the project and actual investment by crowd investors. As underlined by Trope and Liberman (2010), “[p]eople directly experience only the here and now. It is impossible to experience the past and the future […]. How do we plan for the distant future […]?” These authors propose a psychological theory, the Construal level theory (CLT), to explain the way people apprehend distal objects. People form abstract mental construals of these objects and formulate predictions. Trope and Liberman (2003, pp. 409–410) indicate that “desirability refers to the value of an action’s end state, whereas feasibility refers to the ease or difficulty of reaching the end state.” 7 Liberman and Trope (1998) indicate that desirability is given greater weight in distant future planning. The construal level theory can explain the hypothetical bias phenomenon as follows: when expressed as a hypothetical situation, the action of purchasing or investing appears distant, and people tend to think about it in terms of desirability. When facing the real situation of purchasing or investing, people represent purchasing at a lower, more concrete level of feasibility. In other terms, in a hypothetical context, desirability is of particular importance, but in a real situation, feasibility dominates. In the area of marketing, Alexander et al. (2008) study how consumers follow through on purchase intentions of technological products. They find that the intention to buy a product at a given time is not followed by a purchase in the future, which can be explained by the concepts of desirability and feasibility.
We extend this framework to the investors’ perspective. Our context is unique because the first evaluation takes place at a time when whether or not the investment opportunity will become real is unknown. Facing a hypothetical situation during the voting phase, investors’ evaluations of investment opportunities are more driven by what they desire than by what is feasible. Once the opportunity is real, the feasibility (e.g., availability of funds) becomes more important, making investors revise their first evaluation. This revision is typically downward, since feasibility places extra constraints on the possibility of making the investment (similar to entrepreneurs’ giving up their projects when they need to act; Tumasjan et al., 2013). These extra constraints, in turn, induce investors to partially or fully withdraw. While Trope and Liberman (2003) or Alexander et al. (2008) make no reference to any specific cognitive bias, a separate social sciences literature (Loomis, 2011; Murphy et al., 2005) refers to hypothetical bias when initial commitments are hypothetical (i.e., the investment opportunity may only occur with some probability less than 1) when other ones are not. More specifically, Murphy et al. (2005) define hypothetical bias as “the difference between stated and revealed values.” This bias reflects the discrepancy between projected investment and realized investment.
In their meta-analyses, List (2001) and Murphy et al. (2005) indicate that the overestimation factor resulting from hypothetical bias is roughly two or three (3 for List, 2001, and 2.6 for Murphy et al., 2005), but it can be substantially higher. This “hypothetical bias” has been shown to be very robust across different situations (cf. the meta-analyses of Murphy et al., 2005, and of List, 2001). A vast majority of the studies about hypothetical bias are mainly laboratory experiments. A few field experiments have been conducted. As mentioned by Murphy et al. (2005), papers on hypothetical bias generally use students and not entrepreneurs or investors. Moreover, this literature is largely empirical and lacks a theoretical basis (Loomis, 2011; Murphy et al., 2005).
Our context of equity crowdfunding is of great interest to study hypothetical bias, because it is likely to be pervasive in equity crowdfunding, where investment uncertainty is particularly high (Vismara, 2016). A high level of uncertainty is linked to significant hypothetical bias (Gneezy et al., 2006; Murphy et al., 2005). Our study allows us to study hypothetical bias in a natural experiment in entrepreneurial finance. Here, the question of feasibility arises on account of the fact that as the campaign starts, crowd investors may take a broader view of investing their capital and, thus, consider various tradeoffs not initially considered. In particular, once crowd investors need to decide where to invest their money, they may consider alternative investment possibilities that constitute opportunity costs. These latter costs are unlikely to have been considered in the same form as the hypothetical situation.
These results from the hypothetical bias literature (Gneezy et al., 2006; Murphy et al., 2005 ) imply that voters will provide the crowdfunding platform with overstated estimations of their individual demand for financial security by overstating how much they are prepared to invest. This implication leads us to expect that voters do overstate their intended investment during the voting period compared to what they will invest if the crowdfunding campaign takes place.
If a hypothetical bias is present, it is of interest to identify which factors best explain variations in this bias. Elliott et al. (2012) put forward that trust is a mean to diminish transaction costs and to enhance investment decisions. In particular, trust appears to be a major factor in the decision-making process of business angels (Harrison et al., 1997). Trust also exerts an important effect in venture capital decisions (Bottazzi et al., 2016). In the household finance area, Choi and Robertson (2020) show that trust is of high importance in equity investing. Skirnevskiy et al. (2017) underline that environments with high uncertainty—such as equity crowdfunding—involve trust as a key factor. Trust appears to reduce uncertainty, something which is an integral part of equity crowdfunding.
King-Casas et al. (2005) propose that trust is a mechanism that may ensure that people do what they say they will do. Hence, trust can generate cooperative behavior. The more people trust others, the more likely they will cooperate (Harrison et al., 1997). As a result, cooperative behavior consists of an individual revealing more sincerely his or her future investment and honoring commitments. Said differently, the more trustworthy people are, the more their investment decisions will conform to their promises. Let us now successively discuss the influence of trust along with three important characteristics: gender, education, and income level.
Brown and Taylor (2000), building on the research done by Gilligan (1982), find that women are less prone to hypothetical bias. Gilligan (1982) proposes that women and men have different approaches to thinking about moral problems. Specifically, women comprehend moral problems with greater care about relationships and focus less on rules and duties than men. Eagly and Wood (1991) present a meta-analysis about gender differences in social behavior and propose that men are expected to possess a high level of agentic attributes (independent, masterful…), whereas women are presumed to have a high level of communal attributes (being friendly, concerned with others, helping others…). Cadsby et al. (2007) indicate that women are more cooperative and empathetic than men are. Therefore, women are more likely to truthfully reveal their intentions, because they answer questions as though they were in the real situation (Brown & Taylor, 2000). Thus, they are more prone to reveal their true and expected investment in the real situation. In this same vein, Buchan et al. (2008) find that women are more trustworthy than men. When testing this prediction empirically, Brown and Taylor (2000) find that the hypothetical bias is indeed three times larger for men than for women. Therefore, we expect that
Guiso et al. (2004) point out that in low-level-of-trust areas, people rely more on transactions within subgroups, such as family and friends. In low-level-of-trust-areas, people think others are untruthful, because these other people do not follow the common social norms. For them, only the closest people are trustworthy. Conversely, if trust is high in an area, people have more trust towards others, and they adopt more cooperative behavior with whomever they have to transact with. This reasoning is consistent with a moderating effect of the environment on commitments. This extension of trust to geographical areas (Giudici et al., 2018; Guiso et al., 2004) implies trust should be viewed as the preconceptions people have about others with whom they themselves identify. In this case, one is not concerned about trust between two persons but how trust is viewed by society and whether individuals living in the same area can be trusted without knowing one another.
Alesina and La Ferrara (2002) show that trust is positively related to income and education at the individual level. Ananyev and Guriev (2019) find a positive relationship between trust and income at a regional level. Charron and Rothstein (2016) identify a positive link between education and trust at an aggregate geographical level. In the context of investment decisions, these links imply that investors living in more educated and wealthier areas are more trustworthy and less inclined to withdraw from investment commitments. Furthermore, in low-income-level neighborhoods, it is more difficult to honor investment commitments due to the prevalence of financial constraints among others in the community, rendering withdrawals more commonplace and socially acceptable relative to middle- or higher-income neighborhoods. To summarize, we expect a negative relationship between neighborhood income and education on the one hand and an overstatement of intended investment on the other.
Empirical Setting, Data, and Summary Statistics
The dataset comes from the French equity crowdfunding platform WiSEED. Launched in 2008, the platform has raised €72 million for 150 companies as of February 2017 thanks to over 70,000 members. The platform offers two different financial products—equity in startups and bonds in real estate projects—in different industries, making it the largest equity crowdfunding platform in France. Its market positioning is to offer the opportunity to invest in startups starting with as little as €100. Our analysis is restricted to equity in startups, since no e-vote takes place in real estate projects.
As on other platforms, individual investors do not hold shares in the startups directly. Rather, they are pooled in an investment vehicle, which then buys shares in the startup. 8 Following legal requirements, the investment vehicles are managed by the CEO of WiSEED. Campaigns are run under the keep-it-all funding model where funds raised are paid out to the startup, even if the funding goal is not achieved. However, a minimum threshold needs to be achieved (typically approximately €50,000). This minimum threshold is significantly lower than the funding goal.
The leitmotif for companies is that they should be young, innovative ventures with a dedicated team, a clear proof of concept, and a well-identified go-to-market strategy. 9 The platform applies a three-step procedure to select startups that can launch a campaign on WiSEED: (a) a selection committee composed of WiSEED team members does a first selection; (b) members then vote online and provide feedback to the platform (e-vote phase); finally, (c) a final due diligence is done by WiSEED analysts. The e-vote phase plays a crucial role in the third step of the selection process since startups are only considered in that last step (at least in theory) if they were able to attract, after 1 month, a minimum of 100 voters and €100,000 of investment intentions; of this amount, 25% must come from members who invested in a previous campaign (active investors).
The e-vote phase is open to any registered and connected member (regardless of whether this person has already invested in the past). When voting, each member is asked to (a) give a global grade (from 1 to 5 stars); (b) a grade (−1, 0, or 1) on 11 different items related to the startups and the entrepreneurial team (see Figure 1 and the Multivariate Analyses section for a more detailed discussion of these items); (c) state an intention of investment (i.e., how much money they would invest if a campaign were launched); and (d) ask questions to the founder(s) or post a comment. Individuals must be registered as a member and logged into the platform to cast votes and be able to read comments. During the e-vote phase, members do not have access to the aggregated voting results before they vote themselves. However, they can see how many people have already voted, although they never know the total amount of investment intentions collected. Figure 1 shows the webpage of the e-vote and the different items to fill in. Importantly for our analysis, only the global grade is mandatory. Moreover, the default answer for the investment intention is €100 and for individual grades is 0. Thus, in our database, we are not able to disentangle whether these values were chosen by default or for a particular purpose.

Screenshot from WiSEED.com: the e-vote interface. The first line, “Note” corresponds to the variable Nbr. Stars (1, 5 stars), as respondents grade the investment opportunity on a scale from 1 to 5 stars. The second line, “Combien seriez-vous prêt à investir ?” is where the respondents mention how much they would be willing to invest. [They] (Define) can further post a comment to the entrepreneur. The lower panel with the symbols for “like” and “dislike” presents the 11 dimensions used to construct the variable Total Grade (−11; +11) and is described in Supplemental Appendix Table 1.
All the comments are posted on the web page of the project without any content moderation from the platform (except in specific cases). Comments include questions to the founders, messages of encouragement, and simple remarks. The founders are allowed to provide answers to posted questions and thus provide further details on the project potential. Members can also answer questions or leave a comment on any other post.
The platform encourages its members to participate in the selection process before startups are available for subscriptions. From the perspective of the platform, the e-vote phase offers two important benefits. First, it allows a better assessment of investment intentions of existing members. Second, it reduces due diligence costs, since some outlying information could show up from Q&A between members and founders. Members, before voting, can access (a) the project page, designed as an executive summary, and (b) an “investor pitch,” which includes a short presentation of the strategy, the team, and the funds needed.
The full sample comprises all 71,915 members registered on the platform at the time of data extraction (September 30, 2016; first registrations were made in 2009 when the platform started operating). WiSEED requires individuals interested in viewing the investment documentation of any of its projects to formally register. Thus, we have information on members, regardless of whether or not they have invested or voted. Registration is complete when the individual has sent a scan of his/her ID card and proof of residence. Our database contains information on each member’s date of registration, country of residence, postal code (when residing in France), gender, date of birth, and his or her entire voting and investment history. We have information on the full population of members registered since the start of the platform.
Our database contains 52,901 votes cast by 23,827 different members (32.42% of registered members) in 397 different voted-upon projects/startups. The first vote was cast in September 2011. Of these 397 proposed startups, 64 were able to do a campaign. All the variables are defined in Supplemental Appendix Table 1.
Summary statistics of the final sample are provided in Table 1. Panel A shows statistics for the full set of 71,915 members registered on WiSEED since its start. Panel B provides statistics on voting outcomes, where each observation is a unique vote cast. Panel C shows statistics for individual investments made in startups for which an e-vote phase took place and that were finally allowed to launch a campaign on the platform. These observations constitute the main sample of analysis for testing our hypotheses. Finally, Panel D presents statistics on the 64 campaigns themselves, including their campaign outcomes (campaigns for which voting was not allowed are excluded).
Table 1Summary Statistics of Final Sample.
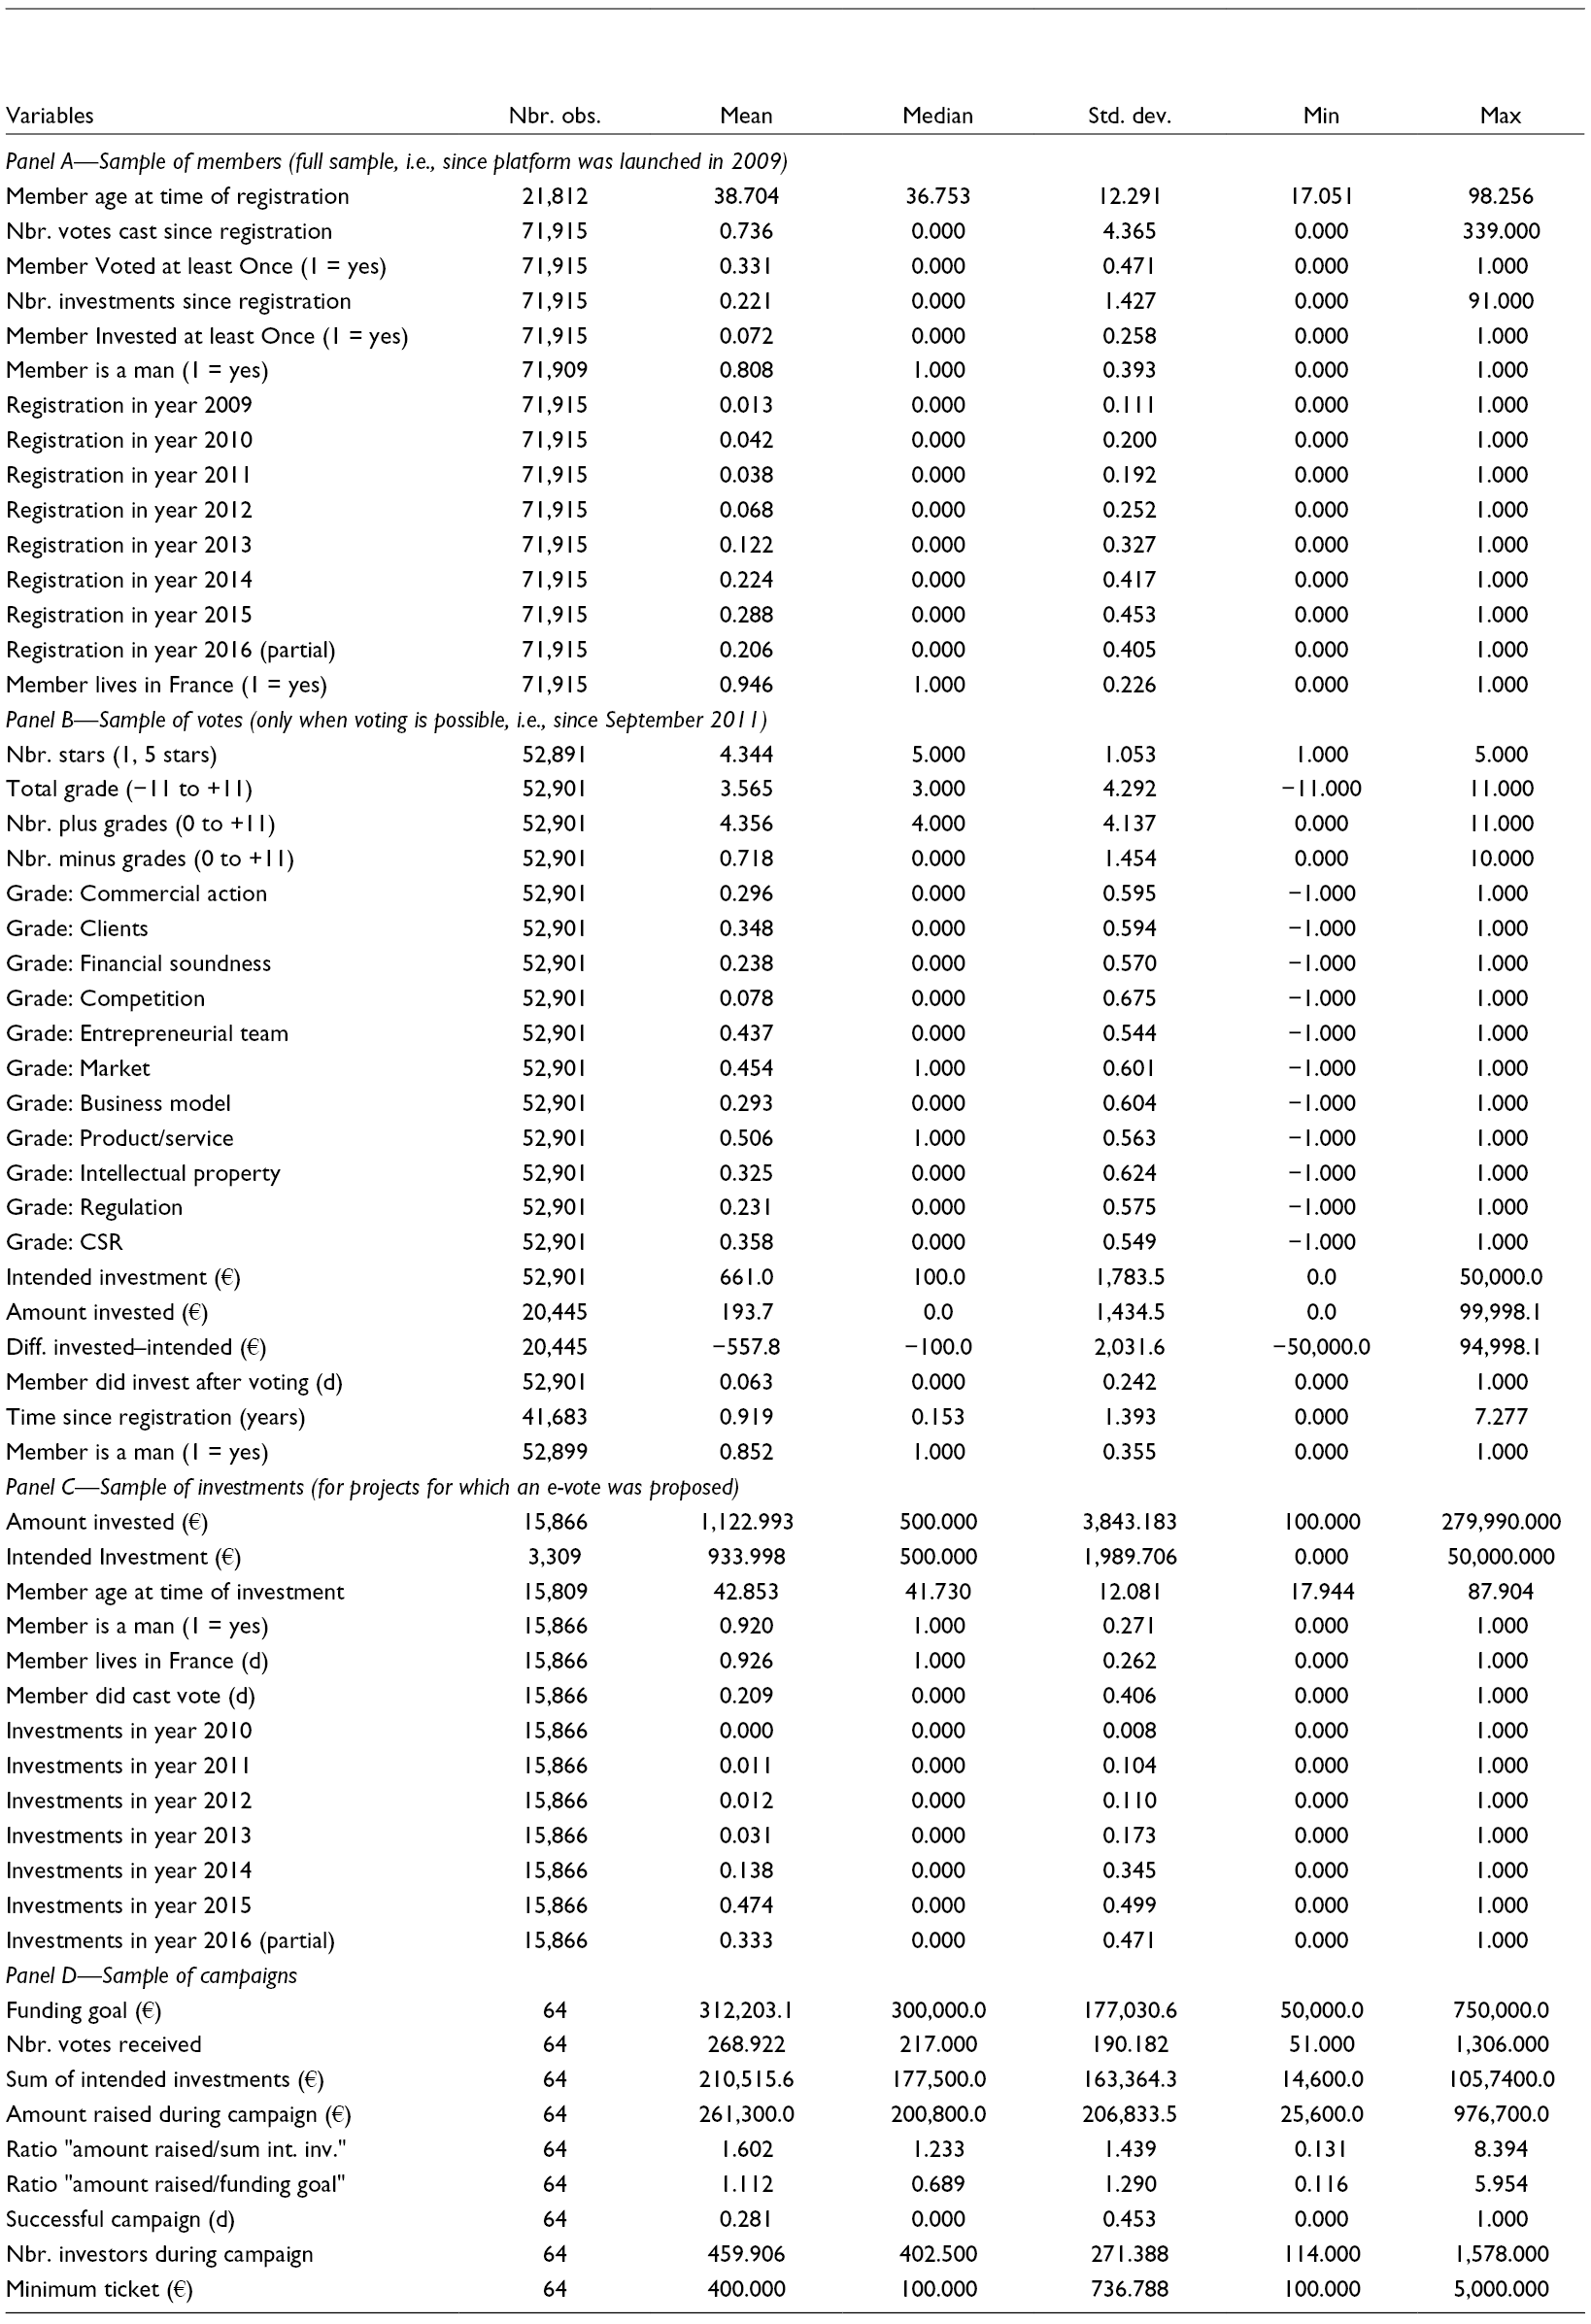
Panel A indicates that 33% of all the members have participated in at least one vote, and 7.2% of all the members have made at least one investment so far; in other words, the average member has cast 0.74 votes and made 0.22 investments. However, there is strong variation across members, with a few doing many investments and votes. One member voted on all 339 projects, and one member made 91 investments. Moreover, 81% of the registered members are men, and 95% live in France.
Panel B shows that the average Nbr. Stars (1, 5 stars) provided to projects being voted on (including those projects that eventually were rejected) is 4.34 on a scale of 1–5. Thus, voters tend to give very high grades when they vote, which may be due to self-selection, in which many members vote to support a specific startup, not necessarily any startup. Therefore, the decision to vote and on which project to vote may not be random. In terms of grades awarded to the 11 different items, the average vote contains 4.36 positive votes (Nbr. Plus Grades) and 0.72 negative votes (Nbr. Minus Grades), consistent with the variable Nbr. Stars. Of all voting members, 6.3% later made an investment. This value is notably low, because many startups could not launch a campaign. In other cases, a campaign was launched, but voters mentioned not being interested in investing. Finally, the dataset includes voters who mentioned being interested in investing but finally did not invest. The latter cases are of particular interest to us. Voters mentioned, on average, being willing to invest €661 but eventually only invested €194 when a campaign was launched. However, this average value also includes those who said they would not invest, which explains the low value compared to the average amount invested, shown in Panel C (see next paragraph).
Panel C provides statistics on investments made in startups that were voted on during the due diligence period and that could eventually launch a campaign. The average amount invested is €1123, which includes investments made by nonvoters. Interestingly, the value is not that different from the average Intended Investment of €934. In other words, while Panel B shows a strong difference between intended and actual investments on average, the difference becomes much smaller when restricted to the subsample of those who actually make an investment. This tendency suggests that when members do invest, they invest close to what they promised. However, many declare being interested but, at the end, withdraw. Interestingly, only 21% of investors did participate in the vote, indicating that many members prefer only to become active if the campaign is, in fact, launched. One possible explanation is that they only want to incur effort costs of reading the investment documentation if they are certain that the startup successfully launches its campaign. Finally, 92% of investors are men, which is more than the percentage of male members. Thus, men are more likely to invest than women.
Finally, Panel D shows statistics on the subsample of startups that launched a campaign. The average startup did seek a funding goal of €312,203 and achieved €261,300 from 450 investors, while it collected, on average, €210,516 of intentions during the e-vote phase. On average, startups raise a multiple of 1.60 of collected investment intentions. As mentioned below, most of this money, however, comes from nonvoters, since voters only invest a small amount of money compared to what they declared during the e-vote. In terms of campaign outcome, the platform shows a success rate of 28%, that is, only 28% of the startups successfully raise an amount that at least equals the funding goal. As mentioned before, WiSEED applies a keep-it-all funding model; therefore, more startups may have taken the funds collected than 28% of the startups.
Table 2 presents correlations between the variables used in the multivariate analyses. Most correlations are reasonably low, suggesting that multicollinearity should not be an issue in our multivariate analyses. Nonetheless, we rely on variance inflation factors to ensure multicollinearity does not drive our results. One interesting correlation to note is the one between Amount Invested and Intended Investment. In the absence of any hypothetical bias, this correlation should be close to 1. The fact that it is 0.2196 already suggests that bias exists. More evidence on the presence of hypothetical bias is provided in the Multivariate Analyses section.
Correlation Matrix of Main Variables.
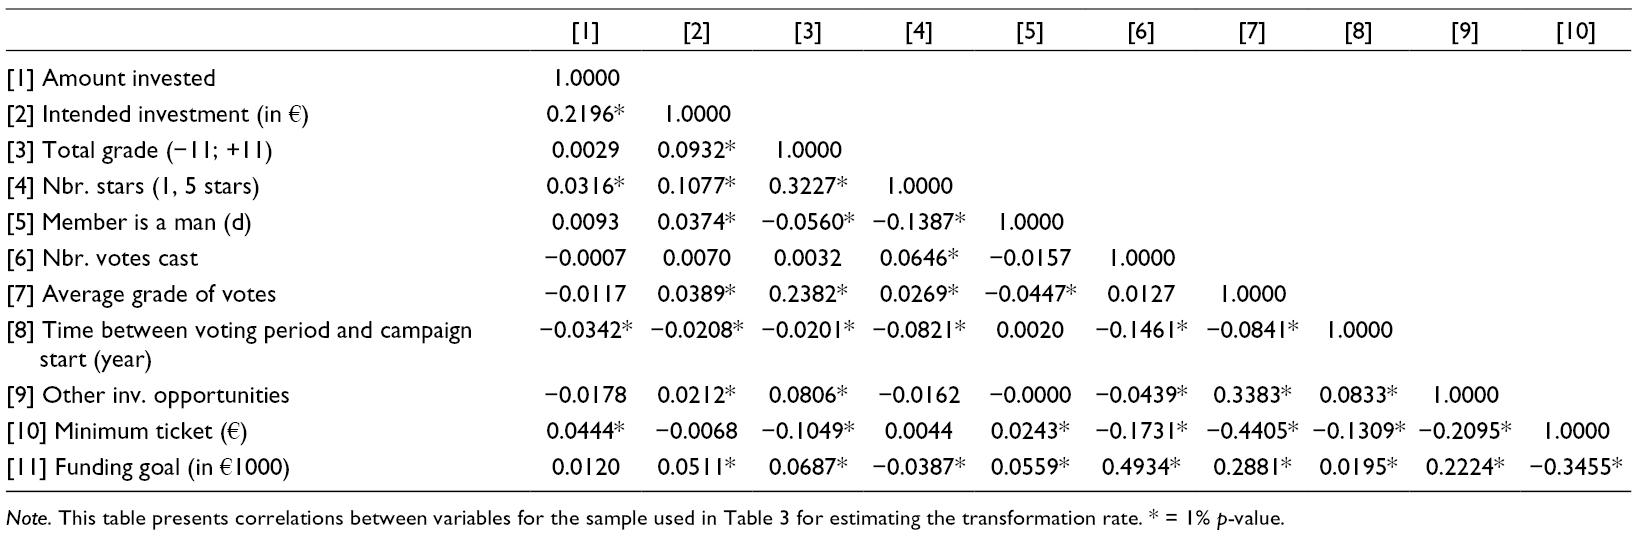
Note. This table presents correlations between variables for the sample used in Table 3 for estimating the transformation rate. * = 1% p-value.
Multivariate Analyses
We now turn to testing our hypotheses to shed light on who is more likely to invest the amount they said they would invest. To do so, we introduce the concept of a transformation rate, which we define as the average amount invested per € a member said he/she intends to invest during the e-vote phase. For instance, a transformation rate of 0.5 means investors, on average, invests 50¢ for every euro they said during the voting period they would invest if a campaign were to take place. 10 We recall that declared investment intentions during the e-vote phase on WiSEED are nonbinding; thus, members can withdraw. This decision to withdraw generates a transformation rate below unity. Moreover, the transformation rate is above, if a member invests more than announced during the e-vote. Thus, the measure is bounded below at 0 but not bounded above.
Table 3 provides average transformation rates in univariate and multivariate OLS regressions. The dependent variable is the amount invested (in €) during the campaign. We avoid log-transformation so that our main coefficient can be directly interpreted as a transformation rate, as defined above. The rate is given by the coefficient of the explanatory variable Intended Investment (€). We control for numerous project characteristics, investor characteristics, other voting decisions, and alternative hypotheses. We further add fixed effects to capture unobservable factors. We also include dummy variables for intended investments equal to €0 and €100, since the transformation rate is undefined for €0, and the amount €100 is often reported, because it is the default answer (see our description of the voting process in the Empirical Setting, Data, and Summary Statistics section). Table 4 then shows similar specifications but is based on probit regressions, in which the dependent variable is a dummy variable equal to, if the voter makes an investment. Finally, Table 5 examines whether aggregate voting outcomes help predict campaign success.
Determinants of the Transformation Rate.
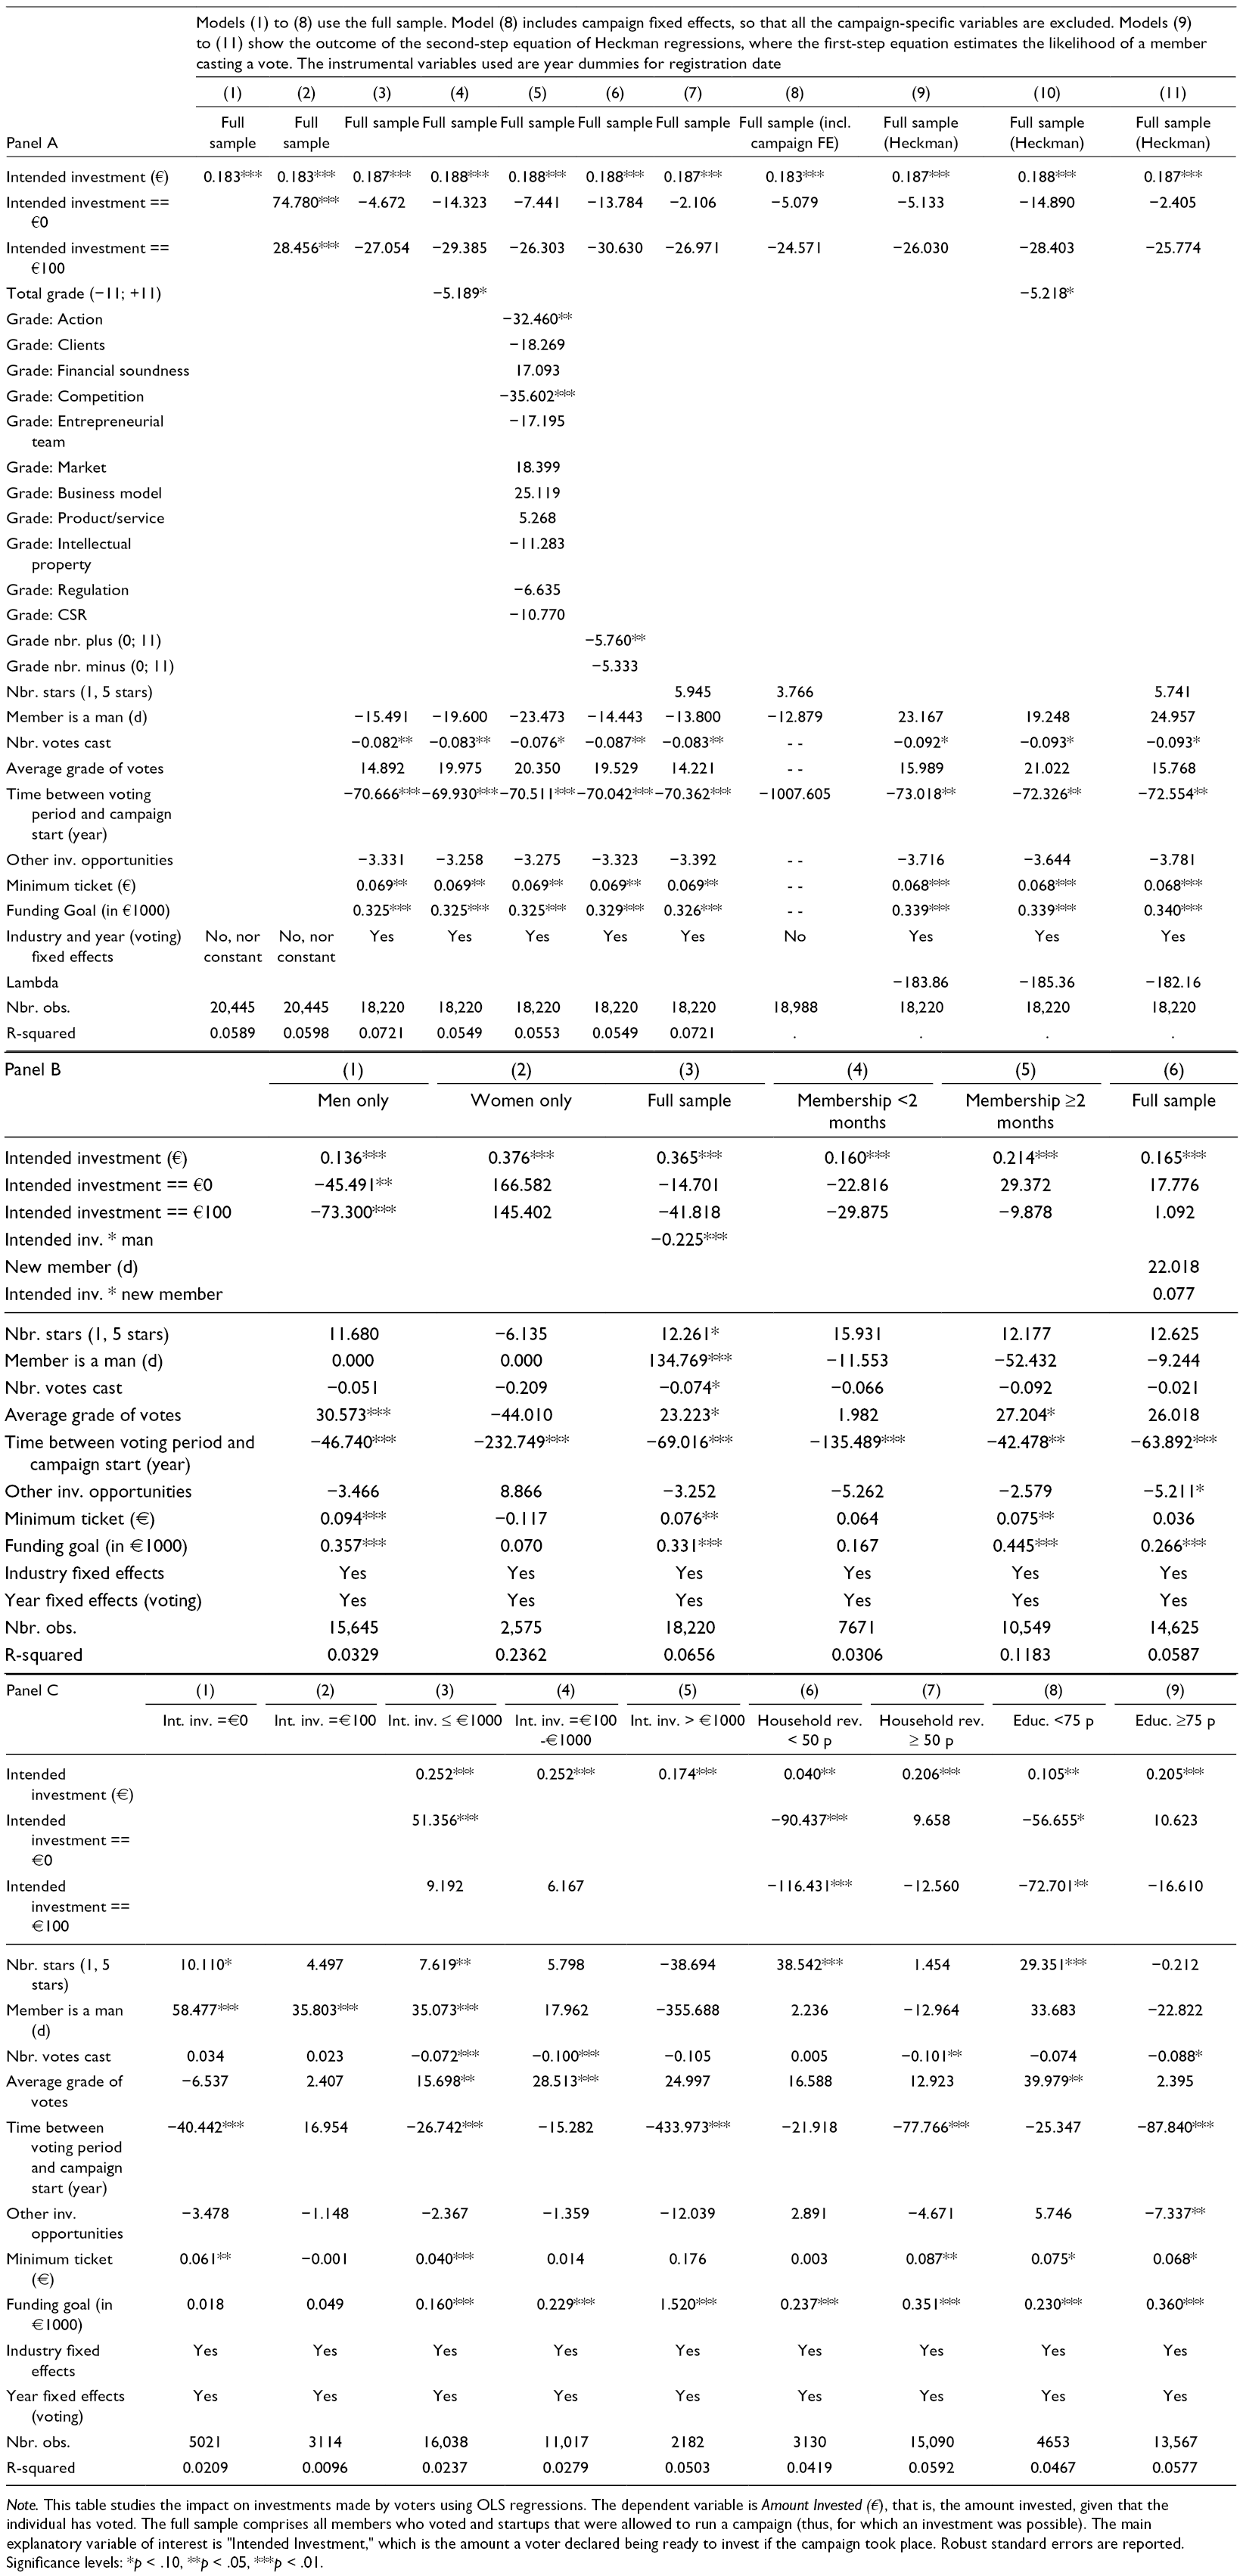
Note. This table studies the impact on investments made by voters using OLS regressions. The dependent variable is Amount Invested (€), that is, the amount invested, given that the individual has voted. The full sample comprises all members who voted and startups that were allowed to run a campaign (thus, for which an investment was possible). The main explanatory variable of interest is “Intended Investment,” which is the amount a voter declared being ready to invest if the campaign took place. Robust standard errors are reported. Significance levels: *p < .10, **p < .05, ***p < .01.
Determinants of the Decision to Invest by Voters.
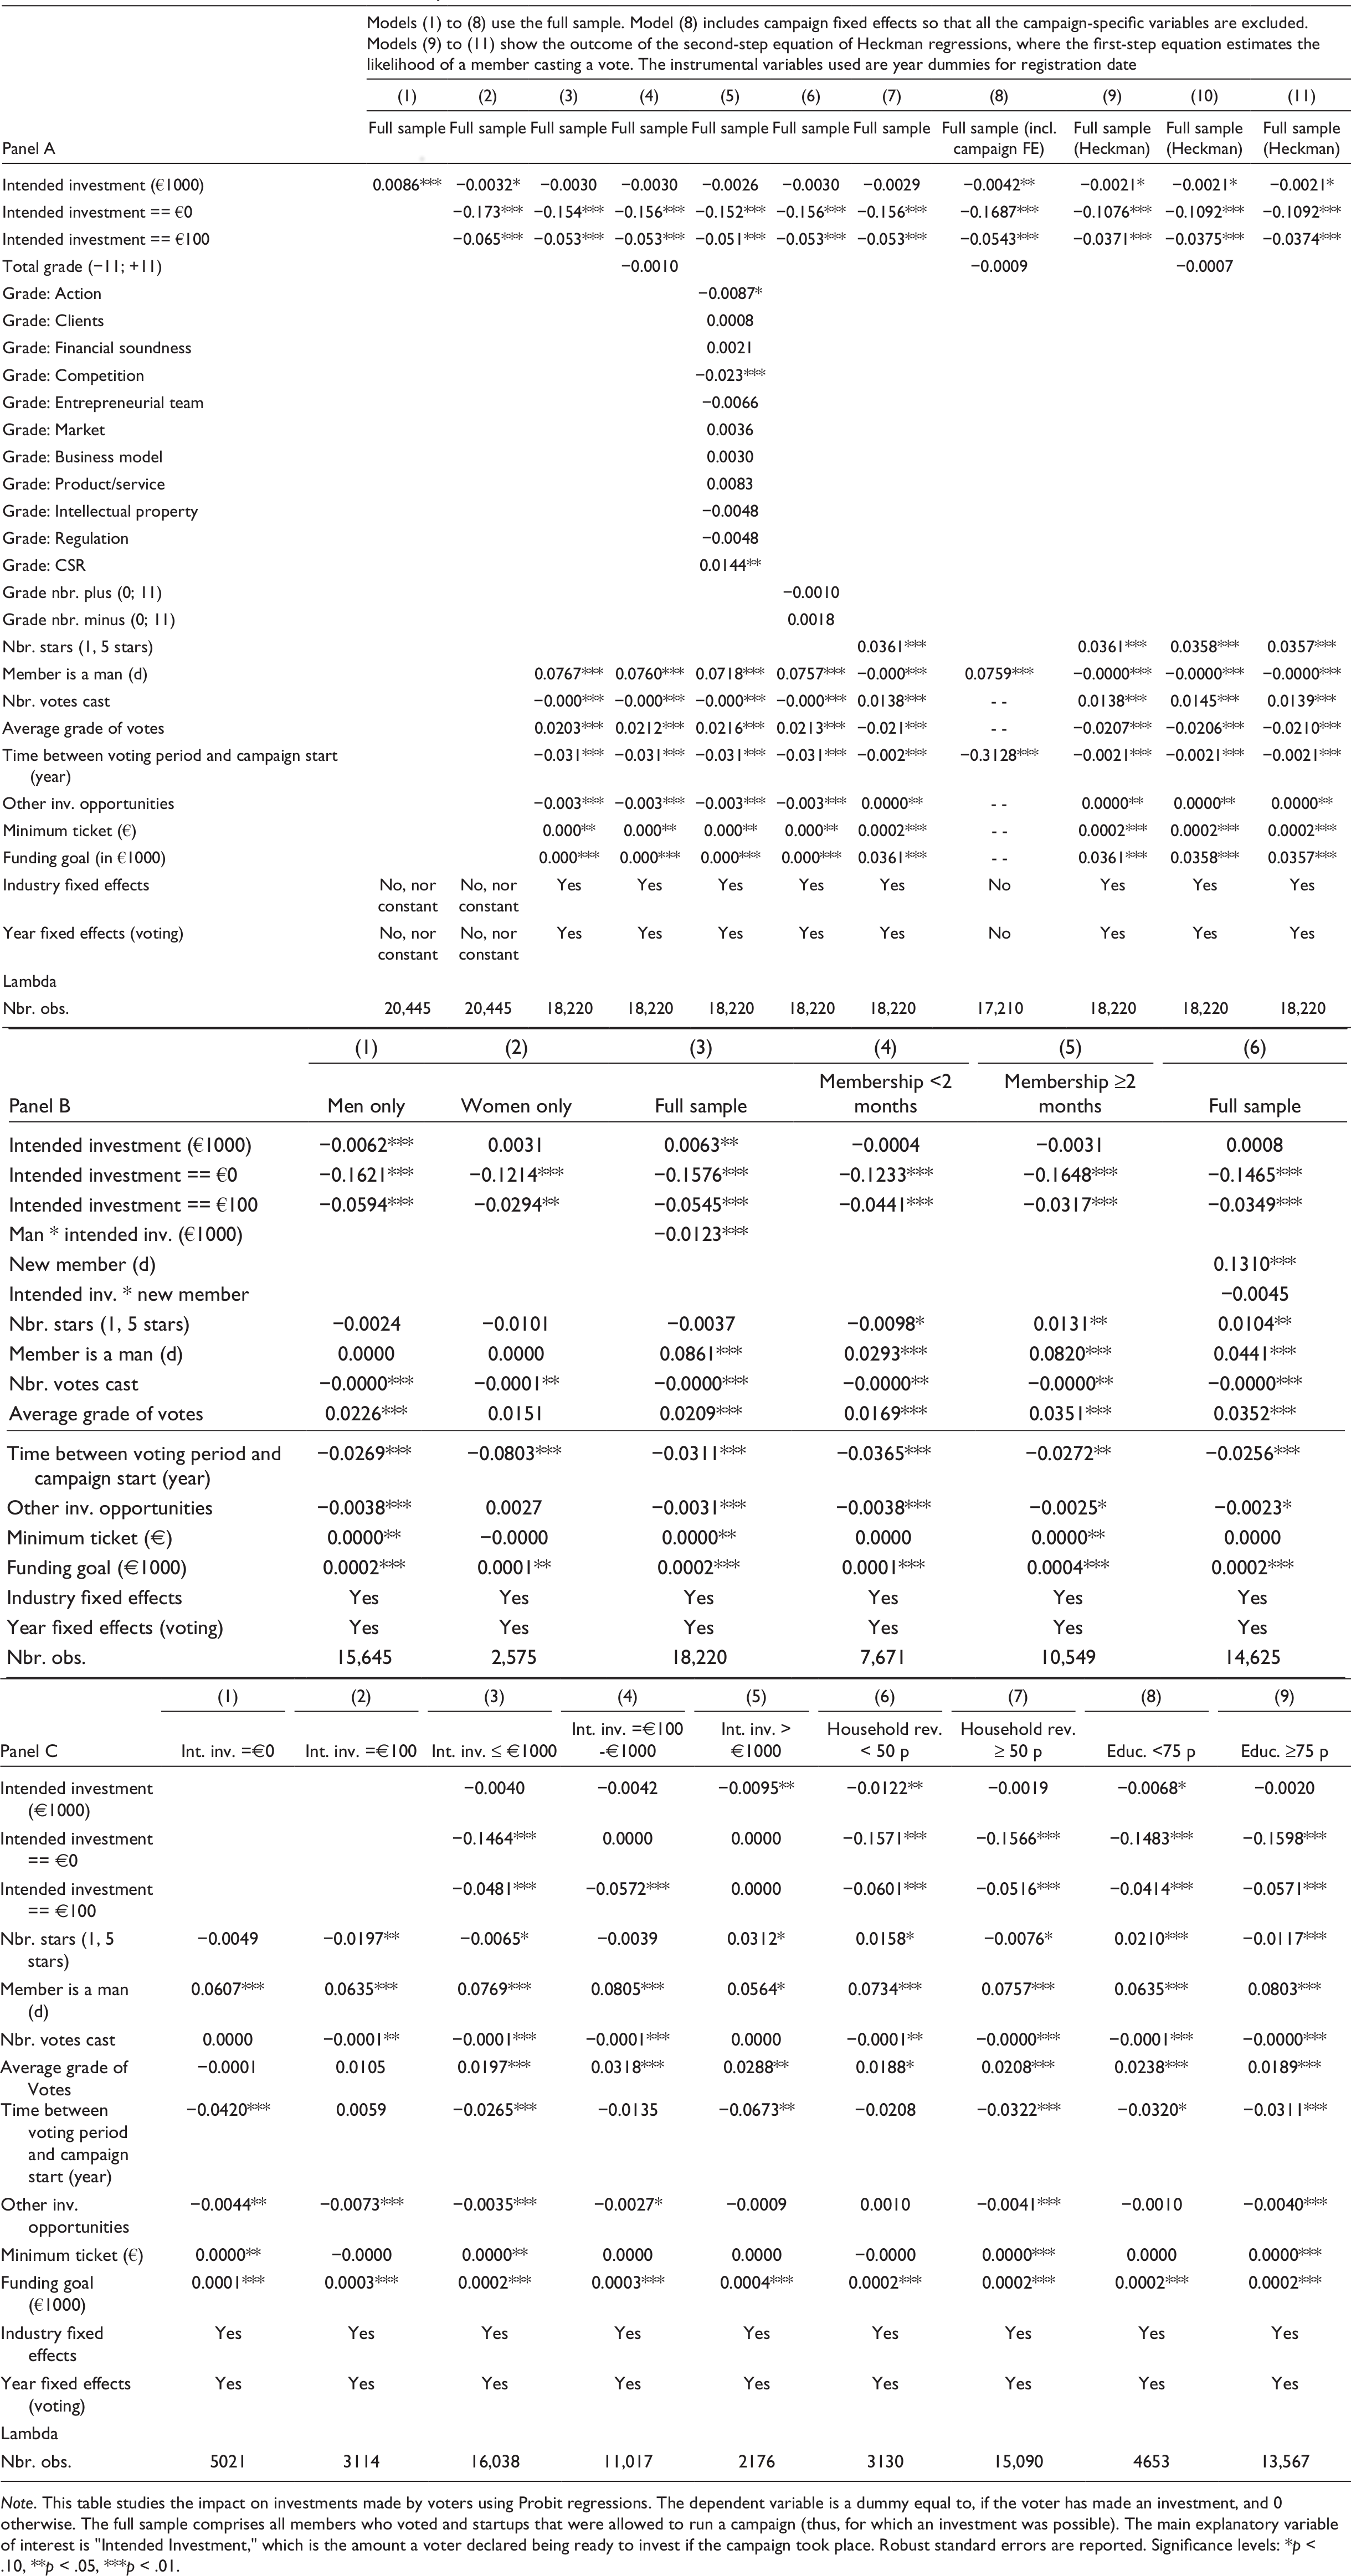
Note. This table studies the impact on investments made by voters using Probit regressions. The dependent variable is a dummy equal to, if the voter has made an investment, and 0 otherwise. The full sample comprises all members who voted and startups that were allowed to run a campaign (thus, for which an investment was possible). The main explanatory variable of interest is “Intended Investment,” which is the amount a voter declared being ready to invest if the campaign took place. Robust standard errors are reported. Significance levels: *p < .10, **p < .05, ***p < .01.
Determinants of Campaign Success.
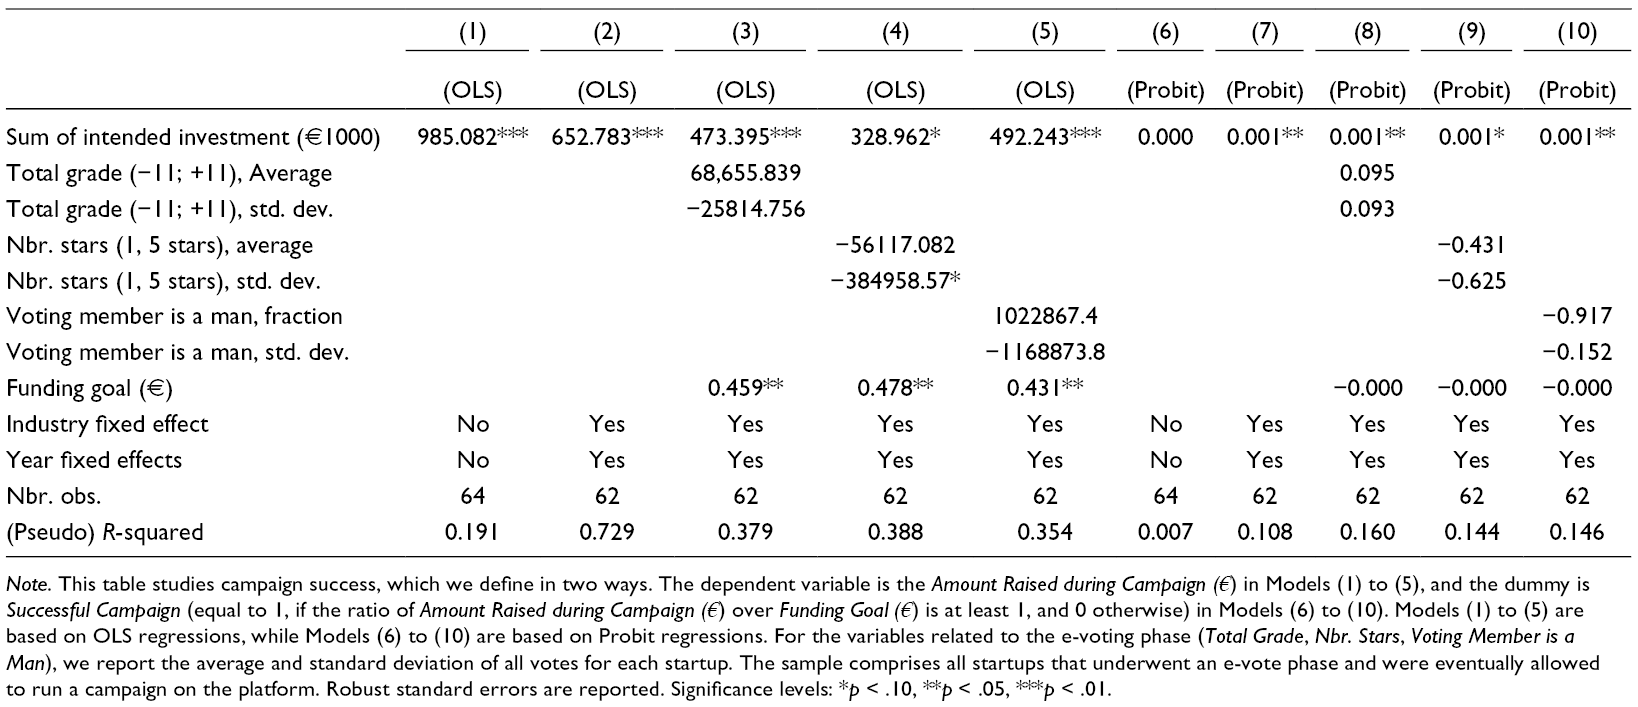
Note. This table studies campaign success, which we define in two ways. The dependent variable is the Amount Raised during Campaign (€) in Models (1) to (5), and the dummy is Successful Campaign (equal to 1, if the ratio of Amount Raised during Campaign (€) over Funding Goal (€) is at least 1, and 0 otherwise) in Models (6) to (10). Models (1) to (5) are based on OLS regressions, while Models (6) to (10) are based on Probit regressions. For the variables related to the e-voting phase (Total Grade, Nbr. Stars, Voting Member is a Man), we report the average and standard deviation of all votes for each startup. The sample comprises all startups that underwent an e-vote phase and were eventually allowed to run a campaign on the platform. Robust standard errors are reported. Significance levels: *p < .10, **p < .05, ***p < .01.
Determinants of Transformation Rate
To establish whether voters do what they say they will do, we examine the impact of each voter’s intention on his or her actual investments when a campaign takes place. We expect a transformation rate equal to unity for voters not subject to any hypothetical bias. Results are provided in Table 3 for different specifications and subsamples.
First, the results in Panel A show that, among those who voted, only 18–19¢ is actually invested for every euro committed during the e-vote phase, consistent with Hypothesis 1. This value is remarkably stable across specifications and often across subsamples, with few exceptions (see Panels B and C). Second, grades do not have a strong effect on investments, since the variables Total Grade (−11; +11), Grade Nbr. Plus, Grade Nbr. Minus, and Nbr. Stars (1, 5 stars) are generally not significant. Model (5) includes all eleven items separately and shows that most items have no impact on investment. The two that are statistically significant (Grade: Action and Grade: Competition) are negative. Third, the number of votes cast and the average grade of voters, two pieces of information from the e-vote phase that are available to investors during the crowdfunding campaign, have no material impact on the individual investments of voters. The variable Nbr. Votes Cast is at times statistically significant at the 5% level (and negative) but economically insignificant. Thus, the investment decision of voters is unaffected by the judgment of other voters. Finally, delaying the campaign start reduces investments, as shown by the negative coefficient of the variable Time Between Voting Period and Campaign Start. The variable being in years means that a time delay between the voting period and a campaign start of 3 months reduces individual investments by approximately €17. This amount is quite large, since, on average, there are over 400 investors. This result suggests that members may decide to withdraw or reduce their investment, due to alternative opportunities offered between voting and the campaign start and is, thus, an important alternative hypothesis for which we need to control. However, we find no real support for this hypothesis, since the number of other investment opportunities (Other Inv. Opportunities) at the time of the campaign start has no impact on investment.
One possibility is that results may be driven by self-selection. As indicated in the summary statistics, members do not vote randomly. Thus, we run Heckman two step regressions, where the first regression predicts whether a platform member will vote. As the instrument, we use year dummies for the registration date, which is different from the date of voting and investment for most members, since members often register well before. Alternatively, voting and investment could occur in the same years the first time they vote but differ in follow-up years when they may vote again on other projects. We posit that the registration date predicts voting participation, since voting was only introduced later. Early members registered to invest only, while members who registered after 2011 could invest but also vote. Thus, later members are more likely to vote. Results of the Heckman two step regressions are shown in Models (9) to (11). They indicate that the level of transformation rate remains stable when controlling for the self-selection of voters.
Further insights are provided in Panels B and C. In Panel B, we observe that the transformation rate is higher for women than for men (Models (1) to (3)). The difference is statistically significant, as shown in Model (3). On average, men have a transformation rate of 22.5¢ lower than women, consistent with Hypothesis 2. This result supports our prediction that hypothetical bias is stronger for men than women. The last three columns (Models (4) to (6)) show results for differences between new members (i.e., those who joined within the last 2 months only) and the others. We may expect that many of the recently joined members are friends, family members, and fans and, thus, became registered members for the sole purpose of specifically investing in a specific campaign. Since they may know the entrepreneurial team personally, one may expect less withdrawal. Results indeed show that the transformation rate is lower for new members compared to “senior” members when they vote. However, the difference is not statistically significant, as evidenced in Model (6).
Panel C examines the impact of different ranges of investment intentions and two dimensions where we expect differences among investors, following Hypothesis 3. For different levels of investment intentions, Models (1) to (5) indicate that, while there are differences in coefficient values (ranging from 17.4¢ to 25.2¢), these differences in transformation rates tend to be small. Thus, our main result on low transformation rates is not driven by a specific size of commitment; rather, withdrawals and reductions in investments happen for all levels of intentions.
Finally, we examine the impact of household revenues and education, measured as the average household revenues and the average level of education at the zip code level where the investor lives (Models (6) to (9)). The exact definition and source is provided in Supplemental Appendix Table 1. These measures are positively linked to trust in the neighborhood of the investor. In both cases, we split the full sample into two subsamples using the median value as the cutoff level. We find that investors living in lower income neighborhoods (and thus less likely to be wealthy themselves) tend to withdraw significantly more than others do, as their transformation rate is 4.0¢ (Model (6)). In contrast, the transformation rate is highest for investors living in higher income neighborhoods (Model (7)). In Models (8) to (9), we perform a similar analysis but with educational levels. Again, the measures are at the zip code level and thus capture the educational level of the neighborhood in which investors live. We obtain that transformation rates are lowest for investors living in the least educated areas. Both results are consistent with the spirit of Hypothesis 3, that trust reduces the willingness of individuals to withdraw. To show the robustness of these results, we provide results in Supplemental Appendix Table 2, with measures of trust based on voting participation and a measure of trust following the Rosenberg Trust Scale at the department (i.e., regional, not zip code) level (Arvanitidis et al., 2016; Glaeser et al., 2000; Guiso et al., 2004).
Before concluding this subsection, note that the R-squared values are quite low. This is also an implication of the strong hypothetical bias of crowd investors. In the complete absence of the bias (i.e., a perfect transformation rate of 1), we would have Invested Investment being equal to Amount Invested and thus an R-squared of 100%. The much lower R-squared values point to a weak transformation rate and a great variation around the average (estimated) transformation rate of 0.183.
Determinants of the Decision to Invest for Voters
In Table 4, we examine the decision to invest given that a member has voted. Thus, the sample here is again restricted to those members who voted. Instead of estimating transformation rates, we assess here their likelihood to invest, with the expectation that voters who have announced greater investment intentions are more likely to invest if the campaign takes place. We run the analyses on the same specifications as in Table 3.
The main result (Panel A) is that the amount of intended investment (the variable Intended Investment (in €1000)) has no meaningful influence on the likelihood to make an investment. While the variable is occasionally statistically significant (and often negative rather than positive), the economic significance is too small to be meaningful, which implies that withdrawals of investment commitment occur across all ranges of investment intentions, not only for small amounts, consistent with Hypothesis 1. This finding confirms the conclusions drawn earlier (Table 3), despite the inclusion of numerous control variables. However, voters who report intended investments of €0 (i.e., they mentioned they would not invest) or €100 (the default) are significantly less likely to invest when compared to voters who do invest a larger amount (i.e., more than €100). Consistent with the results in Table 3, individual grades have no impact on the decision to invest later in case a campaign is launched.
Panel B shows that men have a lower propensity to invest than women, consistent with earlier findings (Table 3) and Hypothesis 2. In contrast, new members are, however, more likely to make an investment. The difference is statistically and economically significant, with a 13% higher probability of making an investment. This difference could be attributable to the fact that many new members are friends and family members of the entrepreneur who recently joined the platform to support him/her. In contrast, old members may more often participate in votes to provide feedback to the entrepreneur without necessarily investing. However, when they do invest, both new and old members suffer from the same level of hypothetical bias. Panel C again examines differences in household income and education to capture the impact of trust. While there are small differences, these differences are also not materially large. Similar conclusions are achieved with our alternative measures of trust (see Supplemental Appendix Table 2).
Determinants of Campaign Success
An important question is whether the information collected by the platform during the voting phase is useful. The results so far tend to suggest limited value of the information collected, given the low transformation ratio and high withdrawal rate of voters. Indeed, at the individual level, we have found that voters tend to invest only a small percentage of what they mentioned investing during the voting phase. Here, we examine whether, at the aggregate level, the information collected has predictive power for the platform, given that the latter uses the information for due diligence purposes. Our analysis is, however, restricted to those startups that eventually carried out a campaign; we are not able to draw any inference on the overall informational value, since nothing is known about the remaining startups who could not launch a campaign. In total, only 64 startups were allowed to run a campaign on the platform.
Results are provided in Table 5. The dependent variable is the Amount Raised during Campaign (€) in Models (1) to (5), and the dummy variable is Successful Campaign (i.e., indicating whether the ratio of Amount Raised during Campaign (€) over Funding Goal (€) is at least equal to 1, and 0 otherwise) in Models (6) to (10). Both are measures of campaign success, consistent with prior studies on the topic (Ahlers et al., 2015; Kuppuswamy & Bayus, 2017). In terms of grades, we take the average grade over all the votes cast on each startup. We further take the standard deviation of grades to assess the impact of the dispersion of grades, which could indicate lack of disagreement among voters.
We find that average grades and dispersion of grades are not associated with campaign outcome. This negative finding holds for both measures of success (Models (1) to (10)). The only meaningful information is the aggregate amount of investment intentions collected during the voting phase (Intended Investment (€1000), total). The impact of the first measure is also economically important, since an increase in €1000 of intended investments is associated with an extra €328–652, depending on the specification considered (excluding Model (1), which includes no control variables). Since voters do not invest what they said they would, while nonvoters can also invest, the impact is not one-to-one. Given the low transformation ratio reported earlier at the individual level (Table 3), this point further means that a substantial part of the money raised comes from nonvoters. For the second measure of success (Models (6) to (10)), the impact is occasionally significant at the 5% level, consistent with findings for the first measure.
Lying and the Information Channel as Alternative Hypotheses
Thus far, we explained deviations between the intent and actual actions as the result of a hypothetical bias. A potential alternative hypothesis is that individuals deliberately lie, which would mean they already know when they vote that they will not invest what they report they will during the vote. Many of the results reported in this section are consistent with this alternative explanation. In this subsection, however, we develop arguments and empirical evidence inconsistent with this alternative hypothesis. Similarly, another closely related alternative hypothesis is based on an information channel. Since individuals expect more information disclosed by the entrepreneur if a campaign takes place, they may want to deliberately announce inflated intentions to obtain this additional information before deciding whether to invest. Here again, individuals may then report amounts they do not intend to invest, later leading to withdrawals.
Two strands of literature offer different views on why individuals may be lying (or being dishonest). The economic approach argues that individuals will tell the truth if the gains from being honest are greater than the possible costs of lying. These costs increase with the probability of being detected as a liar and with the severity of punishment (Rosenbaum et al., 2014). The other approach finds its roots in social psychology and is based on norms and ethical behavior (Abeler et al., 2014; Somanathan & Rubin, 2004). Individuals internalize social norms that are shared in society. Any deviation from these social norms is perceived as a cost, which may affect reputation and, thus, the credibility of individuals in the long term. Compliance with the norm is thus perceived as a benefit (Mazar et al., 2008).
Considering this empirical setting, there are two main reasons why lying is unlikely to explain our results. First, to make it a plausible alternative hypothesis, one needs to find a good reason for why crowd investors would want to lie. What are the gains that would induce them to lie? At best, there are potential costs of lying, since the platform may no longer consider one’s commitment in future votes, and (collectively) lying induces noise in the due diligence process. One possible gain we can think of is to help the entrepreneur, which may indeed happen if the crowd investor is a friend or a relative of the entrepreneur. The alternative reason is the information channel, that is, to obtain more information before making a final judgment about the investment opportunity. Turning to our data, we, however, find that less than 1 % of the investment intentions are greater than €10,000, which seems to be a necessary amount to report to make a difference in helping the entrepreneur. Indeed, reporting an intention of, say, €100, or even €500, will not make any difference in the voting outcome.
The second reason that lying or the information channel is unlikely to be an important explanation is that we would otherwise expect a much lower transformation rate for large investment intentions. Indeed, as just mentioned, only large amounts would have a meaningful impact on the voting outcome. A person who wants to help the entrepreneur would need to report a very large investment intention, which then is unlikely to materialize during the campaign, leading to a particularly low transformation rate compared to smaller amounts. To check this possibility, we run the analyses done in Panel A of Table 3 again but for the subsample of investment intentions greater than €10,000. We obtain a transformation rate of 0.55 to 0.60, which is inconsistent with the lying view or the information channel. Rather, the rate suggests that individuals reporting very large intentions are less likely to withdraw, presumably because these individuals are wealthy investors such as business angels. Thus, we conclude that hypothetical bias is a more plausible explanation for our findings.
Discussion, Policy Implications, and Concluding Remarks
This study provides findings that are consistent with the view that crowd investors are subject to a hypothetical bias when participating in precampaign votes of equity crowdfunding platforms. This result gives reason for concern about the reliability of the information collected during the e-voting phase. On average, an investor only invests approximately 18% of his/her (nonbinding) commitment. The study further documents that withdrawals take place across differences in the level of intentions, gender, and trust (measured as wealth and education in the neighborhood). In particular, we document greater withdrawals among men and among investors living in poorer and less educated neighborhoods. However, despite this significant deviation in individual behavior, the aggregate level of commitment is a good predictor of campaign success.
To the best of our knowledge, this study is the first on hypothetical bias in the entrepreneurial finance context and on assessing the TTW rule. Initially, we conjectured that the anecdotal evidence of discrepancies between intended and realized funding under the TTW rule was rooted in individual behavior. Our results show that the well-known hypothetical bias effectively prevails at the individual level. Logically, the bias should be observed at the aggregate level. However, it is not in this case; in our setting, voters are generally not the investors, and intended and realized investment is quite close. This puzzling evidence deserves further attention and investigation. Why do people provide a good estimation of the future collective behavior of investors?
Moreover, this study is the first on precampaign steps in equity crowdfunding. E-voting enables extending participation of the crowd in crowdfunding, as the platform externalizes due diligence and collects information on investment preferences. Our study offers many avenues for future research. One is whether the introduction of a voting stage promotes investments. In other words, by increasing the possibilities of crowd investors to become actively involved in the selection process, does the platform also induce its members to return more often to the platform’s website and eventually make investments? Alternatively, do we observe members specializing in one activity only, with some only participating in votes and others investing? Additionally, when do platform members “switch” from being a voter to becoming an investor? Finally, an important question seems to be about the ultimate impact of so many withdrawals on the overall informativeness of the precampaign voting stage for the due diligence process.
From a theoretical point of view, this article brings some first elements to understand the origin of the hypothetical bias in an investment context. The construal level theory proposed by Trope and Liberman (2010) appears a promising and relevant avenue to better understand why investors do not always honor their investment promises. In particular, the notions of feasibility and desirability seem to play a role in explaining hypothetical bias. An interesting line of future research would be to determine the extent to which desirability and feasibility are influenced by the characteristics of projects and entrepreneurs. The results of (Alexander et al., 2008) suggest that the firm’s innovation dimension may be one of these important factors.
Moreover, studies on early stage finance (angel investors and venture capital investors) generally focus on the decision-making process (Drover et al., 2017; Harrison et al., 1997; Warnick et al., 2018), that is, on the stated intention to invest in a given venture. Other studies have focused on actual investments or opportunity exploitation by entrepreneurs, without being able to link them to initial intentions. Comparing both dimensions is more difficult, since one generally only observes one of the two, making it difficult to study hypothetical bias or evaluation differences in entrepreneurship. Comparing these two situations is, however, important. Many entrepreneurial and investor evaluation situations are hypothetical, and only some may become real situations in the near future.
In contrast, we study both the stated intention and its realization. Our results show that, at an individual level, hypothetical intentions are not the same as real investment decisions investors make in real situations. This questions the usefulness of experimentally studying the decision of business angels and venture capital investors, because the results obtained through lab experiments are probably led by the level of desirability associated with a given project and may not reflect the real potential obtained by funding a firm.
Our findings have a number of policy implications. First, with respect to “testing the waters,” there is substantial value to entrepreneurs to ascertain whether there is aggregate investor interest in their project before expending time and resources developing an investment campaign. Being allowed to test the waters would enable entrepreneurs not to go ahead when they see that investors are not interested. As well, entrepreneurs need to be aware that investors are subject to hypothetical bias.
This policy implication is particularly relevant and timely in the US context, where the United States adopted the Jumpstart Our Business Startups (“JOBS”) Act on April 5, 2012 but did not allow the use of “testing-the-waters” (TTW) in an equity crowdfunding context. This policy debate has been going on without the guidance of empirical evidence. This article fills a gap in the literature with a view toward guiding research and policy on the economic value of TTW in equity crowdfunding. The evidence herein considers the potential discrepancies associated with the TTW rule, building on a microanalysis from the point of view of the individual investors. The evidence herein shows that TTW is value-informative to the extent that it shows a small but positive transformation from committed investment to actual investment and how gender and trust affect the transformation rate. We do not see evidence consistent with widespread manipulation or lying with TTW. Further, we showed that the aggregate commitment level is value-informative insofar as it predicts funding success.
From a regulatory point of view, TTW improves market efficiency by enabling entrepreneurs to make better informed decisions about whether or not to move forward. Said differently, there will be fewer lower quality projects that distract investor attention and waste entrepreneurial resources when entrepreneurs are allowed to test the waters. We are unable to assess the potential costs of TTW in terms of bringing about more fraud or misleading investors. Further research with different types of data may enable that type of assessment. Here, a full cost-benefit analysis is not possible.
From a practice point of view, the theory and evidence here indicate that while aggregate TTW information is valuable, specific individual responses have less value in general terms of predicting success. But the data do provide guidance for entrepreneurs with respect to which investors are more likely to do what they say they will do—namely, those who are female and those living in neighborhoods with higher levels of trust. Moreover, the evidence here enables guidance to intermediaries, such as crowdfunding platforms and other types of intermediaries as well, about which projects are more likely to succeed based on which types of investors provided information in a TTW context.
Supplemental Material
Supplementary Material 1 - Supplemental material for Testing-the-Waters Policy With Hypothetical Investment: Evidence From Equity Crowdfunding
Supplemental material, Supplementary Material 1, for Testing-the-Waters Policy With Hypothetical Investment: Evidence From Equity Crowdfunding by Douglas Cumming, Fabrice Hervé, Elodie Manthé and Armin Schwienbacher in Entrepreneurship Theory and Practice
Footnotes
Declaration of Conflicting Interests
The author(s) declared no potential conflicts of interest with respect to the research, authorship, and/or publication of this article.
Funding
The author(s) received no financial support for the research, authorship, and/or publication of this article.
Notes
Author Biographies
References
Supplementary Material
Please find the following supplemental material available below.
For Open Access articles published under a Creative Commons License, all supplemental material carries the same license as the article it is associated with.
For non-Open Access articles published, all supplemental material carries a non-exclusive license, and permission requests for re-use of supplemental material or any part of supplemental material shall be sent directly to the copyright owner as specified in the copyright notice associated with the article.