
Abstract
How does expansion in the high-tech sector influence the broader economy of a region? We demonstrate that an infusion of venture capital in a region leads to: (i) declines in the number of establishments and in employment in non–high-tech industries in the tradable sector; (ii) increases in entry and in employment in the non-tradable sector; and (iii) a rise in income inequality in the non-tradable sector. Expansion in the high-tech sector therefore leads to a less diverse tradable sector and to increasing inequality in the region.
Introduction
Silicon Valley has been the quintessential high-tech cluster. It emerged with the arrival of semiconductors. Orange groves became offices. It then rose to prominence as its startups grew into technology giants first in hardware, then in software, in networking, in on-line businesses, and in social media (Kenney, 2000; O’Mara, 2019; Saxenian, 1994). The modern-day gold rush continues. Today, more of the acclaimed “unicorns”—startups with private valuations in excess of one billion dollars—reside in the Bay Area than in any other part of the country. 1
Yet, Silicon Valley also has its ills. Housing has become scarce and expensive. Few can afford it. Employees have resorted to living out of cars and recreational vehicles and to sharing apartments with dozens of strangers (e.g., Barr, 2019; Nieves, 2000). The tech titans—the likes of Apple, Alphabet, and FaceBook—lavish their employees with pay and perquisites. But other employers struggle with the rising cost of doing business (e.g., Kendall & Castaneda, 2019; Staff, 2019). Entrepreneurs, meanwhile, can find it difficult to recruit and retain talent.
The current state of Silicon Valley—especially the growing costs of doing business in the region—reminds us of another phenomenon: the Dutch Disease. The Dutch Disease refers to what happened to the economy of the Netherlands following the discovery of natural gas in the North Sea (Corden, 1984; Ellman, 1981). The exporting of large volumes of petroleum products led to the rapid appreciation of the Dutch guilder. Currency appreciation, in turn, raised the effective costs for exporters in the manufacturing sector, leading to their demise and to the de-industrialization of the Netherlands. The economic boom created a more concentrated and less robust economy.
The Dutch Disease has generally been seen as a national-level phenomenon (Corden, 1984; Corden & Neary, 1982). Since regions do not have their own currencies, they may appear immune to contracting it. But booming high-tech clusters create a similar dynamic. 2 Rising wages and real estate prices increase the cost of doing business. These rising costs prove particularly problematic for the tradable sector—industries that export goods and services to other regions—because these businesses must compete with rivals operating elsewhere, in lower-cost places. As a result, the tradable sector of the region may become increasingly concentrated on the booming industries.
Silicon Valley represents an extreme case. It has a larger tech sector than any other region in the world. Rising costs have made it difficult for all but the most productive to operate there. But, if the logic of the Dutch Disease holds at the level of regions, these dynamics may represent a general feature of high-tech hubs.
Studying these processes empirically can pose a challenge, particularly in disentangling cause and effect. As a source of semi-exogenous variation, we focus on venture capital. Venture capital has been critical to financing startups and rapidly growing firms in high-tech industries (Florida and Kenney, 1988). Changes in its supply therefore create mini-shocks to the tech sector in a region. Indeed, past research has demonstrated that increases in the supply of venture capital stimulates entrepreneurship, creates jobs, and raises regional income (Samila & Sorenson, 2011; Chowdhury et al., 2019). But research has not considered the extent to which these effects may vary across industries, creating winners and losers.
We treat the industry-region-year as the unit of analysis and examine the short- to medium-run effects of these shocks. Our analyses estimate the relationship between an increase in venture capital funding in a region and the number of establishments, employment, and average income in the various industries operating in the region for 5 years following that funding.
We sort industries into three sets: (1) the segment of the tradable sector of interest to venture capitalists; (2) the remainder of the tradable sector; and (3) the non-tradable sector (local services). We explore the differential effects of venture capital across these three sets from 2003 to 2012.
Infusions of venture capital produce four patterns: (1) The portion of the tradable sector of interest to venture capital expands, particularly in terms of aggregate employment. (2) The rest of the tradable sector contracts; the number of firms and employees drop within these industries. (3) Meanwhile, the number of firms and employees in the non-tradable sector rises. (4) However, income within the non-tradable sector becomes more dispersed. While the average income falls for those, such as bartenders and waiters, at the bottom of the income distribution, it climbs for those, such as dentists and doctors, already at the top.
Overall, the diversity of the exporting sector declines with infusions of venture capital. Income inequality also almost certainly increases. The tradable sector generally accounts for the wealth of a region and provides its better-paying jobs (Verhoogen, 2008; Helpman et al., 2010). As parts of this segment decline, it hollows out the middle of the income distribution. The non-tradable sector, meanwhile, becomes more unequal in response to venture capital investments. The poor do worse while the rich get richer. This combination of the crowding out of the other segments of the tradable sector with rising income inequality appears to be the signature symptoms of the Silicon Valley Syndrome.
The Dutch Disease
In the 1960s, the Netherlands began to export natural gas and related products in large and growing quantities. 3 The value of the Dutch guilder rose relative to other currencies. Exporting industries therefore experienced corresponding increases in their costs of production (measured in terms of the currencies of importing countries). In fact, declines in manufacturing exports ended up being so severe that they more than offset the exports of petroleum. Exports as a whole fell.
The “Dutch Disease” has thus become a popular name for the idea that a booming extraction sector—whether oil, gems, or precious metals—can crowd out a lagging manufacturing sector. 4 Three main mechanisms produce the symptoms. First and foremost, the rapid rise in exports of the natural resource leads to an appreciation in the currency (Gylfason et al., 1999; Harding et al., 2020). Because manufacturers cannot easily cut what they pay their employees and domestic suppliers, they experience an increase in their costs relative to competitors in other countries. Exporters outside the booming sector find it difficult to compete.
Second, the booming natural resource sector attracts talent and investors. Firms in the burgeoning extraction sector pay higher salaries. They also offer higher interest rates and more attractive expected returns to investors. Talent and capital therefore rush out of other industries into the booming sector (Corden & Neary, 1982). Not only do other parts of the tradable economy experience higher costs but also they may find themselves starved of human and financial capital.
Third, the dependence of exports on natural resource prices leads to unstable exchange rates. The prices of commodities often swing wildly as supply and demand move temporarily out of equilibrium. When commodities account for a large share of exports, these fluctuations propagate into exchange rates. Exchange rate volatility, in turn, increases the uncertainty that managers and investors face, depressing capital investment and complicating the management of global supply chains (Bloom, 2009; Gylfason et al., 1999).
The Silicon Valley Syndrome
At first blush, the Dutch Disease feels far removed from Silicon Valley. Leaving aside any legacy of the gold rushes of the 1800s, Silicon Valley’s wealth comes from entrepreneurship and innovation not from the extraction of natural resources. As a region in a large state in an even larger country, Silicon Valley would seem immune to the exchange rate issues underlying the Dutch Disease.
But costs can rise in many ways. The booming tech sector in Silicon Valley has almost certainly increased the price of doing business there. To recruit and retain talent, the high-tech titans have pushed pay and perquisites to new levels. Employees receive not just high salaries but often also access to free gyms and cafeterias and even to exclusive buses to and from their corporate campuses (e.g., Schrodt, 2017).
Real estate costs have also been rising rapidly. Thirty years ago, the Case-Shiller Home Price Index for San Francisco stood at roughly 72. 5 Even at the height of the dot-com boom, it only reached a level of 135. Today, it sits at 287. In 30 years, home prices have quadrupled! These rising costs affect everything from the incomes that employees demand to the costs of office space and the prices charged at bars and restaurants.
Far from being unique to Silicon Valley, these rising labor and real estate costs probably represent a general feature of a booming technology sector. Consider the design side of Apple, the Google search engine, or Abbvie’s Humira antibody. Because few alternatives exist, these products and services generate enormous profits for the firms producing them. The value created floods into the regions where these companies, their founders, and their highly paid employees live.
Real estate prices soar as these firms and their employees compete for the limited supplies of office space and of housing. Booming high-tech industries may have unusually large effects on residential real estate prices. 6 Because equity awards factor so heavily into compensation in these industries, employees themselves experience windfalls of wealth when their firms get acquired or go public (Butler et al., 2019; Stuart and Sorenson, 2003). Employees often use these newly acquired fortunes to purchase homes. Butler et al. (2019), for instance, report that initial public offerings lead to large run-ups in real estate prices within a five-mile radius around the headquarters of the firms going public. For the largest public offerings, the ripples of these price effects can extend more than ten miles from their epicenters.
Whether other factor prices rise in real terms at a regional level, however, depends on the mobility of labor and capital. At the national level, borders create barriers. Whether due to language differences or legal restrictions on entry, employees from outside the country find it difficult to immigrate in response to rising incomes. Exchange rate risk similarly deters the movement of financial capital into a country. In models of the Dutch Disease, treating the factor side of the economy as being relatively fixed does not represent a heroic assumption.
Regions within countries do not seem so different. Although regions experience some expansion in the supply of capital and talent in response to a booming tradable sector, people and money do not flow freely across places. Entrepreneurs and employees, for example, appear strongly attached to the places where they have family and friends (Dahl and Sorenson, 2009, 2010; Figueiredo et al., 2002). They rarely move. Even large differentials in real wages across regions can therefore persist for extended periods of time. Echeverri-Carroll and Ayala (2009), for example, estimate that employees in cities with high concentrations of high-tech enjoy a pay premium of at least 5%, even after accounting for differences in personal productivity.
Capital similarly exhibits a strong home bias. Lenders and equity investors favor nearby firms (Deloof et al., 2019; Prijcker et al., 2019; Sorenson & Stuart, 2001). Whether this tendency reflects the fact that investors have better information on firms headquartered near them (van Nieuwerburgh and Veldkamp, 2009) or the possibility that investors hold biased opinions in favor of familiar firms (Sorenson & Waguespack, 2006) remains an open question. Regardless of the reason, however, even within countries, financial capital ends up disproportionately deployed near its sources.
Tradable versus Non-Tradable Industries
The consequences of these rising factor prices probably vary by sector of the regional economy. We divide the economy into two sectors. The tradable sector comprises businesses that can deliver their goods and services to far-flung customers. Most manufacturers produce tradable goods. In modern economies, this sector also includes many services. Consulting, advertising agencies, and investment banking, for example, frequently serve clients outside their home regions. The non-tradable sector, meanwhile, refers to businesses that can only deliver their goods and services locally. Bars, restaurants, and dry cleaners fall into this category. But it also includes industries like health care and live entertainment.
A booming tech sector may crowd out the production of other tradable goods and services in the region. The tech sector competes with these other tradable industries for capital and employees. If businesses must pay more to attract talent and resources, it raises their effective costs of production. But businesses in the tradable sector, almost by definition, must compete for customers with those located elsewhere, in regions not experiencing a tech boom and therefore not subject to such cost inflation. To the extent that these industries become increasingly uncompetitive at national and international levels, we would expect them to decline in regions with booming tech sectors.
The non-tradable sector, by contrast, might actually grow in response to a tech boom. Although the non-tradable sector must also contend with rising costs, businesses in these industries need not compete against those elsewhere with lower costs.
Local services may also benefit from a spending effect (Allcott & Keniston, 2018; Bernstein et al., 2019; Moretti, 2010). 7 As tech expands and as employees in the sector earn more, demand rises for many types of local services, from coffee shops to orchestras. Consistent with this expectation, job creation in the tradable sector appears to have a “multiplier” effect, where each new manufacturing job leads to the creation of one or two additional jobs in the non-tradable sector (e.g., Moretti, 2010; Moretti & Thulin, 2013; van Dijk, 2017).
This spending effect may also raise incomes in the non-tradable sector (Kemeny & Osman, 2018). During a tech boom, rising demand for local services sometimes outstrips increases in their supply. For example, many types of high-end offerings, such as live music and sporting events and Michelin-starred restaurants, cannot easily expand their capacity. Doctors, dentists, and other professionals—particularly those seen as being at the top of their practices—may also find their services in increasingly high demand. The providers of these services can therefore charge more.
Empirical Strategy
Investigating these processes can prove difficult. Most notably, the direction of causality might flow in either direction. The demise of the manufacturing sector in a region might release resources—freeing managerial and employee talent for use elsewhere in the economy (Sorenson, 2017). The technology cluster in Waterloo, Ontario, for example, arose from the ashes of Research in Motion, the company that made the Blackberry (Spigel, 2017).
A common strategy for dealing with this type of endogeneity has been to find some sort of shock to the local economy that can serve as a source of econometric identification. In examining the effects of natural resources on local economies, researchers have, for example, examined the discovery of oil and natural gas deposits in the region (Decker et al., 2017; Harding et al., 2020). In regions already producing commodities, they have used fluctuations in the going prices for these commodities as a source of exogenous variation (Allcott & Keniston, 2018; Bernstein et al., 2019).
We believe that the supply of venture capital in a region provides a similar source of pseudo-exogenous variation for high-tech industries. Venture capital firms, financial intermediaries that provide funding to private companies in return for equity, have been on the rise in the United States since the 1980s (Gompers & Lerner, 2001). The National Venture Capital Association (NVCA) reports that, in 2019, venture capital firms in the United States deployed more than US$100 billion into new investments and held more than US$400 billion in assets under management. 8
Two features of venture capital prove useful for our purposes. First, venture capital firms invest locally (Colombo et al., 2019; Prijcker et al., 2019; Sorenson & Stuart, 2001). Much has been written about the “one hour” rule, by which venture capitalists will not invest in companies further than one hour of travel time from their offices. Two factors appear responsible for this effect. First, venture capitalists rely on their social relationships for due diligence (Kolympiris et al., 2018; Sorenson & Stuart, 2001). Since these relationships connect them primarily to the regions in which they live and work, they cannot easily evaluate deals elsewhere. Second, venture capitalists actively monitor and advise the companies in which they invest (Bernstein et al., 2016). They prefer to do so in person. But traveling to companies becomes more costly the further those companies are from their offices.
Second, venture capital stimulates the growth of the firms it funds and the economic growth of the regions where those firms reside. Firms backed by venture capital operate more professionally and more efficiently, and grow more rapidly (Bertoni et al., 2011; Davila et al., 2003; Hellmann & Puri, 2002; Ragozzino & Blevins, 2016). At the regional level, venture capital encourages entrepreneurship, creates jobs, and raises regional income (Samila & Sorenson, 2011).
One might nonetheless worry about the potential endogeneity of venture capital investments themselves. If venture capitalists scan the country for attractive opportunities, their decisions to invest in particular regions might stem from them foreseeing high future returns in those places, perhaps due to the discovery of an important technology. Any apparent effects, therefore, might reflect these underlying trends. To address this possibility, we assess the robustness of our results to estimating the effects with an instrument for the supply of venture capital.
Our empirical analysis builds off of Samila and Sorenson (2011). Our analysis nevertheless differs from theirs in at least three important respects. First and foremost, rather than examining the aggregate effects of venture capital on regional economies, we explore how venture capital investments differentially benefit some sectors while harming others. Second, our paper covers a more recent period, 2003–2012. Even at an aggregate level, it therefore updates their earlier results. Third, our paper also adopts a novel instrumental variable approach, using a shift-share instrument rather than one based on the probable portfolio allocation preferences of local limited partners. This instrument produces stronger first-stage predictions and therefore more precise second-stage estimates.
The Data
Our data on entrepreneurship, employment, and average wages come from the Quarterly Census of Employment and Wages (QCEW) dataset of the Bureau of Labor Statistics (BLS). This database covers more than 95% of all jobs in the United States. Our measures of venture capital activity, meanwhile, have been derived from the Thomson Reuters VentureXpert database. 9 We use population data from the Census Bureau.
We constructed a panel dataset covering all Metropolitan Statistical Areas (MSAs) in the United States from 2003 to 2012. The U.S. Office of Management and Budget (OMB) defines an MSA by selecting a core urban area, with at least 50,000 inhabitants, and joining it with surrounding counties where at least 25% of the residents commute to that urban area. They therefore represent reasonably independent economic units.
We chose our time window to ensure stability in these areal units. The OMB redefines MSAs in response to each census. For example, the current set of MSAs stem from the 2010 census. These redefinitions typically occur 3 years after the census. Our 2003 to 2012 period therefore captures a consistent set of regions based on the 2000 census.
Although the government currently identifies more than 380 MSAs in the United States, several of these units only appeared with the incorporation of information from the 2010 census. In 2003, the OMB had defined 369 regions as MSAs. Eight of them were in Puerto Rico, which we exclude from our analysis. The BLS, moreover, did not have QCEW data available for two MSAs: Danville (VA) and Sandusky (OH). Our final dataset therefore includes 359 MSAs.
The BLS reports information on employment and business activity within six-digit North American Industry Classification System (NAICS) codes. Examples of industries at this level of disaggregation would include “plastics bag and pouch manufacturing” (NAICS 326111), “motor home manufacturing” (NAICS 336213), and “full-service restaurants” (NAICS 722511). The BLS reports this information each quarter.
The MSA-industry-year serves as our unit of observation. We therefore aggregate the quarterly information to an annual level. We exploit the panel structure of the data by including three-way fixed effects, for industries, regions, and years.
Dependent Variables
Exactly how activity in the high-tech sector might influence the economy depends on how entrepreneurs and organizations adjust to the rising demand from the sector. Potential entrepreneurs, for example, might recognize the challenges or opportunities, either entering or forgoing entry based on their perceptions of the environment. But existing businesses might also expand or contract. We therefore consider multiple measures of business activity in each industry.
We would ideally have a measure of entrepreneurship. The BLS, however, does not report information on the numbers of business starts or closings. But they do provide information on the number of establishments—defined as a single physical location where business occurs—in each industry and region. We therefore use the logged number of establishments as our first outcome of interest. 10
Our use of annual data on fine-grained industries means that most entry and exit should appear as changes in these counts. Increases and decreases in the number of establishments, nevertheless, stem both from the births and deaths of entire enterprises and from the openings and closings of locations (e.g., a bank or a chain restaurant opening or closing a branch).
Employment simply counts the total number of jobs in a region at establishments in a particular industry. It includes both full-time and part-time employees. Because of the way that the QCEW collects information, this count can potentially include an individual more than once if the person has more than one job. We log this count as our measure of employment.
We use average weekly income per job, for a particular industry and region, as a measure of the earnings associated with those jobs. Although we sometimes refer to this measure as wages, it includes multiple types of compensation. Bonuses, stock options, reported tips, and retirement benefits, for example, would all appear in these totals. For part-time employees, increases in these average earnings could stem either from increases in the number of hours worked or in the average amount earned per hour. 11 Once again, we log this average income when using it as a dependent variable.
Venture Capital
We considered three different measures of the supply of venture capital: the number of first-round investments, the total number of investment rounds, and the total amount invested by venture capital firms in startups headquartered in an MSA. 12 We sum these measures over 5 years and log them (adding one dollar to the amount to avoid missing values in regions that did not receive any venture capital investments over a 5-year period).
Venture Capital by Industry and Region.
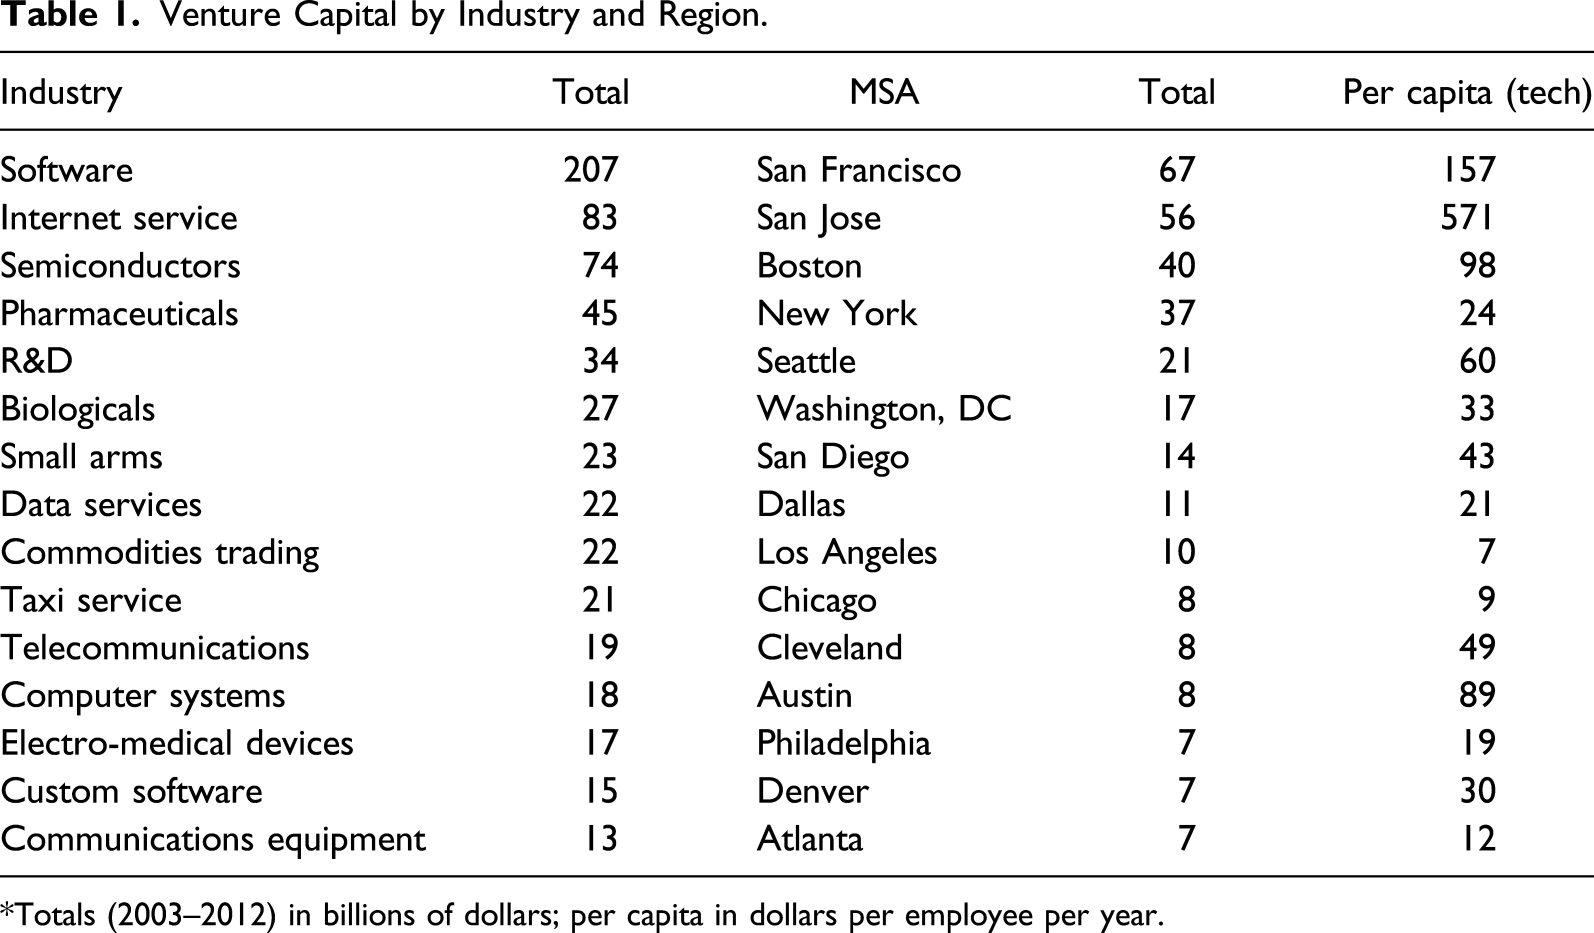
*Totals (2003–2012) in billions of dollars; per capita in dollars per employee per year.
The final column of the table reports venture capital dollars per employee in the industries funded by venture capital, a measure of the dollars chasing talent in these regions. That distribution has an even longer tail. The San Jose area has nearly 10 times as much capital per high-tech employee as Seattle, which ranks fifth on that measure.
Figure 1 maps the average changes in venture capital over this period. We calculated the ratio of the average venture capital received annually in 2004–2012 relative to what had been received in 1998–2002. Because we estimate log-on-log models with fixed effects, this ratio provides a good sense of which regions weight most heavily in our estimates. Changes in venture capital investments, 2003–2012.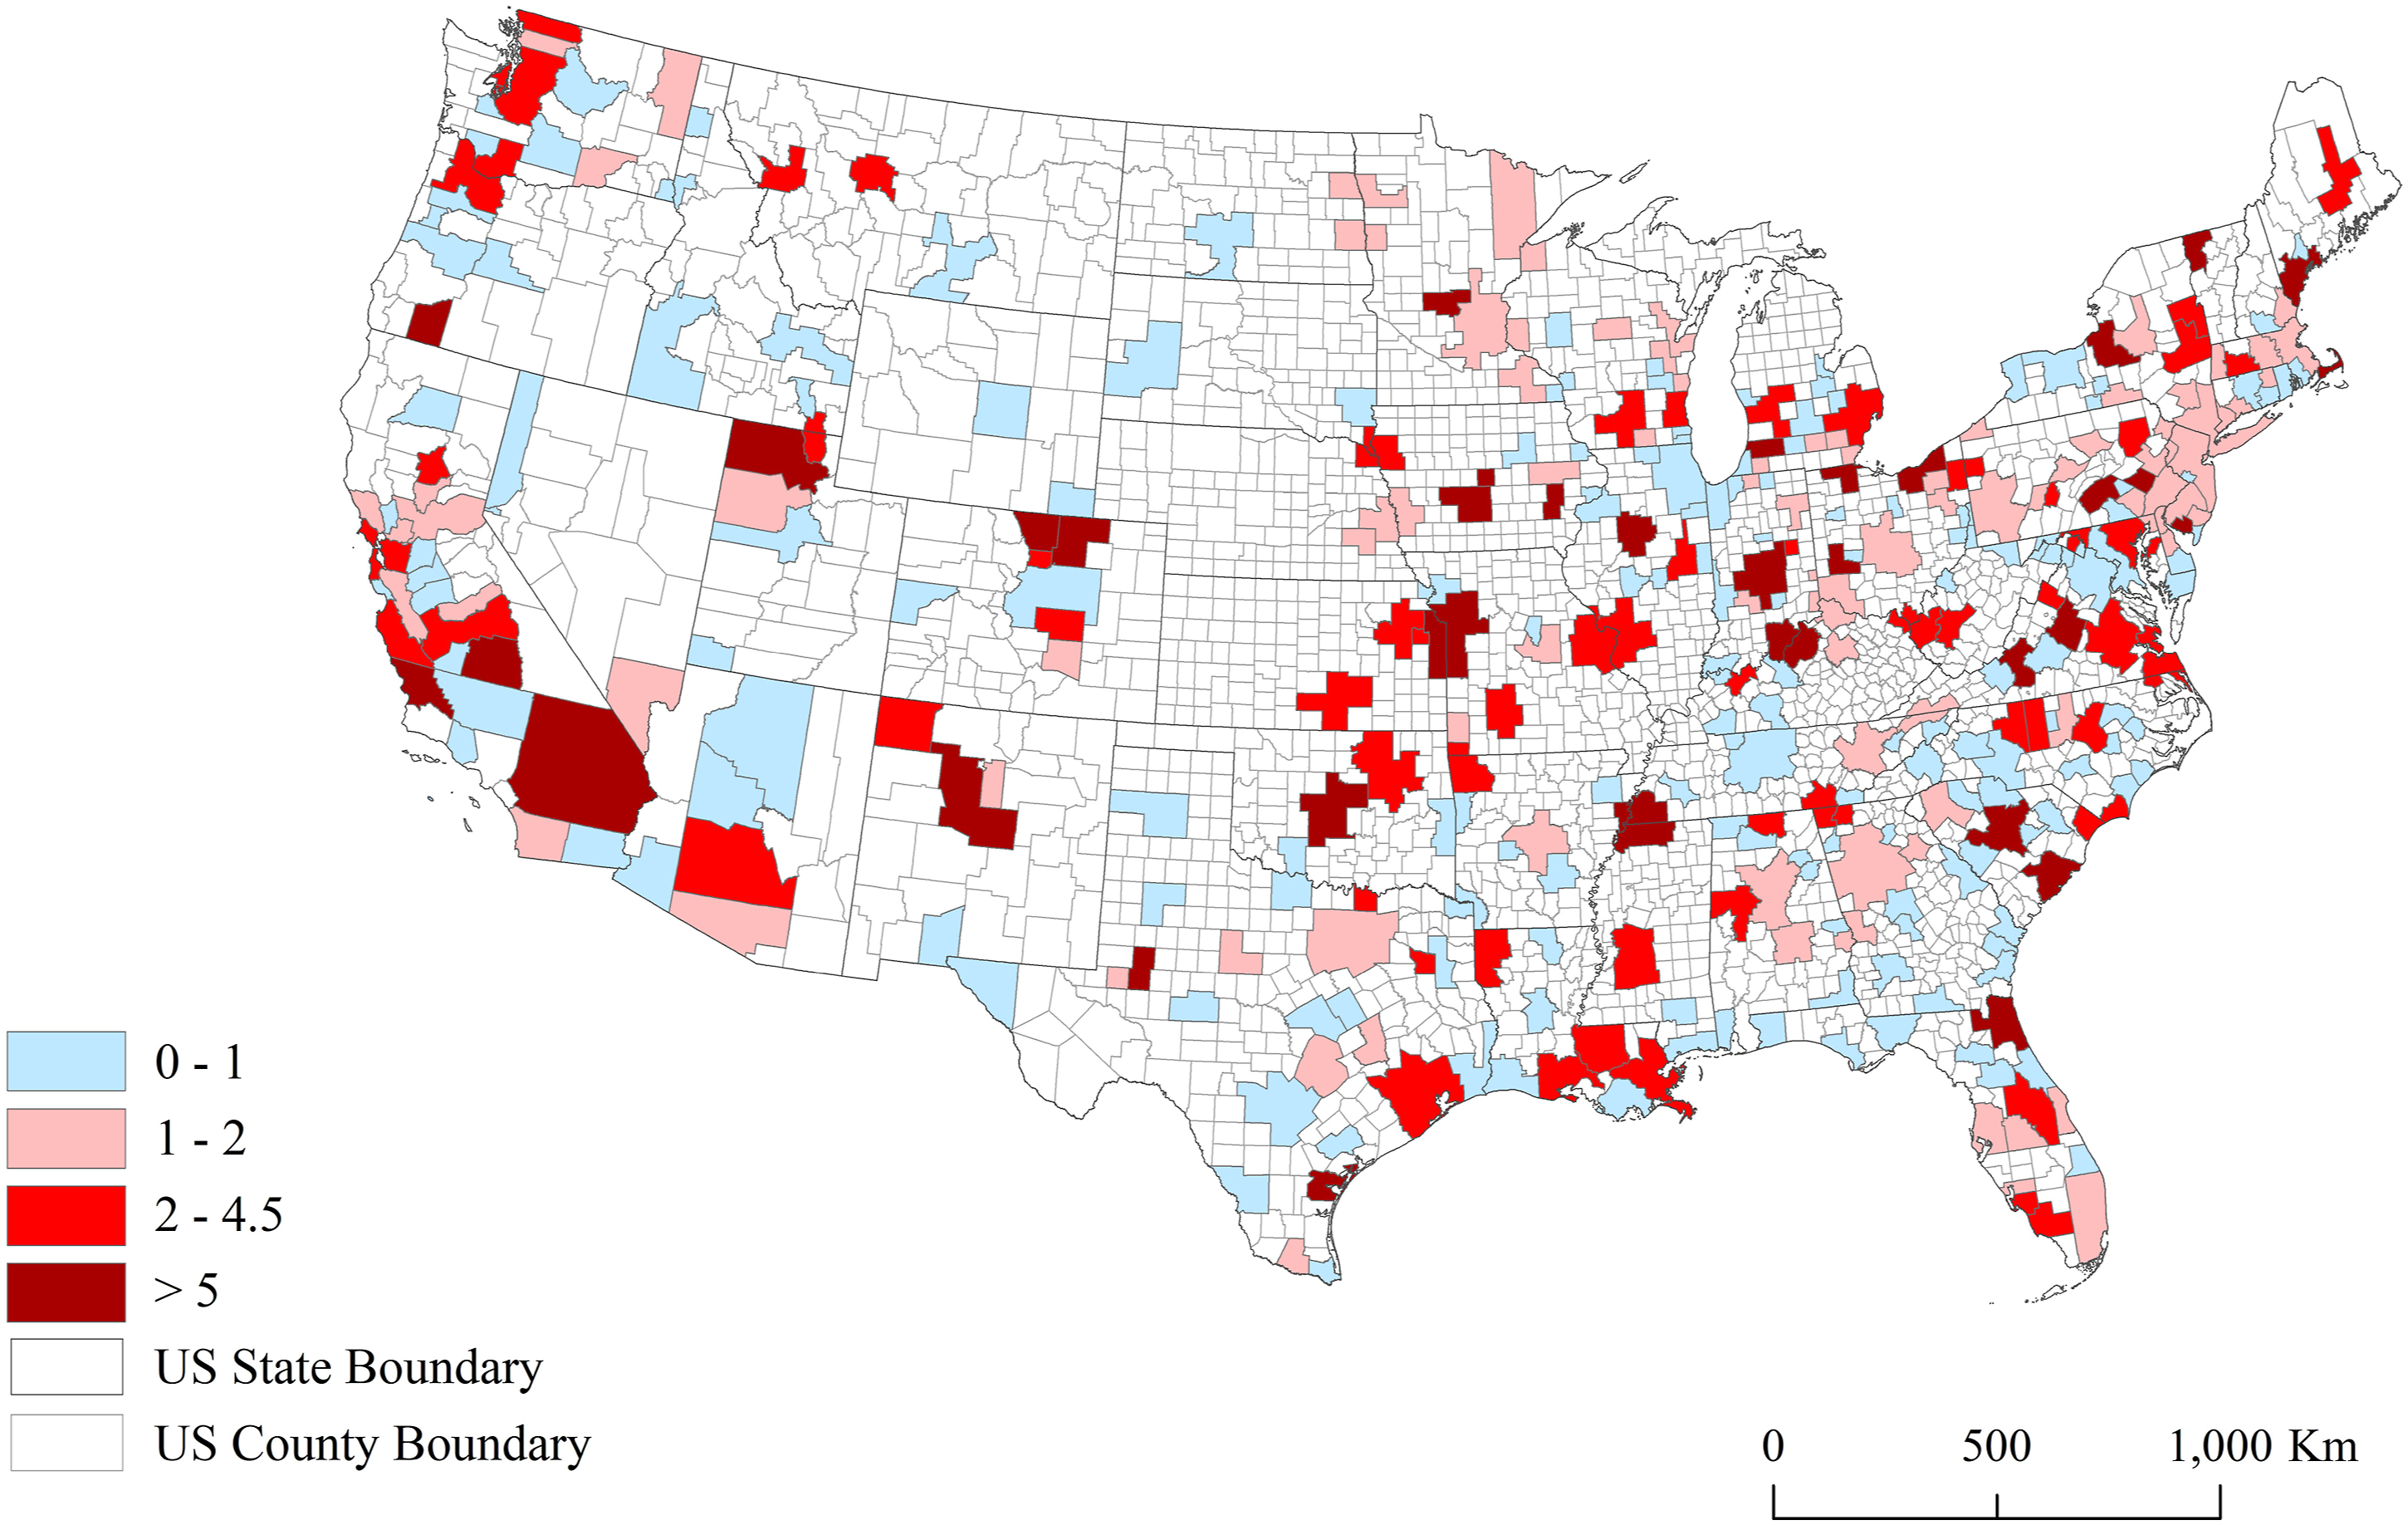
Although Silicon Valley provides the inspiration for our paper, it does not appear as an outlier on this map. San Jose and San Francisco had already been receiving large infusions of venture capital prior to 2003. From 2003–2012, places like Ogden, Utah; Roanoke, Virginia; and Jacksonville, Florida, had the largest increases in venture capital in percentage terms.
Our three measures essentially weight different stages of venture capital investment. First-round investments, roughly a measure of the number of venture-capital-backed startups in the region, capture the effects of the earliest round of funding. The number of investment rounds equally weights earlier- and later-stage investments. Meanwhile, the total amount invested primarily captures later-stage investments since the size of these investments dwarfs earlier rounds. Later-stage rounds in unicorns, for example, have often brought in billions of dollars whereas a typical first-round investment might amount to no more than one million dollars.
Prior research suggests that early-stage investments have stronger effects on the local economy than later ones (Samila & Sorenson, 2011). As companies mature and expand, they deploy more and more of the capital that they raise outside of their home regions. Of the billions of dollars invested in Uber over the past few years, for example, little has gone to hiring people in the Bay Area. Most of it has been dispersed around the globe to subsidize drivers in the dozens of cities in which it operates.
Our measures of venture capital activity aggregate the number of investments and the amount of funds invested for the 5 years prior to each year. We do so for two reasons. First, because of the small numbers of companies being funded, these measures bounce around from one year to the next. The smoothing created by aggregating across years helps to reduce underestimation due to the noisiness of the measure (i.e., attenuation bias). Second, the effects of venture capital investments unfold over time. Samila and Sorenson (2011), for example, reported that venture capital had significant effects on regional economic growth for at least 3 years following an investment. By aggregating across years, our estimates capture the cumulative regional economic effects for the 5 years following an investment.
Tradable versus Non-Tradable
The empirical literature on the Dutch Disease has typically equated the tradable sector with manufacturing (Allcott & Keniston, 2018). That assumption had not been problematic at the time that the Netherlands discovered oil, as manufacturing then accounted for the vast majority of exports. But in modern economies, services often represent a large share of what gets produced in one region but consumed elsewhere.
As part of their effort to understand industrial clusters, Delgado et al. (2014) created a classification of industries, in terms of being traded or not. Their definition incorporates cutoffs on multiple criteria, such as the proportion of regions with no employment in the industry and the degree of geographic concentration of employment. We use this classification for most of our analyses.
We, however, refine their classification to distinguish between tradable industries of interest to venture capitalists (loosely “high tech”) versus those that venture capitalists generally will not fund. We classify industries as being relevant to venture capital if more than 1% of all venture capital dollars went to the industry between 1997 and 2012. 13
The Delgado et al. (2014) coding, however, has one disadvantage from our perspective: It defines industries as being either tradable or non-tradable (local). Many industries, however, especially services, reside someplace in between. They vary in the degree to which they serve customers elsewhere. To address this issue, we created a continuous measure based on the geographic dispersion of each industry. We follow the same logic as Delgado et al. (2014): The most local businesses should exist in roughly equal per-capita measure everywhere. The most tradable ones concentrate in a few places.
That logic points to the Location Quotient (LQ). It captures the relative concentration of an industry in a particular region. But as a measure of the overall dispersion of an industry, it has a serious disadvantage: Its average for any industry across all regions always sums to one. 14
Descriptive Statistics.
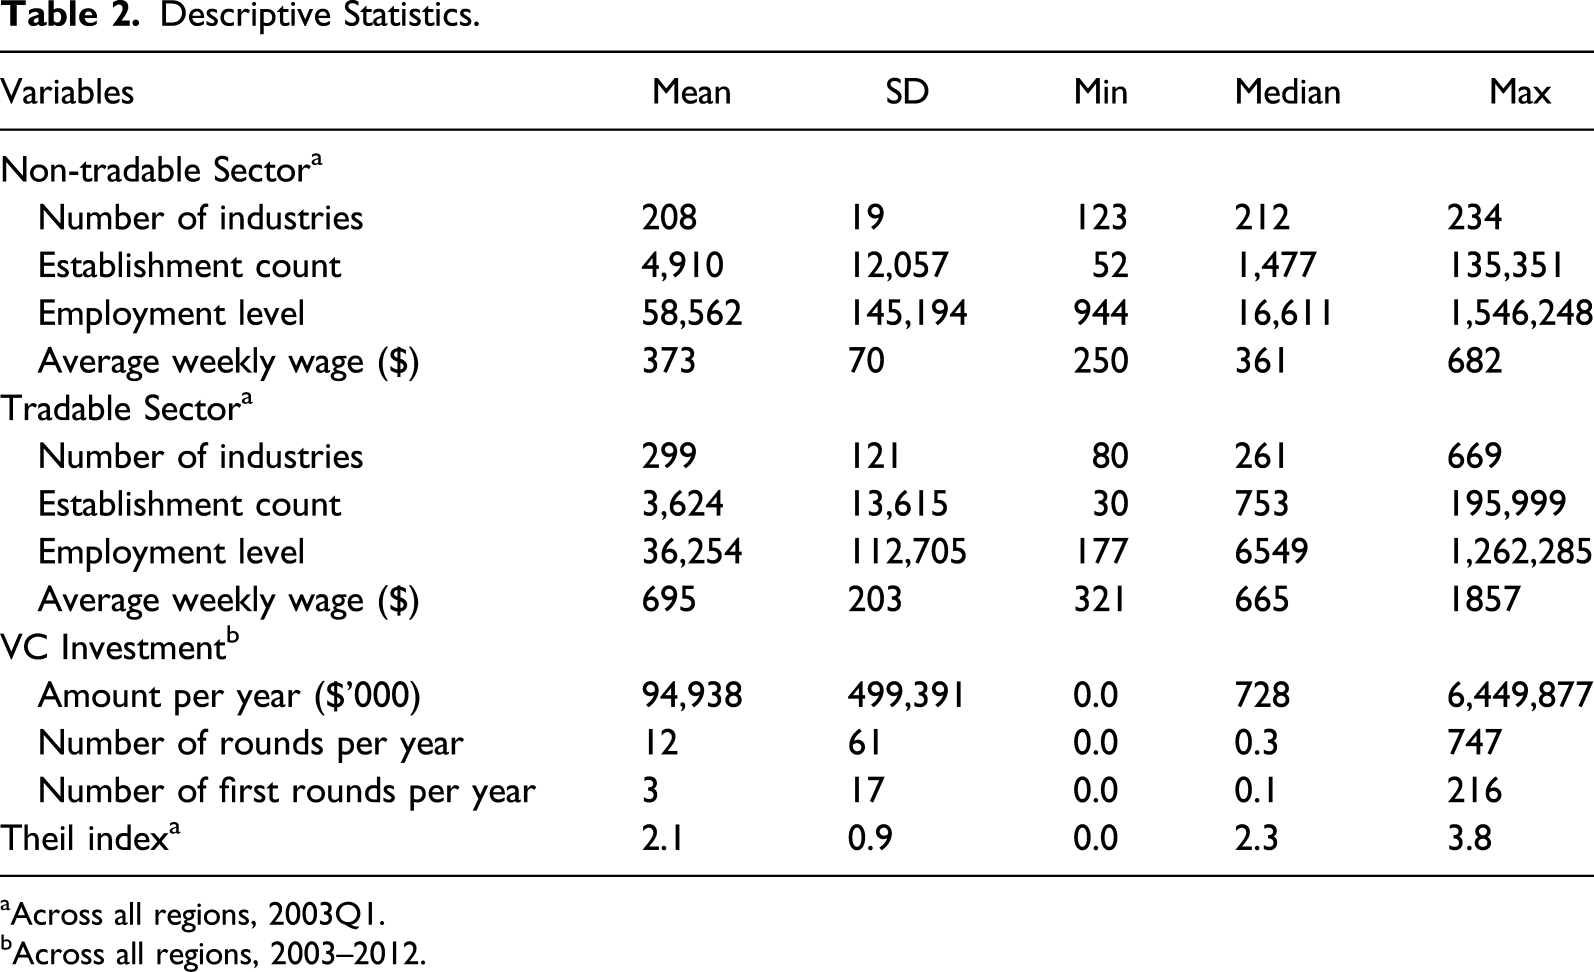
aAcross all regions, 2003Q1.
bAcross all regions, 2003–2012.
Results
Figure 2 maps changes in non–high-tech tradable employment from 2003–2012. It colors each country by the average employment in these industries from 2004–2012 relative to their levels in 2003. Counties colored in blue lost jobs. Changes in non–high-tech employment, 2003–2012.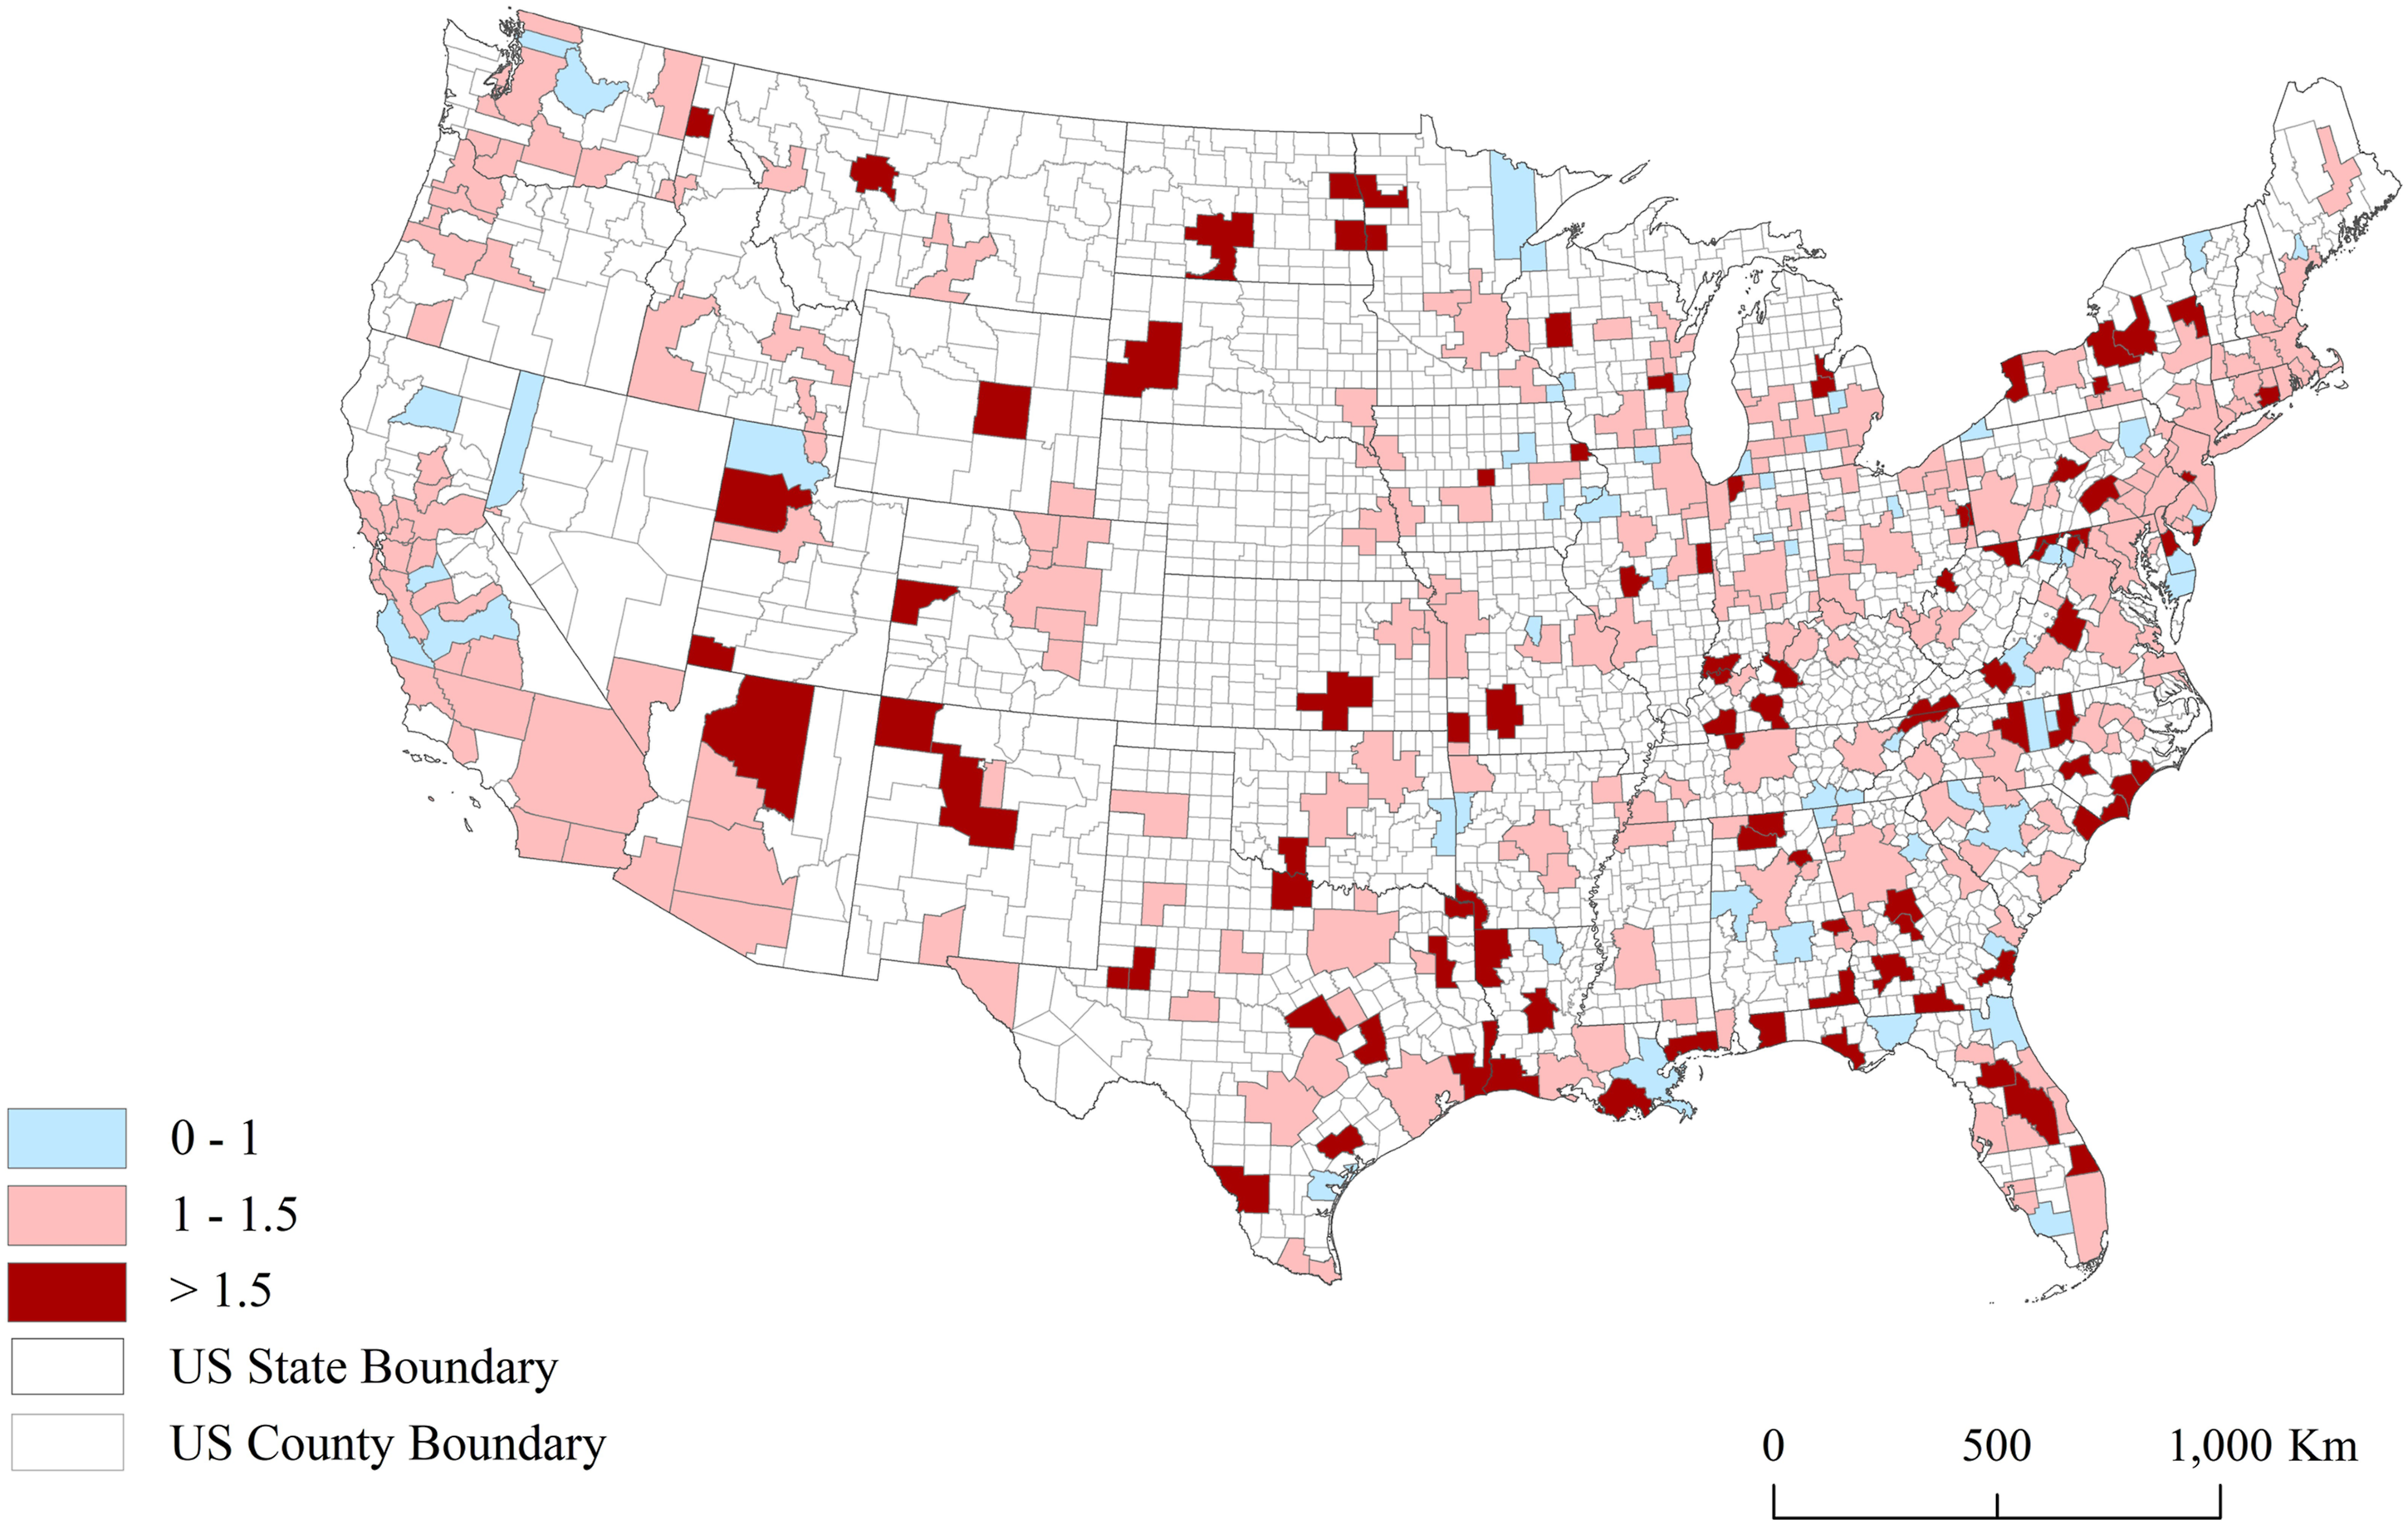
Even in the raw data, high-tech appears to crowd out the rest of the tradable sector. For example, Ogden, Utah, and Jacksonville, Florida, which had been large recipients of venture capital during this period experienced declines in the non–high-tech portion of the tradable sector. Some of the places with the largest declines in venture capital also had the largest employment gains in the non–high-tech tradable sector. Witness Flagstaff, Arizona, and New Haven, Connecticut.
Fixed Effects Estimates
We begin by estimating log-on-log fixed effects models
The three-way fixed effects should account for a wide variety of potential confounds. The region fixed effects, for example, will capture the effects of relatively time-invariant factors such as local institutions, the presence of colleges and universities, and the composition of the local labor force. The industry fixed effects help to account for the fact that some industries have simply grown or contracted faster than others during this period, across all regions. Because sector of the economy does not vary within industries, these fixed effects also absorb the “main” effects of the industry classifications: tradable (vc), tradable (non-vc), and non-tradable. Year fixed effects, meanwhile, account for national-level changes in the economic environment.
Our log-on-log specifications mean that the coefficients represent elasticities. These elasticities may seem small but venture capital funds a thin slice of the economy, even in the most heavily concentrated high-technology clusters. Even small elasticities therefore often imply outsized effects of these investments on the regional economy (Samila & Sorenson, 2011).
Fixed Effects Estimates of the Effects of Venture Capital Investments by Sector.
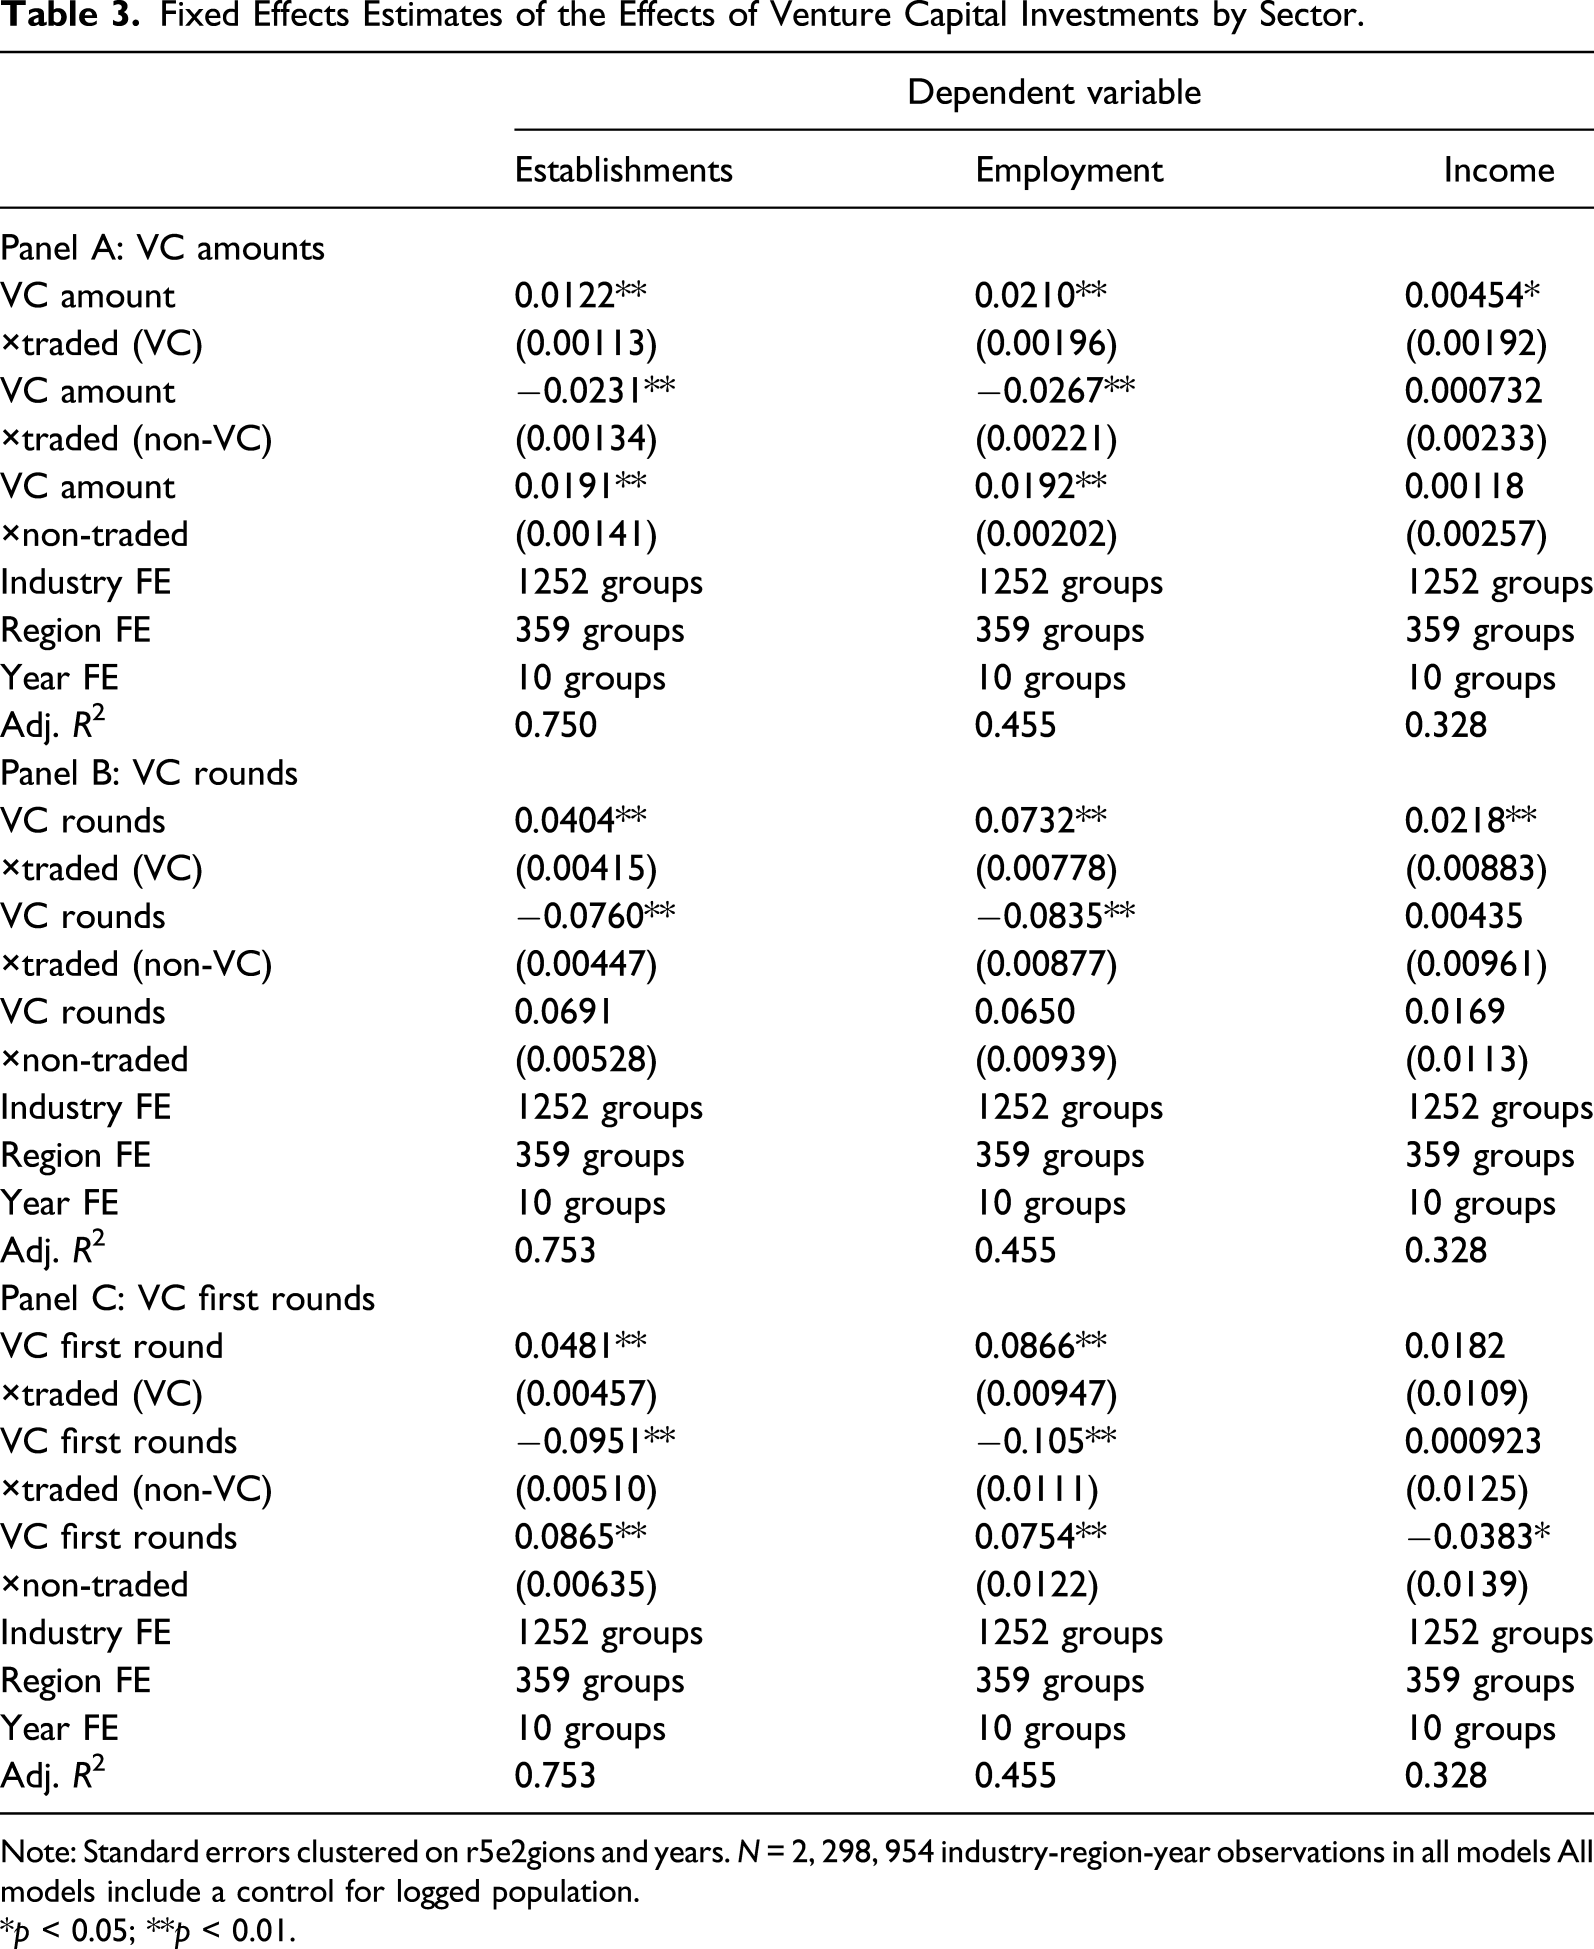
Note: Standard errors clustered on r5e2gions and years. N = 2, 298, 954 industry-region-year observations in all models All models include a control for logged population.
*p < 0.05; **p < 0.01.
We have specified the independent variables such that each coefficient captures the effects of venture capital on a different segment of the local economy (i.e., on different sets of industries). Consider first the effects of venture capital on the tradable industries that it funds. The coefficient of 0.0122 indicates that a doubling in the amount of venture capital investment in an MSA increases the number of establishments in the industries funded by venture capital by 0.8% (= .0122 × ln(2)). That would correspond to 48 more establishments across all of these industries in the average region.
Some regions, however, experience much larger effects. Venture capital has been highly concentrated in a small number of places. Even among regions that receive venture capital, moving from the median to the 75th percentile of the distribution would involve nearly three doublings. Moving from the 75th percentile to the 90th would require two additional doublings. Moving from the median level of venture capital to the 90th percentile would therefore predict a 4.4% increase in the number of establishments in the industries funded by venture capital, or a difference of 248 firms in those industries in a region with an average population.
Reading down the column, the other measures of venture capital predict even larger effects on entry in these industries. Doubling the number of first rounds of investment, for example, would predict a 3.3% increase in the number of establishments in the industries funded by venture capital. The fact that earlier rounds of investment would have larger effects on entrepreneurship in these industries seems unsurprising since dollars in later rounds often go into the consolidation of industries.
Venture capital investments, however, have very different effects on the rest of the tradable sector. The middle coefficient in each panel captures this effect. The number of establishments in the non-VC tradable industries declines by 1.6% with a doubling in dollars of venture capital investment, roughly 105 fewer establishments in these industries in the average region. The typical region, therefore, experiences a net decline in the total number of tradable businesses—VC and non-VC combined—following an increase in venture capital investments in the region.
By contrast, venture capital investments have the largest positive effects on entry in the non-tradable sector. The number of establishments in these industries rise by 1.3% with a doubling in the amount of venture capital and by 6% with a doubling in the number of companies funded by venture capital (76 and 346 establishments, respectively, in the average MSA). At a regional level, most entrepreneurship in response to the supply of venture capital appears to occur in these local services rather than in the industries directly funded by venture capital.
The coefficients in the second column describe a parallel set of models for the number of jobs. Venture capital has a positive effect on employment in the venture-capital-relevant portion of the tradable sector. A doubling in venture capital dollars predicts a 1.5% increase in the number of jobs in these industries (more than 1, 000 jobs in the average region), while a doubling in the number of first rounds corresponds to a 6% increase. Again, however, the models would predict much larger effects in some regions. Moving from the median to the 90th percentile of venture capital investment corresponds to a 7.5% increase in aggregate employment in these industries, nearly 6,000 additional jobs in a region with an average population.
Because these elasticities are substantially larger than the net entry rates in these industries, venture capital must not only increase the number of establishments in these industries but also their average size.
But, once again, venture capital investments predict a decline in employment in the rest of the tradable sector, ranging from 1.9% for a doubling in venture capital dollars to 7.3% for a doubling in investment rounds. These negative effects on employment are again larger in magnitude than the decline in the number of establishments. Here, that difference implies not only a decline in the number of establishments in the rest of the tradable sector but also a shrinking in their average size.
Given the relative sizes of the venture capital and non-venture capital segments of the tradable sector, these job gains and losses largely cancel each other out. The overall size of the tradable sector remains almost unchanged in response to venture capital investments. It simply becomes more concentrated in tech.
At the level of the region, job growth then comes primarily from the non-tradable sector, from local services. These industries experience large increases in employment following increases in the supply of venture capital. A doubling in the amount of venture capital, for example, predicts a 1.3% increase in the employment in the non-tradable sector, or 536 jobs in the average region. Moving from the median level of venture capital to the 90th percentile corresponds to a 6.8% increase in employment in these local services. Interestingly, the magnitude of these increases almost mirrors that of the increases in the number of establishments, meaning that the average size of these local services remains unchanged. We just see more of them.
Compared to the prior literature on multiplier effects Moretti and Thulin (2013); van Dijk (2017), each high-tech job here appears associated with fewer additional jobs in the non-tradable sector. However, when considering the net gain in jobs in the tradable sector (i.e. accounting for the losses of non-high-tech jobs), then the implied multiplier effects become large, on the order of 10:1. For comparison, (Moretti & Thulin, 2013) estimated a multiplier of 5:1 for high-tech job creation. That high level probably stems from a combination of net job creation and income gains in the tradable sector. Jobs in the industries relevant to venture capital pay roughly 60% more, on average, than those in the rest of the tradable sector.
The right-most column finally reports models for average weekly wages. Increases in the supply of venture capital primarily appear to affect the earnings of those in the industries funded by venture capital. The earnings of these employees increase by 0.3% with a doubling in venture capital dollars and by about 1.3% with a doubling in the number of companies funded by venture capital.
Although the estimates in Table 3 suggest that the tradable sector becomes less diverse in response to venture capital, as it concentrates in the tech sector, the high-tech sector itself may become more varied. Spin-off processes, for example, may lead to a proliferation of high-tech industries in these places (Agrawal & Cockburn, 2003). But spin-off processes could also lead to further concentration within the tech sector if these progeny entrepreneurs primarily enter the same industries as their parent firms (Sorenson & Audia, 2000; Klepper, 2010).
Fixed Effects Estimates of the Effects of Venture Capital Investments on Industry Diversity in the Tech Sector.
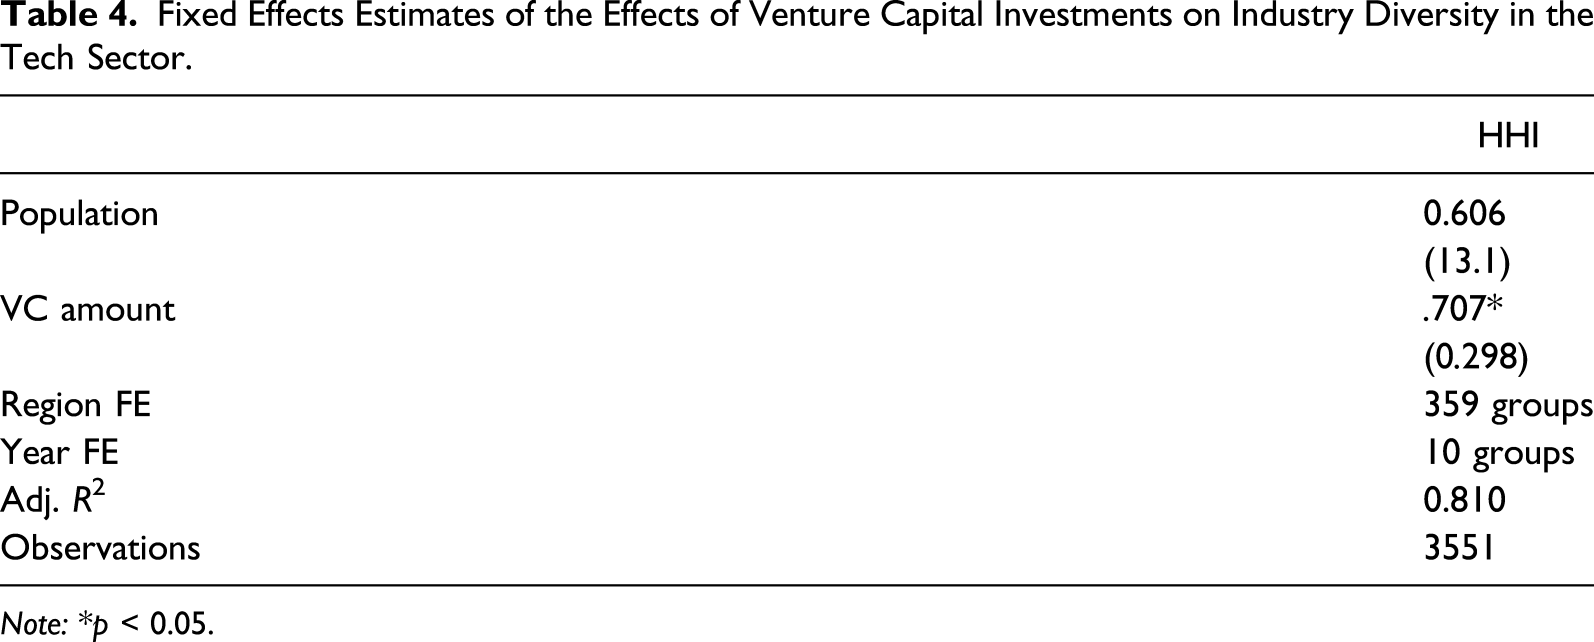
Note: *p < 0.05.
Fixed Effects Estimates of the Effects of Venture Capital Investments by Industry Theil Index.
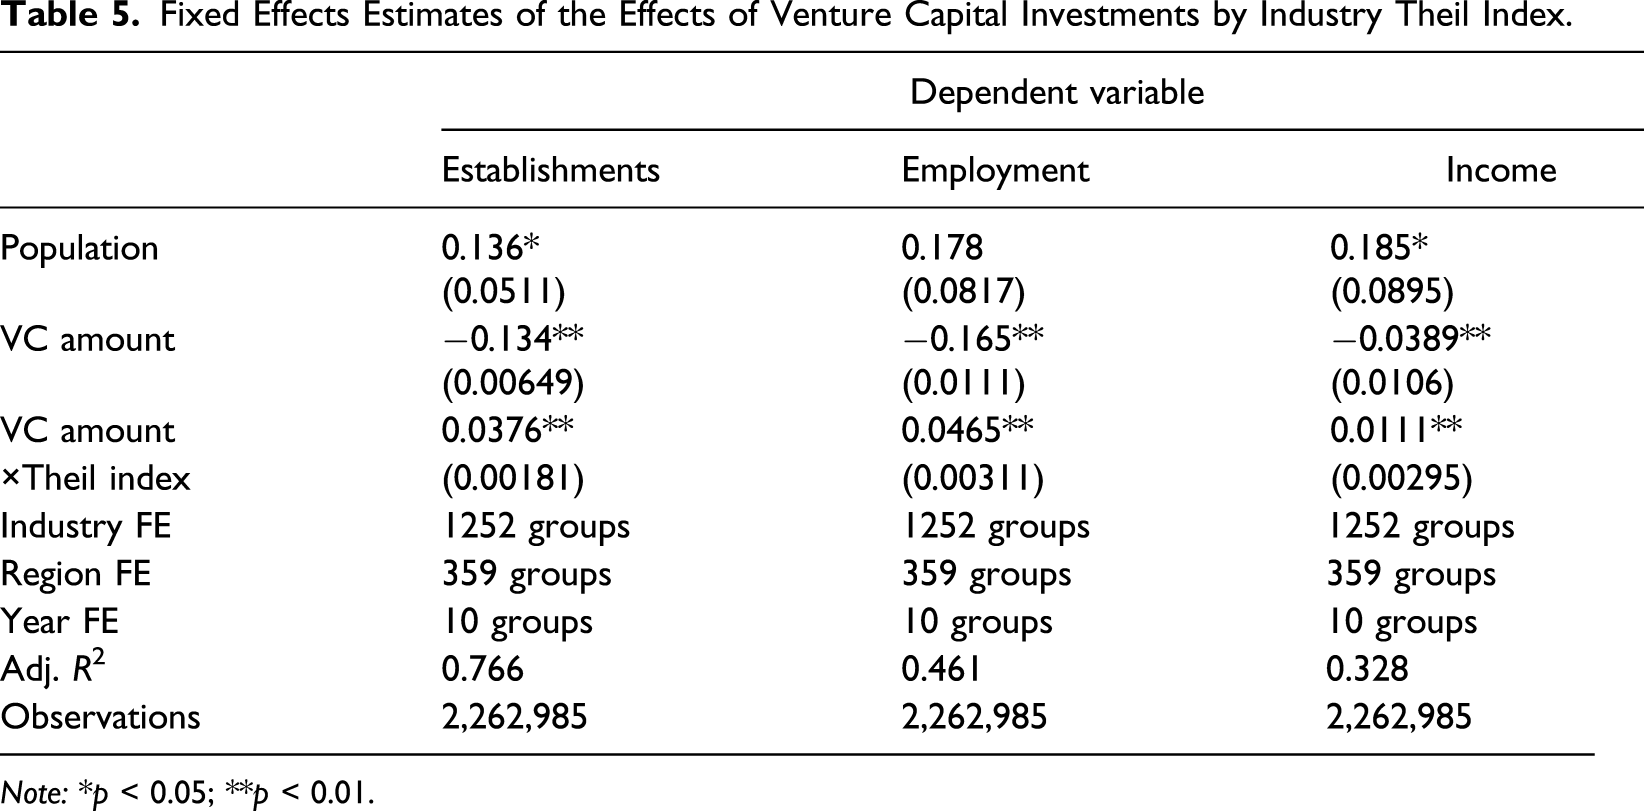
Note: *p < 0.05; **p < 0.01.
Recall that a value of zero on our continuous measure would imply that the entire industry resided within a single MSA. The “main” effects of venture capital in these models therefore capture the effects of venture capital in a highly concentrated industry, one that produces in one location but sells to consumers across the country. In these (highly) tradable industries, increases in the amount of venture capital invested in a region predict declines in the number of establishments and the number of jobs, and in the average incomes associated with these jobs. But as industries become more dispersed—that is, become more local (non-tradable)—the effects shift. For industries that are dispersed across regions, infusions of venture capital led to increases in the number of establishments and the number of jobs, as well as to rising wages. Although the continuous measure allows for industries to vary in the extent to which they are tradable, for the average industry in each sector, the continuous and discrete measures produce qualitatively equivalent results.
Fixed Effects Estimates of the Effects of Venture Capital Investments by Income Quartile of the Non-Traded Sector.
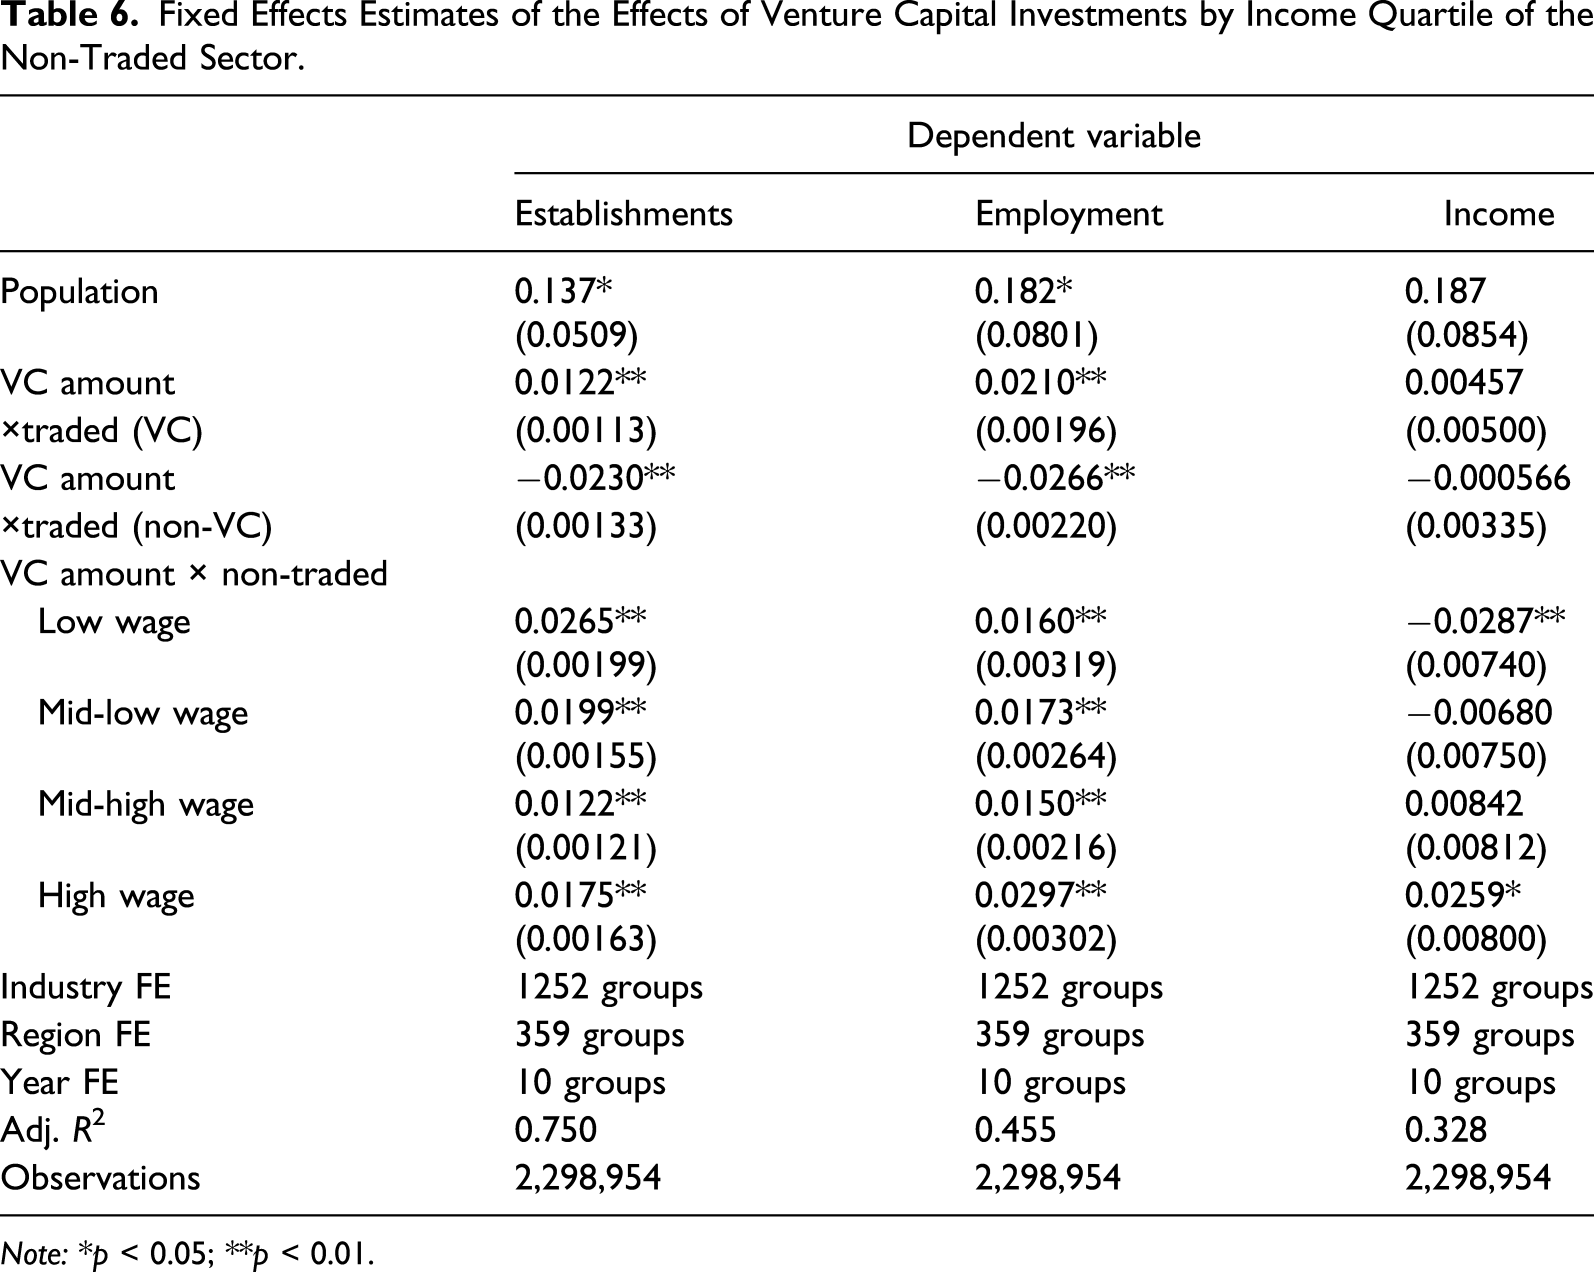
Note: *p < 0.05; **p < 0.01.
Venture capital has similar and relatively consistent effects on the number of establishments and the number of jobs across these groups. In relative terms, industries in the lowest-wage quartile expanded the most in terms of their numbers, while those in the highest-wage quartile increased the most in terms of their employment. But we split these quartiles according to average earnings not overall employment. The lowest-wage quartile accounts for more jobs in the typical region than the other three quartiles combined. In absolute terms, then, the majority of jobs created in these local service businesses paid low wages.
The effects of venture capital on average earnings interestingly diverge across the quartiles. Income inequality rises. In the lowest-income quartile, average income actually declines. 17 As one moves up the income quartiles, the effects of venture capital on average income becomes more and more positive. In the highest-income quartile, average earnings increased by almost 1.8% with a doubling in the amount of venture capital investments.
Some regions again experience much larger effects. Moving from the median to the 90th percentile of venture capital, for example, would predict a nearly 10% increase in earnings among the top-income quartile. Such a shift, moreover, would raise the ratio of earnings at the top relative to the bottom quartile from 2.3 to 2.9, a 25% increase in inequality in the non-tradable sector.
Declines in average income do not necessary mean that an individual employee receives less pay. Instead, it may reflect a changing composition of the labor force. If the highest human capital employees in the lower-income quartile of the non-tradable sector leave, perhaps to join the tech sector, then the average pay of the remaining employees could decline even if everyone who remains in the segment continues to earn the same amount.
Instrumental Variables Estimates
Although the three-way fixed effects account for many potential confounds, these estimates could still overestimate the effects of venture capital if venture capital firms actively invest in the regions with the highest levels of expected economic growth. We address this issue by estimating a set of models using instrumental variables to predict the amount of venture capital in the region.
We use a shift-share, or Bartik-style, instrument (Goldsmith-Pinkham et al., 2020). We estimate the expected level of venture capital in a region in a given five-year period using the proportion of all venture capital deployed in the region from 1997-2002 multiplied by the total dollars deployed by venture capitalists at a national level in a moving five-year window. The region fixed effects absorb the first term, accounting for potential endogeneity in the distribution of venture capital from 1997 to 2002. The year fixed effects, meanwhile, absorb changes in the overall supply of venture capital at a national level.
Because we need a separate instrument for each segment of the local economy, we create additional instruments by interacting this shift-share instrument with indicator variables for sector of the industry (i.e., traded (non-vc), etc.). We therefore have a total of six first stages, one for each independent variable of interest. Overall, this set of instruments appears to predict strongly the endogenous interaction effects. The instruments explain between 10% and 19% of the variance in the endogenous regressors. The Cragg–Donaldson joint test of the significance of the instruments exceeds 32,000, well above the critical value of 10 suggested to ensure that one need not worry about instrument weakness.
The primary threat to the exclusion restriction, meanwhile, would come from alternative paths between the instrument and the dependent variable (Goldsmith-Pinkham et al., 2020). In other words, could the local supply of venture capital prior to 2003 predict regional economic growth over the subsequent decade for reasons other than persistence in the regional supply of venture capital? One plausible threat might stem from the continued success of companies funded by venture capitalists during this earlier period. Although we cannot completely dismiss this possibility, if true, then it should most strongly bias upwards the estimates of the effects of venture capital on the number of employees and the average incomes in those industries funded by venture capital. But the IV regression produces a precisely-estimated null for the effect of venture capital on the incomes of those employed in the industries that it funds.
Instrumental Variable Estimates of the Effects of Venture Capital Investments.
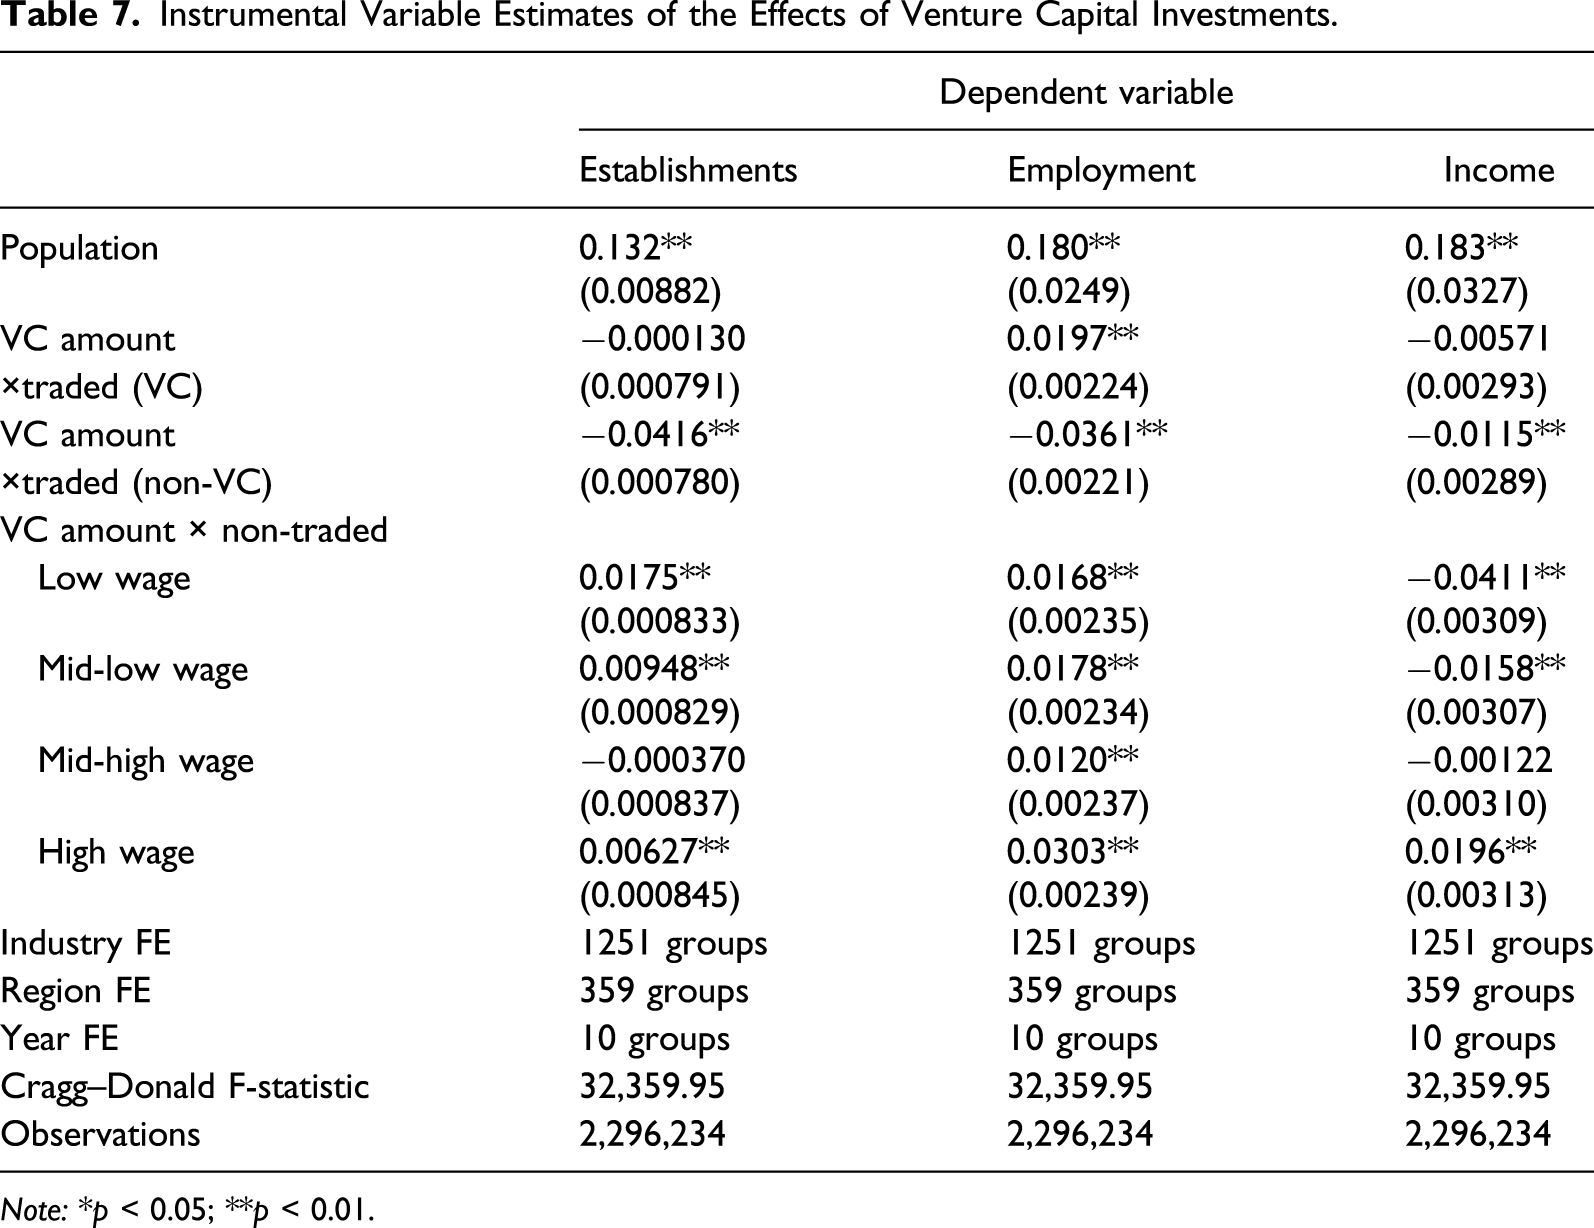
Note: *p < 0.05; **p < 0.01.
The effects of venture capital on the rest of the tradable sector, however, appear largely consistent with the fixed effects estimates. Increases in the supply of venture capital reduce the number of establishments, aggregate employment, and average incomes in these industries.
The IV estimates for the non-tradable sector also parallel the fixed effects estimates. Increases in venture capital activity spur entry in the non-tradable sector, particularly in services that pay less, such as bars and restaurants. Employment also increases across the entire non-tradable sector in response to infusions of venture capital. As in the fixed effects models, the lower-income quartiles of the sector experience declines in average earnings while average incomes rise in the highest quartile.
Discussion
Policymakers around the globe have seen Silicon Valley as a model for economic development. In many ways, they should envy it. The high-tech cluster there has propelled the region to having the highest per-capita income of any region in the United States.
But Silicon Valley and its model of tech entrepreneurship also has a dark side: Home prices have risen out of reach of most; the cost of doing business there has climbed; and the dynamism of the regional economy has been declining (Fairlie & Chatterji, 2013).
We cast these regional economic dynamics as a cousin of the Dutch Disease. In many countries, the discovery of natural resources has led to economic booms based on extracting and exporting these resources. But these booms simultaneously render these national economies fragile, as the natural resource sector crowds out other exporters. An expanding high-tech sector can similarly crowd out other tradable industries within the region, as it consumes human and financial capital.
We explore these dynamics empirically by estimating the effects of infusions of venture capital on regional economies, metropolitan statistical areas in the United States. These investments create small, semi-exogenous jolts to the local tech sector, allowing us to explore how the expansions they fund ripple through the economy.
Investments of venture capital have different effects for businesses in the tradable and non-tradable segments of the economy. In the tradable sector, these infusions of capital predict future declines in the number of establishments and in aggregate employment outside of those industries funded by venture capital. High-tech therefore appears to crowd out other tradable industries.
Meanwhile, the non-tradable sector expands. Infusions of venture capital increase the number of establishments in these industries and the number of jobs available in them. Wealth created by the tech sector leads to a spending effect, increasing the demand for local goods and services.
Venture capital, however, does not have uniform effects across the non-tradable sector. Although the effects on firm and job creation appear fairly constant across the sector, the effects of venture capital on incomes vary. In lower-wage industries—those that employ less-skilled and less-specialized employees—employees actually earn less following infusions of venture capital. But employees in higher-wage businesses earn more.
The Silicon Valley Syndrome therefore has two main symptoms: Regional economies become more concentrated on the tech sector and inequality rises in the region. Inequality rises not just because of the income effects in the non-tradable sector but also because of the changing composition of jobs. Most of the jobs created by tech booms appear on the ends of the distribution, either in low-paying local services or in high-paying high-tech. Middle-income jobs, associated with the non-tech tradable sector, disappear.
Although these dynamics are consistent with the idea that factor prices rise in response to a high-tech boom, we do not observe these prices. Rising productivity in the tech sector in response to venture capital investments might lead to similar dynamics (e.g., Chemmanaur et al., 2011), crowding out lower-productivity industries in the tradable sector and stimulating the demand for local services. Future research could therefore usefully examine how capital and labor prices, and productivity, respond to venture capital.
With a five-year time horizon, our analysis also focuses only on the short- to medium-term effects of these tech booms. How these dynamics might play out in the longer run remains an open question. High-tech may eventually attract more talent to the region, not just in the tech sector but also in other industries (e.g., Agrawal & Cockburn, 2003). That migration could mitigate some of these short-run price effects.
But these dynamics might also become self-reinforcing in the long run. Entrepreneurs tend to enter industries in which they have experience (Klepper, 2010; Sorenson & Audia, 2000). They also typically stay in the places that they have been living and working (Dahl & Sorenson, 2009; Sorenson & Audia, 2000). As the diversity of employers declines, so too may the diversity of startups. High-tech hubs could therefore become increasingly concentrated on a small set of high-tech industries.
Our analysis has also only considered the regional level. At a national level, these dynamics may lead to a reallocation of industries across regions, with highly productive high-tech concentrating in a small number of high-cost cities and the rest of the tradable sector shifting to lower-cost places (e.g., Andersson et al., 2014). These dynamics therefore may not only lead to increasing economic disparities within regions but also across them.
We believe that our results contribute to several streams of literature. One pertains to the effects of venture capital on the real economy. Although prior research has demonstrated that venture capital stimulates the growth of regional economies (Chowdhury et al., 2019; Samila & Sorenson, 2011), it has not examined whether this growth stems directly from the businesses being funded versus indirectly through multiplier effects. Our results suggest that about half of the growth stems from the industries funded by venture capital but the other half stems from the expansion of the non-traded sector.
Our results also contribute to the literature on the crowding out effects of booming industries in two ways. First and foremost, our results suggest that crowding out represents a common phenomenon rather than one limited to a rapid rise in the natural resource sector. Second, whereas the prior literature has generally treated such crowding out as a national-level phenomenon, we add to the small number of recent studies showing that these processes operate even across regions within countries (e.g., Beine et al., 2015).
The fact that a booming high-tech sector spills over to the non-tradable sector also raises interesting issues for the debate on types of entrepreneurship. Much of the literature has cast entry into these different sectors as distinct choices of the entrepreneur (Welter et al., 2017). Those entering the tradable sector have been seen as “growth” oriented while those starting local (non-tradable) services have been labeled “lifestyle” entrepreneurs.
But these two paths appear inextricably linked: The opportunities for “lifestyle” businesses emerge, in part, from the success of growth-oriented startups in a region. On the one hand, that fact offers another argument for why entrepreneurship scholars should give greater attention to growth-oriented startups in their research (cf. Guzman & Stern, 2015; Henrekson & Sanandaji, 2020). Not only do these businesses directly create the most jobs but also they have the largest indirect multiplier effects on employment.
On the other hand, the connections appear to run in both directions. High-tech businesses create opportunities for the providers of local services, lifestyle entrepreneurs. But as amenities, these local services also help to attract high-tech entrepreneurs and employees to a region (Florida, 2000; Glaeser et al., 2001). More research therefore should try to unpack this potentially self-reinforcing dynamic.
The second symptom—the increasing inequality within a region—meanwhile appears closely related to a pattern identified in urban economics: Employees with more education and stronger social skills earn more in cities (e.g., Andersson et al., 2014; Bacolod et al., 2009). Inequality therefore rises in these urban areas.
With respect to this literature, our results first suggest that tech hubs might experience even larger increases in inequality than other cities. Our results also point to a different mechanism. The urban wage premium has usually been interpreted as reflecting higher productivity due to economies of agglomeration (Bacolod et al., 2009; Glaeser & Resseger, 2010). The fact that much of this inequality emerges in the non-tradable sector, however, suggests that expanded demand for these highly-skilled employees rather than economies of agglomeration may account for these wage premiums.
Finally, our results contribute to the emerging literature on entrepreneurship and inequality. Lippmann et al. (2005) called attention to the fact that countries with higher rates of entrepreneurship tend to have higher levels of inequality (see also Atems & Shand, 2018). More recent research has sought to understand better the mechanisms behind this relationship (Bapuji et al., 2020). Halvarsson et al. (2018), for example, find that self-employment contributes to the tails of the income distribution. Our results suggest that high-growth entrepreneurship may also contribute to inequality by shifting the mix of employers in the economy.
Policymakers have seen Silicon Valley as a model for economic development. But increasing economic inequality appears to be an unintended downside. High-tech industries create wealth. But the “trickle down” effect of this wealth, as the owners and employees of these companies increase their spending on local goods and services, only appears to go so far down. It benefits those at the high end—the already well-off accountants, doctors, and lawyers. But those at the lower end of the service economy, the servers and taxi drivers, appear simply to fall further behind.
Footnotes
Acknowledgments
We thank the Joseph Jacobs Chair in Entrepreneurial Studies at UCLA for financial support, and Yiou Zhang for research assistance. We received useful comments on earlier versions of this paper from Karl Wennberg, two anonymous reviewers, as well as attendees of the Uddevalla Symposium and seminar participants at Rice University, Universidad Carlos III, USI Lugano, and the Stockholm School of Economics.
Declaration of Conflicting Interests
The author(s) declared no potential conflicts of interest with respect to the research, authorship, and/or publication of this article.
Funding
The author(s) disclosed receipt of the following financial support for the research, authorship, and/or publication of this article: This research has been supported by the Joseph Jacobs Chair in Entrepreneurial Studies at UCLA.