






Abstract
We investigate how environmentally oriented ventures (EOVs) acquire financial resources through equity crowdfunding (ECF) and allocate resources to job creation. Our results suggest that EOVs raise 22.20% to 34.70% more funding and increase headcount by 18.06% to 61.95% relative to non-environmentally oriented ventures. We argue that environmental orientation may increase demand for labor, through the ongoing development of environmental capabilities, and labor supply, by making EOVs more attractive employers. Our evidence is more consistent with a supply explanation as EOVs find it somewhat easier to hire in tight labor markets. Our study highlights how ECF has real-economic impact through job creation.
Keywords
Introduction
Environmentally oriented ventures (EOVs) are increasingly recognized as important actors in addressing grand societal challenges such as climate change, resource depletion, and ecological degradation (Leonidou et al., 2017; Vismara & Wirtz, 2025). Despite their important missions, EOVs often face difficulties accessing capital, hindering the investments needed for promoting their environmental objectives. We argue that equity crowdfunding (ECF), a type of equity financing in which a dispersed crowd of investors can fund entrepreneurial ventures online (Ahlers et al., 2015; Butticè et al., 2020, 2022; Cumming et al., 2024; Piva & Rossi-Lamastra, 2018; Vismara, 2016, 2018), can relieve some of these constraints. This funding model has generally been proven efficient in helping ventures that otherwise have difficulties obtaining funding (Cumming et al., 2021; Fasano et al., 2025; Lazos, 2025) and EOVs in particular (see Hörisch & Tenner, 2020; Vismara, 2019; Vismara & Wirtz, 2025). However, the literature on EOVs’ post-campaign outcomes is scarce and mainly focuses on survival and performance (Del Gaudio et al., 2025; Del Sarto & Bellavitis, 2025; Vismara & Wirtz, 2025) rather than how the financial resources are allocated. We aim to fill this gap in the ECF literature by focusing on how EOVs allocate financial resources from ECF campaigns, and whether this leads to post-campaign job creation.
We analyze whether ECF creates jobs through the resource-based view (RBV; Barney, 1986, 1991; Lippman & Rumelt, 1982; Penrose, 1959; Wernerfelt, 1984), drawing in particular on its natural resource-based extension (NRBV; Hart, 1995; Hart & Dowell, 2011). RBV posits that firms use strategic resources and capabilities to attain and sustain competitive advantage. NRBV extends RBV to a setting where firms face constraints imposed by their biophysical environment, highlighting the need for deploying and developing environmental capabilities to gain competitive advantage (Hart, 1995; Hart & Dowell, 2011). These theories have primarily been developed and most often applied to large and established firms that do not face the same challenges as young ventures (Alvarez & Busenitz, 2001; Shane & Venkataraman, 2000; Zahra, 2021). Young ventures face both liabilities of newness (Monaco et al., 2024; Stinchcombe, 1965) and smallness (Brüderl & Schussler, 1990), which limit resources and capabilities in place and constrains resource acquisition. These boundary conditions, coupled with the opaqueness of young firms, call for a more nuanced application of NRBV to entrepreneurial settings.
We extend NRBV to an ECF setting by conceptualizing environmental orientation as an early-stage organizational capability that is rooted in a commitment to the natural environment. Environmental orientation reflects the venture’s ability to recognize, prioritize, and organize around environmental opportunities and constraints (Aragón-Correa & Sharma, 2003). Although such a capability may still be emerging in young ventures, it can already impact strategic positioning, campaign communication, and early resource mobilization. Therefore, we explore whether environmental orientation affects fundraising and whether EOVs exhibit greater post-campaign employee growth conditional on funds raised.
We offer two complementary but theoretically distinct mechanisms through which environmental orientation may impact ECF campaign fundraising and post-campaign hiring. First, from a demand-side perspective, consistent with NRBV, EOVs must develop knowledge and human capital-intensive capabilities to gain competitive advantage (Consoli et al., 2016; Hart, 1995; Hart & Dowell, 2011). The greater demand for skilled labor in turn increases the demand for financial capital to finance such investments. Second, from a supply-side perspective, emerging capabilities become observable through campaign texts, organizational identity, and hiring-related communication (Lounsbury & Glynn, 2001). In opaque crowdfunding environments, these observable displays of environmental capability can signal legitimacy to investors and prospective employees even for young ventures, facilitating fundraising and helping firms overcome labor market supply frictions. Both mechanisms predict greater fundraising and hiring among EOVs.
Using a sample of 659 ECF campaigns in the United Kingdom during the years 2019 to 2022, our empirical findings lend support to the above theoretical assertions. We first report that environmental orientation facilitates fundraising, as EOVs raise 22.20% to 34.70% more capital in their campaigns relative to non-environmentally oriented ventures (NEOVs). Next, we show that successful ECF campaigns of EOVs increase headcount by 18.06% to 61.95% 1 year after the campaign compared to NEOVs (depending on specification and EOV measure). The effect remains economically meaningful after accounting for endogeneity in the capital raising stage. In tests to support either a supply or demand-side mechanism, our findings point toward a supply-side mechanism, where EOVs can enlarge their supply pool through signaling in tight labor markets (TLMs) where hiring is difficult. Our results are robust across a wide range of alternative specifications and variable measurements.
Our study contributes to the ECF literature in three ways. First, our study adds to the understanding of post-campaign outcomes for ECF-financed ventures in general, and EOVs in particular. Prior literature emphasizes outcomes such as follow-on financing (Coakley et al., 2022b; Do et al., 2026), survival and performance (Hornuf et al., 2018; Lazos, 2025; Rossi et al., 2023; Vismara & Wirtz, 2025), venture capital financing (Butticè et al., 2020), and innovation (Eldridge et al., 2021; Troise et al., 2021; Walthoff-Borm et al., 2018b). While these studies capture the viability of ventures, they offer limited insights into their impact on real-economic outcomes. We offer novel insights into how ECF and EOVs affect employee growth.
Second, our study adds to the understanding of how environmental orientation affects ECF outcomes in the campaign stage. ECF studies on short-run performance investigate whether ventures reach their target at the end of the offering (Del Sarto & Bellavitis, 2025; Hörisch & Tenner, 2020; Vismara, 2019). This binary measure of campaign success, although important, may provide limited insight into firms’ capacity to generate real-economic impact. Our article instead focuses on the amount of capital raised that captures the scale of investor demand (Åstebro et al., 2024) and the resources available for post-campaign growth and job creation.
Third, prior studies within the ECF literature implicitly examine resources and capabilities such as human capital (Barbi & Mattioli, 2019; Troise et al., 2024), social capital (Vismara, 2016), governance structures (Coakley et al., 2025; Vismara & Wirtz, 2025), certification from third parties (Kleinert et al., 2020) and more importantly environmental orientation (Vismara, 2019; Vismara & Wirtz, 2025) but do not explicitly analyze them under the lens of RBV or NRBV. To our knowledge, our study is among the first in the ECF literature to use RBV and NRBV, while also conceptualizing environmental orientation as a capability that has supply and demand implications in capital and labor markets.
Literature Review
Our study aims to make contributions to two distinct ECF literatures, the post-campaign literature and the impact of environmental orientation on campaign and post-campaign outcomes. Early post-campaign work highlights the importance of ownership and governance structures for follow-on financing. This includes how ownership dispersion (Signori & Vismara, 2018), dual-class shares (Cumming et al., 2019), and shareholder structures (Coakley et al., 2022b; Hornuf et al., 2022) impact follow-on ECF financing. Butticè et al. (2020, 2022) instead studied the impact of shareholder structures on follow-on venture capital funding. Instead of using follow-on financing as an outcome variable, several studies focus on how campaign outcomes and governance structures impact firm survival and performance. Ventures reaching funding targets quicker, backed by professional investors (Signori & Vismara, 2018), having founding teams rather than solo founders (Coakley et al., 2022a), family firms (Rossi et al., 2023), founding teams with similar national background (Lazos & Shneor, 2026), and ventures located outside of high-unemployment regions (Lazos, 2025) are more likely to survive and perform better. Furthermore, Mataigne et al. (2025) found that ventures subject to an invest and withdraw tactic exhibit worse post-campaign performance. On the contrary, investor rights do not impact survival (Hornuf et al., 2022). Differing from other studies, Walthoff-Borm et al. (2018b) used non-ECF firms as counterfactual and found that ECF ventures underperform and are more likely to fail. Several studies further explore post-campaign growth and performance. Alam and Butticè (2026) found that VC-funded firms have higher growth rates relative to ECF. Similarly, Fasano et al. (2025) did not find any impact of ECF on growth.
The articles closest to ours investigate the link between environmental orientation and post-campaign outcomes. Vismara and Wirtz (2025) found that environmental orientation improves post-campaign performance. Del Gaudio et al. (2025) found similar evidence on survival. Del Sarto and Bellavitis (2025) instead highlighted the link between investor ESG expertise and performance in EOVs. Existing post-campaign work suggests that EOVs may survive and perform differently, but it remains unclear whether they translate ECF into broader real-economic outcomes such as employment growth.
Our study further relates to the literature on EOVs and campaign outcomes. Seminal work by Vismara (2019) shows that environmental sustainability does not directly affect the probability of campaign success. Hornuf et al. (2022) argued that sustainability investors pledge higher sums compared to other crowd investors. Hörisch and Tenner (2020) found that environmental orientation positively influences the success of an ECF offering. More recent work by Vismara and Wirtz (2025) showed that the interaction between environmental orientation and nominee structures leads to better campaign outcomes. Capolupo et al. (2025) found that environmental orientation coupled with family ownership increases the likelihood of success. Similarly, Del Sarto and Bellavitis (2025) reported that environmental orientation combined with lead investor human capital impact campaign success. Differently, Billio et al. (2025) found that floods increase the likelihood of launching climate mitigation campaigns which raise more capital than those in unaffected areas. Taken together, these studies indicate that the relationship between environmental orientation and campaign outcomes may not be universally positive. While the environmental orientation can attract more investors, especially retail, it does not guarantee campaign success unless it is effectively signaled. This can be through governance mechanisms and/or lead investor human capital. Environmental orientation may act as a differentiation and engagement factor, rather than a standalone determinant of campaign success.
Theoretical Framework and Hypothesis Development
Resource-Based View and Natural Resource-Based View
RBV (Barney, 1986, 1991; Lippman & Rumelt, 1982; Penrose, 1959; Wernerfelt, 1984) of the firm explains how managers use strategic resources and develop capabilities (Peteraf, 1993; Teece et al., 1997) to attain and sustain competitive advantage. Traditionally RBV emphasizes that strategic resources generate competitive advantage when they are valuable, rare, difficult to imitate, and effectively organized (Barney, 1991; Helfat et al., 2023; Nason & Wiklund, 2018). A capability, in contrast, is something a firm can perform that stems from resources and routines (Peteraf, 1993; Teece et al., 1997). Both resources and capabilities are continuously developed and improved within the firm over time (Helfat & Peteraf, 2003).
A complementary layer to RBV, NRBV accounts for constraints imposed by firms’ biophysical environment (Hart, 1995; Hart & Dowell, 2011). Rather than highlighting the importance of resources, the NRBV focuses on the development of three capabilities that can help firms gain competitive advantage: (a) Pollution prevention; (b) Product stewardship; (c) Sustainable development. In more recent developments of the NRBV, Hart and Dowell (2011) extended the set of capabilities to further include clean technology and base of the pyramid strategies. Menguc and Ozane (2005) argued that environmental orientation by itself can be viewed as a capability rooted in commitment to the natural environment, corporate social responsibility and entrepreneurship.
Traditionally RBV and NRBV are applied to large established companies with already developed capabilities and resources in place, or able to buy them in the factor markets. This makes RBV about the choice of how to optimize the use of resources and capabilities to grow the firm, which sets clear boundary conditions for which RBV and NRBV are directly applicable. The characteristics of entrepreneurial ventures call for a more nuanced application of RBV and NRBV (Alvarez & Busenitz, 2001; Shane & Venkataraman, 2000; Zahra, 2021). As young ventures suffer from the liability of newness (Stinchcombe, 1965) and/or smallness (Brüderl & Schussler, 1990), they are both time- and size-constrained in the development and acquisition of strategic resources (Katila & Shane, 2005) and capabilities (Arikan & McGahan, 2010). Therefore, entrepreneurial ventures require different resources and capabilities, or use them differently compared to larger, more established firms (Unger et al., 2011; Wiklund et al., 2009). Young ventures also face other obstacles apart from the lack of strategic resources and developed capabilities due to newness and smallness. In particular, information asymmetries between entrepreneurs and external resource providers further constrain resource acquisition (Brinckmann & Hoegl, 2011; Janney & Dess, 2006; Stuart et al., 1999).
In this study, we extend RBV and NRBV to an entrepreneurial setting where the lack of conventional strategic resources, developed capabilities, and information asymmetries make resource acquisition and capability development challenging. We conceptualize environmental orientation as an early-stage organizational capability that offers two complementary but theoretically distinctive mechanisms explaining resource acquisition in young ventures. First, ventures’ environmental orientation may increase the demand for human capital resources. The set of environmental capabilities discussed in Hart (1995), and Hart and Dowell (2011) are inherently knowledge intensive and require substantial investment in human capital to develop. The greater need for financial capital and human capital should lead to greater demand for both capital and labor in EOVs relative to NEOVs.
Second, from a supply-side perspective, the observable expression of environmental orientation through campaign communications, organizational identity, and hiring-related communication can convey credible signals to investors and prospective employees (Kleinert & Vismara, 2025; Mansouri & Momtaz, 2022; Vismara, 2019). Most studies integrating signaling theory into RBV try to explain why some firms may have greater resource access. These studies traditionally focus on reputation, an intangible strategic resource, that can provide competitive advantage through signaling in capital and factor markets (Boyd et al., 2010; Rindova et al., 2005). However, Boyd et al. (2010) highlighted evident boundary conditions. Young ventures lack the history and track record to accumulate reputational capital. Instead, distinct from viewing environmental orientation as a resource, we focus on environmental orientation as an early-stage organizational capability. This capability reflects the venture’s ability to recognize, prioritize, and organize around environmental opportunities and constraints. We argue that ventures’ environmental orientation is an important part of defining the organization’s identity, which could signal legitimacy to external parties such as prospective investors and employees (Lounsbury & Glynn, 2001). However, the signaling value of capabilities to external parties is dependent on whether the venture is organized enough to display it through communications, campaign disclosures, and hiring practices (Skaggs & Snow, 2004).
Role of Environmental Orientation in Financial Resource Acquisition under Asymmetric Information
In traditional RBV formulations financial resources do not qualify as a strategic resource as they fail to meet standard criteria (Nason & Wiklund, 2018; Zahra, 2021). Financial capital is instead viewed as a versatile resource with the advantage that it can be converted into other types of resources in the factor markets (Wiklund & Shepherd, 2005). As young ventures often fail to internally generate positive cash flows while simultaneously facing numerous profitable investment opportunities, access to financial resources is crucial for survival and growth (Coad et al., 2013; Cooper et al., 1994; Cosh et al., 2009; Holtz-Eakin, et al., 1994; Linder et al., 2020). At the same time, young ventures are disadvantaged in raising financial resources from conventional financing sources as they face liabilities of newness and smallness in addition to being opaque (Battisto et al., 2019; Beck et al., 2005; Carpenter & Petersen, 2002).
Given these constraints, opaque young ventures increasingly turn to ECF to overcome hurdles in financial resource acquisition (Cumming et al., 2021; Lazos, 2025; Walthoff-Borm et al., 2018a). ECF offers access to a wider investor base compared to conventional financing such as banks, venture capitalists or business angels, with investors often being less experienced than professional ones (Nitani et al., 2019; Schwienbacher, 2019; Shafi, 2021; Vismara, 2018, 2019). Thus, their investment and screening criteria likely differ from those of traditional investors (Hartzmark & Sussman, 2019). As a result, they may have different investment processes and objectives allowing for investments into ventures that would not appeal to professional investors. By contrast ECF may increase information asymmetry between ventures and investors. ECF proposals are coupled with lower levels of disclosure in the prospectus relative to traditional funding sources (Johan & Zhang, 2020) and thus a greater degree of information asymmetry between investors and ventures (Ahlers et al., 2015). Instead of traditional investor documentation, ventures seeking crowdfunding aim to use more soft information in investor pitches than traditional firms do through text descriptions, videos, pictures, and testimonials from others in the crowd (Johan & Zhang, 2022). Therefore, ECF investors make decisions based on other variables than pure financial ones (Shafi, 2021) such as emotions (Sitruk et al., 2025), and social values (Lehner, 2013). In opaque ECF environments, signaling therefore becomes an important factor in financial resource acquisition to separate the offering from others (Ahlers et al., 2015; Courtney et al., 2017; Mansouri & Momtaz, 2022; Scheaf et al., 2018; Spence, 1973).
To capture the attention of the ECF investors, ventures can convey their environmental orientation through their investor communications (Mansouri & Momtaz, 2022). Environmental orientation may function as a strategic capability displayed through campaign communications and can mitigate some information asymmetries by conveying the venture’s value for pro-environmental investors. The empirical evidence supports the claim as environmental orientation increases investors’ willingness to pay (Barber et al., 2021; Heeb et al., 2023; Hornuf et al., 2022; Mansouri & Momtaz, 2022). This indicates that environmentally oriented investors evaluating two identical ventures (with similar expected cash flows and risk) only differing in their environmental orientation would attach a greater value to the EOVs. Also from a venture perspective, consistent with NRBV, greater demand for human capital investments needed to further develop environmental capabilities may also in turn increase the demand for capital. Accordingly, our first hypothesis posits that environmental orientation increases the funding under the RBV’s and NRBV’s entrepreneurial extensions.
Role of Environmental Orientation in Financial Resource Allocation
Securing financial resources in the campaign stage is only the first hurdle in an entrepreneurial venture’s pursuit of survival and growth. Once the financial resources are acquired, the entrepreneurial team must decide in the post-campaign stage on the allocation and management of the resources across areas such as human capital, physical capital, or intangibles such as R&D and marketing. RBV and NRBV have typically emphasized the strategic value of resources and capabilities but paid less attention to how entrepreneurs’ orientations shape resource allocation (Deng et al., 2020; Zahra, 2021). In this study, we theorize that ventures’ environmental orientations impact financial resource allocation decisions through increased demand for human capital and reduced frictions in labor supply.
We argue that environmental orientation affects employee growth through two complementary reinforcing channels. First, on the demand-side NRBV highlights the greater need for human capital investments to develop capabilities (Hart, 1995; Hart & Dowell, 2011). If EOVs require more or higher-skilled labor, this should be reflected in their resource allocation decisions. In evidence for discrepancies between EOVs and NEOVs, Consoli et al. (2016) put forward that environmentally oriented firms allocate a greater proportion of human capital into their production process. However, we also know that industries have heterogenous production functions, where labor and capital inputs are different, irrespective of the firm being an EOV or NEOV. To better identify the demand for human capital relative to physical capital, we need to compare EOVs and NEOVs within the same industry. If EOVs hire more after the inclusion of industry and physical capital controls, it would point toward either a greater demand or supply of labor for EOVs relative to NEOVs.
Second, on the supply-side, environmental orientation may enlarge the applicant pool and improve access to talent. Labor market frictions make talent acquisition a key constraint for new ventures (Rynes & Barber, 1990). Conveying environmental orientation in communications can mitigate this constraint by enlarging the pool of applicants. Because individuals with pro-environmental preferences are more inclined to match with employers holding similar values (Greening & Turban, 1997, 2000). Thus, environmental orientation may translate into greater employee growth through increased labor supply.
Another important aspect is the amount raised in the ECF campaign, as we would expect firms that raise a greater amount in the campaign to hire more irrespective of environmental orientation. Conditional on EOVs obtaining a greater amount of funding, it is expected that EOVs will create more jobs. Hence, to better understand the allocation decision, we need to account for the financial resources raised in the campaign. By controlling for the amount raised in the campaign and proxies for the production function, we can better identify the impact of environmental orientation on employment, that is, to see if the demand and supply effects from the ventures’ environmental orientation predict a greater allocation to human capital.
The next hypothesis evaluates whether human capital allocations stem from demand-side considerations. From a demand-side perspective, consistent with NRBV, the allocation should be dependent on the greater need for human capital. Entrepreneurs disclose their environmental orientation and their prospective use of funds already in the campaign stage prior to knowing the success of the offering. As intent is formulated prior to knowing the campaign outcome, it is potentially less subject to endogeneity and distinct from realized job creation that is more likely to be endogenous to funding success. To evaluate whether hiring by EOVs is demand driven, we study whether EOVs are more likely to show an intent to allocate resources toward human capital in the prospectuses.
Next, we move from the intent in the campaign stage to the post-campaign stage hiring outcomes to verify whether environmental orientation can convey signals to attract talent in TLMs. In a world absent of labor market frictions, venture location and industry should not matter for employee growth. However, Manning and Petrongolo (2017) reported that labor markets are local, with large regional differences in labor supply coupled with an imperfect cross-region labor mobility. Furthermore, rapid technological shifts have created a mismatch between labor demand and supply at the industry level (Thurik, 2003). This creates heterogeneous supply and competition for human capital across regions and industries. In tighter labor markets, ECF-financed firms may face competition for talent from large incumbent firms and venture capital backed companies which can make hiring difficult. However, even if the competition for labor is tough in TLMs, the environmental signal may help to increase the supply of talent. Hence, we argue that EOVs find it easier to attract talent even in tight regional and sectoral labor markets characterized by low unemployment and high competition for human capital.
Figure 1 summarizes the theoretical framework. We conceptualize environmental orientation as an early-stage organizational capability that affects campaign-stage fundraising and post-campaign employee growth. First, environmental orientation may increase the amount of capital raised in the campaign (H1). Second, conditional on funding EOVs may exhibit higher employee growth (H2). We examine two complementary mechanisms for this relationship: a demand-side mechanism based on the need to develop environmental capabilities (H3a), and a supply-side mechanism based on the signaling value of environmental orientation in labor markets (H3b).
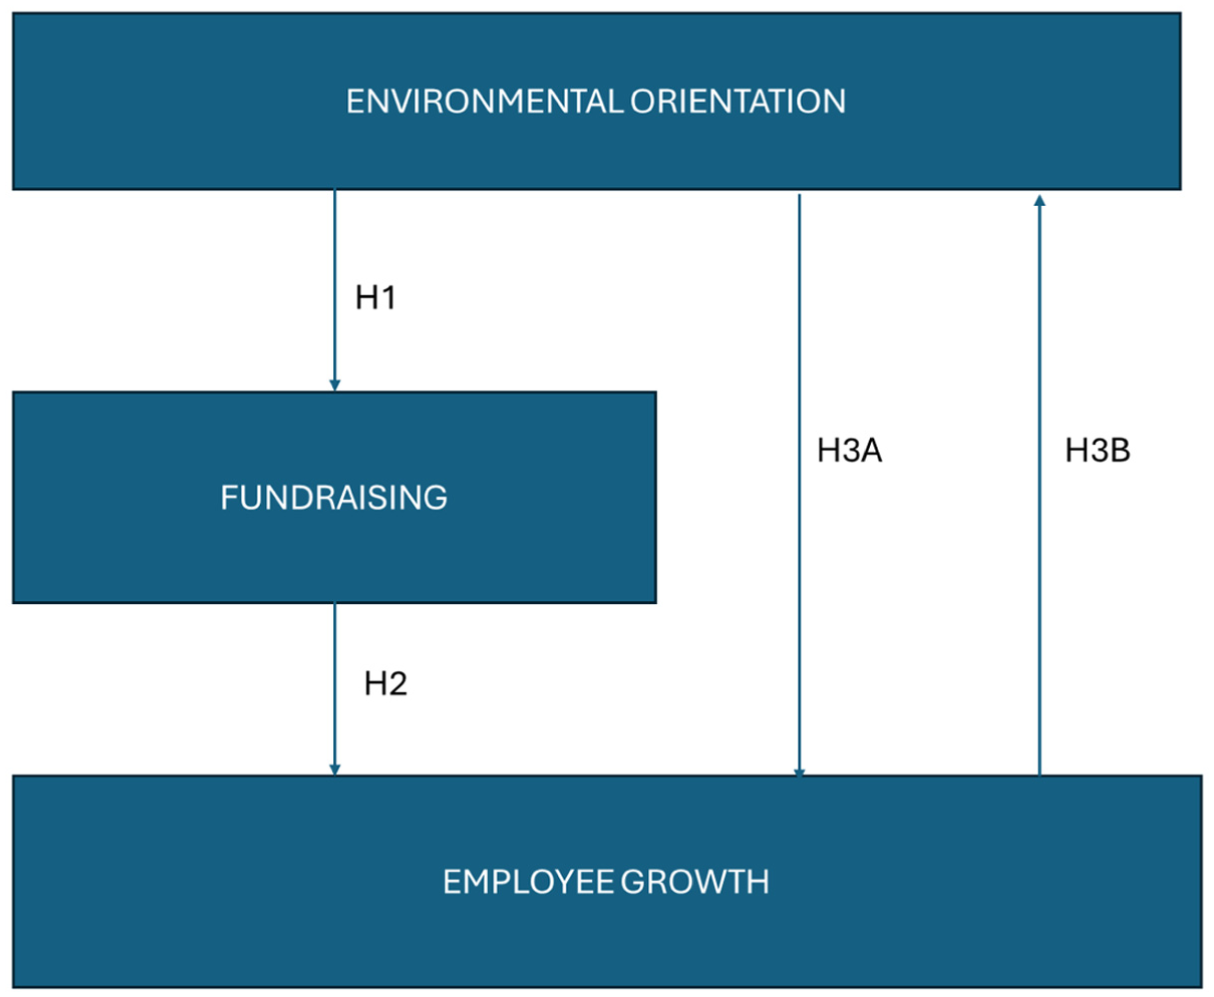
Theoretical link between the hypotheses.
Data
We use data on successful ECF campaigns from January 2019 to December 2022 obtained from Beauhurst, a UK-based data provider of private companies. Beauhurst provides firm-level ECF data from two platforms: Crowdcube and Seedrs. We focus on the UK ECF market because (a) the United Kingdom is the largest market for ECF, in which findings can be extended to other markets as well (Rossi et al., 2021); (b) only the UK sample offers high-quality firm-level employment data rather than on the county-level; (c) due to data availability, a vast majority of the crowdfunding literature base their studies on UK data (see Coakley et al., 2022b; Cumming et al., 2021; Ralcheva & Roosenboom, 2020; Signori & Vismara, 2018; Vismara, 2018; Vismara & Wirtz, 2025; Walthoff-Borm et al., 2018b); and (d) Seedrs and Crowdcube combined coverage of 90% of the offerings in the United Kingdom according to the UK Competition and Markets Authority 2021, 1 removing concerns about sustainable ventures self-selecting into sustainability-oriented platforms. From the database, we collect total amount raised, industry classification, geographic location, number of competing offers, number of employees, and firm characteristics. We supplement it with information on the number of founders, accounting data and firm establishment date from the UK Companies House. We further use labor market data from the Office for National Statistics on unemployment numbers and job advertisements. After the initial filtering, we end up with a total of 659 successful offerings.
We use Employee growth as our main outcome variable to examine the effect of environmental orientation on net job creation. We calculate Employee growth as the net percentage change of total employees from time t to time t + 1 (as in Borisov et al., 2021; Paglia & Harjoto, 2014), where t is the first report after the campaign end date. The reason that Employee growth is measured from the first report following the campaign to t + 1 is the lengthy process until hiring can be done. First, the campaign lasts 30 days and if it is overfunded, longer. Second, following the campaign, it may take a few weeks for the venture to receive the funds. Third, during the start of the hiring process, UK companies have to advertise the job position. Fourth, after that interviews take place and if the candidate says yes, the minimum notice period is 3 months. Hence, it will take more than 6 months to observe any effect on hiring. As several firms have zero employees at time t, making the calculation of percentage increase impossible, we include an additional measure (Employee diff) which is measured as the difference in the number of employees between t and t + 1 (in Supplemental Table IA13). We use an additional dependent variable to test H1, ln(Amount), which is the natural logarithm of the amount raised in the campaign.
We define EOVs as ventures whose products/processes explicitly target environmental externalities (e.g. clean energy, circularity, resource efficiency). We use two different EOV classifications to offer more robust results. First, an indicator (EOV) based on the Beauhurst classification of environmental sustainability, constructed from sectoral definitions and analyst reviews. 2 Second, we re-classify ventures following a slight modification of Vismara and Wirtz (2025)’s approach. To create the measure (EOV2), we search for a list of environmental sustainability related keywords in company descriptions and then classify companies as EOVs if their webpages include the keywords (see Supplemental Table IA1). 3 The first measure (EOV) classifies 47 ventures as environmentally sustainable, while the second measure (EOV2) classifies 87. There is a significant overlap between the measures as 33 out of the 47 classified ventures are also EOVs based on the text-based classification. The measures are slightly different; EOV through the Beauhurst classification mainly captures clean tech, which is an important capability in more recent definitions of NRBV (Hart & Dowell, 2011). On the other hand, the wider EOV2 measure also includes several capability-related keywords highlighted in NRBV by Hart (1995) and Hart and Dowell (2011).
We use two measures to evaluate the demand and supply mechanisms (H3a and H3b). First, we read the campaign prospectuses to evaluate whether firms disclose their intention to recruit additional personnel. We create an indicator (Intent to recruit) taking the value of one if firms explicitly state that they will use the potential proceeds to recruit people, and zero otherwise (see Supplemental Table IA2). However, ventures’ disclosure of intent to recruit in the campaign stage is not binding in the post-campaign and thus may not represent true demand for labor. It could instead represent a signaling mechanism to attract funds rather than true intention to hire. Therefore, we evaluate if the measure is correlated with post-campaign hiring (Supplemental Table IA3) and find that it loads positively on all three measures of employee growth used in the paper, albeit only statistically significant for two out of three measures. 4 Second, we proxy labor market tightness as the balance between demand for workers and available labor supply (Pissarides, 2000). We create a principal component (TLMs) combining unemployment rates at the industry and regional levels to capture supply of labor, and annual job ads scaled by employment at the industry- and city-level to capture labor market competition. We use the first principal component from the four measures to end up with a single composite measure capturing labor market tightness. The principal component analysis (PCA) explains 36.7% of the variance and loads positively on job ads and negatively on unemployment (see Supplemental Table IA4). Higher values of the PCA represent tighter labor markets.
We include several covariates in the regression models to control for additional factors impacting employee growth. First, we include Diversification, measured as the total number of 4-digit standard industry classification (SIC) segments the firm operates in. Second, we include Team size, which is the number of founders. For example, Monaco et al. (2024) reported that ECF campaigns by larger teams raise more capital. Third, we include Firm age, which is the natural logarithm of the number of days since incorporation. Fourth, we include Firm size, measured as the number of employees in the most recent financial statement prior to the campaign. Fifth, we include Leverage measured as total liabilities scaled by total assets. Sixth, we include Cash measured as the firm’s cash holdings scaled by total assets. Seventh, we include Tangibility measured as tangible fixed assets scaled by total assets to proxy for a venture’s relative use of fixed assets in its production. We winsorize all continuous variables at the 1st and 99th percentiles, to partly mitigate the impact of large outliers in the data.
We use two instrumental variables in our analysis. First, we use the number of successful campaigns during the same quarter as the campaign is launched to instrument for ln(Amount). This is to capture “hot” ECF issue quarters when investors are willing to allocate more capital to ECF campaigns and ventures set higher capital raising targets (Cerpentier et al., 2022). Second, we use the number of competing offerings (both successful and failed) to capture the success probability of the ECF campaign (Vismara, 2018). The discrepancies in instruments stem from the fact that the number of successful campaigns should be more likely to capture ln(Amount), while the total number of campaigns is more likely to capture the likelihood to succeed due to limited attention in ECF markets.
Descriptive Statistics
Figure 2 shows employee growth over time relative to the ECF campaign year t. We have indexed the graph at 100 at t−1 to facilitate comparison between EOVs and NEOVs. We can observe that 2 years after the campaign EOVs have a net growth in headcount of roughly 5× and 3× from t−1 by using the Beauhurst and text-based classifications. NEOVs observe a more modest growth for both measures (2× and 2.25×). Worth noting is that the employee growth between EOVs and NEOVs is similar between t−1 and t, especially by using the text-based measure. We observe similar differences using our main employee growth measures from t to t+1.
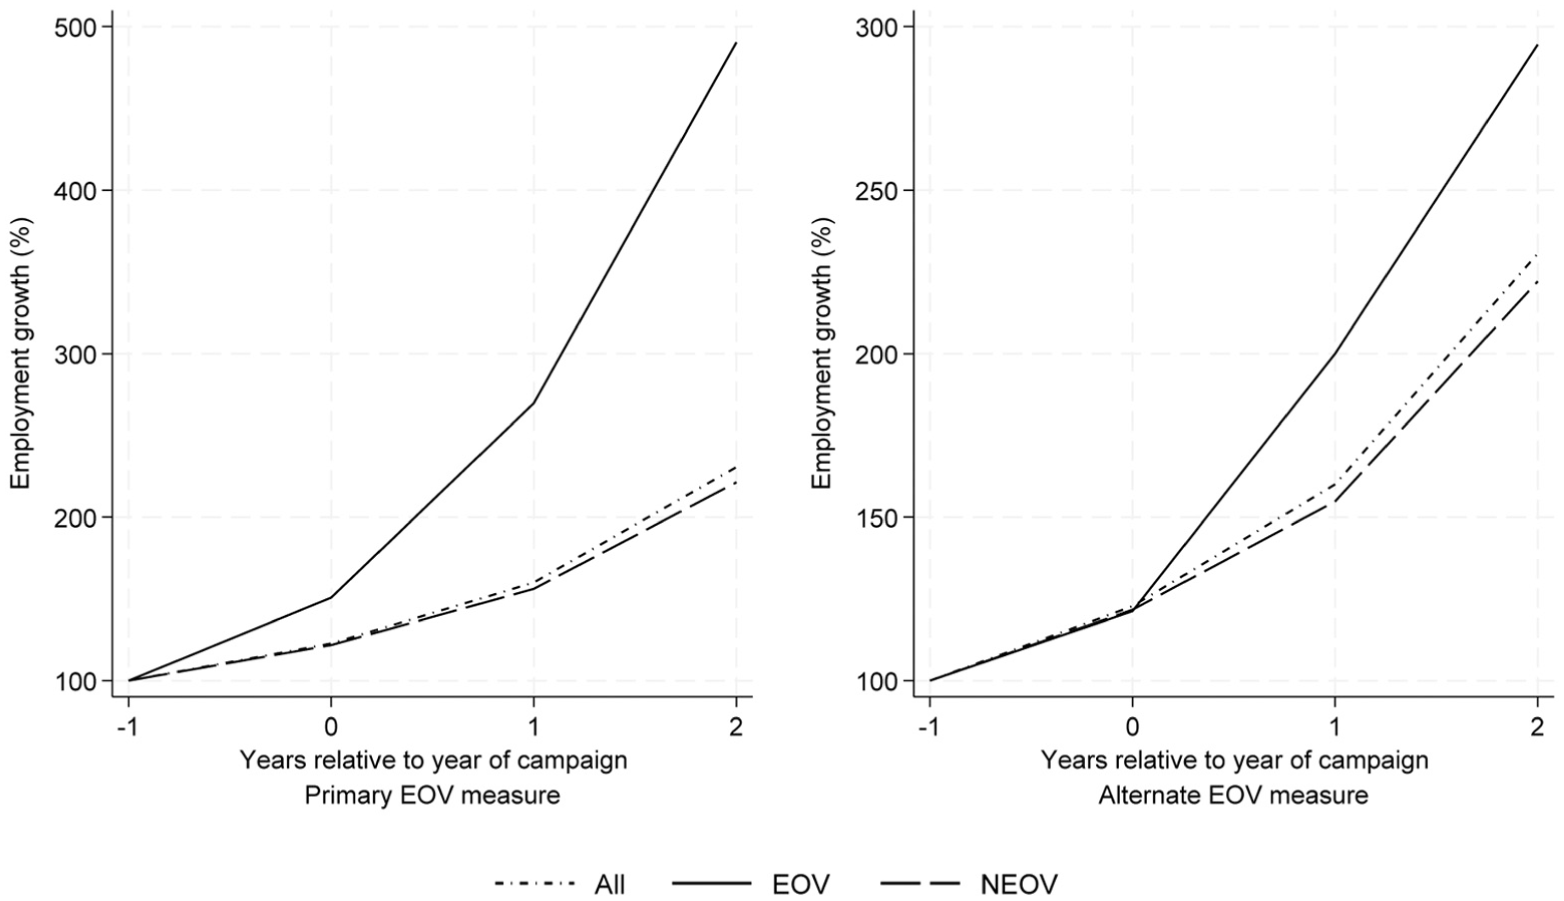
Employee growth over time.
The descriptive statistics in Panel A of Table 1 show the mean, standard deviation, minimum, and maximum of the variables used in the study. Our dataset covers 659 successful ECF campaigns. The average employee growth conditional on obtaining financing is 40.56% or 2.26 employees. We are able to identify 47 sustainable ventures or 7.1% of the sample using the Beauhurst classification and 87% or 13.2% using our text-based classification. This is slightly lower than the numbers found in Vismara (2019) and Vismara and Wirtz (2025) that report an environmental sustainability fraction of around 20%. The higher numbers are potentially due to their different classification methods; we discuss the implications in the limitations chapter. On average, our sample firms raise £740,000 in the campaign. This makes our campaign amounts larger than those in comparable studies on US data where Cumming et al. (2025) found an average campaign size of $399,000. In UK samples, Vismara (2019) reported an average amount of £251,030, and Vismara and Wirtz (2025) reported £305,000. Those studies deploy data from unsuccessful offerings as well, that may yield lower amount values. The average number of employees prior to the successful ECF campaign amounts to 8.94. The sample ventures have on average 1.74 times total assets in liabilities, this is due to the large fraction of firms with negative equity. The firms hold on average 28.80% of their assets in cash, and 21.77% in fixed assets.
Summary Statistics.
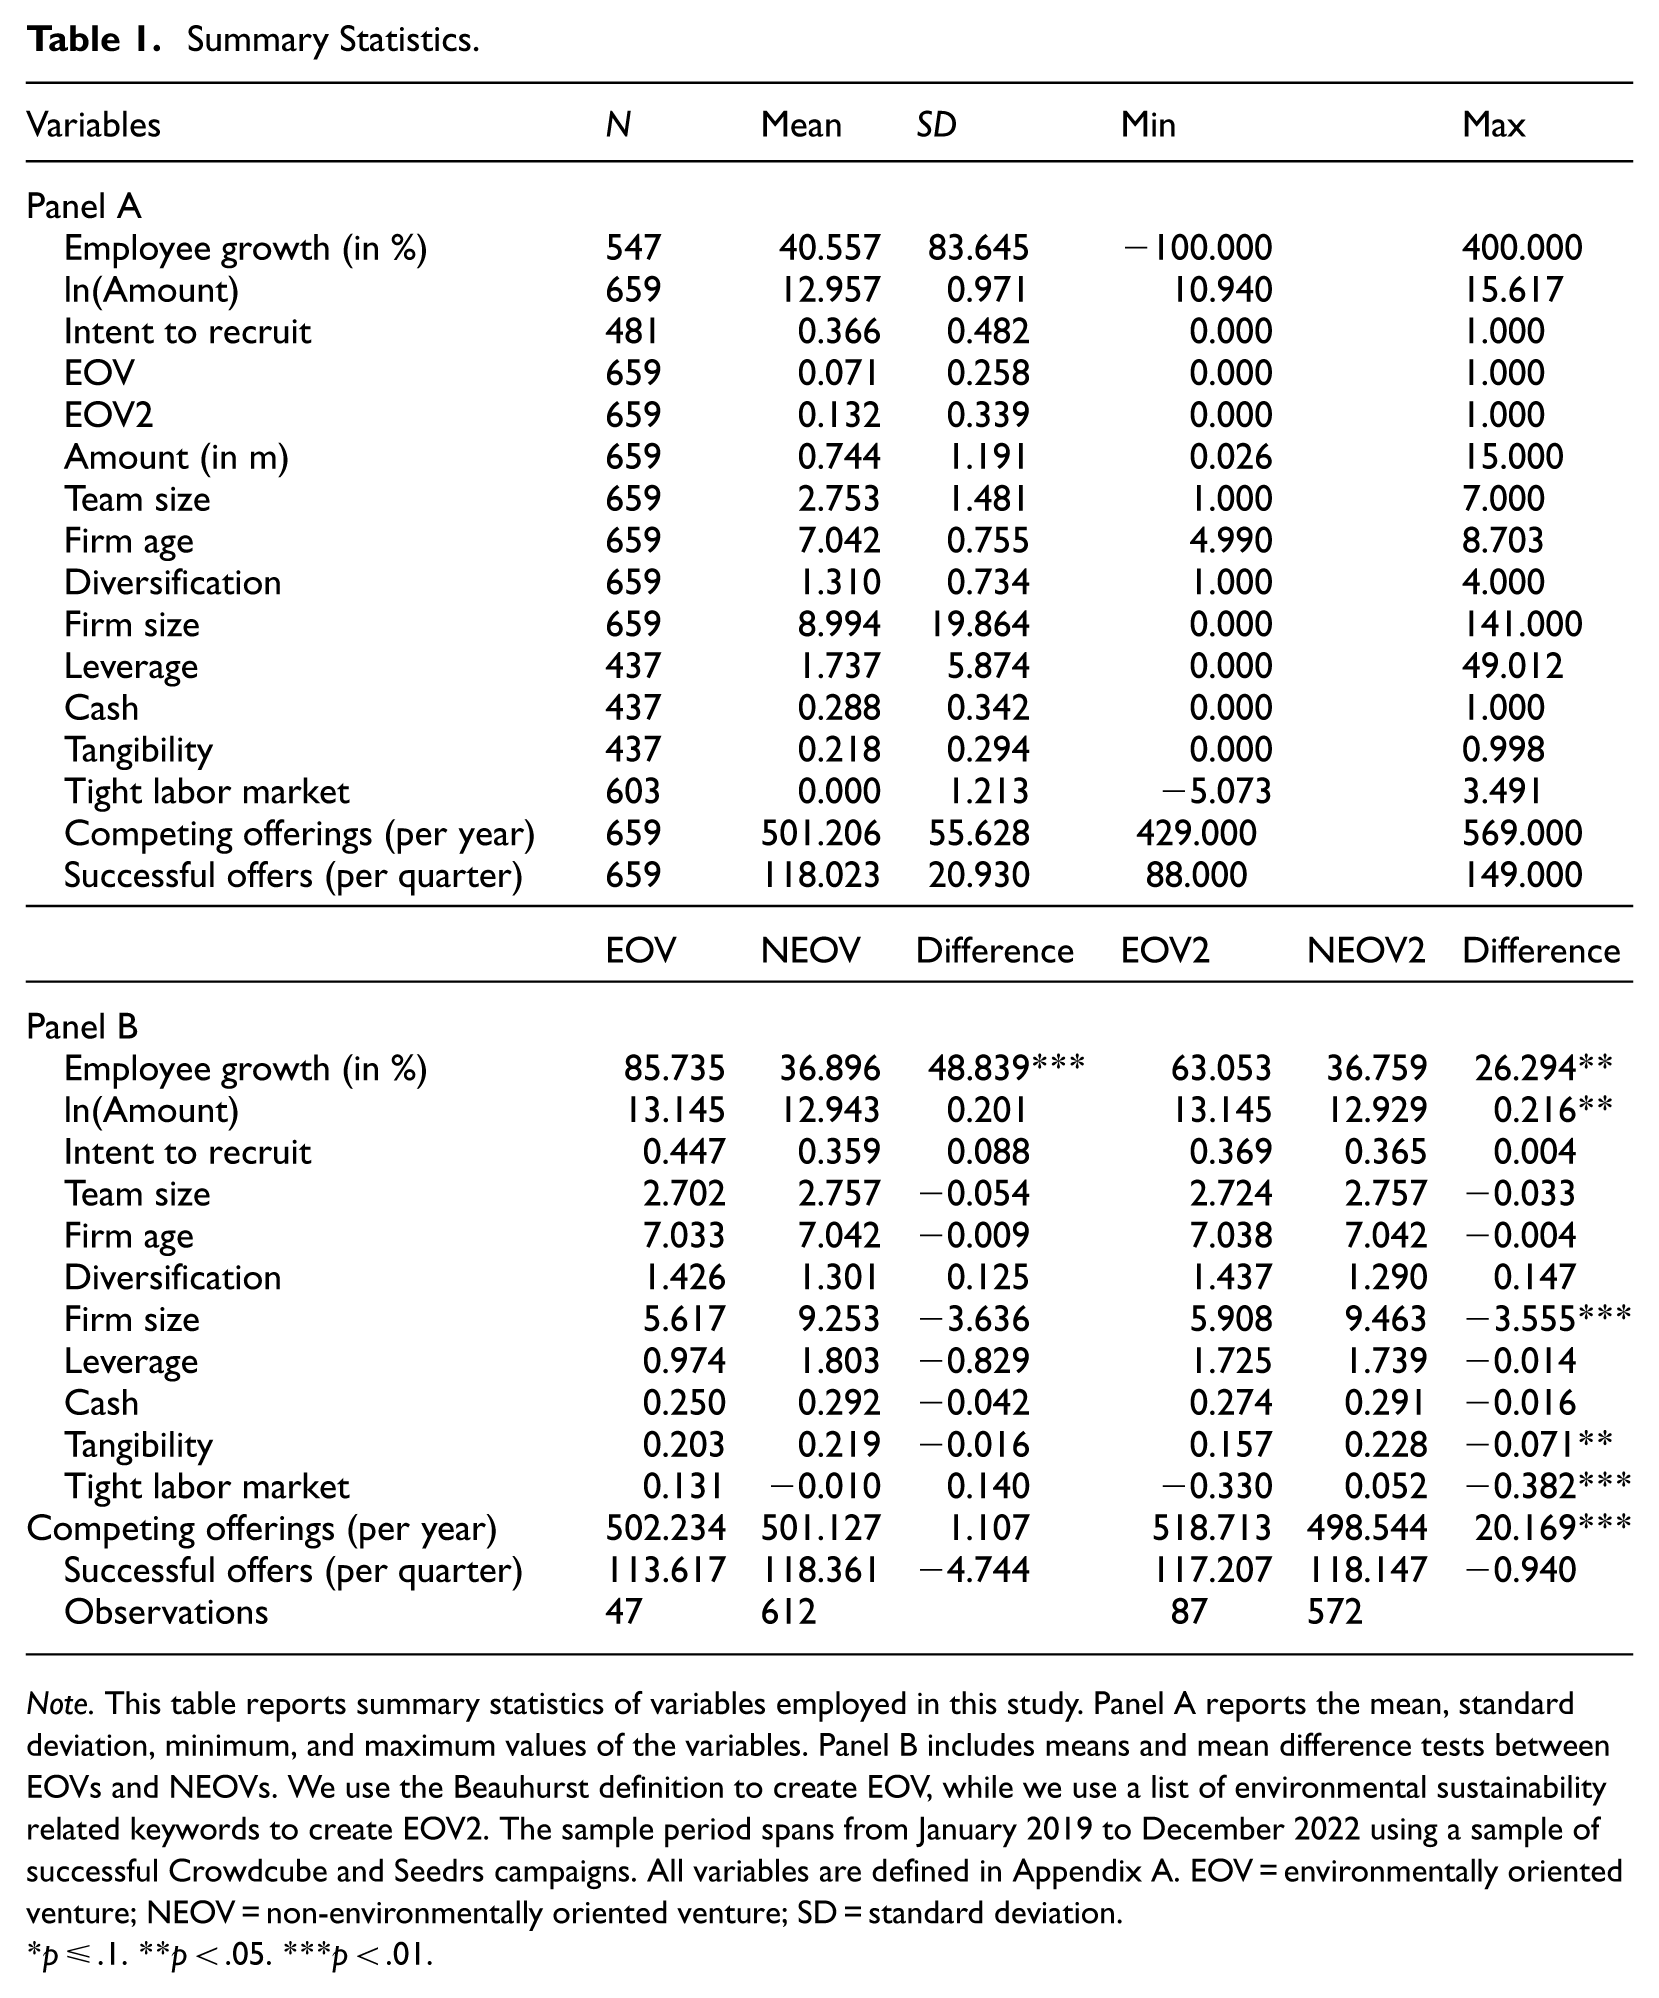
Note. This table reports summary statistics of variables employed in this study. Panel A reports the mean, standard deviation, minimum, and maximum values of the variables. Panel B includes means and mean difference tests between EOVs and NEOVs. We use the Beauhurst definition to create EOV, while we use a list of environmental sustainability related keywords to create EOV2. The sample period spans from January 2019 to December 2022 using a sample of successful Crowdcube and Seedrs campaigns. All variables are defined in Appendix A. EOV = environmentally oriented venture; NEOV = non-environmentally oriented venture; SD = standard deviation.
p ≤ .1. **p < .05. ***p < .01.
In Panel B of Table 1, we compare the means of EOVs to those of NEOVs. Our univariate findings on ln(Amount) partly lend support to Hypothesis 1. Based on our second classification (EOV2), EOVs raise significantly more capital relative to NEOVs (p < .05). However, this is not surprising as prior research reports similar evidence in other samples (see, Mansouri & Momtaz, 2022). New to the literature, we test Hypothesis 2, analyzing whether EOVs create more jobs. In support of Hypothesis 2, we report that the average employee growth among EOVs is 85.74% and NEOVs is 36.90% (p < .01); we report similar findings using the text-based classification. Even though EOVs are smaller relative to NEOVs at the capital raising stage, they manage to create more jobs in absolute terms (3.9 vs. 2.1). The EOVs and NEOVs are similar in terms of diversification, team size, firm age, liabilities, and cash holdings, but NEOVs have a greater proportion of fixed assets based on the second classification. Supplemental Table IA5 further shows pairwise correlations between variables used in the regressions. Interestingly, we show a significant pairwise positive correlation between the EOV measures and employee growth (p < .05).
Results
EOVs and Capital Raising Outcomes
Our first regression aims to verify Hypothesis 1, that EOVs are able to raise more funding by displaying their environmental orientation to prospective investors. To test Hypothesis 1, we estimate the following regression:

If EOVs raise more capital conditional on firm characteristics, we expect
Column (1) of Table 2 shows estimates of model (1) including all covariates except financials. In support of Hypothesis 1, the coefficient estimate of 0.20 indicates that EOVs raise roughly 22.20% more capital in their campaigns relative to NEOVs (p = .02). 6 After including accounting variables, the number of observations drops from 656 to 433 in Column (2) due to data availability. However, the results remain similar to those in Column (1) (β = .25; p = .03). Next, we introduce our second environmental orientation measure (EOV2) in Columns (3) and (4), which classifies a greater number of firms as environmentally oriented. The coefficient estimates increase relative to those using the Beauhurst EOV measure to 0.25 (p = .01) and 0.30 (p = .01) in Columns (3) and (4), respectively. The economic magnitude remains large as EOVs raise 28.35% to 34.70% more capital in their ECF campaign. Hence, our results show consistently that EOVs raise more financial resources in their campaigns relative to NEOVs. We further estimate models using a different set of fixed effects in Supplemental Table IA7 to ensure that our findings are not driven by modeling choices. Among the control variables, Team size, Firm age, Firm size, and Cash are positively related to ln(Amount), while Leverage is negatively related.
Environmental Orientation and Amount Raised.
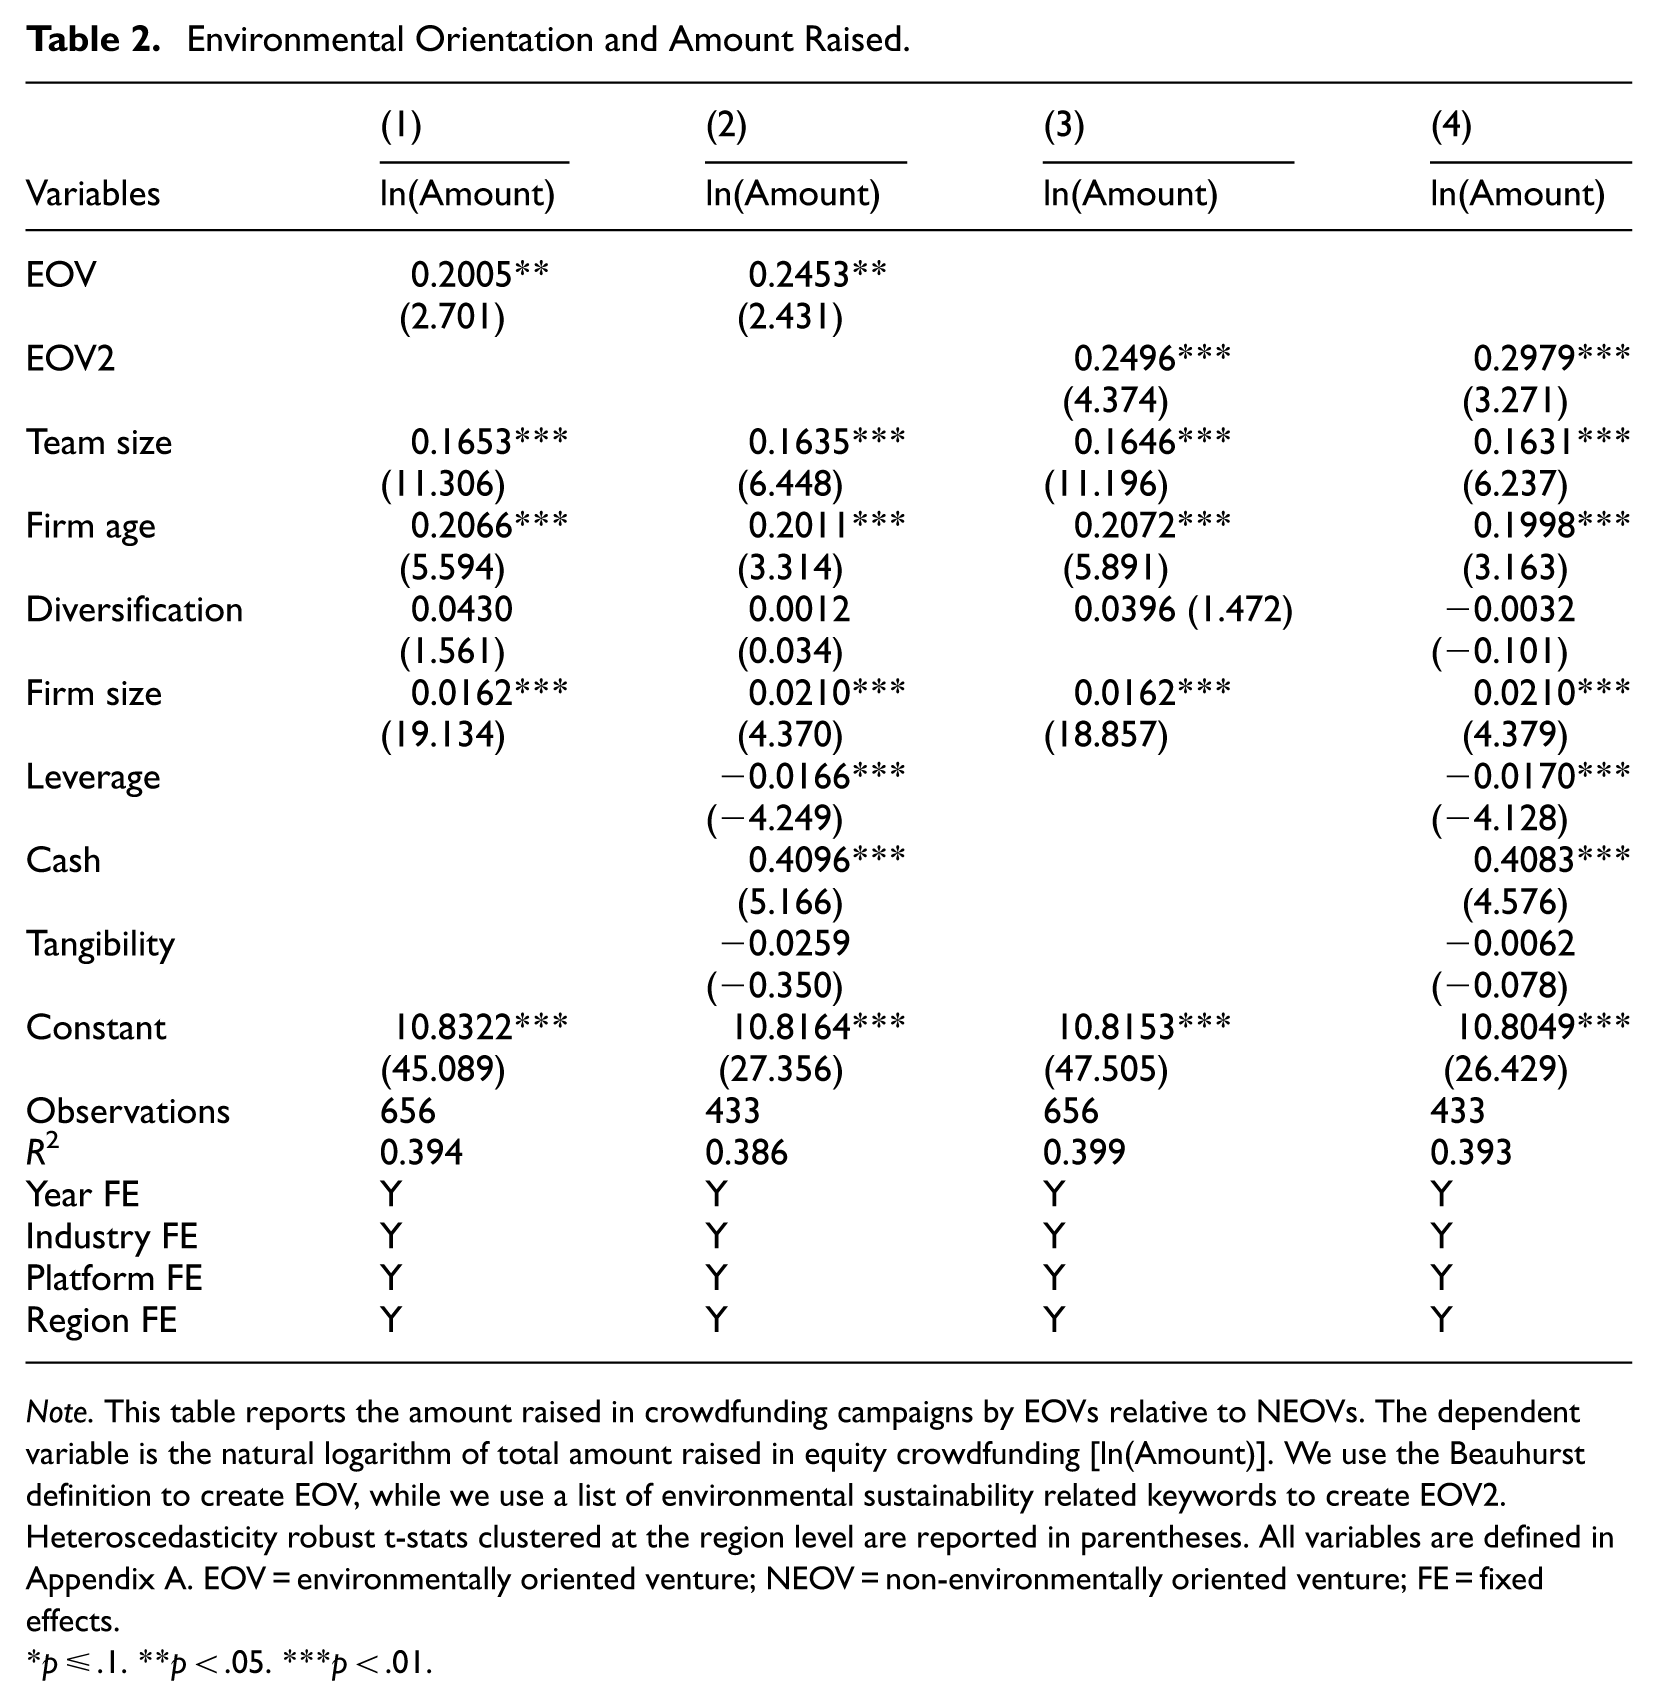
Note. This table reports the amount raised in crowdfunding campaigns by EOVs relative to NEOVs. The dependent variable is the natural logarithm of total amount raised in equity crowdfunding [ln(Amount)]. We use the Beauhurst definition to create EOV, while we use a list of environmental sustainability related keywords to create EOV2. Heteroscedasticity robust t-stats clustered at the region level are reported in parentheses. All variables are defined in Appendix A. EOV = environmentally oriented venture; NEOV = non-environmentally oriented venture; FE = fixed effects.
p ≤ .1. **p < .05. ***p < .01.
Main Results: EOVs and Job Creation
We evaluate the main H2 by testing whether EOVs experience a greater post-campaign employee growth in excess of what is expected from the financial resources raised. To test H2, we estimate the following regression:

If EOVs create more jobs conditional on funding and firm characteristics, we expect
Column (1) of Table 3 shows that EOVs are linked to higher employee growth relative to NEOVs (β = 47.78; p = .04). The economic effect is large, EOVs create 47.78% more jobs the year after receiving ECF capital injections. Column (2) includes accounting controls making the sample size decrease from 545 to 357, due to data availability. The effect size increases following the inclusion of accounting variables in Column (2) (β = 61.95; p = .02); EOVs create 61.95% more jobs in the post-campaign stage. Next, we estimate similar models by including the text-based measure of EOV (EOV2). Also, EOV2 remains a significant predictor for post-campaign employee growth in Column (3) (β = 18.06; p = .08) and Column (4) (β = 28.58; p = .04). However, the economic magnitude reduces to 18.06% and 28.58% for Columns (3) and (4), respectively. Among the control variables, we report that Employee growth is negatively related to Firm age. Leverage and the level of cash holdings are positively related to Employee growth. ln(Amount) is statistically significant in three out of four specifications suggesting that both the financial resources obtained in the ECF campaign in addition to the EOVs’ supply and demand for labor are important determinants for employee growth. We further estimate the models using different types of fixed effects in Supplemental Table IA8 and find similar results. Hence, the evidence is consistent with Hypothesis 2: EOVs are linked to greater employee growth. By controlling for the amount raised, we show that EOVs hire in excess of what can be expected from the capital injection alone.
Employee Growth.
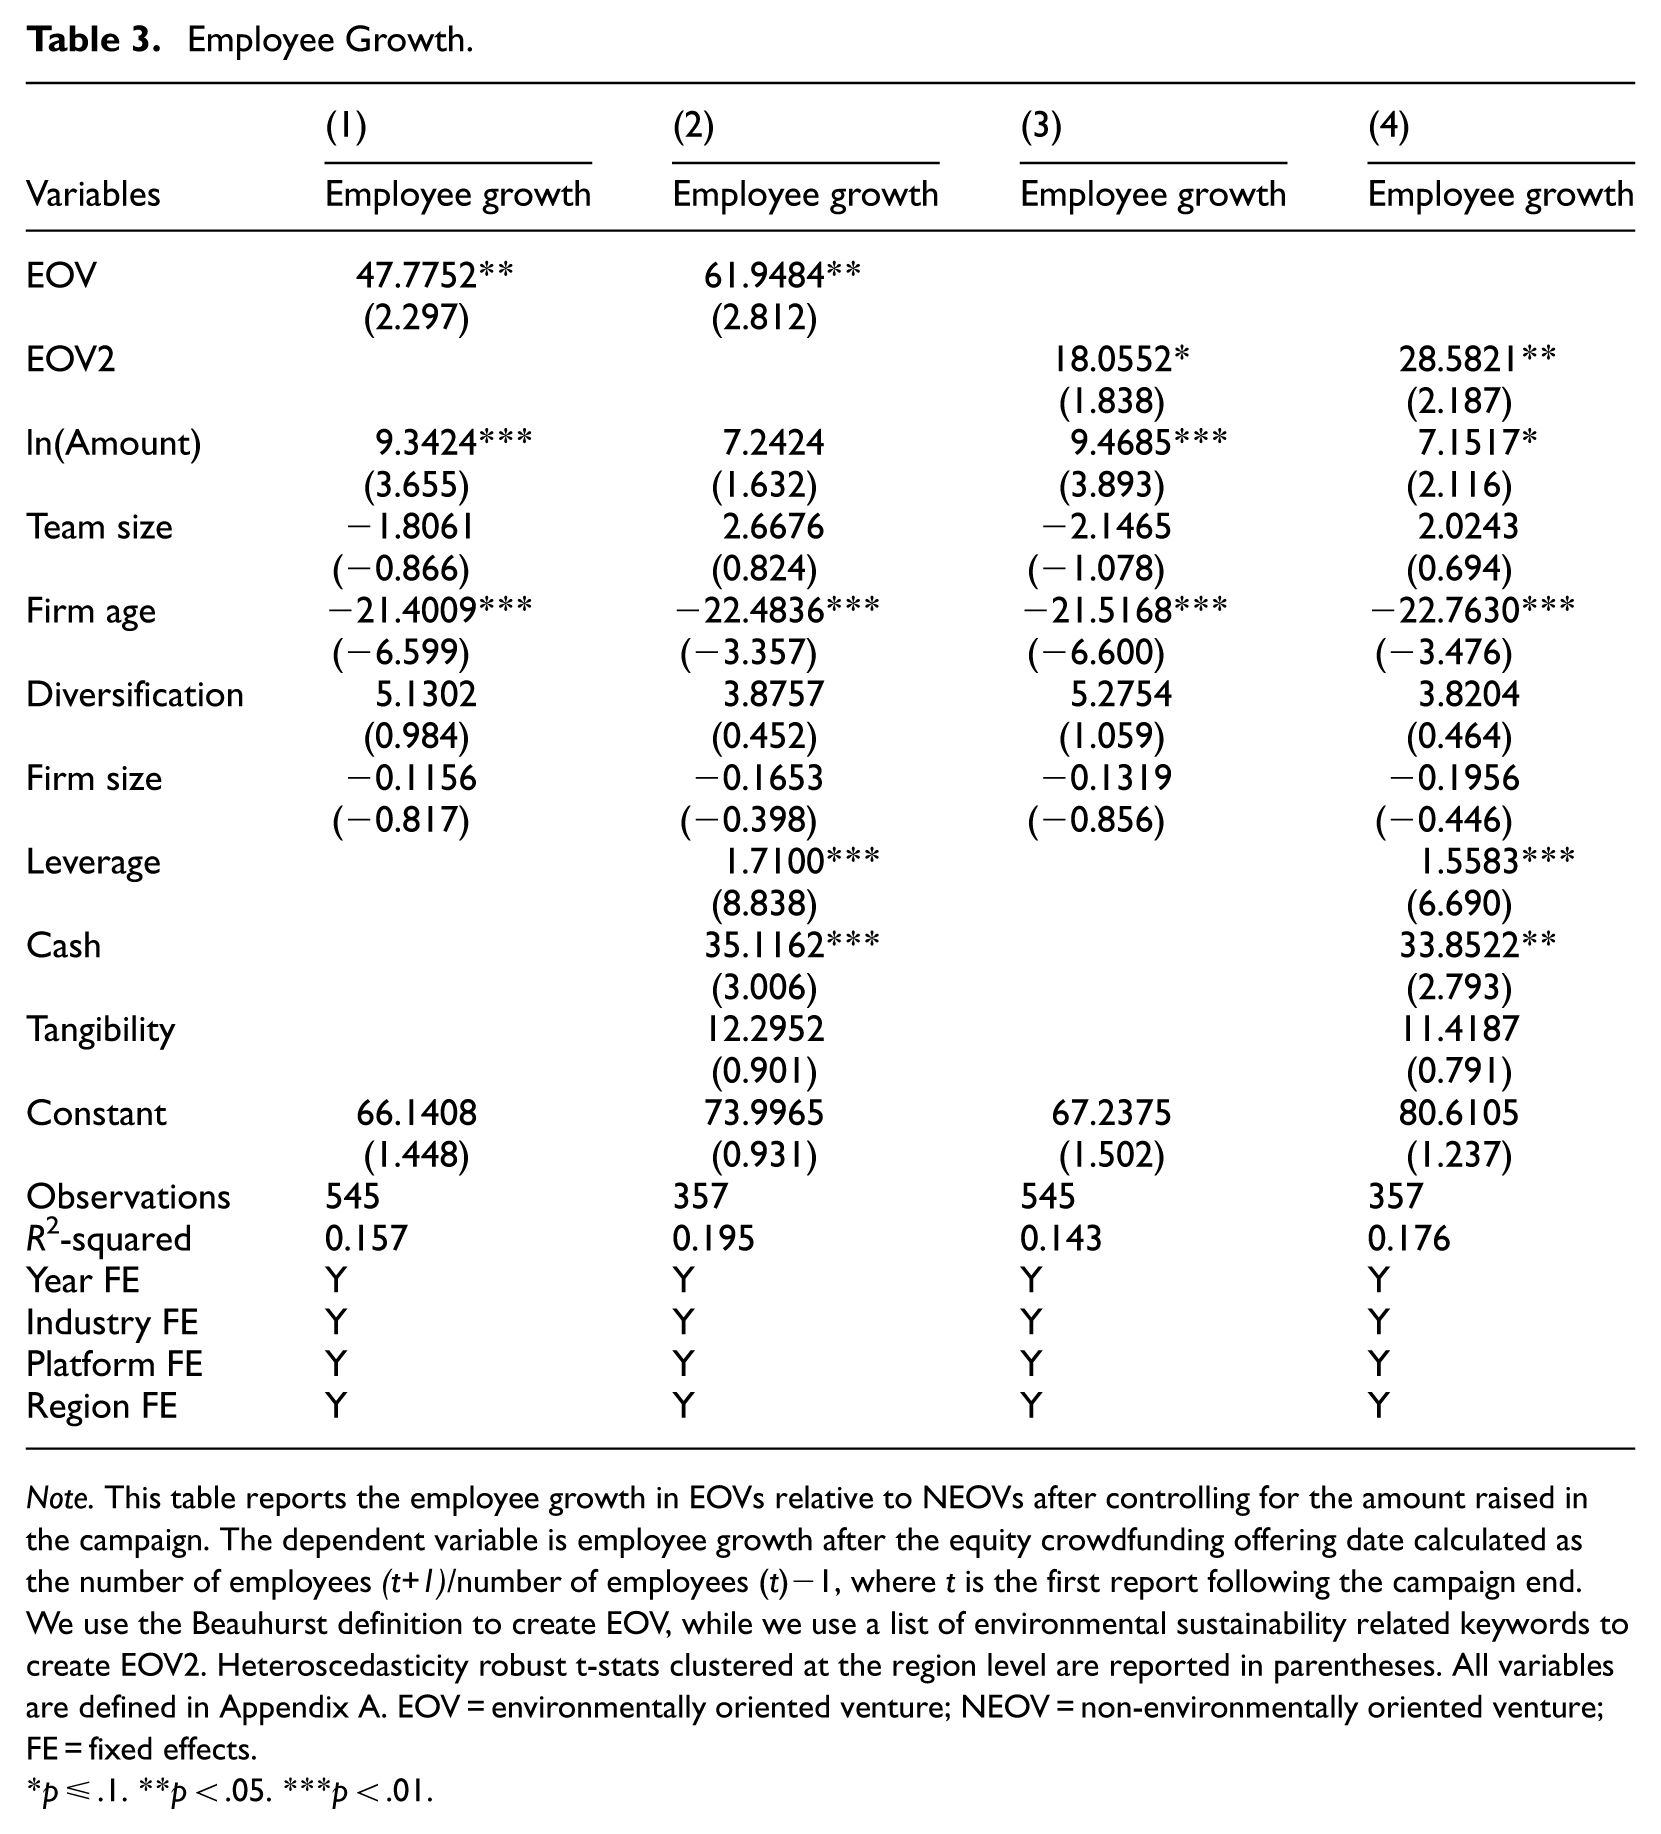
Note. This table reports the employee growth in EOVs relative to NEOVs after controlling for the amount raised in the campaign. The dependent variable is employee growth after the equity crowdfunding offering date calculated as the number of employees (t+1)/number of employees (t)−1, where t is the first report following the campaign end. We use the Beauhurst definition to create EOV, while we use a list of environmental sustainability related keywords to create EOV2. Heteroscedasticity robust t-stats clustered at the region level are reported in parentheses. All variables are defined in Appendix A. EOV = environmentally oriented venture; NEOV = non-environmentally oriented venture; FE = fixed effects.
p ≤ .1. **p < .05. ***p < .01.
In addition, we use two tests to account for potential endogeneity in our base case specifications: the 2SLS and the control function methods. 7 One potential source of endogeneity could stem from simultaneity between ln(Amount) and Employee growth. This could derive from firms with greater hiring capacity may also attract more funding, irrespective of environmental orientation. In the first stage, we estimate a similar model as (1) above on ln(Amount), with the inclusion of successful competing offers in the campaign. Our findings suggest that the number of successful offers is positively related to ln(Amount), with F-stats above 10 in all first-stage regressions (see Columns (1) and (4) Table 4). This is consistent with Cerpentier et al. (2022) who argued and showed that successful campaigns raise a greater amount of funding during hot issue markets, that is, during periods of elevated issuance activity. We further argue that it is not likely that the number of successful offers impacts employee growth in the second stage through other channels than the instrumented ln(Amount). Hence, the excluded exogenous first-stage variable likely satisfies both the inclusion and exclusion. For the 2SLS model, we obtain the fitted values from the first stage and include them in the second-stage estimations. Our findings in Columns (2) and (5) of Table 4 show that both EOV measures remain statistically significant predictors after accounting for potential endogeneity between ln(Amount) and Employee growth. This shows that the EOV effect on Employee growth also persists in the second stage after accounting for simultaneity between ln(Amount) and Employee growth.
Two-stage Least Squares and Control Function Estimations.
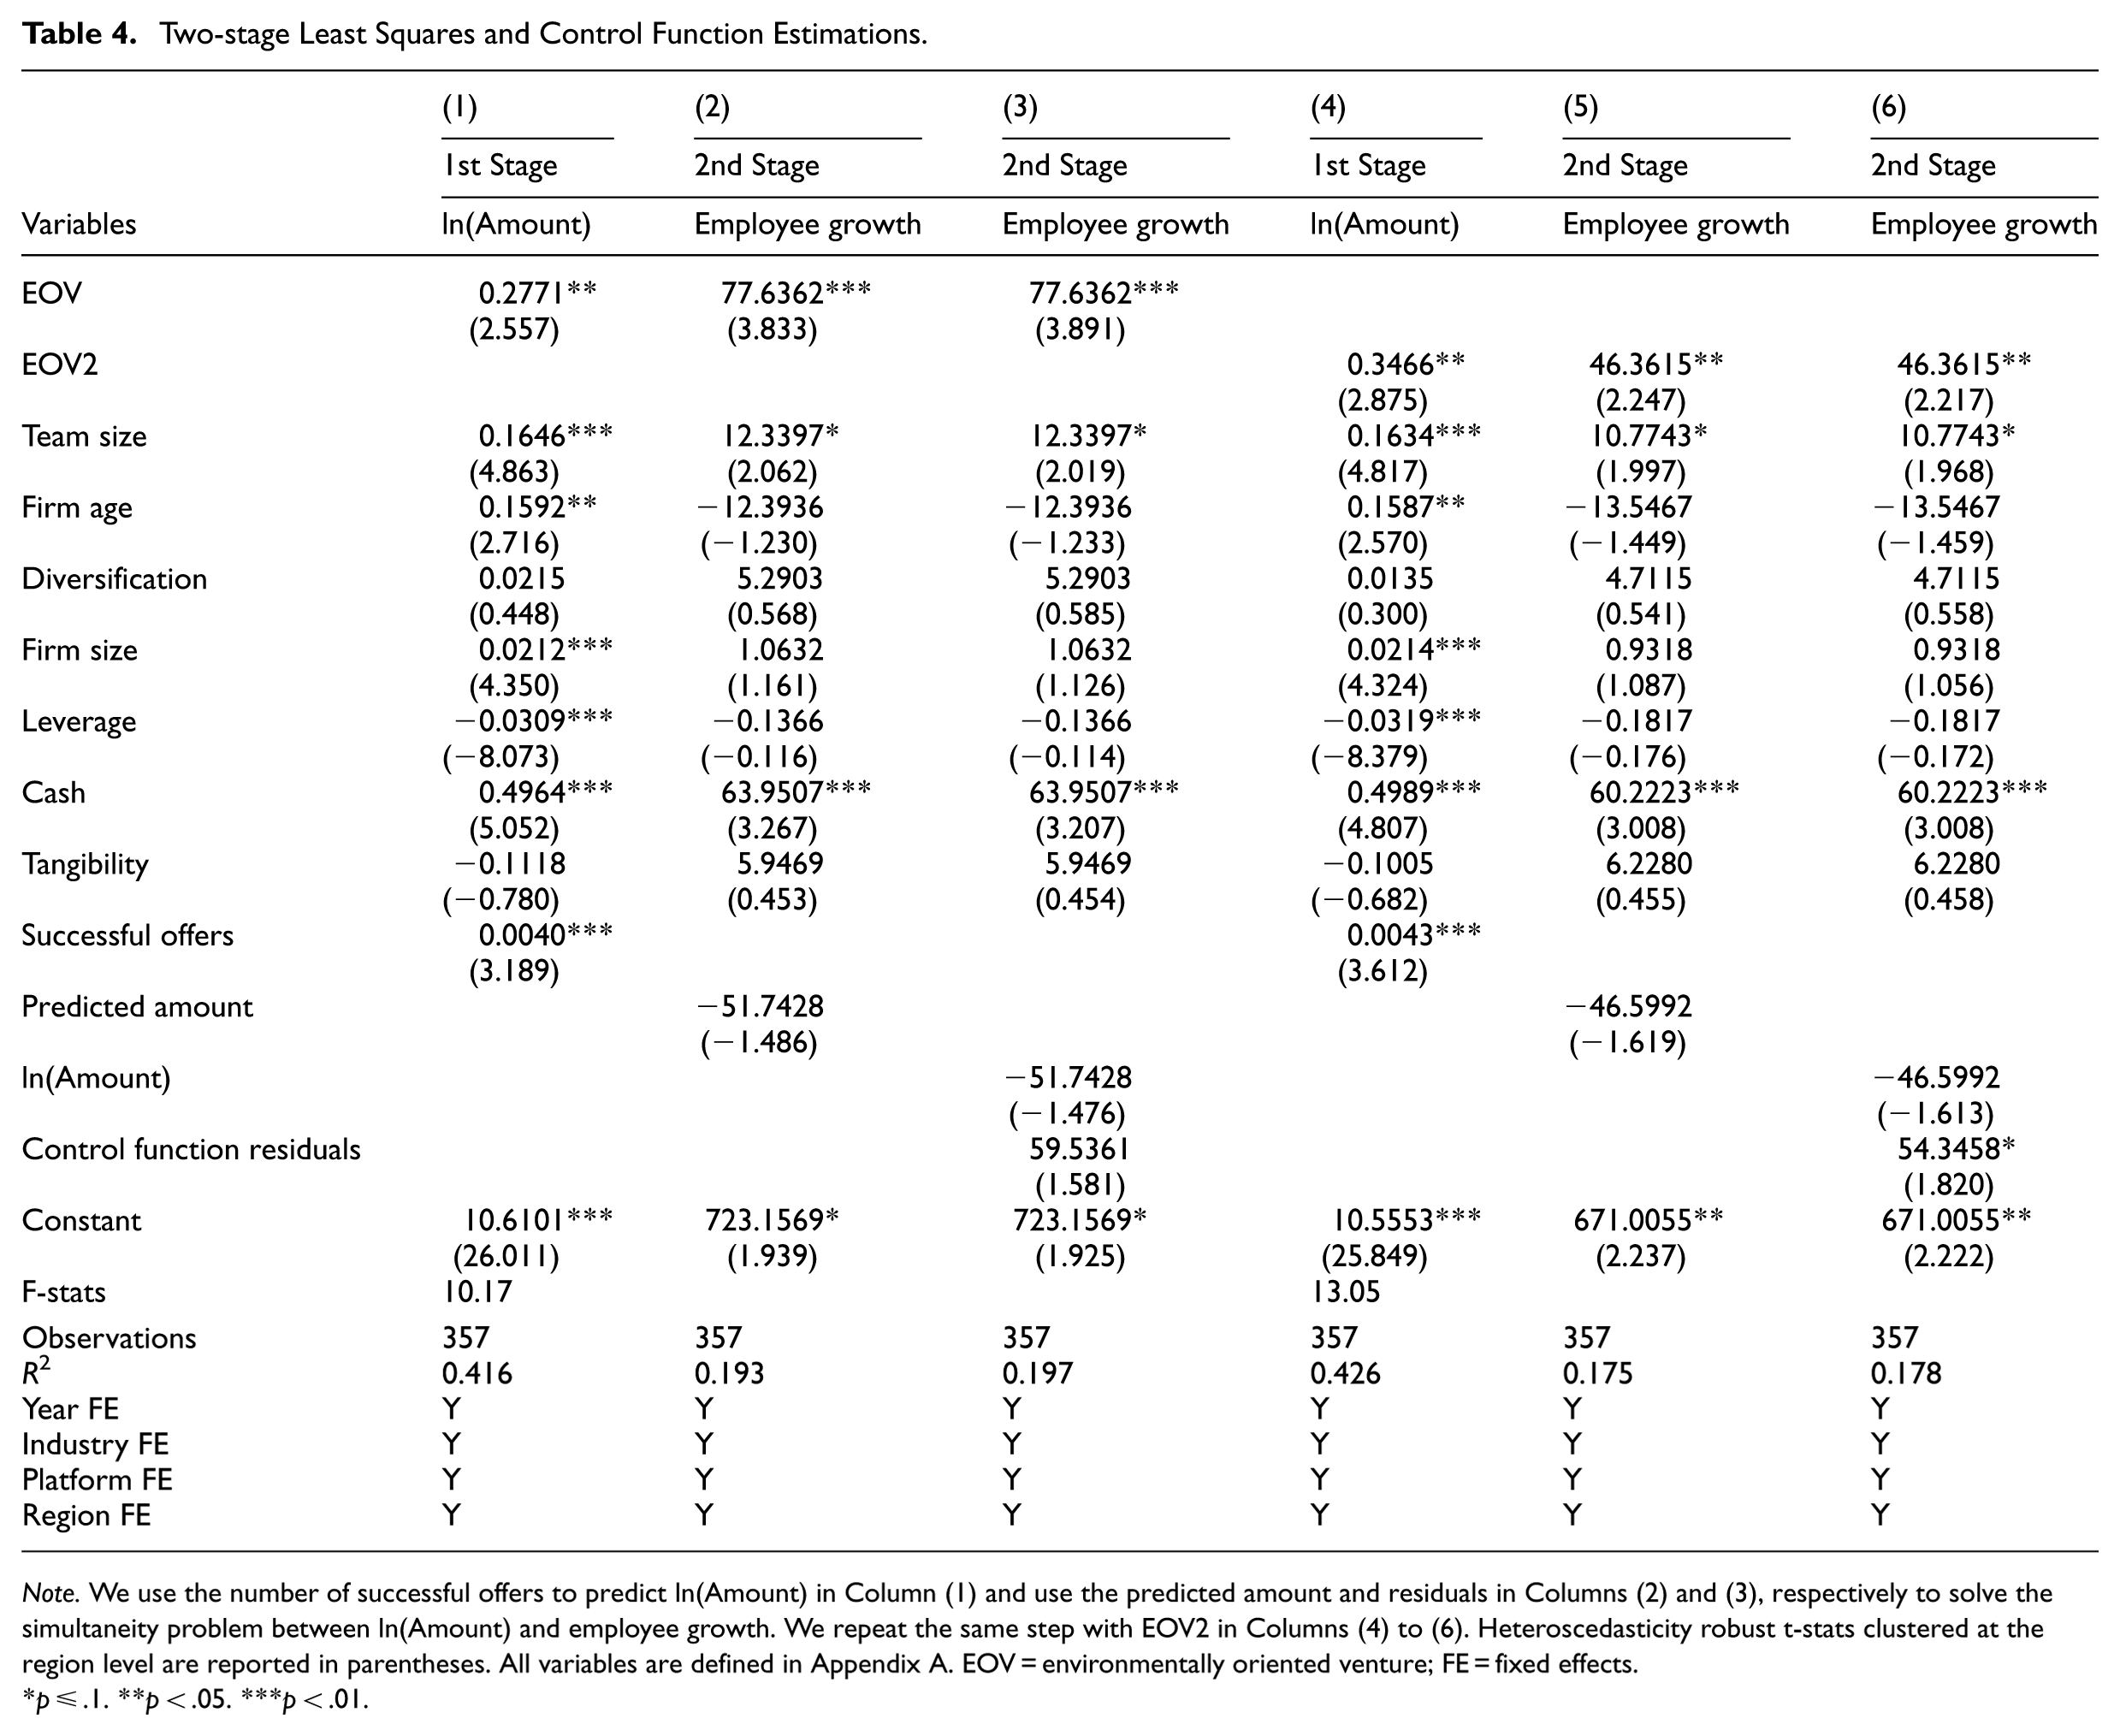
Note. We use the number of successful offers to predict ln(Amount) in Column (1) and use the predicted amount and residuals in Columns (2) and (3), respectively to solve the simultaneity problem between ln(Amount) and employee growth. We repeat the same step with EOV2 in Columns (4) to (6). Heteroscedasticity robust t-stats clustered at the region level are reported in parentheses. All variables are defined in Appendix A. EOV = environmentally oriented venture; FE = fixed effects.
p ≤ .1. **p < .05. ***p < .01.
The control function method involves including the residuals from the first stage in the second-stage regressions; the residuals control for potential endogeneity stemming from simultaneity between ln(Amount) and Employee growth. The control function method yields identical estimates as the 2SLS with linear outcome variables, but with the advantage that it directly tests for potential endogeneity between ln(Amount) and Employee growth. Statistically significant first-stage residuals in the second-stage estimation indicate potential endogeneity problems. Our findings in Columns (3) and (6) of Table 4 suggest ln(Amount) and Employee growth are potentially endogenous in one of the specifications prior to the correction.
In auxiliary tests (Supplemental Table IA9), we further confirm that we observe excess hiring over different levels of ln(Amount) by entropy balancing EOVs and NEOVs based on the amount raised. By conducting this test, we ensure that the effect is consistent all over the capital raising distribution, that is, we observe excess hiring. Our results show that EOV remains a significant predictor of employee growth after balancing the sample. We further conduct sample splits in Columns (3) to (6) in Supplemental Table IA9 to show that the EOV effect on employee growth exists both for small and large capital injections. Our findings support H2.
Supply or Demand Considerations
The next set of tests aims to distinguish between supply- and demand-driven employee growth. From a demand-side perspective, human capital allocation is dependent on the greater structural demand of EOVs face as they develop environmental capabilities. To test for a demand-driven allocation (H3a), we make use of the fact that entrepreneurs disclose their environmental orientation and their prospective use of funds already in the campaign stage prior to knowing the success of the offering. As their intention to recruit is formulated already prior to knowing the campaign outcome, it is likely less subject to endogeneity and distinct from realized job creation that is more likely to be endogenous to funding success. 8 We estimate regression specification (Equation 3) below to test whether EOVs are more likely to show an intent to allocate resources toward human capital in the prospectus.

If EOVs are more likely to show intent to recruit, we expect
Demand- and Supply-Side Considerations.
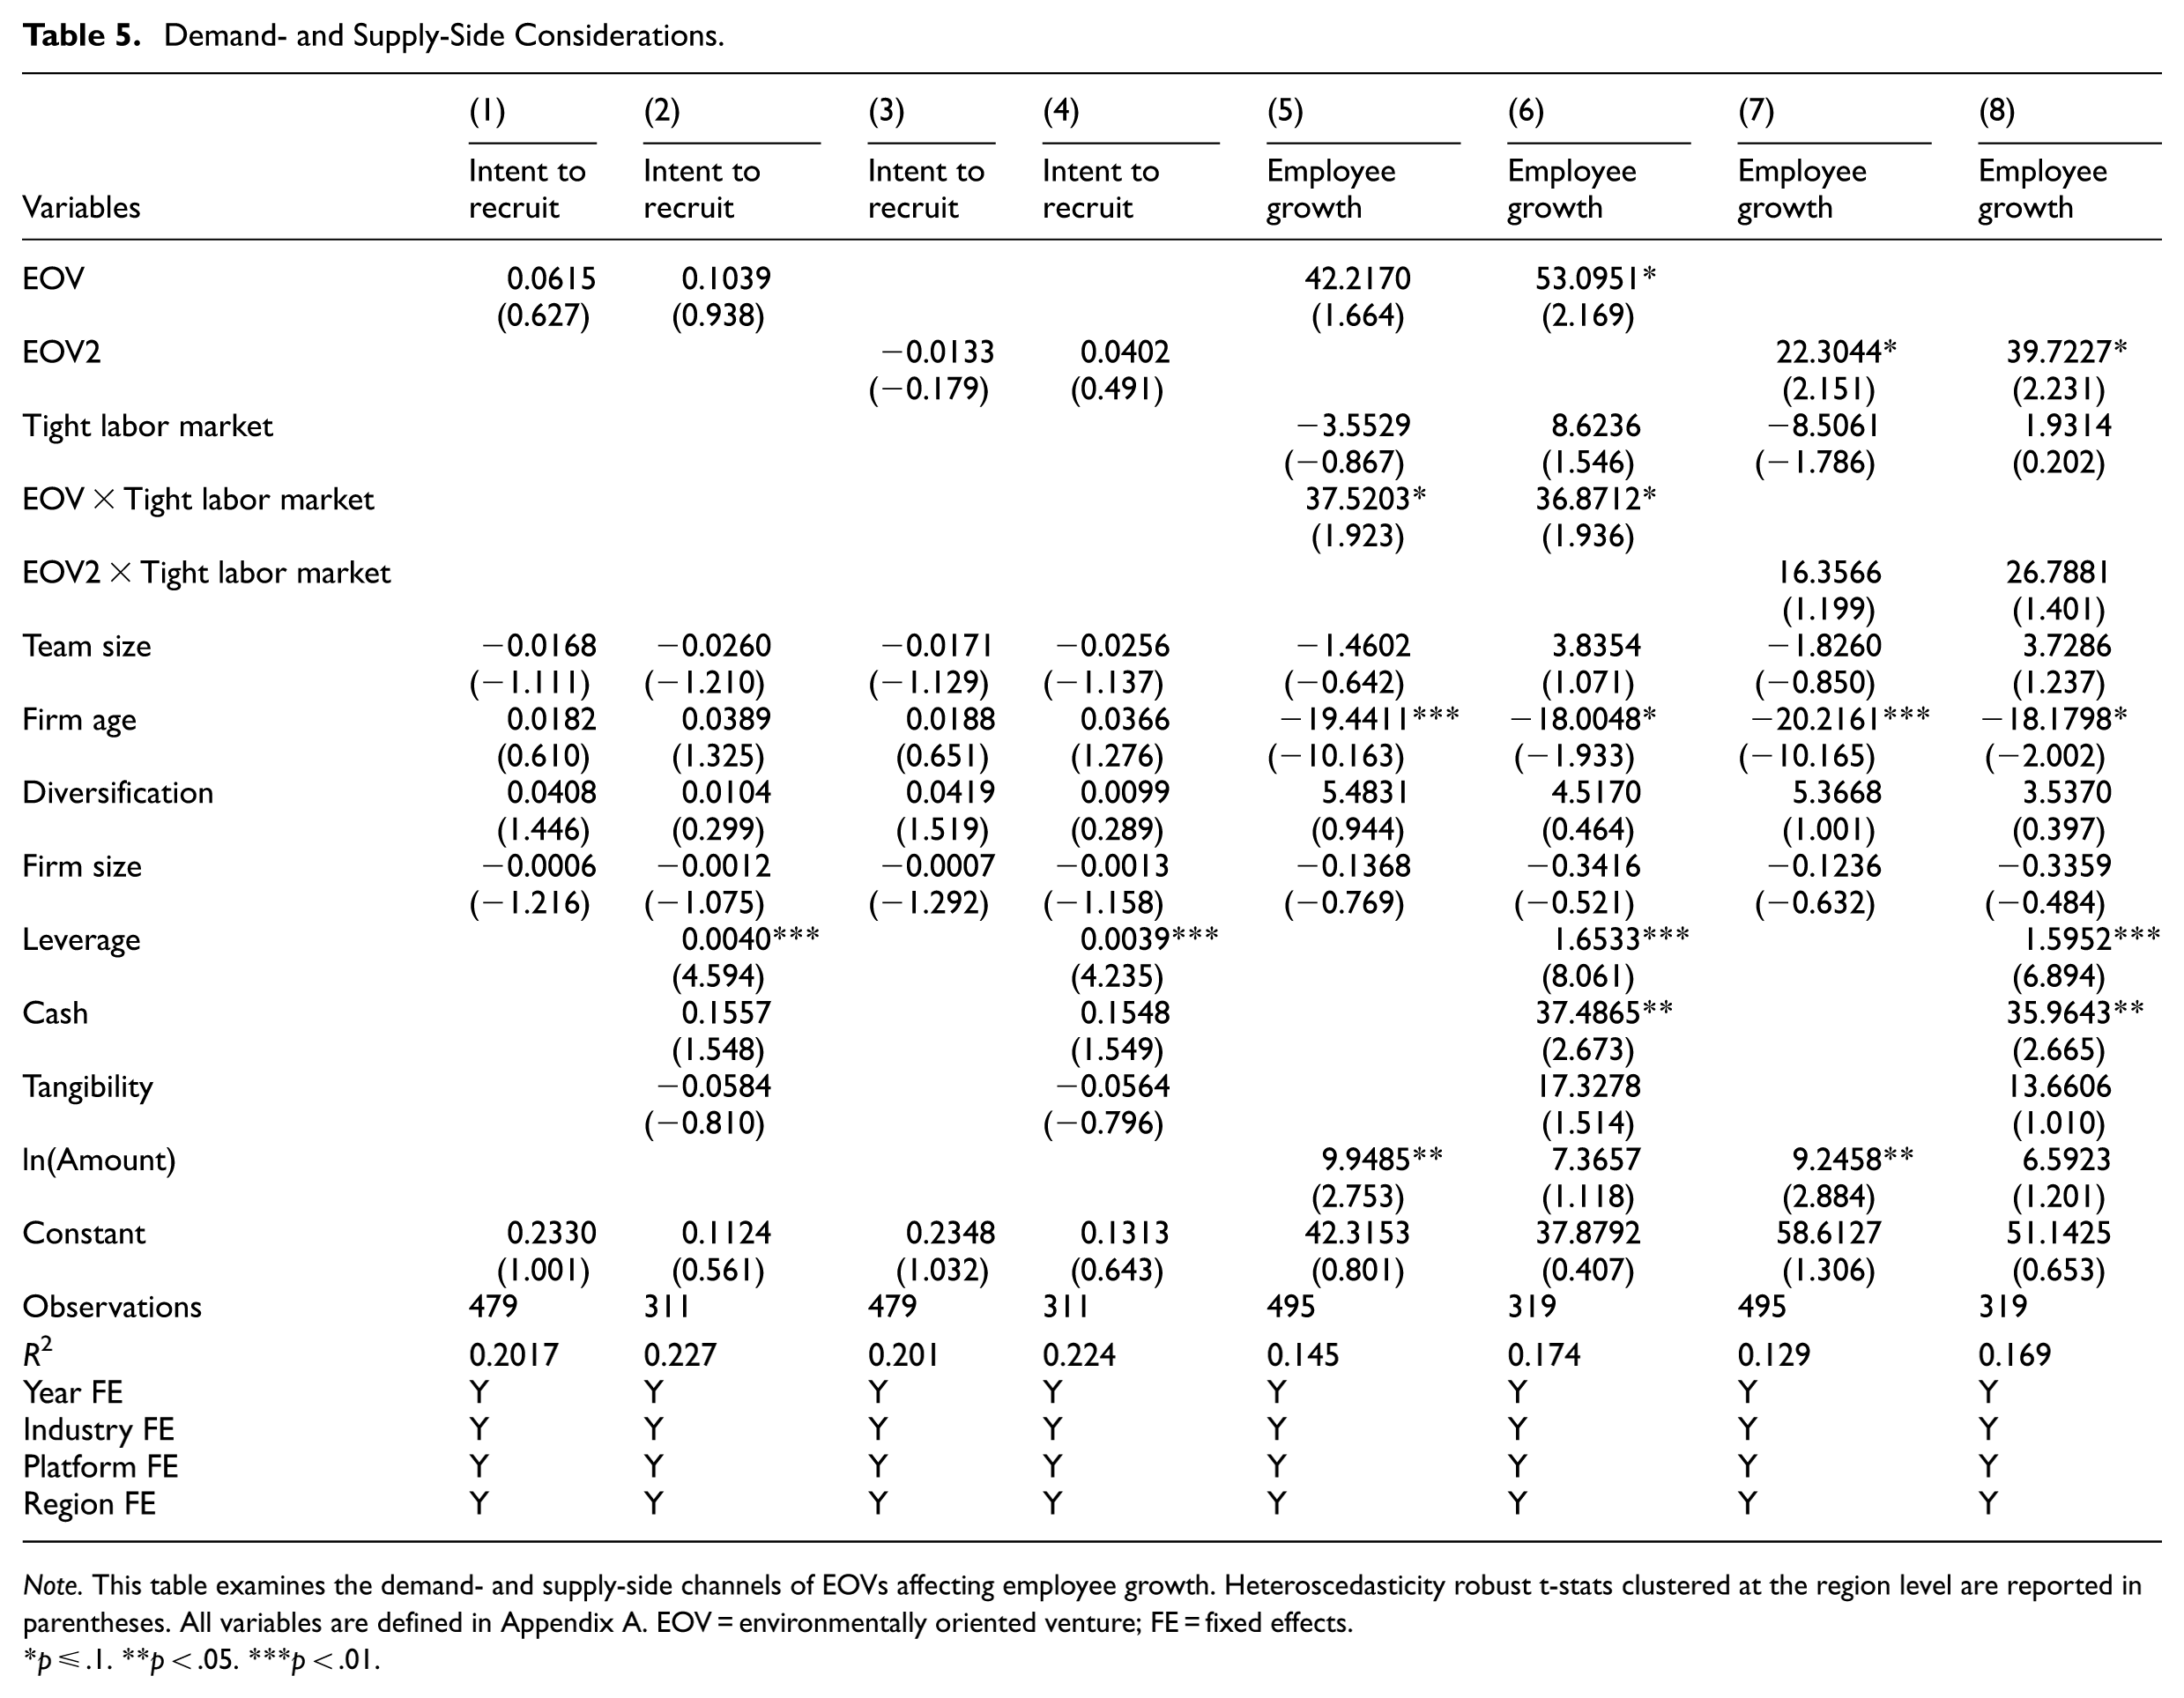
Note. This table examines the demand- and supply-side channels of EOVs affecting employee growth. Heteroscedasticity robust t-stats clustered at the region level are reported in parentheses. All variables are defined in Appendix A. EOV = environmentally oriented venture; FE = fixed effects.
p ≤ .1. **p < .05. ***p < .01.
Next, we test if environmental orientation can increase the supply pool of potential candidates and thus facilitate job creation. To test for a potential supply-driven explanation, we consider the tightness of the labor market. The greater competition for human capital in TLMs should put small ECF-funded firms at a disadvantage in hiring high-quality talent. However, even if the competition for labor is tough in TLMs, the environmental orientation signal may increase the supply of talent. Hence, we argue that EOVs find it easier to attract talent even in tight regional and sectoral labor markets characterized by low unemployment and high competition for human capital. We use our composite PCA-based index to capture labor market tightness, which includes regional unemployment, industry unemployment, and annual job ads scaled by employment at the industry- and city-level to capture labor market competition. We estimate regression specification (4) below to capture whether EOVs are more able to recruit in a TLM.

In our tests, we are mainly interested in the
Robustness Tests
We conduct a wide range of robustness tests to ensure the validity of our findings. We first aim to confirm that our findings are not driven by differences between EOVs and NEOVs. Our prior tests of the environmental orientation effect on capital raising and employee growth introduce two types of econometric problems. First, EOVs might be significantly different from NEOVs which impact the amount raised and the subsequent employee growth. To adjust for observable differences between EOVs and NEOVs, we employ the entropy balancing method (Hainmueller, 2012). Second, ventures receiving funding might be significantly different from ventures that do not. Our research question is based on how firms simultaneously can use environmental orientation to signal in capital and labor markets, and the net effect of EOV on employment after funding is received. To ensure that our results are not solely driven by funding success, we control for selection at the capital raising stage. To control for campaign outcome selection, we use a Heckman technique by modeling the probability of campaign success with the number of competing offerings along with several covariates as in Signori and Vismara (2018). 9 Third, we apply the Oster (2019) and Masten and Poirier (2026) coefficient stability tests to evaluate the severity of a potential omitted variable problem. Further robustness tests include alternative measures of employee growth, sample split on size, as well as tests on asset growth and an alternative EOV measure.
First, we consider that EOVs and NEOVs might be fundamentally different in terms of firm characteristics, by entropy balancing the sample based on (Diversification, Team size, Firm age, Firm size, Leverage, Cash, and Tangibility). 10 The estimations in Table 6 show that EOVs raise more capital and hire more personnel also after accounting for differences between EOVs and NEOVs using entropy balancing.
Robustness: Entropy Balanced Sample.
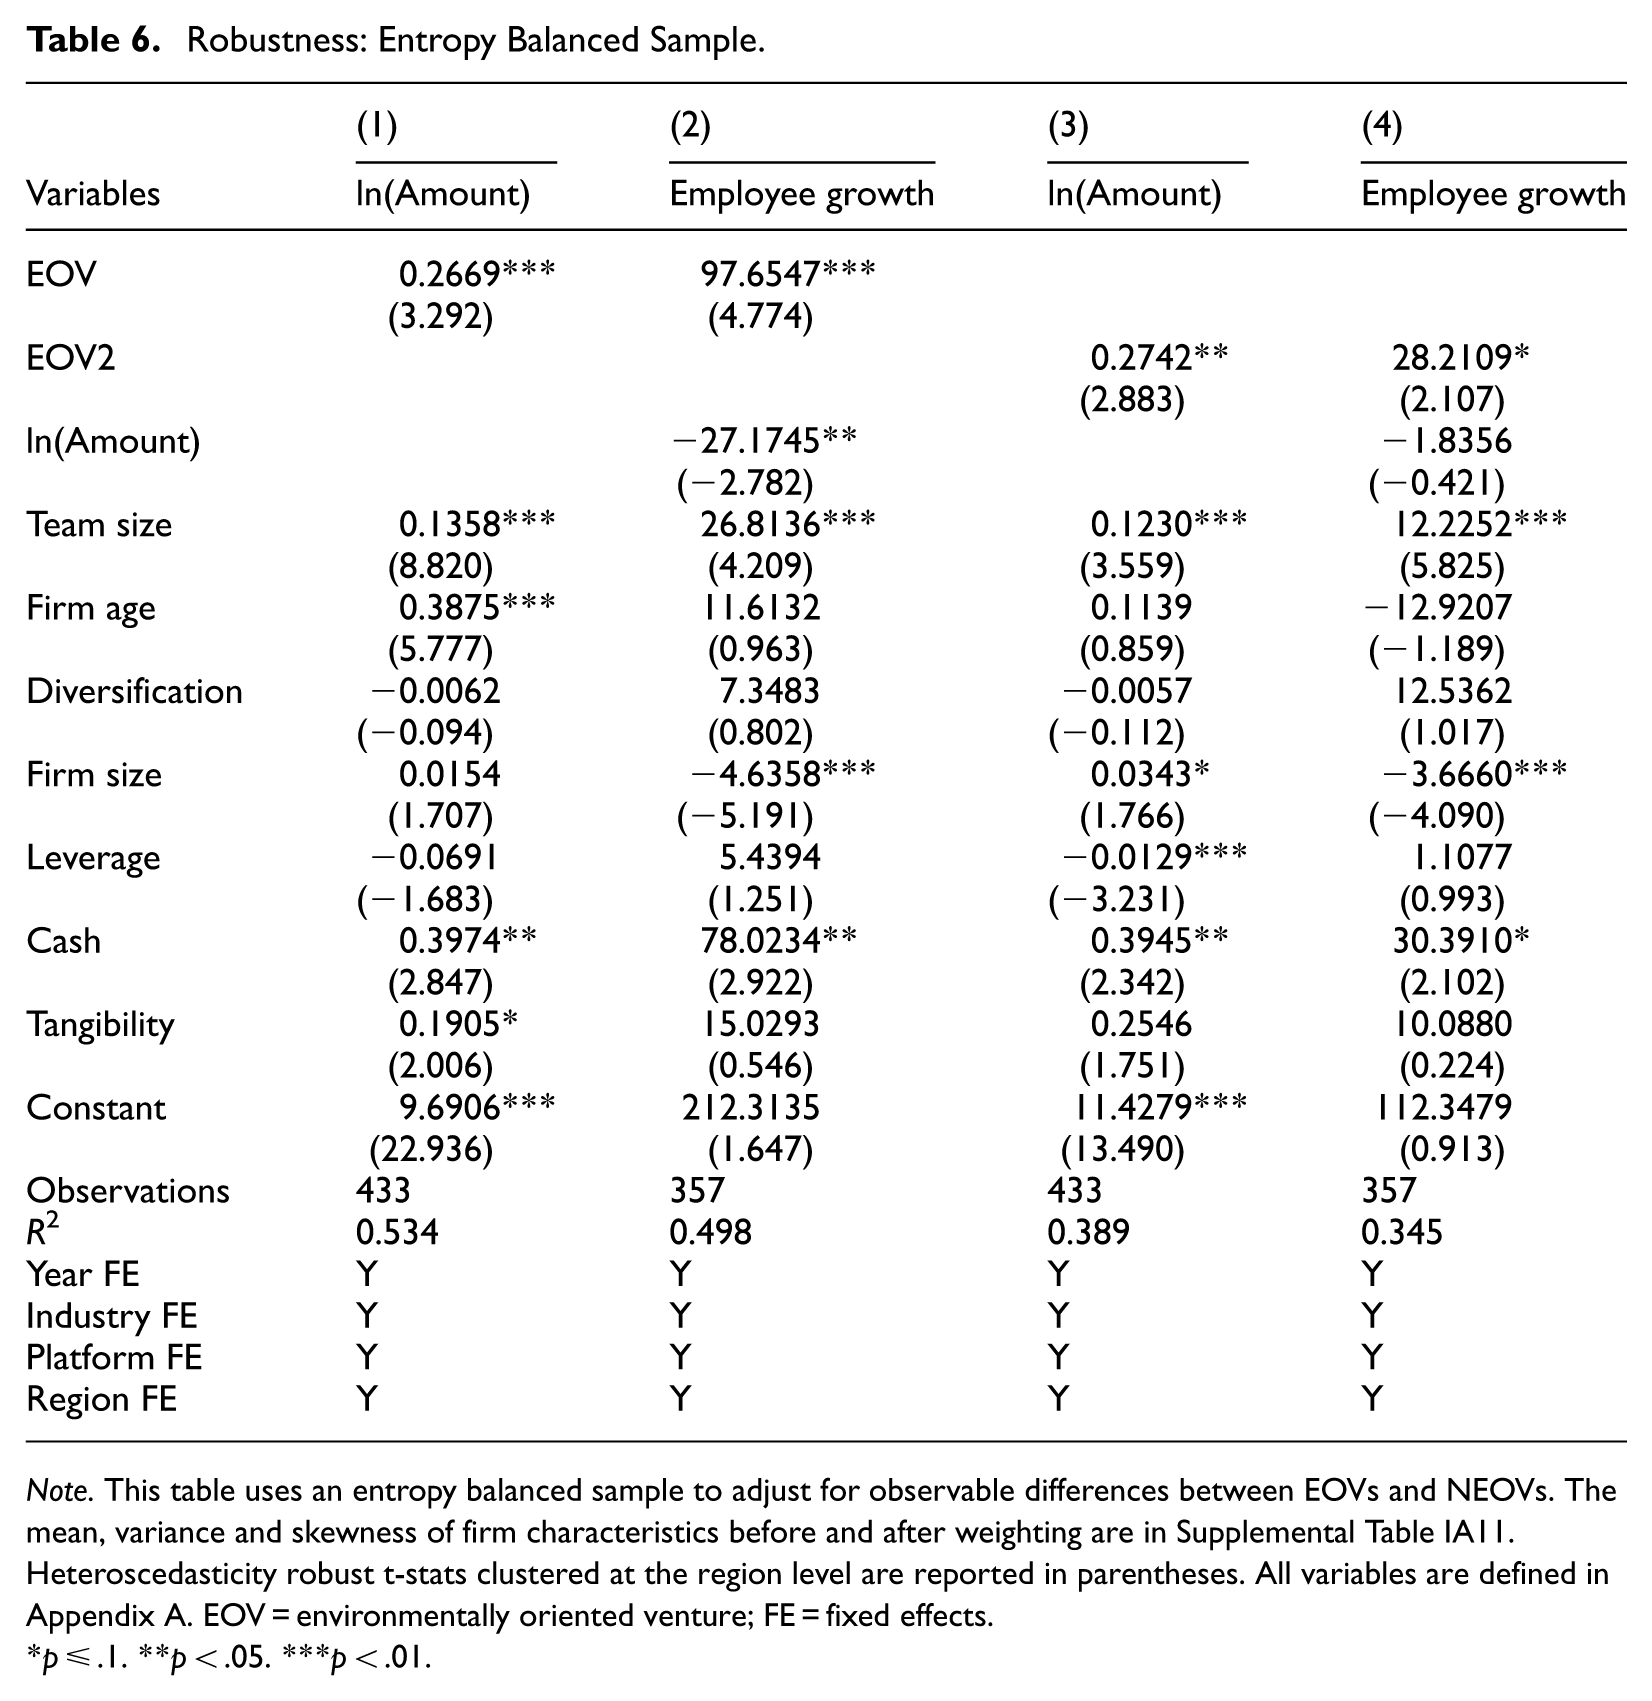
Note. This table uses an entropy balanced sample to adjust for observable differences between EOVs and NEOVs. The mean, variance and skewness of firm characteristics before and after weighting are in Supplemental Table IA11. Heteroscedasticity robust t-stats clustered at the region level are reported in parentheses. All variables are defined in Appendix A. EOV = environmentally oriented venture; FE = fixed effects.
p ≤ .1. **p < .05. ***p < .01.
Next, we consider the role of selection in the campaign stage, where firms obtaining financing could be different from failed campaigns. We model the first stage as in Signori and Vismara (2018), by using the number of competing offerings (both successful and unsuccessful) at the time of the campaign to instrument for campaign success (Column (1) of Table 7) along with Team size, Firm age, and Diversification. Signori and Vismara (2018) and Coakley et al. (2025) found that competing offers negatively predict campaign success (whether the campaign is completed). Correia et al. (2025) did not find any impact on funding success (if firms reach their target amount) during the early days of ECF (time-period 2015–2018). Our sample starts in 2019 and continues during years of significant developments in the ECF market. Consistent with Signori and Vismara (2018), we find a negative and significant effect of competing bids on the success likelihood. We report similar outcomes as in prior estimations, EOV has a positive impact on ln(Amount) and Employee growth in Columns (2) to (5). In line with prior studies, we do not report a significant Inverse Mills ratio in any of the second-stage models. 11 However, we acknowledge that this correction of selection bias in campaign outcomes does not account for potential selection effects due to rejection from other funding sources such as venture capital firms and business angels (see, Walthoff-Borm et al., 2018a). However, such a self-selection toward low-quality firms seeking crowdfunding should bias the effect of crowdfunding on employment downward rather than upward.
Accounting for Campaign-Stage Selection.
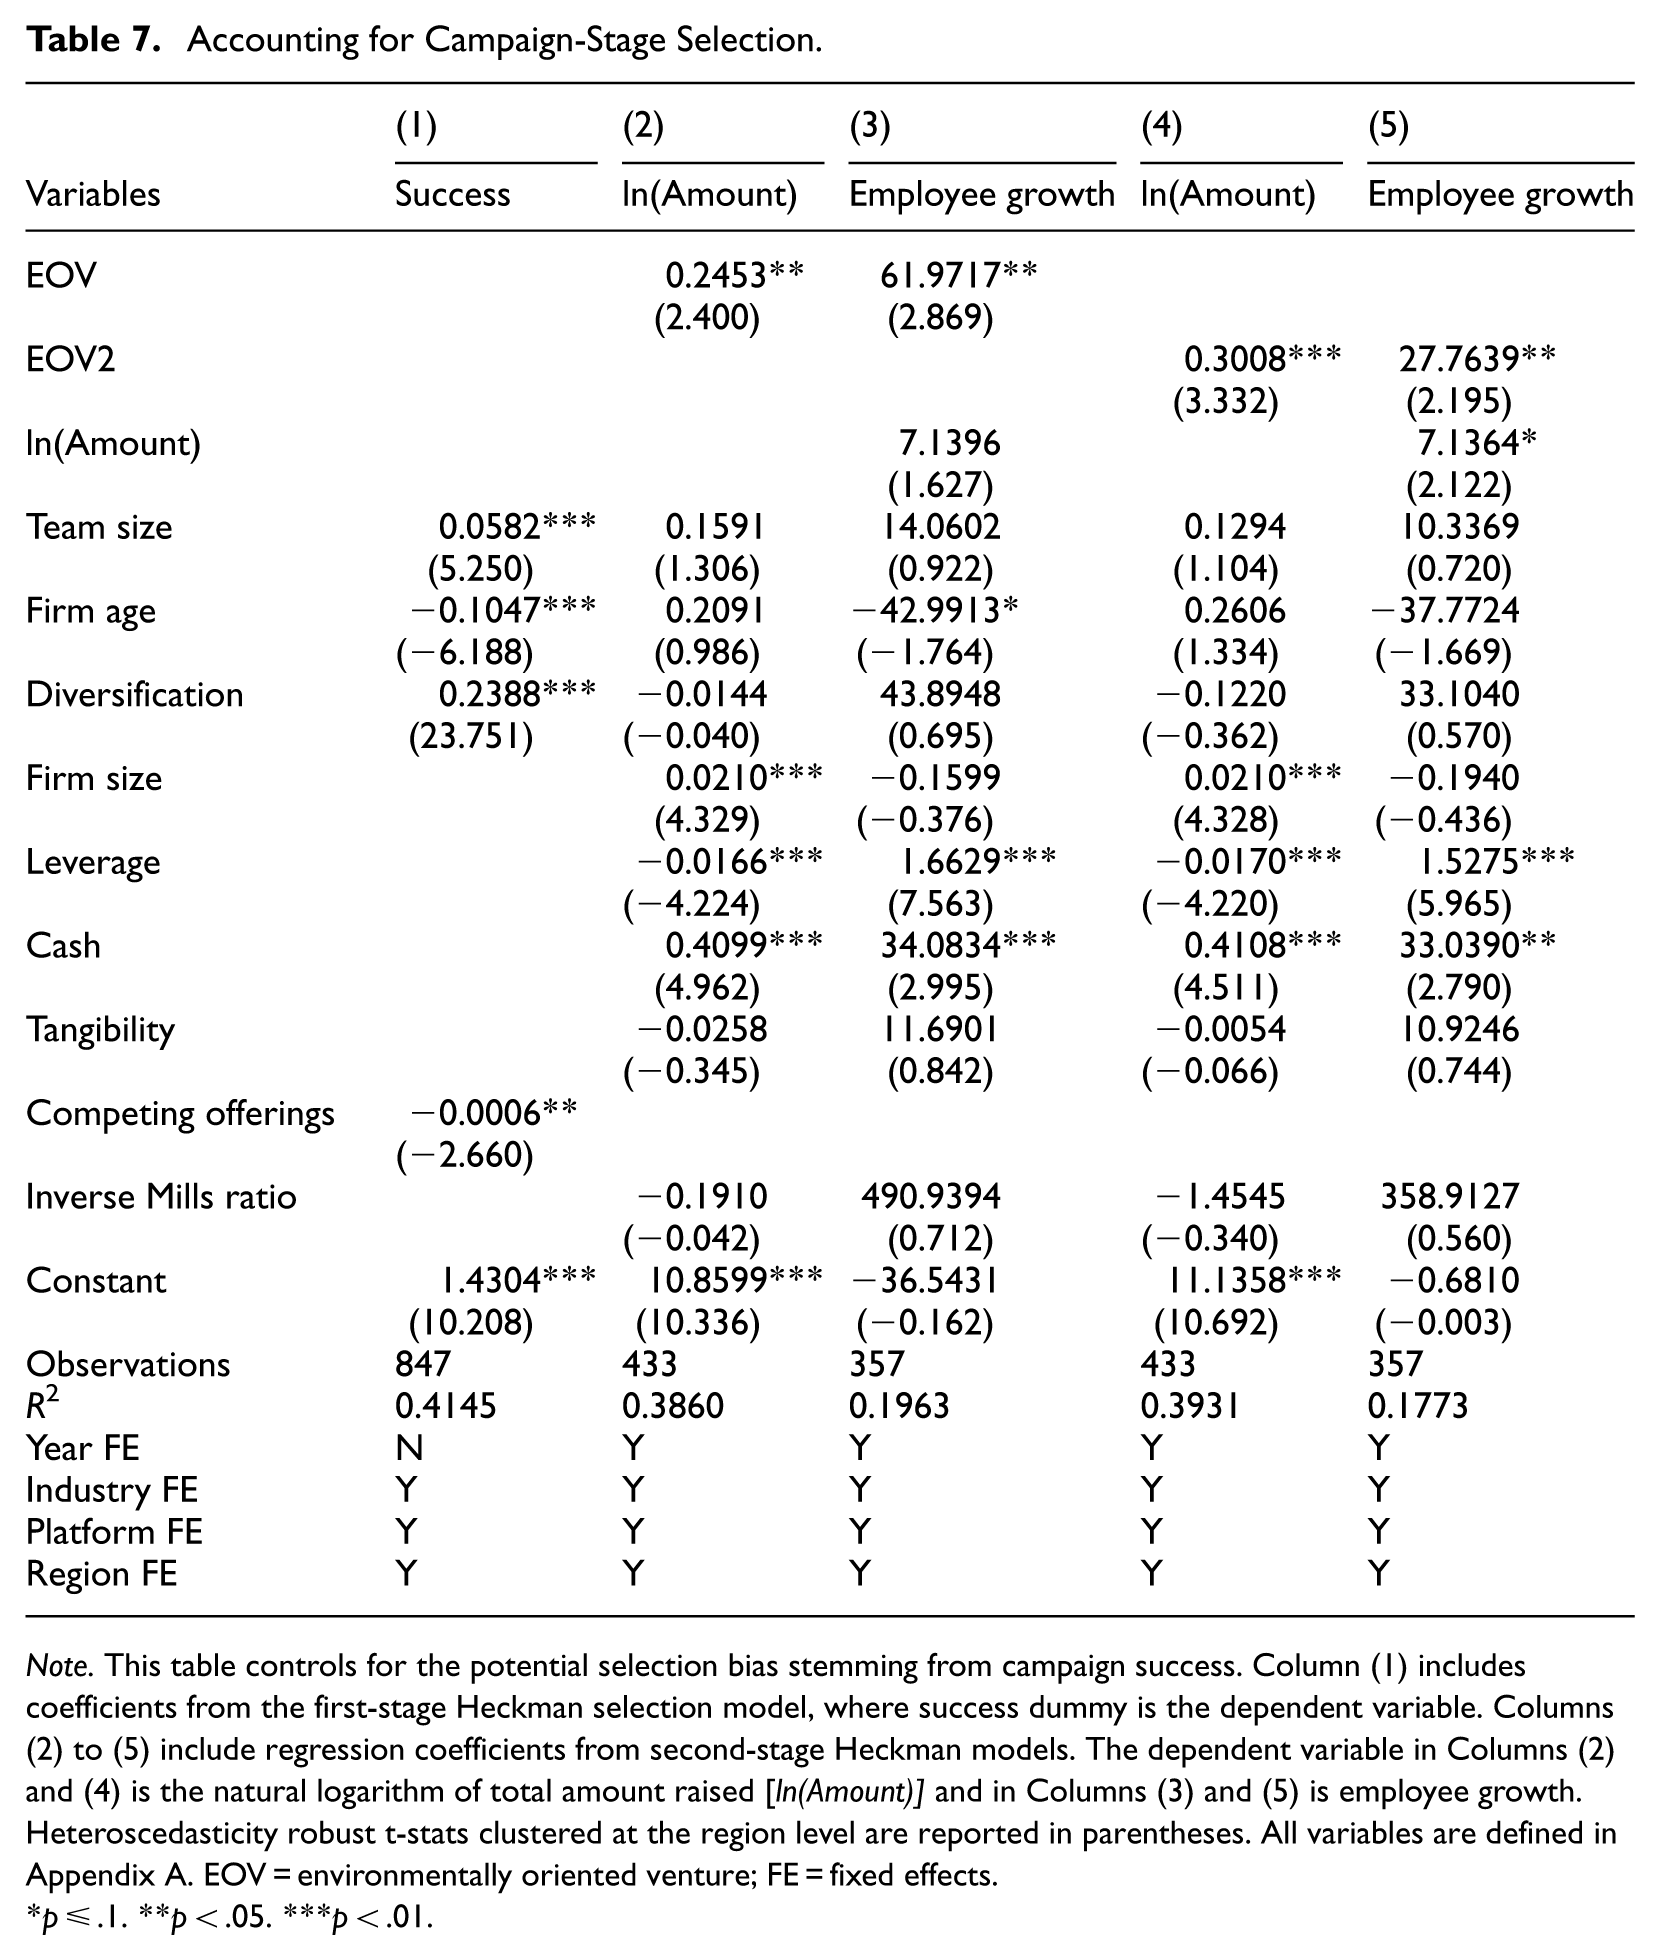
Note. This table controls for the potential selection bias stemming from campaign success. Column (1) includes coefficients from the first-stage Heckman selection model, where success dummy is the dependent variable. Columns (2) to (5) include regression coefficients from second-stage Heckman models. The dependent variable in Columns (2) and (4) is the natural logarithm of total amount raised [ln(Amount)] and in Columns (3) and (5) is employee growth. Heteroscedasticity robust t-stats clustered at the region level are reported in parentheses. All variables are defined in Appendix A. EOV = environmentally oriented venture; FE = fixed effects.
p ≤ .1. **p < .05. ***p < .01.
We further apply the coefficient stability test by Oster (2019) to the main models. We apply it to models (2) and (4) of Tables 2, 3 and 5, respectively, to test for the severity of potential omitted variables. Following the recommendation of Oster (2019), we use R_Max^2 = 1.3 × R^2 as the maximum R^2 achievable in the models to create a lower bound of beta. R^2 is the R2 from the controlled models estimated above. We use δ = 1 when creating a lower bound for beta with the assumption that the observables are at least as important as the unobservables. Tests in Supplemental Table IA12 show that the corrected betas remain positive and with similar signs as in the original tests. This indicates that observable variables are at least as important as unobservable variables, suggesting that omitted variables do not play a dominant role in driving the main results. We also apply the more restrictive test by Masten and Poirier (2026), to assess the lowest level of unobservable selection (rx) to observables that would be needed to change the sign of the estimate. The highest attainable level of rx is 1, our rx estimates range from 0.58 to 0.82, implying that our results are moderately to strongly robust to potential omitted variable bias.
Next, we test if the EOV—Employee growth effect persists after using alternative measures of employee growth. We include the difference in employees between t and t + 1, and the percentage growth in employees from t to t + 2. Our findings in Supplemental Table IA13 do not alter our previous conclusions. In addition to accounting for the actual headcount growth, we also acknowledge that using a percentage measure leads to large percentage increases in employment for a small change in the actual number of employees. To further ensure that this does not drive our findings, we split the sample between large and small firms in Supplemental Table IA14. The effect persists in three out of four specifications.
Next, we test if we observe an effect of EOVs on investments in other assets (working capital and physical assets) as well. Investments in working capital and physical assets should be less dependent on the signaling value of environmental orientation. Therefore, we would expect a zero or negative effect on such investments as firms redirect resources toward employee growth rather than investments in working capital and physical capital. Our tests in Supplemental Table IA15 do not show any relationship between EOV and Asset growth.
Lastly, the use of green labels may lead to misclassification; to partly address this issue, we create a third measure of environmental orientation: EOV common. EOV common includes the firms that are classified by both the Beauhurst classification and our text-based measure. We argue that double classified firms with greater certainty are true EOVs, as they have both passed Beauhurst’s manual screening and include environmentally oriented keywords in their company descriptions. 12 Our findings in Supplemental Table IA16 do not alter our previous interpretations; EOVs raise more capital and hire more people in the post-campaign stages.
Discussion
Our study theoretically extends RBV (Barney, 1991) and NRBV (Hart, 1995; Hart & Dowell, 2011) to young ventures in an asymmetric information setting for ventures that lack capabilities and resources in place. We conceptualize environmental orientation as an early-stage organizational capability reflecting the venture’s ability to recognize, prioritize, and organize around environmental opportunities and constraints. Although such a capability may still be emerging in young ventures, it can already impact strategic positioning, campaign communication, and early resource mobilization. Prior studies within the ECF literature implicitly examine resources and capabilities such as human capital (Barbi & Mattioli, 2019; Troise et al., 2024), social capital (Vismara, 2016), governance structures (Coakley et al., 2025; Vismara & Wirtz, 2025), certification from third parties (Kleinert et al., 2020), and more importantly environmental orientation (Mansouri & Momtaz, 2022; Vismara, 2019; Vismara & Wirtz, 2025) but do not explicitly analyze them under the lens of RBV or NRBV frameworks. Instead, the ECF literature applies signaling theory without anchoring it in RBV and NRBV, where ventures can leverage these resources and capabilities to gain advantages in the campaign and post-campaign stages.
Most importantly, we contribute to the ECF literature by showing how environmental orientation impacts campaign and notably post-campaign outcomes. Unlike prior work on post-campaign outcomes on follow-on financing (see Coakley et al., 2022b), survival (see Hornuf et al., 2018; Lazos, 2025; Vismara & Wirtz, 2025), venture capital financing (Butticè et al., 2020), and innovation (Eldridge et al., 2021; Troise et al., 2021; Walthoff-Borm et al., 2018b), our focus is on how ventures’ environmental orientation can facilitate both capital acquisition, and allocation through a greater demand for human capital and an expansion of supply of prospective talent in the labor markets. The role of environmental orientation in the post-campaign stage has been explored in relation to survival and performance (Del Gaudio et al., 2025, Del Sarto & Bellavitis, 2025; Vismara & Wirtz, 2025). However, to our knowledge, resource allocation among EOVs in the post-campaign stage is yet underexplored in the ECF literature, despite the evidence that use of resources is critical for a venture’s long-term performance (Ahlers et al., 2015; Vismara, 2016).
The empirical evidence supports our theoretical argumentation. In tests of H1, we report that environmental orientation facilitates fundraising as EOVs raise 22.20% to 34.75% more capital in their campaigns relative to NEOVs. Our findings that EOVs raise more funds in the campaign largely align with prior literature on the amount raised in the offering (see Hörisch & Tenner, 2020; Mansouri & Momtaz, 2022). Articles on the binary success of the offering of EOVs may be viewed as contradictory (see Vismara, 2019). A potential explanation may stem from the All-or-Nothing model, where the offering fails if it does not reach a pre-determined capital raising level (Cumming et al., 2020; Hellmann et al., 2025). If EOVs set higher relative levels, they may potentially fail more often but at the same time raise more funds if they are successful.
Our study further links fundraising with real-economic outcomes of ECF by showing the direct impact on employee growth. We show in tests of H2 that EOVs exhibit 18.06% to 61.95% greater employee growth following the offering, depending on specification and EOV measure. Interestingly, this also holds after controlling for the capital raised in the campaign. Hence, EOVs create more jobs after conditioning on the financial resources raised in the campaign. We analyze this from both supply and demand perspectives. On the demand-side (H3a), consistent with NRBV, EOVs might have a greater need for human capital investments. From a supply-side perspective (H3b), environmental orientation can facilitate resource allocation through an increased supply pool of talent. Our tests point toward a supply-side mechanism, where EOVs have some advantages in TLMs where talent acquisition is difficult. We do not find that environmental orientation shapes the demand for human capital, as we fail to find any link between environmental orientation and a venture’s intent to recruit at the campaign stage. Hence, our results shed light on how ECF-financed ventures allocate resources in the post-campaign stage.
All in all, our findings suggest that investment in EOVs may yield broader real-economic benefits alongside environmental gains. Supporting ventures committed to environmental goals, investors in EOVs not only back responsible business practices but also foster ventures that generate higher employment growth. This complements the findings in Vismara and Wirtz (2025), as their results suggest that the payoff for ethical investors is the reduction in long-term failure, our article instead argues it may give back to the local community via job creation.
Policy Implications
Our findings have implications for policymakers, platforms, and entrepreneurs. Our findings are insightful considering that small businesses account for the majority of employment in the economy (61% of total employment in the United Kingdom according to the Federation of Small Business report [2023], and 80% of the net job creation in the United States [Bowers, 2024; Press, 2024]). Ventures are important for employment but at the same time often face difficulties in obtaining financing to realize their intended hiring. We show that ECF as an alternative source of capital for young ventures is associated with subsequent employee growth. As job creation is viewed as one of the main governmental goals, our findings highlight the need to facilitate the flow of capital from investors through ECF platforms to ventures. Policymakers play a key role in promoting trust in otherwise opaque ECF investments through legal harmonization and standardization across platforms. In countries lacking venture capital, business angels, and bank financing for young ventures, governments could provide tax benefits for ECF investments (Cicchiello et al., 2019), and especially for EOVs to both promote job creation and environmental sustainability.
For ECF platforms, our findings underline the potential of environmental labeling in connection to post-campaign outcome reporting as a mechanism to enhance investor engagement and trust. Platforms highlighting environmental orientation and at the same time showing post-campaign employment outcomes could attract a broader base of impact-oriented investors, which should improve liquidity, campaign success, and in the end platform growth and profitability (Cumming et al., 2025).
For entrepreneurs, our results show that environmental orientation is not only a personal preference but can also be an important early-stage organizational capability that is valuable in capital and labor markets. Highlighting the venture’s environmental orientation in campaign communications and job ads may work as a credible signal to both investors and prospective employees, which facilitates attracting both financial and human capital in the absence of tangible assets or a track record.
Limitations
Our study is not without limitations. The first concerns the small number of EOVs. The Beauhurst measure only categorizes 7.10% of the firms as EOVs or 47, while the second measure categorizes 13.20% or 87 as EOVs. Even though we winsorize the data, the sample size is limited and become smaller with the inclusion of accounting controls, making our outcomes sensitive to outliers. This is also evident when we study the absolute, relative, and total employee growth numbers. Where the economic magnitude in percentage growth ranges from 47.78% to 61.95% for our first measure and 18.06% to 28.58% for our second measure, the effect only ranges from 0.94 to 3.25 employees in absolute terms. Thus, the incremental impact of EOVs on job creation is limited. Even when aggregating the EOVs in our sample, the total job creation ranges from 77 to 168 jobs the year after or roughly 29 to 42 jobs per year created from EOVs relative to NEOVs. This further highlights not only the limited size of the ECF market in its current form but also the potential impact it may have on employment if it continues to grow in importance.
We further acknowledge that our study is conducted in a well-developed ECF system. The ECF system in the United Kingdom is concentrated in two main platforms capturing 90% of the market according to CMA UK 2021. 13 Hence, there is less room for specialized exchanges focusing on EOVs, where the platform already has done parts of the due diligence on environmental orientation. Furthermore, we strictly focus on ECF offerings, which are larger and should have a greater impact on economy-wide employment relative to reward-based crowdfunding that may mainly foster self-employment.
It is important to note that our mechanism tests should be viewed as suggestive rather than conclusive and causal. The evidence in support of a supply-side mechanism is not strong and should therefore be interpreted with caution. There are likely other mechanisms at play that we do not capture with our supply- and demand-side proxies. Hence, we can only argue that our findings suggest the presence of supply-side factors impacting employment in EOVs.
Supplemental Material
sj-pdf-1-etp-10.1177_10422587261463523 – Supplemental material for When Environmental Sustainability Meets Equity Crowdfunding: The Role of Green Ventures in Job Creation
Supplemental material, sj-pdf-1-etp-10.1177_10422587261463523 for When Environmental Sustainability Meets Equity Crowdfunding: The Role of Green Ventures in Job Creation by Anup Basnet, Magnus Blomkvist and Aristogenis Lazos in Entrepreneurship Theory and Practice
Footnotes
Appendix A
Variable Definitions.
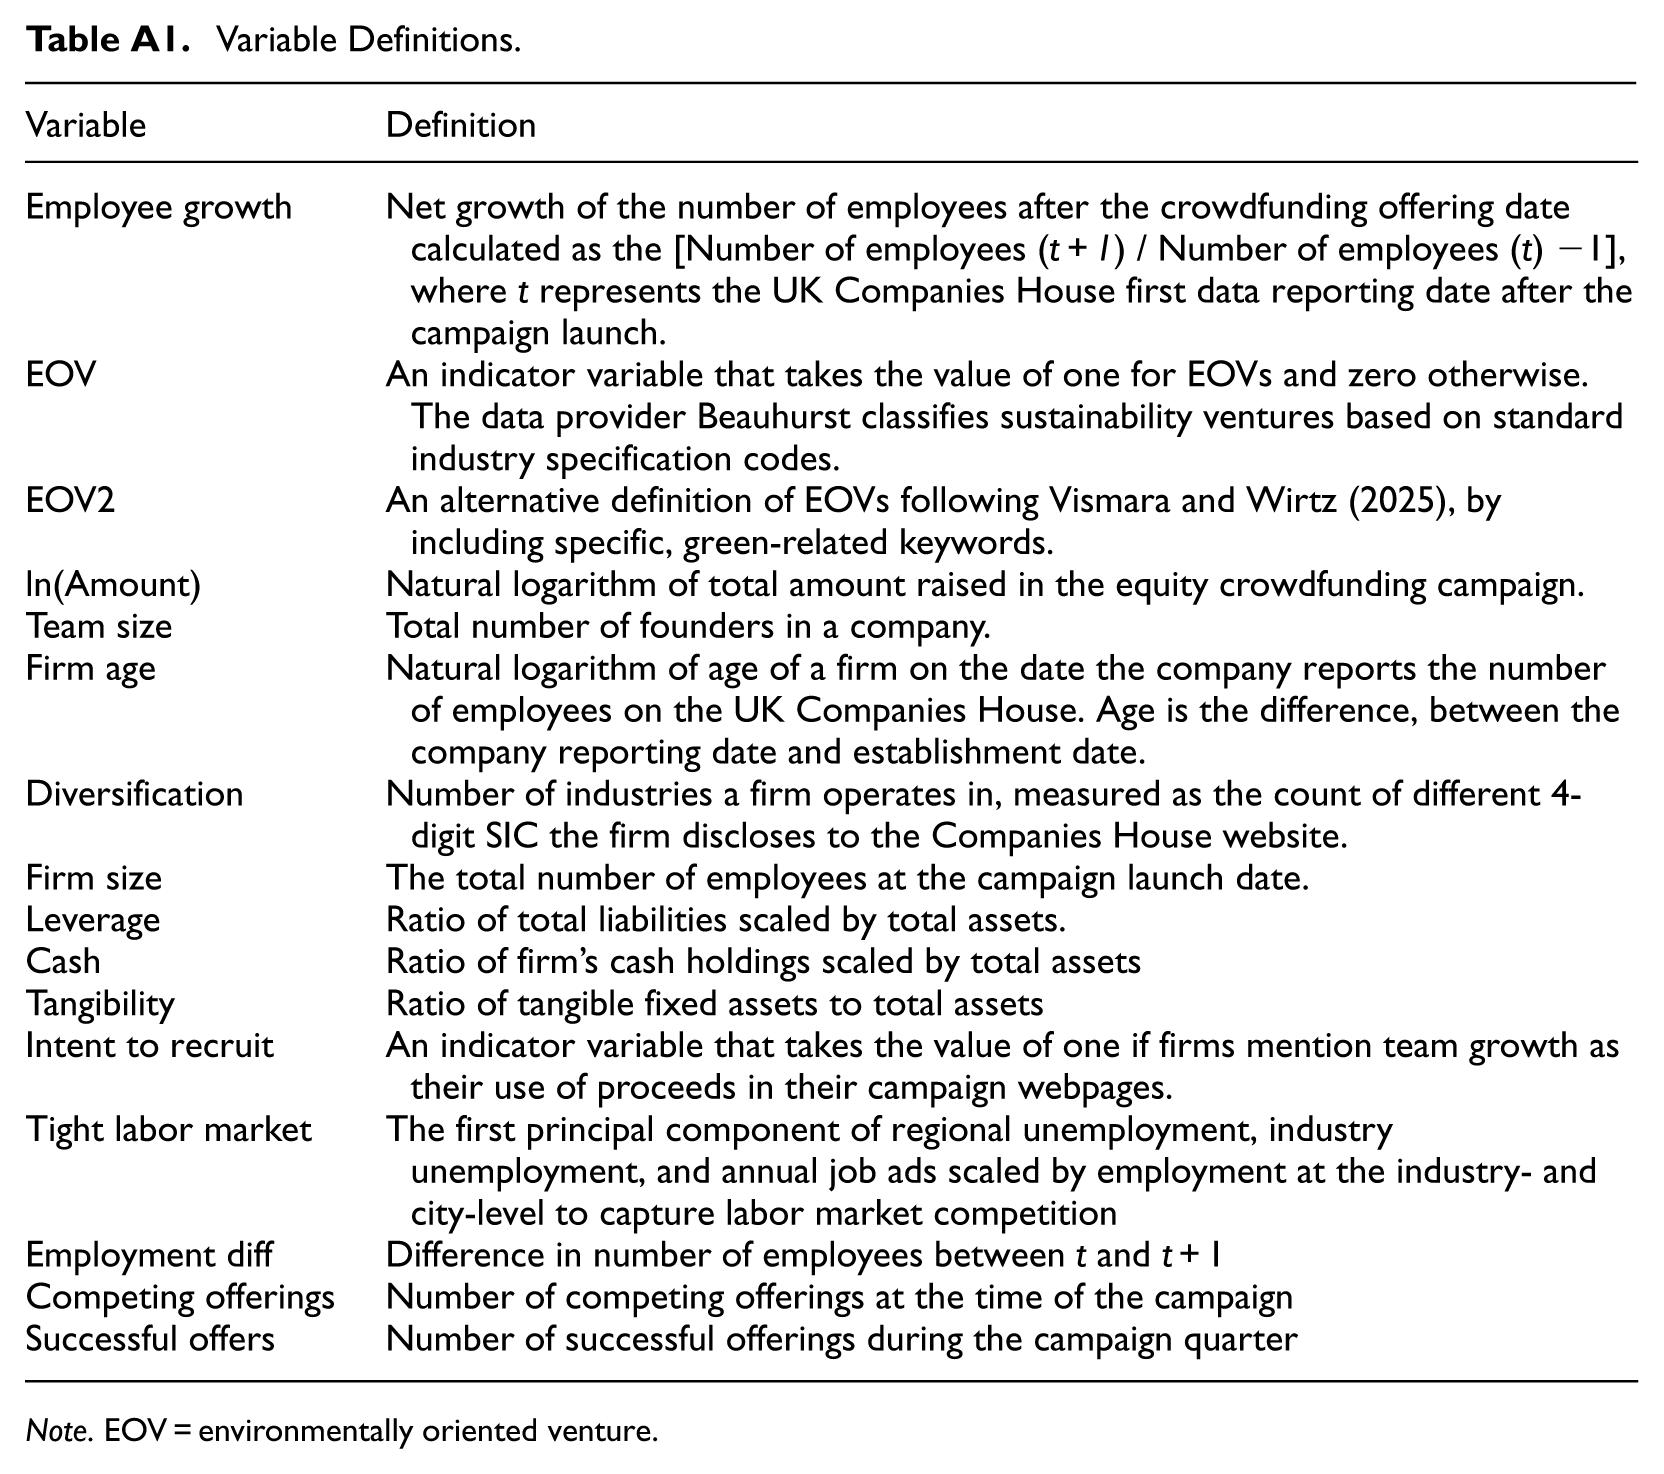
| Variable | Definition |
|---|---|
| Employee growth | Net growth of the number of employees after the crowdfunding offering date calculated as the [Number of employees (t + 1) / Number of employees (t) −1], where t represents the UK Companies House first data reporting date after the campaign launch. |
| EOV | An indicator variable that takes the value of one for EOVs and zero otherwise. The data provider Beauhurst classifies sustainability ventures based on standard industry specification codes. |
| EOV2 | An alternative definition of EOVs following Vismara and Wirtz (2025), by including specific, green-related keywords. |
| ln(Amount) | Natural logarithm of total amount raised in the equity crowdfunding campaign. |
| Team size | Total number of founders in a company. |
| Firm age | Natural logarithm of age of a firm on the date the company reports the number of employees on the UK Companies House. Age is the difference, between the company reporting date and establishment date. |
| Diversification | Number of industries a firm operates in, measured as the count of different 4-digit SIC the firm discloses to the Companies House website. |
| Firm size | The total number of employees at the campaign launch date. |
| Leverage | Ratio of total liabilities scaled by total assets. |
| Cash | Ratio of firm’s cash holdings scaled by total assets |
| Tangibility | Ratio of tangible fixed assets to total assets |
| Intent to recruit | An indicator variable that takes the value of one if firms mention team growth as their use of proceeds in their campaign webpages. |
| Tight labor market | The first principal component of regional unemployment, industry unemployment, and annual job ads scaled by employment at the industry- and city-level to capture labor market competition |
| Employment diff | Difference in number of employees between t and t + 1 |
| Competing offerings | Number of competing offerings at the time of the campaign |
| Successful offers | Number of successful offerings during the campaign quarter |
Note. EOV = environmentally oriented venture.
Acknowledgements
The authors are grateful for comments from the Editor Silvio Vismara, three anonymous reviewers, Vincenzo Capizzi, Douglas Cumming, Zulfiquer Haider, Viacheslav Iurkov, Andreas Rausch, and Geoffrey Wood.

Funding
The authors received no financial support for the research, authorship, and/or publication of this article.
Declaration of Conflicting Interests
The authors declared no potential conflicts of interest with respect to the research, authorship, and/or publication of this article.
Supplemental Material
Supplemental material for this article is available online.
Notes
Author Biographies
References
Supplementary Material
Please find the following supplemental material available below.
For Open Access articles published under a Creative Commons License, all supplemental material carries the same license as the article it is associated with.
For non-Open Access articles published, all supplemental material carries a non-exclusive license, and permission requests for re-use of supplemental material or any part of supplemental material shall be sent directly to the copyright owner as specified in the copyright notice associated with the article.
