
Abstract
Polyethylenimine (PEI) is widely employed as a transfection reagent in recombinant adeno-associated virus (rAAV) manufacturing, but it must be removed from the final product due to its potential toxicity. Accurate quantification of PEI in complex biological matrices such as rAAVs is challenging, largely because the strong electrostatic attraction between PEI and nucleic acids can hinder the accuracy of its quantification. Here, we report a robust high-performance liquid chromatography method with charged aerosol detection for the quantification of residual linear PEI in purified AAV samples. Sample preparation includes treatment with trifluoroacetic acid and hydrochloric acid at 60°C to denature capsid protein, disrupt PEI–DNA polyplexes, and hydrolyze nucleic acids. The method achieves a limit of detection of 5 µg/mL and a limit of quantitation of 10 µg/mL in spike-and-recovery studies, with quantification confirmed via visual peak identification. This approach enables sensitive, specific, and reproducible PEI measurement and provides a valuable tool for process monitoring and quality control in gene therapy manufacturing.
Keywords
INTRODUCTION
Polyethylenimine (PEI) is commonly used as a transfection reagent in viral vector manufacturing. PEI is a cationic polymer that forms an electrostatically driven polyplex with DNA, enabling intracellular gene delivery by facilitating cellular uptake and endosomal escape. 1 In viral vector manufacturing, transient transfection of HEK293 cells using PEI is a widely adopted and cost-effective strategy for producing viral vectors such as recombinant lentivirus and recombinant adeno-associated virus (rAAV).2,3
While rAAV vectors have achieved success in gene therapy applications owing to their delivery efficiency and favorable safety profile,4–6 residual PEI in rAAV drug substances (DS) poses significant safety and regulatory concerns. PEI has known cytotoxic effects, which include membrane disruption, mitochondrial stress, and triggering apoptosis.1,7 Additionally, free PEI interferes with critical analytical assays for product characterization such as quantitative PCR (qPCR) by binding to DNA, often necessitating extreme dilution or chemical displacement for accurate measurement. 8 It is therefore important to have an analytical method to quantify PEI and confirm its removal from the final product.
Detection and quantification of PEI poses challenges due to its lack of chromophores. Spectrophotometric detection by UV absorbance is possible by complexation with Cu(II), 9 and various nonspectrophotometric techniques have also been employed to detect and characterize PEI, including matrix-assisted laser desorption ionization time of flight (MALDI-TOF) mass spectrometry, refractive index detection, nuclear magnetic resonance spectroscopy, and charged aerosol detection (CAD).10–13 These detection methods can be combined with size-exclusion or ion-exclusion chromatographic separation for improved specificity. 12 However, despite these advancements, many of these methods remain complex, labor-intensive, or subject to interference from the sample matrix.
Complex biological matrices such as rAAV DS pose additional challenges to PEI detection and quantification. rAAVs consist of a capsid with approximately 30 nm hydrodynamic diameter containing a ∼4.7 kb DNA genome. 14 A major concern is the strong electrostatic interaction between PEI and DNA, which can mask the presence of PEI or lead to signal interference. In our evaluation of a Cu(II)-based PEI detection method, which quantifies PEI based on the UV absorbance of PEI-Cu complexes, we observed inconsistent recoveries of PEI spiked into high-concentration AAV samples. We also found that DNA displaces Cu(II) from its complex with PEI, suppressing the UV signal (Supplementary Data S1.1). As a result, we evaluated an alternate CAD-based method (which detected PEI directly rather than requiring complexation) but still observed that the recovery of spiked PEI depended strongly on the AAV concentration (Supplementary Data S1.2). These observations underscore the need to separate PEI from other sample components—particularly DNA—for accurate quantitation.
Previous studies have attempted to disrupt PEI–DNA complexes using agents such as trifluoroacetic acid (TFA), heparin, and sarkosyl, with varying degrees of success depending on matrix complexity and PEI concentration.8,13,15 Socia et al. achieved accurate quantification of linear PEI in PEI–DNA polyplex nanoparticles by using TFA to disrupt these complexes. 13 However, the method was not applied to protein-containing systems.
In this study, we present a robust high-performance liquid chromatography with CAD (HPLC-CAD) method for the quantification of residual linear PEI in rAAV samples. The method employs a sample preparation protocol involving the addition of TFA and hydrochloric acid with incubation at 60°C to effectively disrupt PEI–DNA polyplexes, hydrolyze nucleic acids, and denature viral capsid proteins, as illustrated in Figure 1. This approach achieves detection of PEI at concentrations as low as 5 µg/mL and establishes a limit of quantitation (LOQ) of 10 µg/mL in rAAV samples. Quantification is determined through visual peak inspection and is verified by spike-and-recovery experiments. This method directly addresses both the analytical and biological challenges associated with PEI and provides a robust tool for process monitoring and release testing in gene therapy manufacturing.
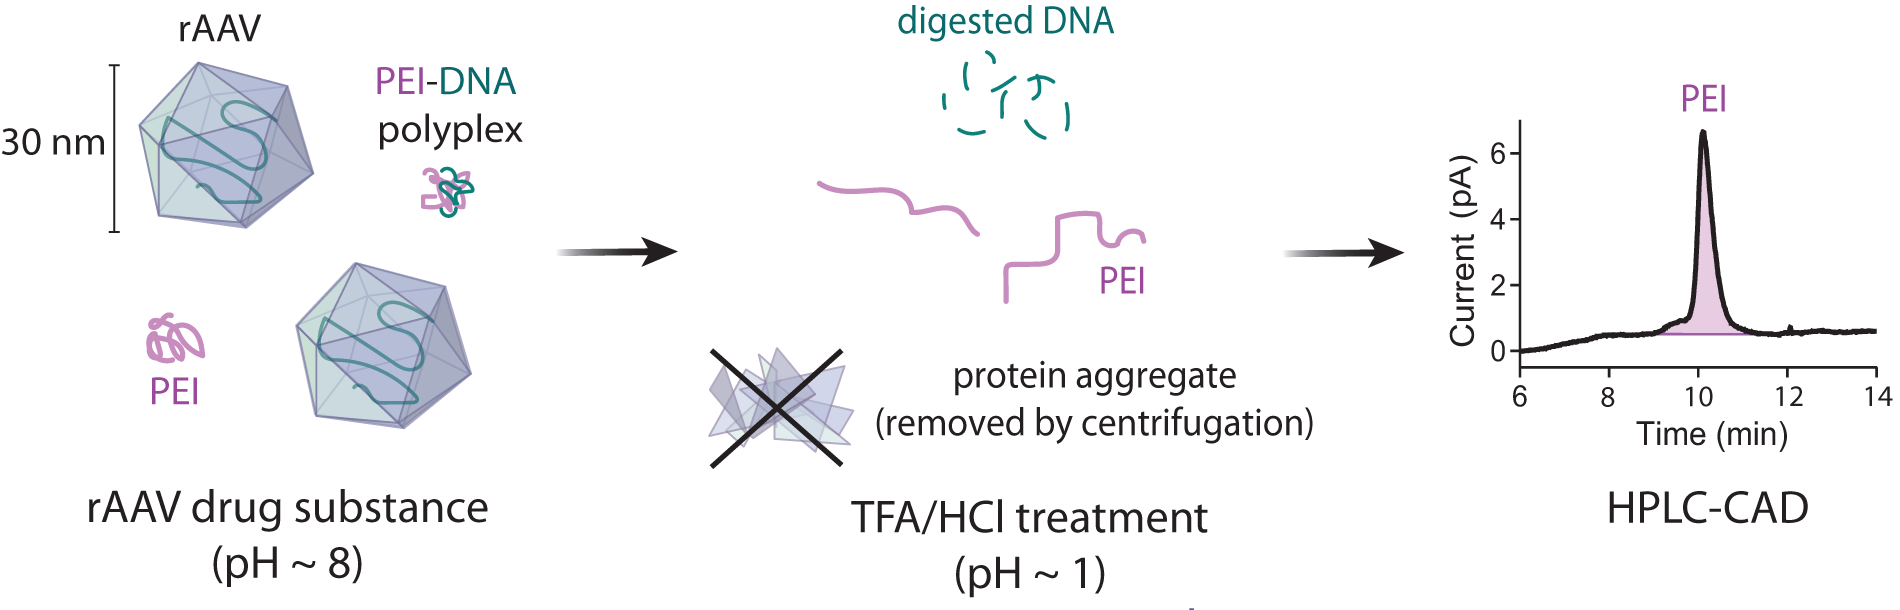
Schematic illustration of method. An rAAV sample, potentially containing PEI and/or PEI–DNA polyplexes, is treated with TFA and HCl. Upon acid treatment, PEI takes on a stable unfolded conformation,16–18 while DNA is hydrolyzed and capsid protein forms a precipitate. The protein precipitate is removed from the sample by centrifugation. PEI is then detected by HPLC-CAD. rAAV, recombinant adeno-associated virus; PEI, polyethylenimine; TFA, trifluoroacetic acid; HPLC-CAD, high-performance liquid chromatography with charged aerosol detection.
MATERIALS AND METHODS
Chemicals and reagents
Three rAAV DS samples (two rAAV8, denoted Sample 1 and Sample 2, and one rAAV9, denoted Sample 3) were produced in-house. All PEI standards and spiked samples were prepared with PEIpro transfection reagent (101000026, 1 mg/mL linear PEI in water) purchased from PolyPlus. LC-MS grade TFA (A116-50), acetonitrile (A956), and purified water (W8) were purchased from Thermo Scientific. Hydrochloric acid (5 N) (HCl, 5618–02) was purchased from J. T. Baker. Vehicle buffer, a custom Tris based vehicle buffer with additional chloride salts (pH 8.0), was purchased from Boston BioProducts.
Sample preparation
PEI standards
Standards with concentrations ranging from 5 µg/mL to 150 µg/mL PEI were prepared by serial dilution of PEIpro transfection reagent in vehicle buffer. Standards were further diluted in glass HPLC vials in a ratio of 14 volumes standard solution to 1 volume 5 N HCl to 5 volumes TFA. Acid-treated standards were kept at 10°C prior to injection.
rAAV sample preparation
rAAV samples with undiluted particle titers ranging from 1E14 to 3E14 particle/mL were treated with acid to separate the PEI from other sample components, as illustrated in Figure 1. Prior to acid treatment, samples were optionally spiked with up to 100 µg/mL PEI to assess recovery. Then, 14 volumes of sample were mixed with 1 volume 5 N HCl and 5 volumes TFA in a glass vial. Samples were then incubated at 60°C for 1 h in a bead bath (VWR, WB05), during which a precipitate formed in the vial. The sample and precipitate were transferred to a microcentrifuge tube, and the precipitate was removed by centrifugation for 3 min at 3,000 × g. The supernatant was transferred to a glass HPLC vial (Waters Total Recovery) and kept at 10°C prior to injection. Samples were injected within 24 h of preparation.
We emphasize the importance of incubation in glass vials because the high TFA concentrations are incompatible with plastic, especially at 60°C. Exposure to plastic vials was limited to <5 min at room temperature during the centrifugation step.
rAAV8 empty capsid preparation
A rAAV8 material produced via an Ultragenyx platform process was used as the starting material for the preparation of empty capsid using cesium chloride density gradient equilibrium ultracentrifugation. The starting material was loaded into 13.5 mL Quick-Seal tubes (Beckman-Coulter) with 0.49 g/mL cesium chloride and spun at 65,000 rpm (290,000 × g) in an Optima XE-90 ultracentrifuge with a Type 70.1 Ti fixed-angle rotor (Beckman-Coulter). The band corresponding to empty capsids was extracted with a syringe and buffer exchanged to vehicle buffer, with a final concentration of 2.2E14 particle/mL based on UV absorbance. The particle mass distribution was characterized using a Samux MP Auto mass photometer (Refeyn), confirming 96% empty content. Empty capsids were diluted to 1E14 particle/mL, and unspiked and PEI-spiked samples were prepared in TFA/HCl following the method used for the rAAV samples.
AAV genomic DNA extraction
Encapsidated DNA was extracted from Sample 2 by Proteinase K (Thermo Fisher Scientific, EO0491) digestion of the capsid followed by purification using the Monarch PCR and DNA Cleanup Kit (New England Biolabs, T1030L), with a final concentration of 450 ng/µL in TE buffer by UV absorption (equivalent to approximately 1E14 genome copies per mL). DNA was diluted 1:1 with vehicle buffer, and unspiked and PEI-spiked samples were treated with TFA/HCl following the method used for the rAAV samples.
Chromatography
Instrumentation
HPLC was performed on a Waters Alliance e2695 separations module with a quaternary pump (Milford, MA). Samples were analyzed by reverse-phase HPLC using a 50 × 4.6 mm XSelect CSH C18 column with 5 µm beads and 130 Å pore size (Waters, 186005287). A Thermo Scientific Corona Veo charged aerosol detector (Waltham, MA) was used for detection, with evaporator temperature set to 35°C and filter set to 3.6 s. UV absorbance of samples at 260 nm and 280 nm was also measured using a Waters 2998 photodiode array. Readouts from both detectors were collected at 10 Hz using Empower 3 software.
HPLC method
A 24-min gradient was adapted for HPLC from Socia and coworkers. 13 The gradient uses 0.2% v/v TFA in water as mobile phase A (MPA) and 0.2% v/v TFA in acetonitrile as mobile phase B (MPB). The flow rate was set to 0.4 mL/min and the column temperature was set to 60°C. For each 10 µL injection, the mobile phase composition was held at 95% MPA for 2 min and ramped to 47% MPA over the next 14 min, followed by a 2 min wash at 5% MPA and a 6 min re-equilibration at 95% MPA.
All standards and samples were injected in duplicate to minimize the total time for an experimental sequence. Bracketing standard injections were included at the beginning and end of the sequence. To assess repeatability during development, additional replicates were performed for select samples.
RESULTS AND DISCUSSION
Acid and heat treatment separates PEI from other sample components
Because interactions between PEI and other components of the rAAV sample can potentially interfere with quantitation, we explored sample preparations that would disrupt those interactions. TFA has been shown to disrupt the PEI–DNA polyplex and induce DNA hydrolysis. 13 We further lowered the pH with HCl to further break down capsid protein and DNA and enhance CAD detection by increasing the charge on PEI. We also incubated the sample at 60°C to accelerate degradation and reduce the time required for the measurement, removing any resulting precipitates by centrifugation. These steps were optimized to achieve accurate recovery of spiked PEI and good chromatographic performance, as described in Supplementary Data S2.
To determine the fate of each component during the sample preparation, pure samples of PEI, DNA, and protein were subjected to the acid and heat treatment. PEI was diluted from the stock solution, while DNA and empty capsids were purified from rAAV as described in the Materials and Methods. PEI is stable at low pH,16–18 and as expected, PEI solutions were not visibly affected by the acid treatment. DNA samples were cloudy immediately after adding TFA/HCl but became clear with no precipitate after heating for 1 h, suggesting that the DNA is broken down and the resulting products remain in solution. In contrast, visible aggregates formed in the empty capsid samples, and they were removed during the centrifugation step. We therefore believe that after our sample preparation, only PEI and digested DNA are present, as illustrated in Figure 1.
Standard curve
To convert the PEI peak area to PEI concentration in the sample, a standard curve representing PEI concentrations from 5 µg/mL to 150 µg/mL is run at the beginning of every sample set. PEI elutes as a single peak around 10 min, with no interference from nearby peaks, as shown in the representative chromatogram in Figure 2. CAD chromatograms of the full concentration range are shown in Supplementary Figure S3, demonstrating consistent elution times and clearly defined PEI peaks even at the lowest concentrations. The peak area is integrated from approximately 9 to 11 min, and PEI standards with concentrations as low as 5 µg/mL are consistently detected.
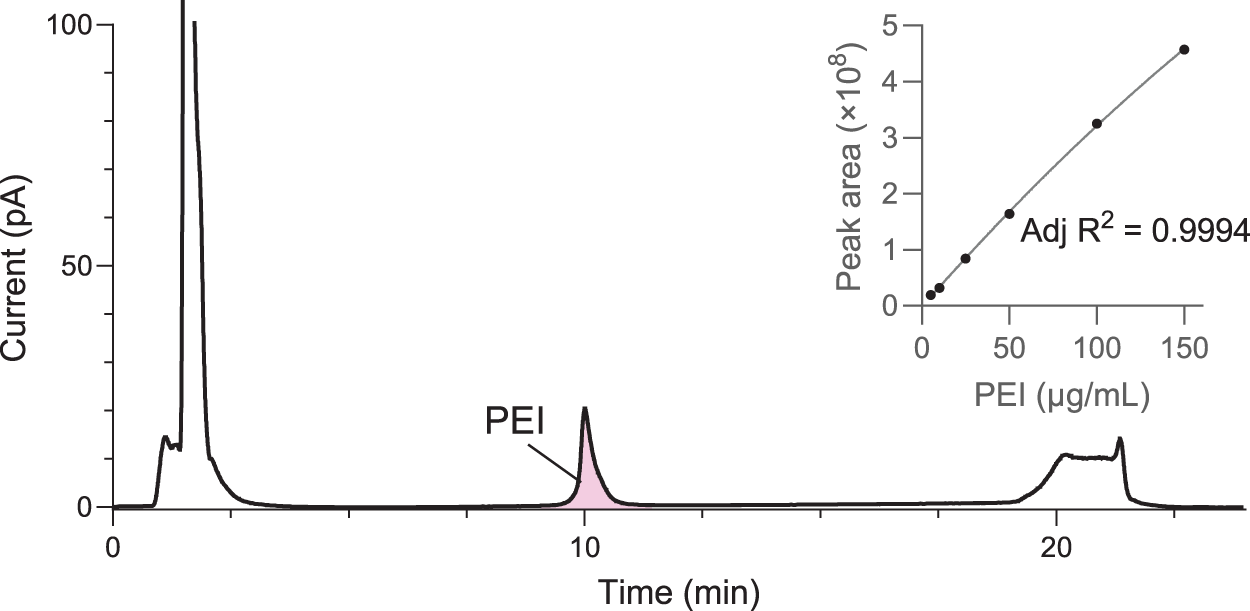
Standard curve with 5–150 µg/mL PEI. Representative CAD chromatogram of 150 µg/mL PEI standard, with PEI peak eluting around 10 min. The area corresponding to PEI is highlighted in pink. Inset shows standard curve and second-order polynomial fit for 5–150 µg/mL PEI standards. Duplicate standard injections exhibited only minimal differences in peak area.
Because the CAD responds nonlinearly to concentration, a second-order polynomial is fit to the standards. A representative standard curve is shown in the inset in Figure 2. The quadratic fit consistently achieves R2 > 0.99 (usually, R2 > 0.999), demonstrating linearity of this analytical method in this range.
Method performance in AAV samples
Because our rAAV samples do not contain a detectable level of PEI on their own, the chromatographic performance of the method is evaluated by spiking our rAAV with PEI. In a spiked sample treated with TFA and HCl as described in the Materials and Methods, PEI elutes around 10 min—the same retention time as the standards (Fig. 3). We do not observe peaks with this retention time in unspiked samples, buffer blanks (except minor carryover as described in Supplementary Data S4), or in the UV absorbance at 260 nm or 280 nm (see Supplementary Data S5 and Supplementary Fig. S4).
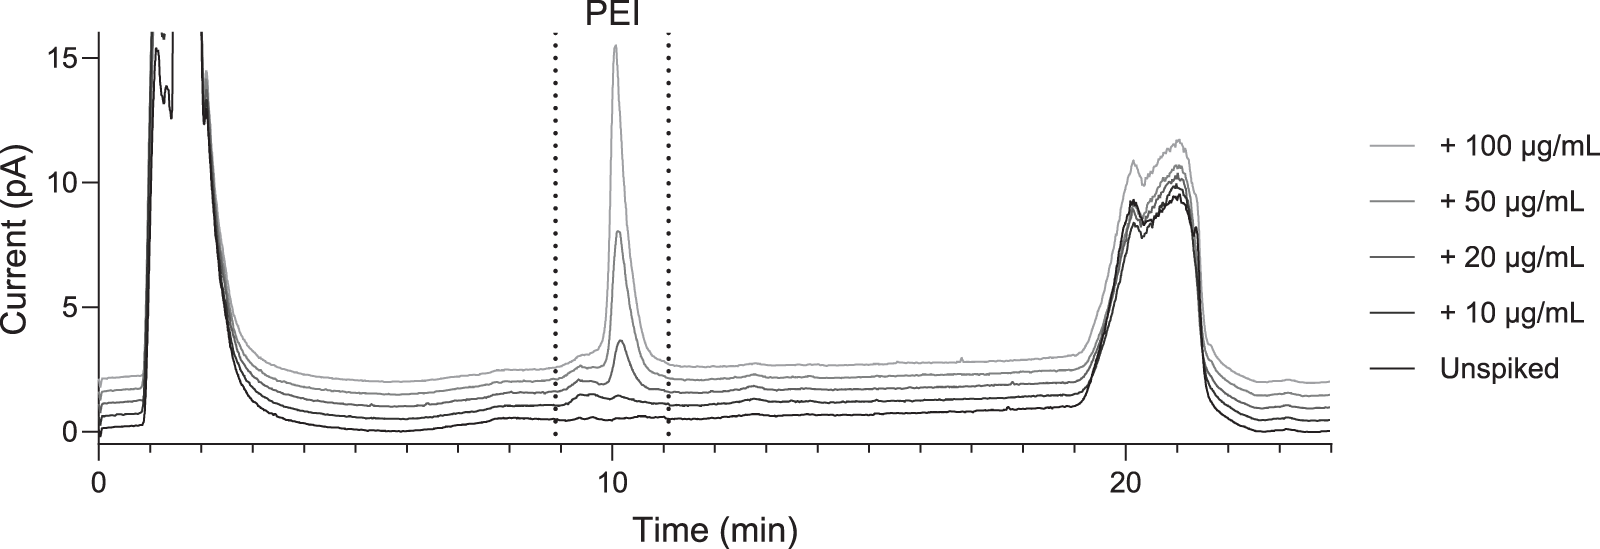
CAD chromatograms of Sample 1 spiked with up to 100 µg/mL PEI. Successive chromatograms are plotted with a 0.5 pA offset to avoid obscuring relevant features. The integrated area is shown between dashed lines.
In the spiked rAAV samples, we observe an early-eluting shoulder on the PEI peak that is not present in the standards. The identity of this shoulder was investigated and attributed to an interaction with hydrolyzed DNA, as discussed in the section entitled “Investigation of PEI–DNA interactions”. To quantify PEI, we integrate both the main peak and the shoulder, as indicated by dashed lines in Figure 3.
Evaluation of accuracy by spike-and-recovery
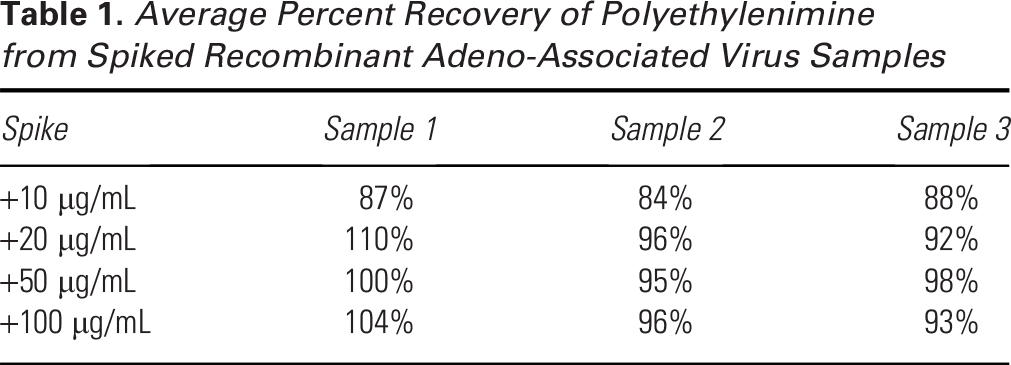
Three undiluted rAAV samples were spiked with 10–100 µg/mL PEI to assess the accuracy of the method by percent recovery. We note that a 5 µg/mL PEI spike could be detected (with a peak distinct from the baseline), but the PEI concentration could not be reliably quantified using the standard curve. Representative chromatograms spanning the full spiked concentration range are shown in Figure 3. Spiked PEI could be quantified with at least 84% recovery at ≥10 µg/mL, with recoveries approaching 100% at higher spike concentrations (Table 1).
Average Percent Recovery of Polyethylenimine from Spiked Recombinant Adeno-Associated Virus Samples
Effect of rAAV concentration
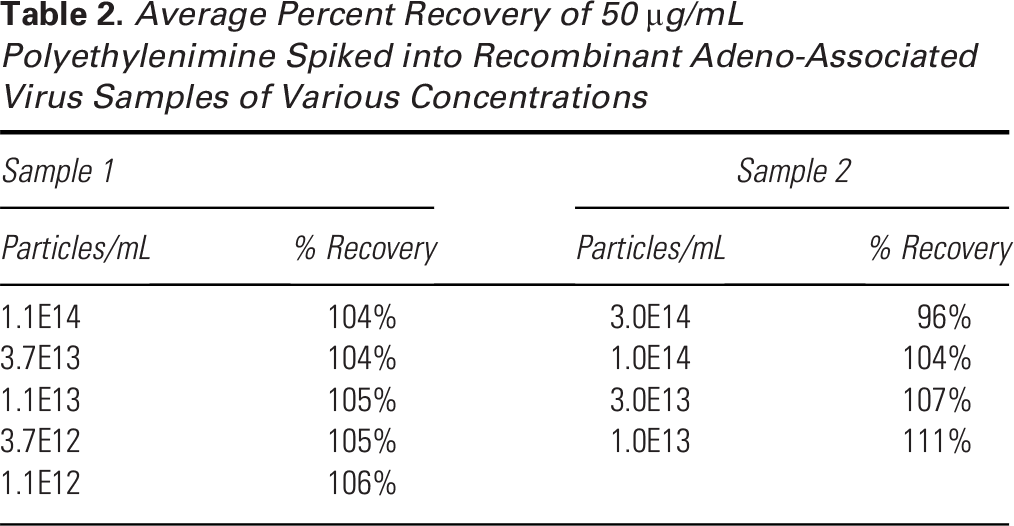
To understand how the rAAV concentration affects the accuracy of the method, Sample 1 and Sample 2 were diluted by up to two orders of magnitude and spiked with a constant PEI concentration of 50 µg/mL. Particle concentrations tested were as low as 1.1E12 particles/mL. Recovery was not significantly impacted by the particle concentration, remaining within 96%–111% throughout these experiments (Table 2). The consistent recoveries demonstrate the specificity of the method.
Average Percent Recovery of 50 µg/mL Polyethylenimine Spiked into Recombinant Adeno-Associated Virus Samples of Various Concentrations
Repeatability and intermediate precision
Repeatability was assessed by at least triplicate injections of Sample 2 spiked with various PEI concentrations. A 10 µg/mL PEI spike, representing the LOQ, produced a relative standard deviation (RSD) of 6.7%. Larger spike concentrations (20 µg/mL — 100 µg/mL) resulted in an RSD of ≤1.2%.
To assess intermediate precision, the method was also repeated several times by two different analysts. Analysts used different C18 columns from the same manufacturing lot. Each analyst prepared Sample 1 spiked with 10 µg/mL PEI and Sample 1 spiked with 50 µg/mL PEI and performed duplicate injections of each following the method protocol. These experiments were then repeated on different days, resulting in eight injections for each spiked concentration. Intermediate precision is represented by the RSD of all eight injections, which for the 10 µg/mL spike was 17.3%, and for the 50 µg/mL spike was 8.1%.
Investigation of PEI–DNA interactions
While PEI standards elute as a single peak around 10 min (see Fig. 2), spiked rAAV samples exhibit an additional shoulder eluting before the main PEI peak, around 9 min. Concurrent UV detection shows a low level of 260 nm and 280 nm absorption in this region (Supplementary Fig. S4). The source of the earlier-eluting shoulder is investigated further.
Unspiked and PEI-spiked rAAV8 DNA and empty capsid samples were prepared to determine if the shoulder arises from interaction with DNA or protein. We believe the sample contains DNA hydrolysis products after acid treatment, as detailed in the section entitled “Acid and heat treatment separates PEI from other sample components,” which could interact with PEI and affect its migration. It is also possible that protein breakdown products that are not removed by centrifugation remain in solution. Therefore, 50 µg/mL PEI was spiked into DNA and empty capsid samples and the resulting chromatograms compared with 50 µg/mL PEI-spiked Sample 2 (Fig. 4).
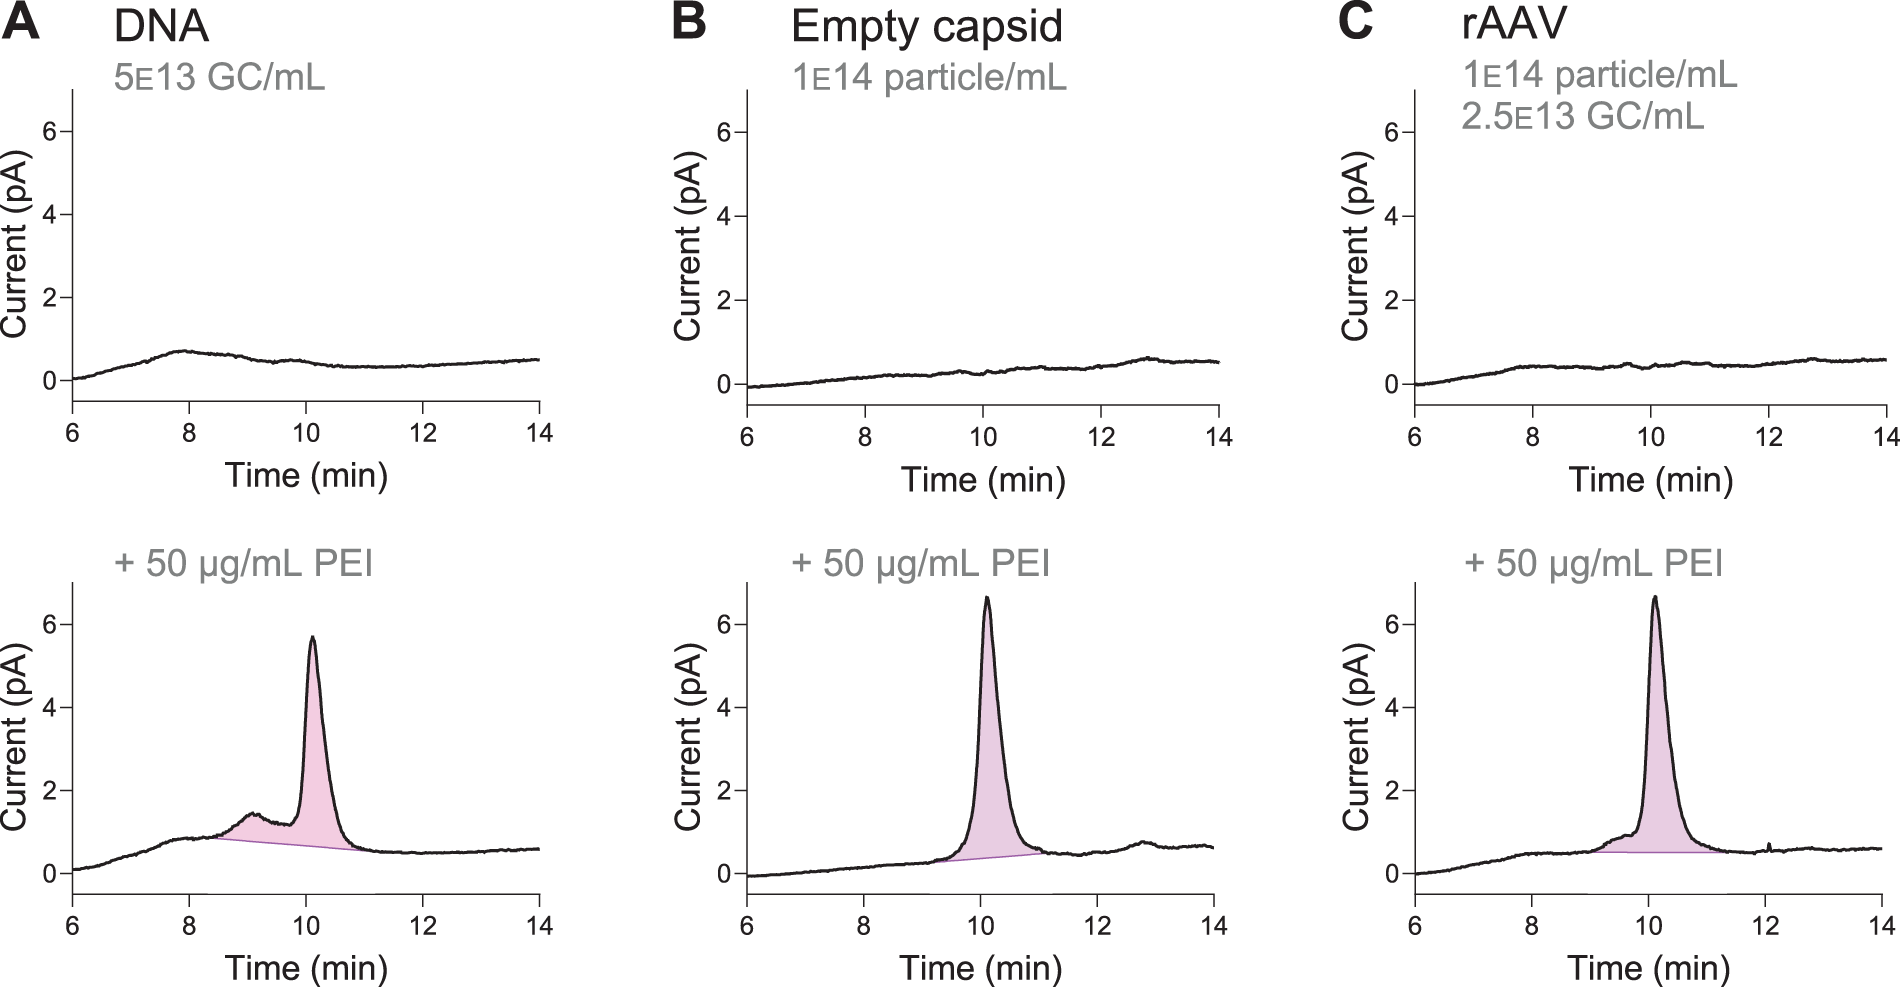
PEI–DNA interactions create an earlier-eluting shoulder. The CAD chromatograms shown are zoomed into the region where the PEI peak elutes. Purple highlighted regions indicate the integrated area for quantification.
A comparison of the PEI peaks suggests that PEI–DNA interaction produces the shoulder. Whereas the empty capsid sample exhibits only the main PEI peak at 10 min, the PEI-spiked DNA sample has a prominent earlier-eluting peak. Therefore, we hypothesize that PEI–DNA interactions create the earlier peak, while PEI-protein interactions do not. The spiked rAAV sample also exhibits an earlier-eluting shoulder. This shoulder in the PEI-spiked rAAV sample (Fig. 4C) is smaller than the shoulder in the PEI-spiked DNA sample (Fig. 4A), likely due to differences in the absolute DNA concentration.
We do not expect the hydrolyzed DNA to contribute significantly to the PEI signal. DNA elutes broadly between 6 and 11 min, while the early-eluting shoulder, hypothesized to be a DNA-interacting portion of the PEI, exhibits a comparatively narrower range. Based on the UV absorption shown in Supplementary Figure S4, the DNA is present at low concentrations (estimated <100 ng/mL). Furthermore, because it elutes broadly rather than in a sharp peak, any contribution to the CAD signal is interpreted as baseline and not included in the integration.
Therefore, both the main peak and the shoulder are integrated together to quantify the PEI in the sample where applicable (see highlighted areas in Fig. 4). With this integration method, we achieved 97% recovery of a 50 µg/mL spike in the pure DNA samples, 101% recovery in the empty capsid samples, and 97% recovery in the rAAV samples. The consistent recovery suggests that the CAD signal in the shoulder comes primarily from PEI, and the total PEI area is not impacted by the presence of hydrolyzed DNA.
CONCLUSIONS
A new method for residual PEI quantification in rAAV samples has been developed and tested on rAAV8 and rAAV9. We emphasize the importance of addressing PEI–DNA interactions when quantifying residual PEI in such samples. The assay uses CAD for PEI detection, with DNA hydrolysis and protein precipitation in acid to minimize interference of these components with the PEI signal. Although the hydrolyzed DNA remains in solution and can interact with PEI, we have determined that it does not affect the measured PEI concentration, which is consistently accurate across a wide range of PEI and rAAV concentrations. The method was tested on spiked PEI concentrations ranging from 10 to 100 µg/mL and rAAV concentrations ranging from 1.1E12 to 3.0E14 particles/mL, consistently achieving acceptable recoveries. The protocol is straightforward and relatively quick (<3 h prep time) and has been tested by multiple analysts, confirming its reproducibility and recovery results. While we explored linear PEI quantification in rAAV DS, the method is likely applicable to different types of PEI and to rAAV in-process samples. We believe this method will be useful for detecting PEI in AAV gene therapy drugs, and potentially in other viral and non-viral gene therapy fields where samples contain multiple components.
AUTHORS’ CONTRIBUTIONS
A.W.P.: Conceptualization; methodology; investigation; visualization; writing—original draft; writing—review and editing. S.N.: Conceptualization; methodology; validation; writing—original draft; writing—review and editing. N.N.: Investigation. E.C.: Investigation. X.L.: Supervision; writing—review and editing. J.W.: Funding acquisition; writing—review and editing. J.S.P.: Supervision; core intellectual work (original idea and conceptualization); methodology; writing—original draft; writing—review and editing.
Footnotes
ACKNOWLEDGMENTS
The authors are grateful to the Pilot Plant team in the Global CMC Development Department at Ultragenyx Pharmaceutical for generating the rAAV material used in this study. The authors thank Shaofeng Wang, Lauren Paolini, and Kevin Luongo for their invaluable suggestions regarding sample preparation.
FUNDING INFORMATION
This work was funded by Ultragenyx Pharmaceutical.
AUTHOR DISCLOSURE
The authors of this work are employees of Ultragenyx Pharmaceutical. Several authors are shareholders of Ultragenyx Pharmaceutical.
Supplemental Material
References
Supplementary Material
Please find the following supplemental material available below.
For Open Access articles published under a Creative Commons License, all supplemental material carries the same license as the article it is associated with.
For non-Open Access articles published, all supplemental material carries a non-exclusive license, and permission requests for re-use of supplemental material or any part of supplemental material shall be sent directly to the copyright owner as specified in the copyright notice associated with the article.