
Abstract
This study aimed to evaluate the intensity and characteristics of pain, which was assessed at home by children with cancer or their parents using an app for mobile devices, for a 1-month poststudy enrollment. The participants of this observational prospective study were outpatients at the hematology/oncology department of an academic hospital in Italy, aged between 0 and 21 years, and receiving hospital-at-home care. Patients or their parents were asked to assess pain levels for one month at home using the Faces, Legs, Arms, Cry, and Consolability (FLACC) scale for patients aged <4 years and the Ospedale Pediatrico Bambino Gesù (OPBG) tool for patients aged 4 to 21 years. At study conclusion, parents were asked to complete a survey about their satisfaction with the app and to rate their child’s health in general, pain intensity, and frequency in the past 4 weeks. Of the 124 participants using the app, 94 (75.8%) reported pain (≥1) at least once during the 1 month. Of these, 53 (56.4%) at most reported mild pain, 33 (35.1%) moderate pain, and eight (8.5%) severe pain. The abdomen was identified as the most frequent (56.3%) pain site by patients aged 4 to 21 years. The child’s maximum pain intensity during the study period was negatively correlated with the parent’s report of the child’s health during the past month (r = −.29, p < .01). Most of the participants were satisfied with the app and the information received about app usage. In conclusion, the app facilitated pain assessment and tracking in patients receiving hospital-at-home care.
Introduction
The incidence of cancer, including leukemia, lymphomas, and central nervous system tumors (Lanzkowsky et al., 2016; Steliarova-Foucher et al., 2017), is increasing in children and adolescents (Smith et al., 2010; Steliarova-Foucher et al., 2018) but the 5-year overall survival rate is more than 80% (Lanzkowsky et al., 2016). Regardless of whether chemotherapy is administered in the inpatient or ambulatory setting, a structured follow-up is necessary throughout the cancer trajectory (Leahy et al., 2018). Since patients are still facing physical and emotional concerns between visits to the clinical setting, parents are tasked with recognizing and responding to the child’s symptoms, including pain, at home (Darcy et al., 2019; Toruner & Altay, 2018). To ensure continuity of care and improve symptom management, it is important to promote accurate symptom monitoring at home and facilitate patients/parents in reporting their symptoms over time (Leahy et al., 2018).
In particular, pain in children and adolescents affected by hematologic or solid tumors can be highly distressing (Skeens et al., 2019; Tutelman et al., 2018a) and account for one of the most difficult aspects of their entire experience (Ang et al., 2018; Griffiths et al., 2011). Pain may result not only from primary cancer and/or metastasis but also from treatment procedures and side effects (Bukola & Paula, 2017; Duffy et al., 2019; Twycross et al., 2015). In other cases, pain is associated with end-stage or terminal disease (Snaman et al., 2016; Ye et al., 2019).
Regardless of the underlying cause, many children and adolescents with cancer experience pain at home (Duran et al., 2019), which can undermine their ability to perform age-appropriate activities (Linder & Hooke, 2019). Pain can severely affect the quality of life of the entire family (Van Schoors et al., 2018), who is already distressed by a sense of loss and turmoil ever since the cancer diagnosis (Mu et al., 2015). At home, parents are largely responsible for the management of their child’s pain (Walco, 2008), and it is crucial for them to recognize when it is appropriate to administer pain medications. However, few data have been reported on pain management in the home setting, which remain understudied (Fortier et al., 2014; Van Cleve et al., 2004). In addition, instruments to support parents in assessing and tracking pain should be developed further.
Health care providers should support parents and adolescents to adequately recognize, assess, and treat pain. In particular, nurses should provide parents with education about pain assessment at home to empower them to adequately manage pain (Bettle et al., 2018). In the past decades, the role played by technology has been increasingly recognized for enhancing health outcomes (Fedele et al., 2017). Specifically, apps for mobile devices were found to have great potential in facilitating the tracking of pain at home in children with cancer (Fortier et al., 2016; Reynoldson et al., 2014; Wallace & Dhingra, 2014). Health apps are considered useful not only by health professionals (Kessel et al., 2016), but pediatric patients with cancer, especially adolescents, also seem to perceive pain apps as appealing, easy to use, and acceptable (Jibb, Cafazzo, et al., 2017; Jibb et al., 2018). Although apps seem promising in improving pain-related outcomes for pediatric patients with cancer (Fortier et al., 2016; Jibb, Stevens, et al., 2017), the benefits of apps for pain assessment, tracking, and management remain unclear (Lalloo et al., 2017).
To facilitate tracking reports of pain at home in pediatric patients with hematologic or solid tumors receiving hospital-at-home care (Hansson et al., 2011), nurses provided patients and their parents with an app to support them in tracking pain at home. Therefore, the aims of this study were to (a) evaluate the incidence, intensity, and characteristics of pain in children and adolescents with hematologic or solid tumors in the home setting for one month poststudy enrollment; (b) investigate the use of an app for pain assessment and participant’s satisfaction with it; and (c) examine the associations between pain intensity and the participants’ sociodemographic and clinical characteristics.
Method
Design, Setting, and Participants
An observational prospective study was conducted in the hematology/oncology department of a children’s hospital in Rome, Italy, from April to December 2017. Health professionals working in the hematology/oncology department provided hospital-at-home care through home visits for about 90 patients per week and 60 new patients per year. Criteria to receive these visits were (a) place of residence, even temporarily, in the urban area of Rome and (b) patients requiring blood sampling, antibiotic therapy and other intravenous drugs, management of vascular access devices, parenteral nutrition, blood transfusion, and pain therapy. The hospital protocols were implemented, including the one mandating adjustment of analgesic therapy in case of pain ≥4.
To enroll a wide variety of patients who could benefit from tracking reports of pain at home, among those receiving hospital-at-home care, the inclusion criteria for participants were (a) being aged between 0 and 21 years, which is the upper age that is treated in our facility; (b) being treated for a hematological malignancy or solid tumor; (c) being outpatients at the hematology/oncology department of the hospital where the study was conducted; (d) being able to understand Italian; and (e) having a smartphone or tablet to download the app for pain assessment.
Ethical Considerations
Approval for this study was obtained by the ethics committee of the hospital where the study was conducted. Research nurses explained the aims and study procedure to parents and adolescent patients and asked them to sign a consent form, while an assent was obtained from patients aged 10 to 17 years. To ensure anonymity, participants received a code number corresponding to the hospital identification number to use during the app configuration process. Through the codes, the researchers could track the participants’ names.
Instruments
Patients or their parents were asked to assess the level of pain at home using the Faces, Legs, Arms, Cry, and Consolability (FLACC) scale (Merkel et al., 1997) for patients aged <4 years and the Ospedale Pediatrico Bambino Gesù (OPBG) tool for patients aged between 4 and 21 years, in line with the hospital protocol. The OPBG tool was based on the Numeric Rating Scale (von Baeyer et al., 2009), the Faces Pain Scale-Revised (Hicks et al., 2001), the Coloured Analogue Scale (McGrath et al., 1996), and the Visual Analogue Scale (Revill et al., 1976). Pain assessed through the FLACC and the OPBG tool ranged between 0 and 10, with higher values indicating more severe pain. For the purpose of this study, pain intensity was defined as follows: mild (1-3), moderate (4-6), and severe (7-10). Participants could also communicate the absence of pain (score = 0).
Satisfaction with the use of the app and the information provided about its use was investigated using a researcher-developed questionnaire including nine items ranging from 1 = not at all satisfied to 6 = completely satisfied with also the not applicable option. There was also an item about their overall opinion of the app, ranging from 1 = very poor to 10 = excellent.
In addition, parents were asked to rate their child’s health and pain experience using three items: one about health in general ranging from 1 = poor to 5 = excellent, one about pain intensity “How much pain has your child experienced in the past 4 weeks?” ranging from 0 = none to 5 maximum pain, and another one about pain frequency “How often has your child experienced pain in the past 4 weeks?” ranging from 0 = never to 5 = every day.
Sociodemographic and clinical characteristics were collected together with the satisfaction survey.
The App and Its Development
The FLACC and the OPBG tool were integrated into an app for mobile devices (smartphones or tablets) named “pain assessment,” which patients could download free of charge from Apple/Android stores. After configuration, the app automatically showed the age-appropriate scale to assess pain. In particular, the app programmed with the OPBG tool showed a smiling face of a child at zero: sliding from left to right the face gradually changes expression until it becomes a crying face at the score of 10 (Figure 1). The facial expression changes at each of the 11 points of the Numeric Rating Scale.
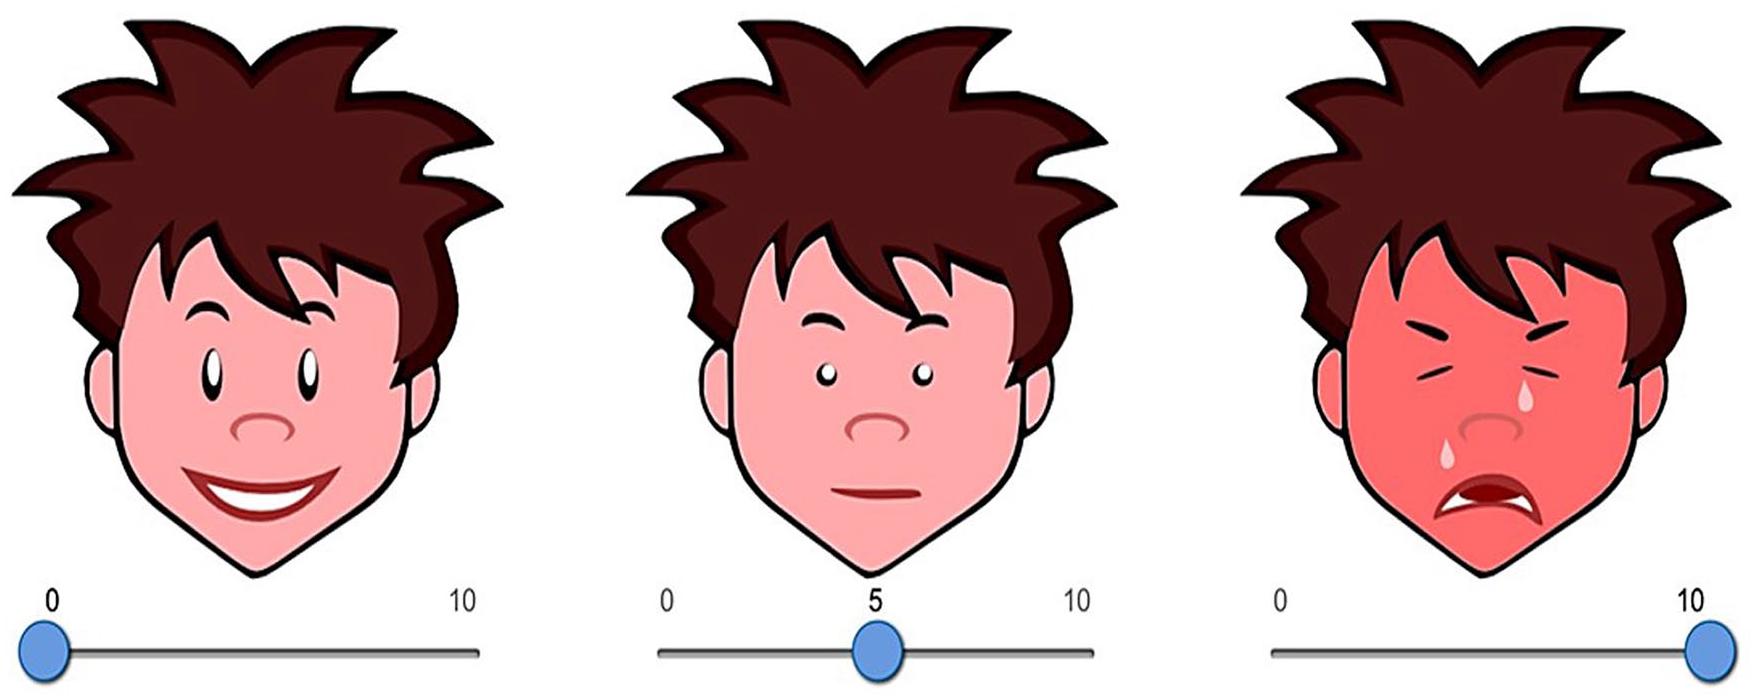
The app programmed with the Ospedale Pediatrico Bambino Gesù (OPBG) tool.
A date/time stamp was generated as patients/parents completed entries and data sent through the app were directly saved on an open-source database, which was not connected to the hospital web network but could be accessed only by the research nurses. If on the OPBG tool pain was ≥4, which separates mild pain from moderate/severe pain, the app asked participants to describe their pain characteristics by selecting one or more descriptors of the type of pain, including “pulsating,” “oppressing,” “cramp,” “burning,” “pungent,” or “itching.”
The app was developed by a group of nurse researchers including a computer scientist, who created the faces of the OPBG tool. The team of developers started from a version of the app that was previously created in the same hospital to assess postoperative pain (Tiozzo et al., in press). To adapt the app to patients with cancer, we conducted a focus group with pediatric oncology nurses and interviews with adolescents with cancer and their parents. App revisions were made to address each issue, such as adding the figure of a child’s body divided into regions to indicate the pain location. A feasibility pilot study was then conducted, showing that the app was appealing and not bothersome to complete.
Procedure
Research nurses invited eligible participants to take part in the study during outpatient visits in the day hospital unit. A convenience sample of patients who met the inclusion criteria was enrolled. After enrollment, research nurses taught parents and patients aged 4 to 21 years about the importance of pain monitoring, pain characteristics, and manifestations, as well as how to use the age-appropriate scale to assess the intensity of pain when it occurred at home. Children younger than 4 years were present during the session but did not receive any specific training, because we asked their parents to complete the FLACC tool. Research nurses provided examples of pain experiences and used the teach-back method to evaluate competency. This was done to empower participants in performing pain assessment at home. Participants were taught how to download and use the app. Paper instructions about the functioning of the app were also provided.
Research nurses asked pediatric patients or their parents to assess pain intensity every day using the app up to 1 month after enrollment, as many times as possible. The choice of whether the patient or the parent completed the pain assessment could be made and recorded by participants at each pain report, based on the patient’s age and family preferences. For example, a parent may decide to assess the pain instead of the adolescent in case of severe developmental delay or disabilities. To elicit pain assessment, three reminders (after 24 hours, after 5 days, and after 1 month from enrollment) were installed in the user’s calendar when the app was initially configurated. On follow-up, 1 month after enrollment, parent participants were asked to complete the survey about their satisfaction with the app and to rate their child’s general health, pain intensity, and pain frequency using three specific items. We decided to ask parents about their child’s health rather than patients themselves because the follow-up was aimed at investigating parents’ opinions, which were considered relevant in light of their responsibilities in pain management at home.
The app served as an electronic platform for delivering the two pain assessment measures, the FLACC and OPBG tool, and then transmitting the date/time stamped scores to the study database. To track pain reports, the study database was constantly monitored by a research nurse, who received automatic alerts when pain scores ≥4 were recorded. When this occurred, the research nurse would then phone the parent participants and ask about the patient’s health status. In case of severe (≥7) or persistent (≥3 reports) pain, the research nurse would inform a clinical nurse. In any case, research nurses were not allowed to provide clinical suggestions to parents/patients. Therefore, they preventively invited parents to call the telephone number of the hematology/oncology unit provided in the discharge letter in case of pain ≥4.
Data Analysis
The participants’ characteristics were examined using descriptive statistics (mean, standard deviation [SD], median [Mdn], interquartile range [IQR], frequency, and percentage). Data transmitted and collected during the 1-month period were analyzed, and pain incidence, intensity, and characteristics were evaluated in participants who used the app at least once. The maximum pain level reported in 1 month was computed for each participant as the highest pain intensity score (ranging 0-10) rated through the app during the 1-month period using the FLACC or the OPBG tool. The associations between pain intensity and the characteristics of participants were examined through the t-test, Fisher’s exact test, or the univariate analysis of variance.
Patient health and pain at follow-up was correlated with the maximum pain score using Spearman’s rank correlation coefficient. SPSS Version 22 (IBM Corp) was used for statistical analysis.
Results
Participants’ Characteristics
Among the 144 participants who were enrolled in the study, 124 (86.1%) used the app at least once during the 1-month poststudy enrollment. Their characteristics are shown in Table 1. Most participants were male (n = 74, 59.7%), Italian (n = 109, 87.9%), and diagnosed with hematological malignancies (n = 92, 74.2%). Their median age was 8 years (IQR = 3.9-13.8; M = 9.1, SD = 5.4; range = 0-21). The most frequently used scale was the OPBG tool (n = 91, 73.4%), and pain was rated slightly more often by the patients (n = 68, 54.8%). Among those aged 4 to 21 years, patients who directly assessed their own pain were 74.7% (n = 68/91). In particular, they were 51.7% (n = 15/29) of those aged 4 to 8 years, 73.1% (n = 19/26) of those aged 8 to 13 years, and 94.4% (n = 34/36) of those aged 13 to 21 years.
Patient Characteristics (n = 124).
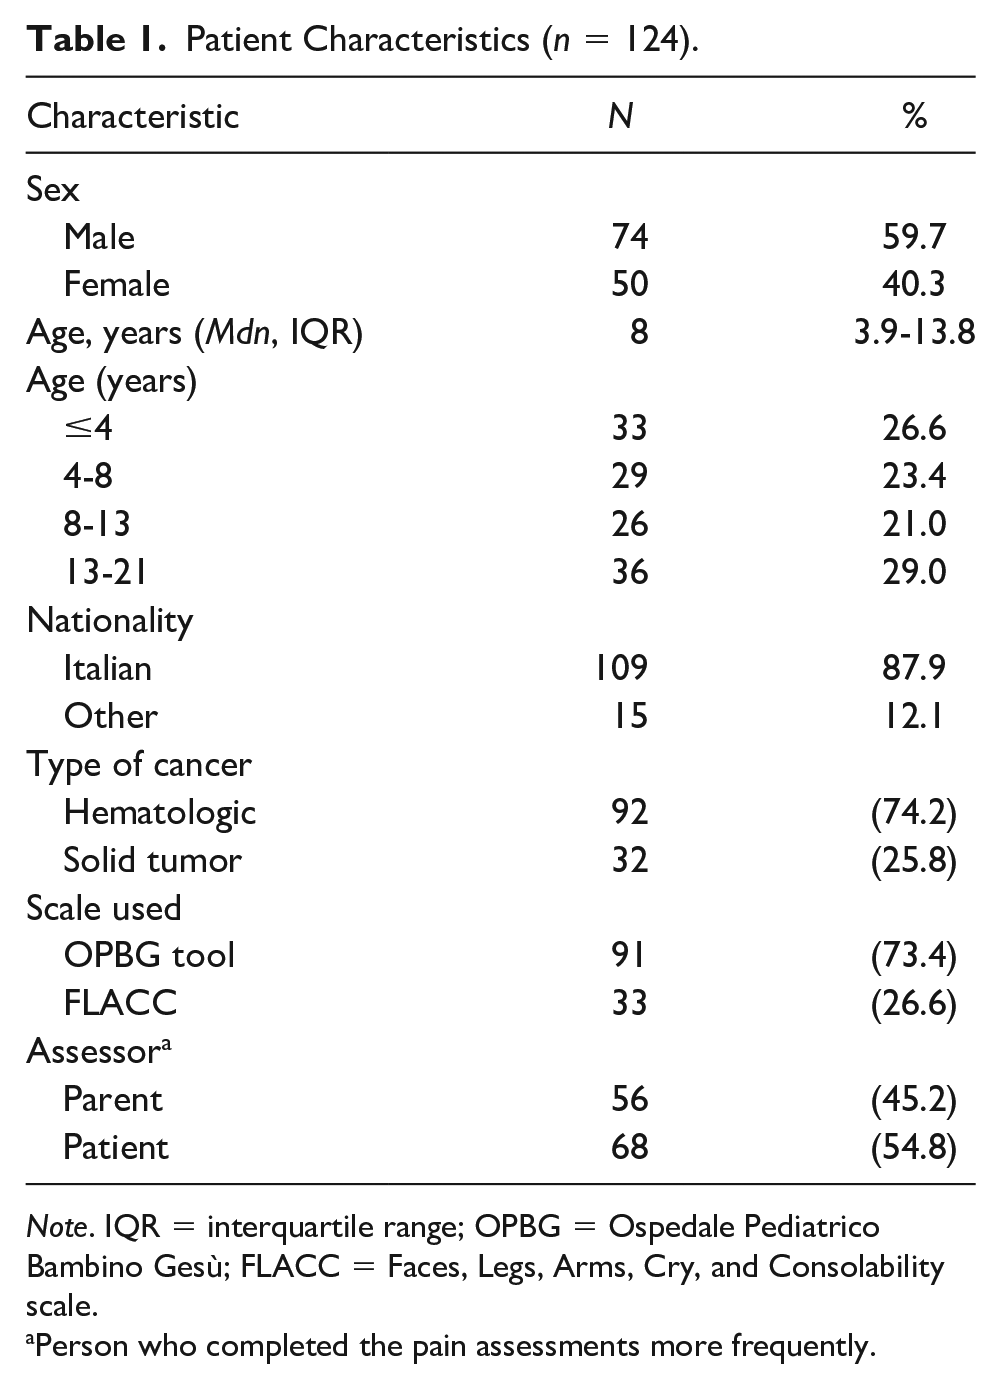
Note. IQR = interquartile range; OPBG = Ospedale Pediatrico Bambino Gesù; FLACC = Faces, Legs, Arms, Cry, and Consolability scale.
Person who completed the pain assessments more frequently.
Use of the App
Overall, 124 participants used the app at least once in a month and 1,117 reports were collected. The number of times the app was used during the study period is shown in Figure 2. The median number of times the participants used the app was 6 (M = 9.03, SD = 6.79; range = 1-28). Notably, the app usage frequency was positively correlated with the presence of pain (r = .286, p = .001) and maximum pain in 1 month (r = .311, p < .001), indicating that patients who reported pain at least once in a month used the app more often than those who never reported pain (Mdn = 8, IQR = 5-16; vs. Mdn = 4, IQR = 2-7; p = .002). In particular, of the eight patients who experienced severe pain, two used the app 3 times, one used it 4 times, one used it 5 times, one used it 7 times, one used it 9 times, one used it 10 times, and one used it 14 times.
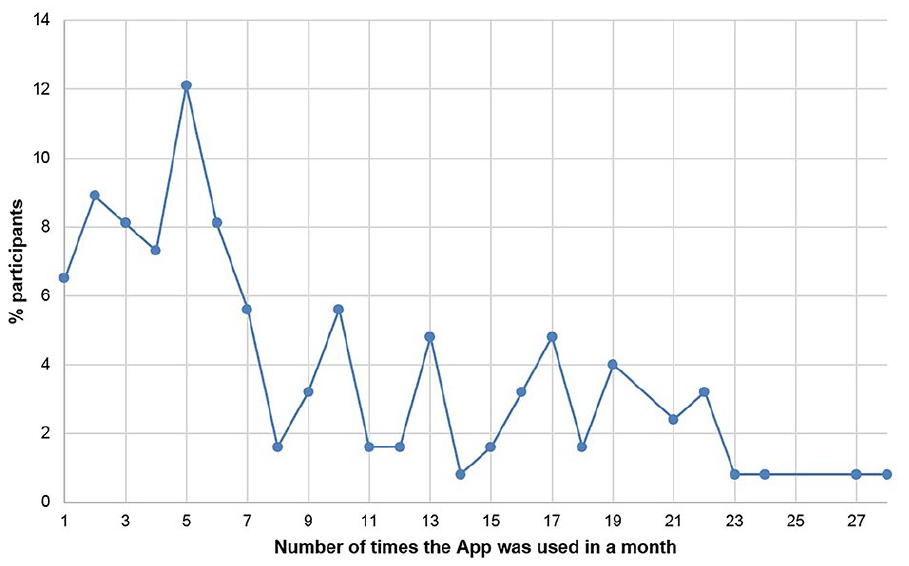
Number of times the app was used in 1 month (n = 124).
Pain Levels
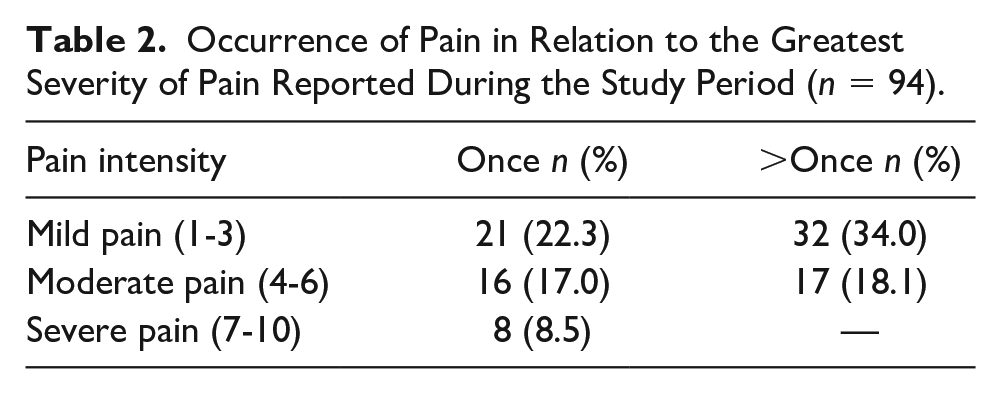
Of the 124 participants using the app, 30 (24.2%) had never reported pain (score = 0) during the 1-month poststudy enrollment, of which 6 had their pain assessed through the FLACC and 24 through the OPBG tool. The maximum pain levels in 1 month reported through the FLACC and the OPBG tool are shown in Figure 3. Of the 94 (75.8%) participants reporting pain at least once in a month, 28 (29.8%) had their pain assessed through the FLACC and 66 (70.2%) through the OPBG tool. Among those who reported pain at least once in a month, 53 (56.4%) of participants reported at most mild pain, 33 (35.1%) moderate pain, and 8 (8.5%) severe pain. The occurrence of pain in relation to the greatest severity of pain reported during the study period is shown in Table 2. Among the 94 patients who reported pain, 45 (47.9%) had pain only once in a month and 49 (52.1%) more than once. Among the 1,117 reports collected, the presence of pain (≥1) was reported in 437 (39.1%): 333 (29.8%) mild, 88 (7.9%) moderate, and 16 (1.4%) severe pain.
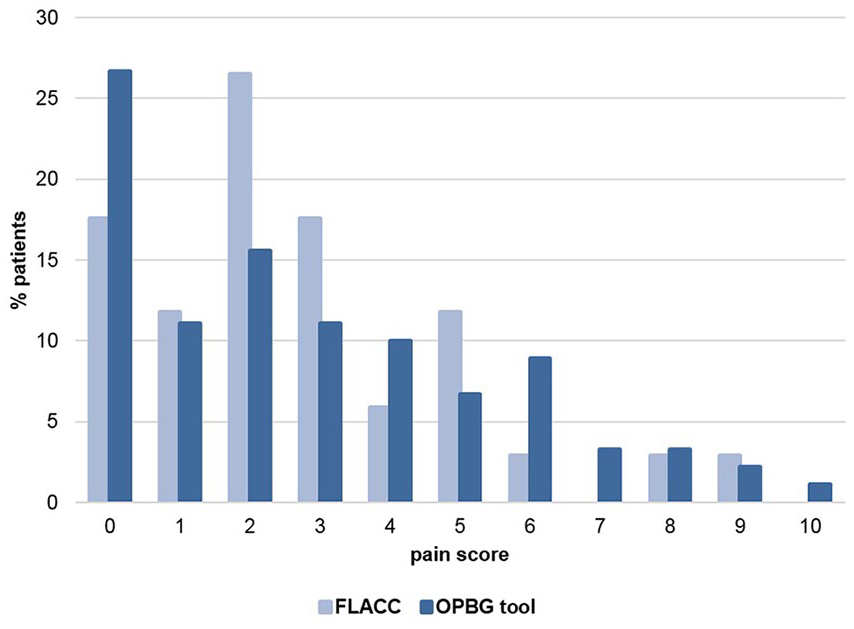
Maximum pain scores using FLACC and OPBG tool reported during the 1-month poststudy enrollment period.
Occurrence of Pain in Relation to the Greatest Severity of Pain Reported During the Study Period (n = 94).
Pain Characteristics
Among the participants who had their pain assessed by their parents through the FLACC (n = 34, 27.4%), pain was observed from crying (n = 24, 70.6%), consolability (n = 24, 70.6%), face (n = 18, 52.9%), legs (n = 11, 32.4%), and arms (n = 9, 26.5%). Among those who used the OPBG tool and reported pain ≥4 (n = 35, 28.2%), pain was described as pulsating (n = 17, 48.6%), oppressing (n = 13, 37.1%), cramp (n = 13, 37.1%), burning (n = 11, 31.5%), pungent (n = 7, 20.1%), or itching (n = 6, 17.2%). In addition, 32/35 (91.4%) patients of those who reported pain ≥4 through the OPBG tool used the option of localizing pain to regions of the body. Pain was located in the patient’s abdomen (n = 18, 56.3%), legs (n = 10, 31.3%), chest (n = 11, 34.4%), back (n = 11, 34.4%), coccyx (n = 8, 25%), head (n = 7, 21.9%), mouth (n = 6, 18.8%), shoulders (n = 5, 1.6%), feet (n = 5, 1.6%), nape (n = 4, 12.5%), temples (n = 3, 9.4%), eyes (n = 1, 3.1%), and ears (n = 1, 3.1%). Higher pain intensity was associated with mouth (r = .476, p = .006) and ears (r = .445, p = .011).
Pain According to Patient Characteristics
The occurrence of pain (at least once ≥1) was examined for differences based on patient characteristics. No significant difference was found (Table 3).
Pain Occurrence by Participant Characteristics.
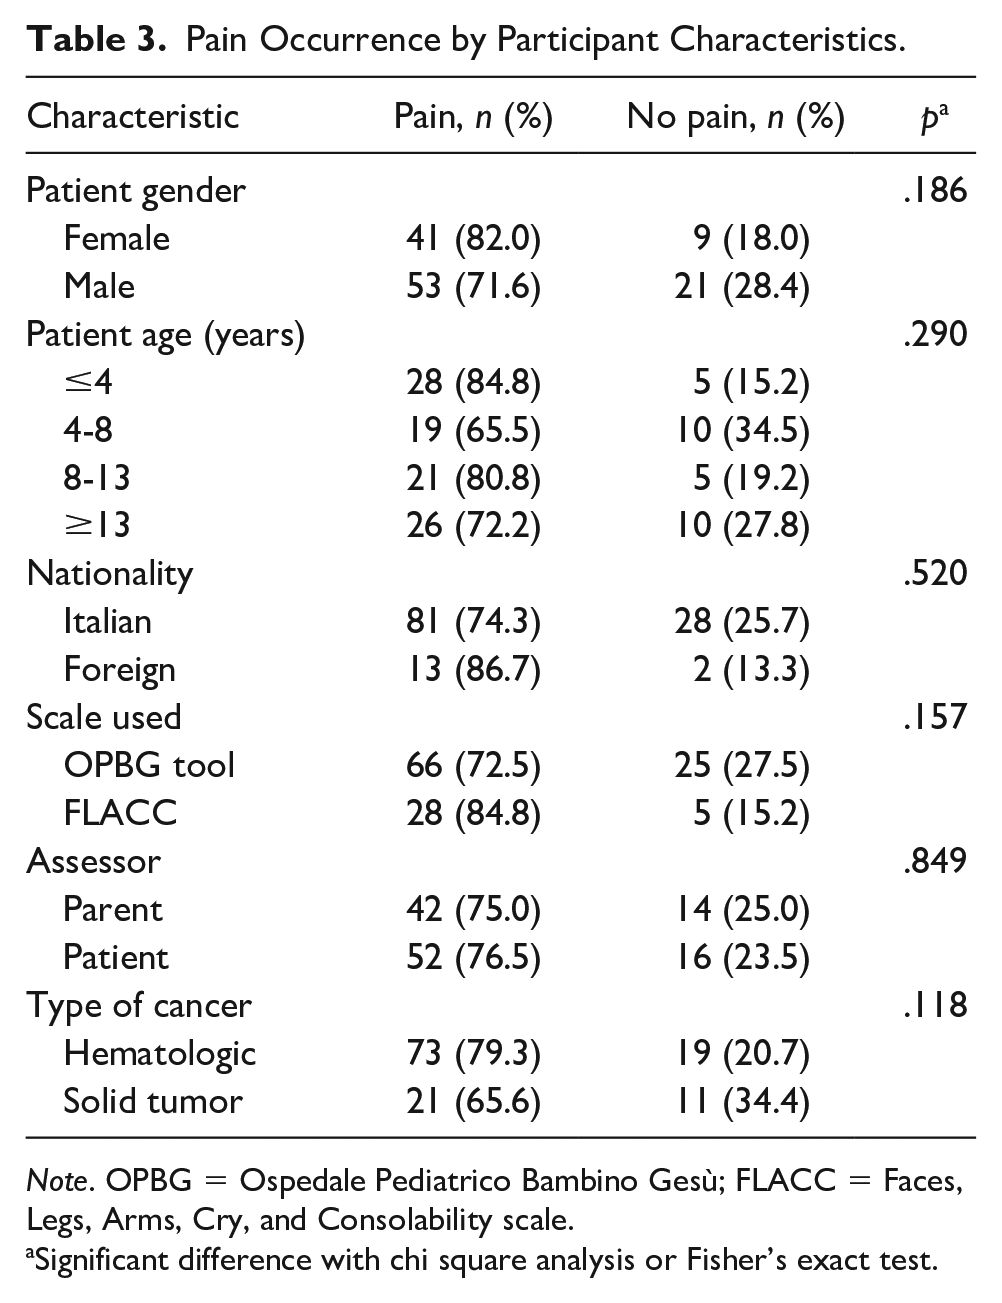
Note. OPBG = Ospedale Pediatrico Bambino Gesù; FLACC = Faces, Legs, Arms, Cry, and Consolability scale.
Significant difference with chi square analysis or Fisher’s exact test.
Follow-Up and Associations
After the 1-month poststudy enrollment period, 120/124 (96.8%) parents completed the follow-up survey. Most of them were satisfied with the app, and the information they had received about app usage (Figure 4). Their overall opinion of the app, on a scale from 1 = very poor to 10 = excellent, was on average 8.66 (SD = 1.36), indicating a positive opinion.
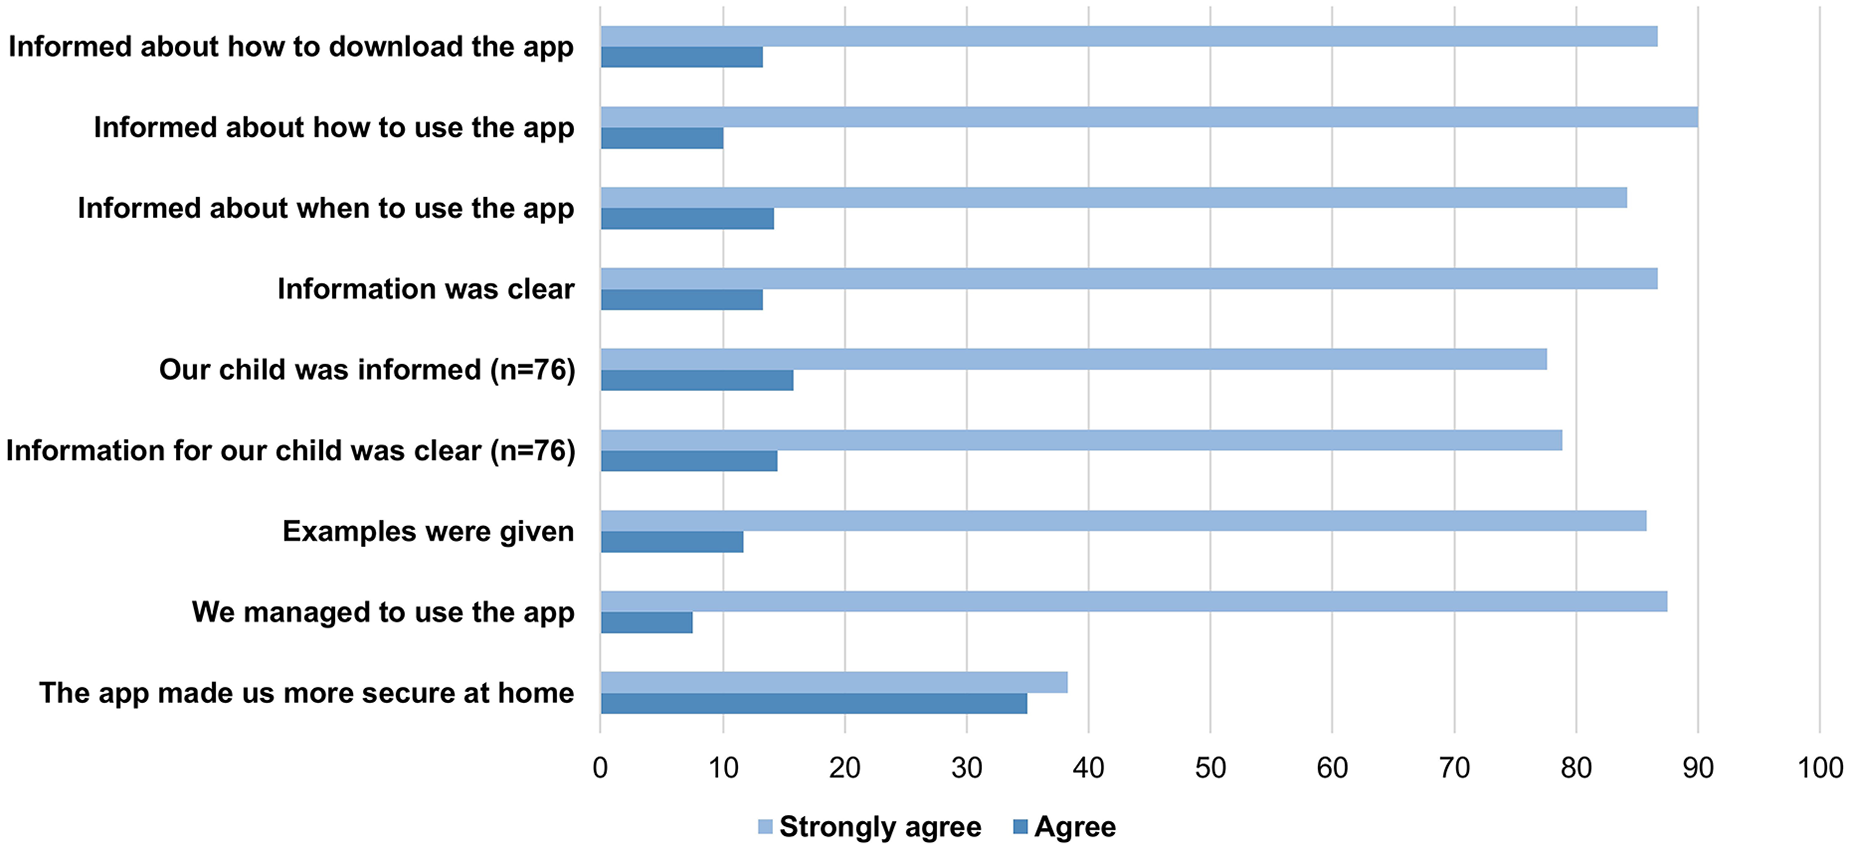
Percentages of the items about satisfaction with the app (n = 120).
In addition, parents completed three items about their child’s health and pain experienced in the past 4 weeks (Table 4). The mean scores indicated good health, mild pain, and pain experienced once or three times in the past 4 weeks. Parents who rated their child’s health as poorer also reported higher (r = −.58, p < .001) and more frequent (r = −.54, p < .001) pain in their child at follow-up. Moreover, the child’s maximum pain intensity during the study period (app) was negatively correlated with the parent’s report of the child’s health during the past month (r = −.29, p < .01). This indicates that pain had a negative impact on patients’ health (Table 4). Patients who experienced pain more frequently, as reported by their parents at follow-up, were those who had more severe pain in the past 4 weeks as reported at follow-up (r = .90, p < .001) and through the app (r = .30, p < .01; Table 4).
Follow-Up Scores of the Items About Health in General, Pain Intensity and Frequency, and Correlations (n = 120).
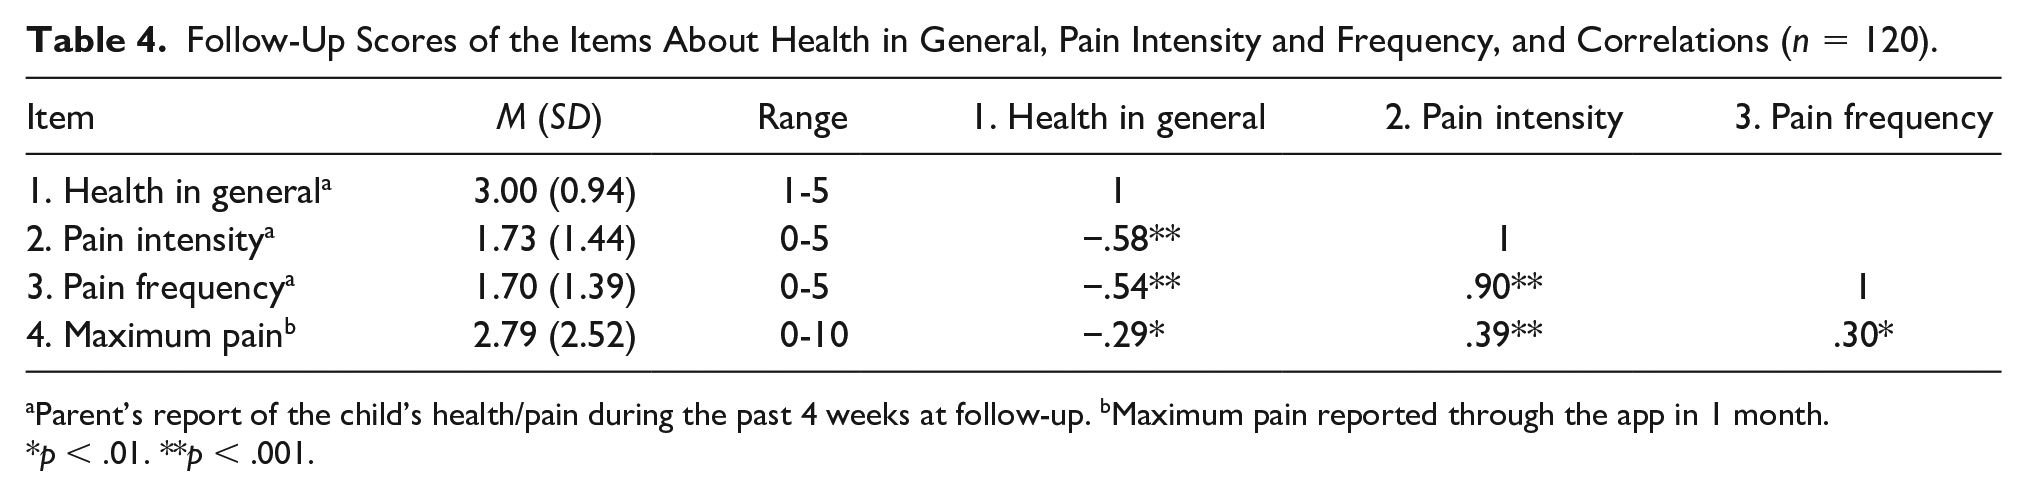
Parent’s report of the child’s health/pain during the past 4 weeks at follow-up. bMaximum pain reported through the app in 1 month.
p < .01. **p < .001.
Discussion
This study emphasized the importance of facilitating tracking reports of pain at home in pediatric patients with hematologic or solid tumors. For this purpose, an app was developed to help pediatric patients and their parents assess pain intensity and characteristics and deliver the measures to health professionals over 1 month after enrolment. The presence of pain (≥ 1) was reported at least once in a month in 76% of pediatric patients. Therefore, not every pediatric patient with cancer but a large majority of them was found to experience pain at home. To promote appropriate pain management, it is therefore fundamental to draw clinical attention to carefully tracking pain at home and identifying its occurrence in pediatric patients with cancer (Fortier et al., 2014; Pinheiro et al., 2018).
Many patients (56%) among those reporting pain at most reported mild pain (intensity 1-3) in 1 month. This may indicate that pain control was often satisfactory and that pain was adequately prevented through hospital protocols, which mandated adjustment of analgesic therapy in case of pain ≥4. However, mild pain should not be dismissed or underestimated, as it can still lead to significant impairment in functioning (Fortier et al., 2014). Severe pain was reported in 8.5% of pediatric patients experiencing pain in 1 month. Although this is a small proportion of patients with cancer, severe pain is a clinical priority and should be adequately managed in all patients, because it may be due to advanced illness and become refractory (Mariyana et al., 2018; Ye et al., 2019).
No sociodemographic or clinical factor was found to influence pain intensity, but the pain level was associated with patient health. Since pain is one of the most distressing symptoms (Skeens et al., 2019), patients suffering from severe pain are more likely to experience significant impairment in functioning due to the pain (Fortier et al., 2014). Therefore, it is important to implement multidisciplinary interventions to improve pain outcomes and provide psychological support to all the family (Devine et al., 2018; Jibb et al., 2015). Concerning pain location, the abdomen was identified as the most frequent pain site by patients aged 4 to 21 years and reporting pain ≥4 at the OPBG tool. This is in line with other studies (Fortier et al., 2014; Van Cleve et al., 2004), which identified the stomach as one of the most common pain locations, maybe due to chemotherapy side effects.
Our findings show that most patients older than 4 years, especially adolescents, directly assessed their own pain rather than having pain assessed by their parents. This is encouraging, given that parents are likely to underestimate the child’s experienced pain (Brudvik et al., 2017). To foster family and child-centered care, health professionals should improve the quality of the information they directly provide to children/adolescents and directly ask patients, especially adolescents, to assess their pain at home (Cheng et al., 2018).
Participants using the app more frequently were those who reported higher levels of pain, probably because those who were in pain were more motivated to use the app than those who did not experience pain during the 1-month study period. In particular, the median number of times participants used the app was 6, which was far less than using the app every day in 1 month. Participants may have seen no point in using the app in the absence of pain. However, informing health professionals about the absence of pain is still clinically important and should represent the gold standard (Duran et al., 2019).
Overall, most parents considered the app useful for pain assessment and tracking at home, in line with similar studies (Fortier et al., 2016; Jibb, Cafazzo, et al., 2017; Jibb, Stevens, et al., 2017; Semple et al., 2015; Stinson et al., 2013; Tutelman et al., 2018b). In particular, the app facilitated pain assessment in pediatric patients and their parents by directly providing the age-appropriate scale while transmitting real-time data to researchers who could track pain intensity and characteristics over time (Leahy et al., 2018). Moreover, the process of being asked to monitor and track pain may have increased patients’ and parents’ awareness of pain intensity, its characteristics, and location by helping participants report the level of pain while it occurs (Fortier et al., 2016; Richards et al., 2018; Tiozzo et al., in press). In conclusion, the app was of great benefit in facilitating pain assessment and tracking in patients receiving hospital-at-home care, while fostering continuity of care between the hospital and the community (Marshall, 2015).
In addition, most parents were satisfied with the information received about the app and its use. The app could also facilitate health professionals in addressing the information needs of pediatric patients and their families (Richards et al., 2018). To improve pain management and ensure the appropriate administration of analgesics at home (Rao-Gupta et al., 2018), nurses should empower pediatric patients and their families in performing pain assessment by using technology combined with education (Bettle et al., 2018; Kusi Amponsah et al., 2019; Lalloo et al., 2015).
Although the app provided a mechanism for monitoring pain and initiating communication between the hospital and home, a small proportion of participants reported that the app did not help them feel safer at home. This may be explained considering that accurate symptom tracking is critical to preserving patients’ quality of life (Brock et al., 2018) but tracking alone does not directly imply symptom management. To improve perceived safety at home, symptom management should be the key component of a process aimed at improving hospital–home communication and ensuring high-quality home care (Hansson et al., 2011).
Limitations
The findings of this study should be interpreted in light of some limitations. First, research nurses enrolled patients only during the days in which they were on duty, through convenience sampling; thereby enrolled patients might not be considered representative of the entire target population. Second, only participants who had access to technology and were sufficiently knowledgeable about the use of the app were enrolled in the study, therefore our findings cannot be generalized to families that did not have a mobile device or were not sufficiently proficient in the use of technology. Third, the frequencies with which some participants used the app were lower than expected (e.g., only once). The fact that research nurses were not allowed to provide clinical suggestions to parents/patients may have negatively influenced the app usage. Although we found that the app usage frequency was positively associated with pain presence and intensity, it is difficult to identify the reasons for the missing data, which may also include days in which the patient was not feeling well enough to take the time to complete the pain scale. This can affect the interpretation of the results. Moreover, patients were enrolled without considering the stage of the disease/treatment, therefore pain measurements were not anchored to clinically meaningful time points. Also, results combine data on pain reports that were at times obtained from patients and parents. Another limitation is not having investigated the causes of pain in depth. Although the variables included in this study are consistent with previous research (Fortier et al., 2014), other clinical variables not considered here, such as time since diagnosis, could have affected the pain reports.
To facilitate comparison across studies, pain measurement should be carried out using the same standardized scales (Benini et al., 2016). However, the OPBG tool implemented into the app was not validated as a specific instrument to assess pain in pediatric patients with cancer, even though it was based on validated scales. Therefore, further research is needed to validate the OPBG tool as a specific instrument to assess pain in pediatric patients with cancer.
Directions for Future Research
In the future, multisite collaborative studies that use apps for pain monitoring have the potential to achieve a deeper understanding of the characteristics of pain experienced at home by pediatric patients with cancer to identify in advance those who are more at risk of experiencing pain. Moreover, future studies could investigate what parents and patients would require to feel more secure at home. In particular, it could be useful to further develop the app for assessing other clinical parameters, such as skin and mucosal condition, nutrition, elimination, temperature, and the status of the vascular access device. It would be important to transmit these data to health care providers in real-time, have these data connected to the hospital web network, and give feedback based on patients’/parents’ reports so that we can evaluate the impact in terms of facilitating customized interventions. With the advance of telehealth solutions, it could also be important to identify best practices in relation to the use of mHealth devices to support activities such as symptom outcomes.
Conclusions
This prospective study investigated pain in pediatric patients with hematologic or solid tumors as assessed by patients themselves or their parents at home during the 1-month poststudy enrollment period. Overall, the incidence of pain was relatively low; in fact, less than 10% reported severe pain during the 1 month. To achieve pain control, assessing pain at home is crucial and the app could facilitate the tracking process over time. The app promoted real-time recording of pain intensity and helped patients and their parents assess pain using the age-appropriate scale. Overall, our findings suggest that apps for pain monitoring could be widely appreciated by patients and parents while supporting health professionals in ensuring continuity of care.
Footnotes
Acknowledgements
We are grateful to the patients and parents who participated in this study.
Declaration of Conflicting Interests
The author(s) declared no potential conflicts of interest with respect to the research, authorship, and/or publication of this article.
Funding
The author(s) received no financial support for the research, authorship, and/or publication of this article.