
Abstract
Understanding and addressing issues of victimization, public safety, and crime requires accurate and comprehensive survey data. However, China currently lacks systematic, nationally representative surveys specifically designed for criminological research. This study systematically reviews six major social surveys: the Chinese General Social Survey (CGSS), China Family Panel Studies (CFPS), Chinese Social Survey (CSS), China Labor-force Dynamics Survey (CLDS), China Health and Retirement Longitudinal Study (CHARLS), and China Household Financial Survey (CHFS). Each survey is evaluated in terms of its scope, methodology, accessibility, and questions related to victimization, public safety, and crime, as well as overall strengths and limitations. The study highlights the potential of these data sets for criminology and victimology research, offering opportunities to examine patterns, determinants, and consequences of victimization, crime, and safety perceptions. At the same time, the fragmented and unsystematic nature of these surveys poses significant challenges for comprehensive analysis. This underscores the urgent need for a nationally representative victimization survey in China, which would also enhance research on public safety and crime-related issues more broadly.
Introduction
Understanding and accurately measuring the extent of crime are a fundamental task in criminology and criminal justice research. According to the widely recognized “criminal justice funnel” paradigm, the number of crimes known to the police represents only a fraction of the total “real crime,” with increasingly fewer cases advancing through prosecution, adjudication, and incarceration (Gottfredson, 1986). This attrition highlights the significant gap between officially recorded crime and the actual experiences of victims, underscoring the limitations of relying solely on official crime data (Lauritsen, 2010). Victimization surveys have been instrumental in addressing these limitations by capturing crimes that remain unreported, thereby offering a broader perspective on crime patterns and victimization (Cantor & Lynch, 2000). These surveys not only reveal significantly higher crime rates compared to official data, uncovering the “dark figure” of crime (Decker, 1977) but also provide critical insights into the temporal and spatial distribution of crimes and demographic differences among victims (Gottfredson, 1986; Wetzels et al., 1994).
The absence of nationally representative victimization surveys creates significant challenges to criminological research in China. Scholars often have to rely on official data, such as statistics compiled in Law Yearbooks ( J.Liu, 2008). However, these statistics are typically aggregated at the national level and rarely disaggregated into provincial or other units of analysis ( J.Liu, 2008, p. 140). Furthermore, there is evidence suggesting that official crime statistics may be manipulated (Xu, 2018). This situation reflects challenges common to developing countries, where official crime data are often plagued by inaccuracies due to non-reporting and potential manipulation, as well as the absence of systematic victimization surveys (Marenin, 1997).
Although lacking nationally representative victimization surveys, scholars identify four data sets that offer partial insights as to crime and victimization patterns ( J.Liu, 2008; Zhuo et al., 2008): the Beijing 1994 survey, the Tianjin 2004/2014 surveys, the National Public Security Survey (2001–2005), and the International Crime Against Businesses Survey (ICBS) 2006. While valuable, these data sets are dated, not publicly accessible, and lack national representativeness.
In recent years, large-scale social surveys have gained prominence in China, including but not limited to the Chinese General Social Survey (CGSS), China Family Panel Studies (CFPS), Chinese Social Survey (CSS), China Labor-force Dynamics Survey (CLDS), China Health and Retirement Longitudinal Study (CHARLS), and China Household Financial Survey (CHFS) (see Table 1 for a structured comparison of their methodology, strengths, and limitations). While not specifically designed for victimization studies, these surveys incorporate questions on victimization and public safety, are regularly updated, publicly accessible, and nationally representative.
Summary of Social Surveys in China.
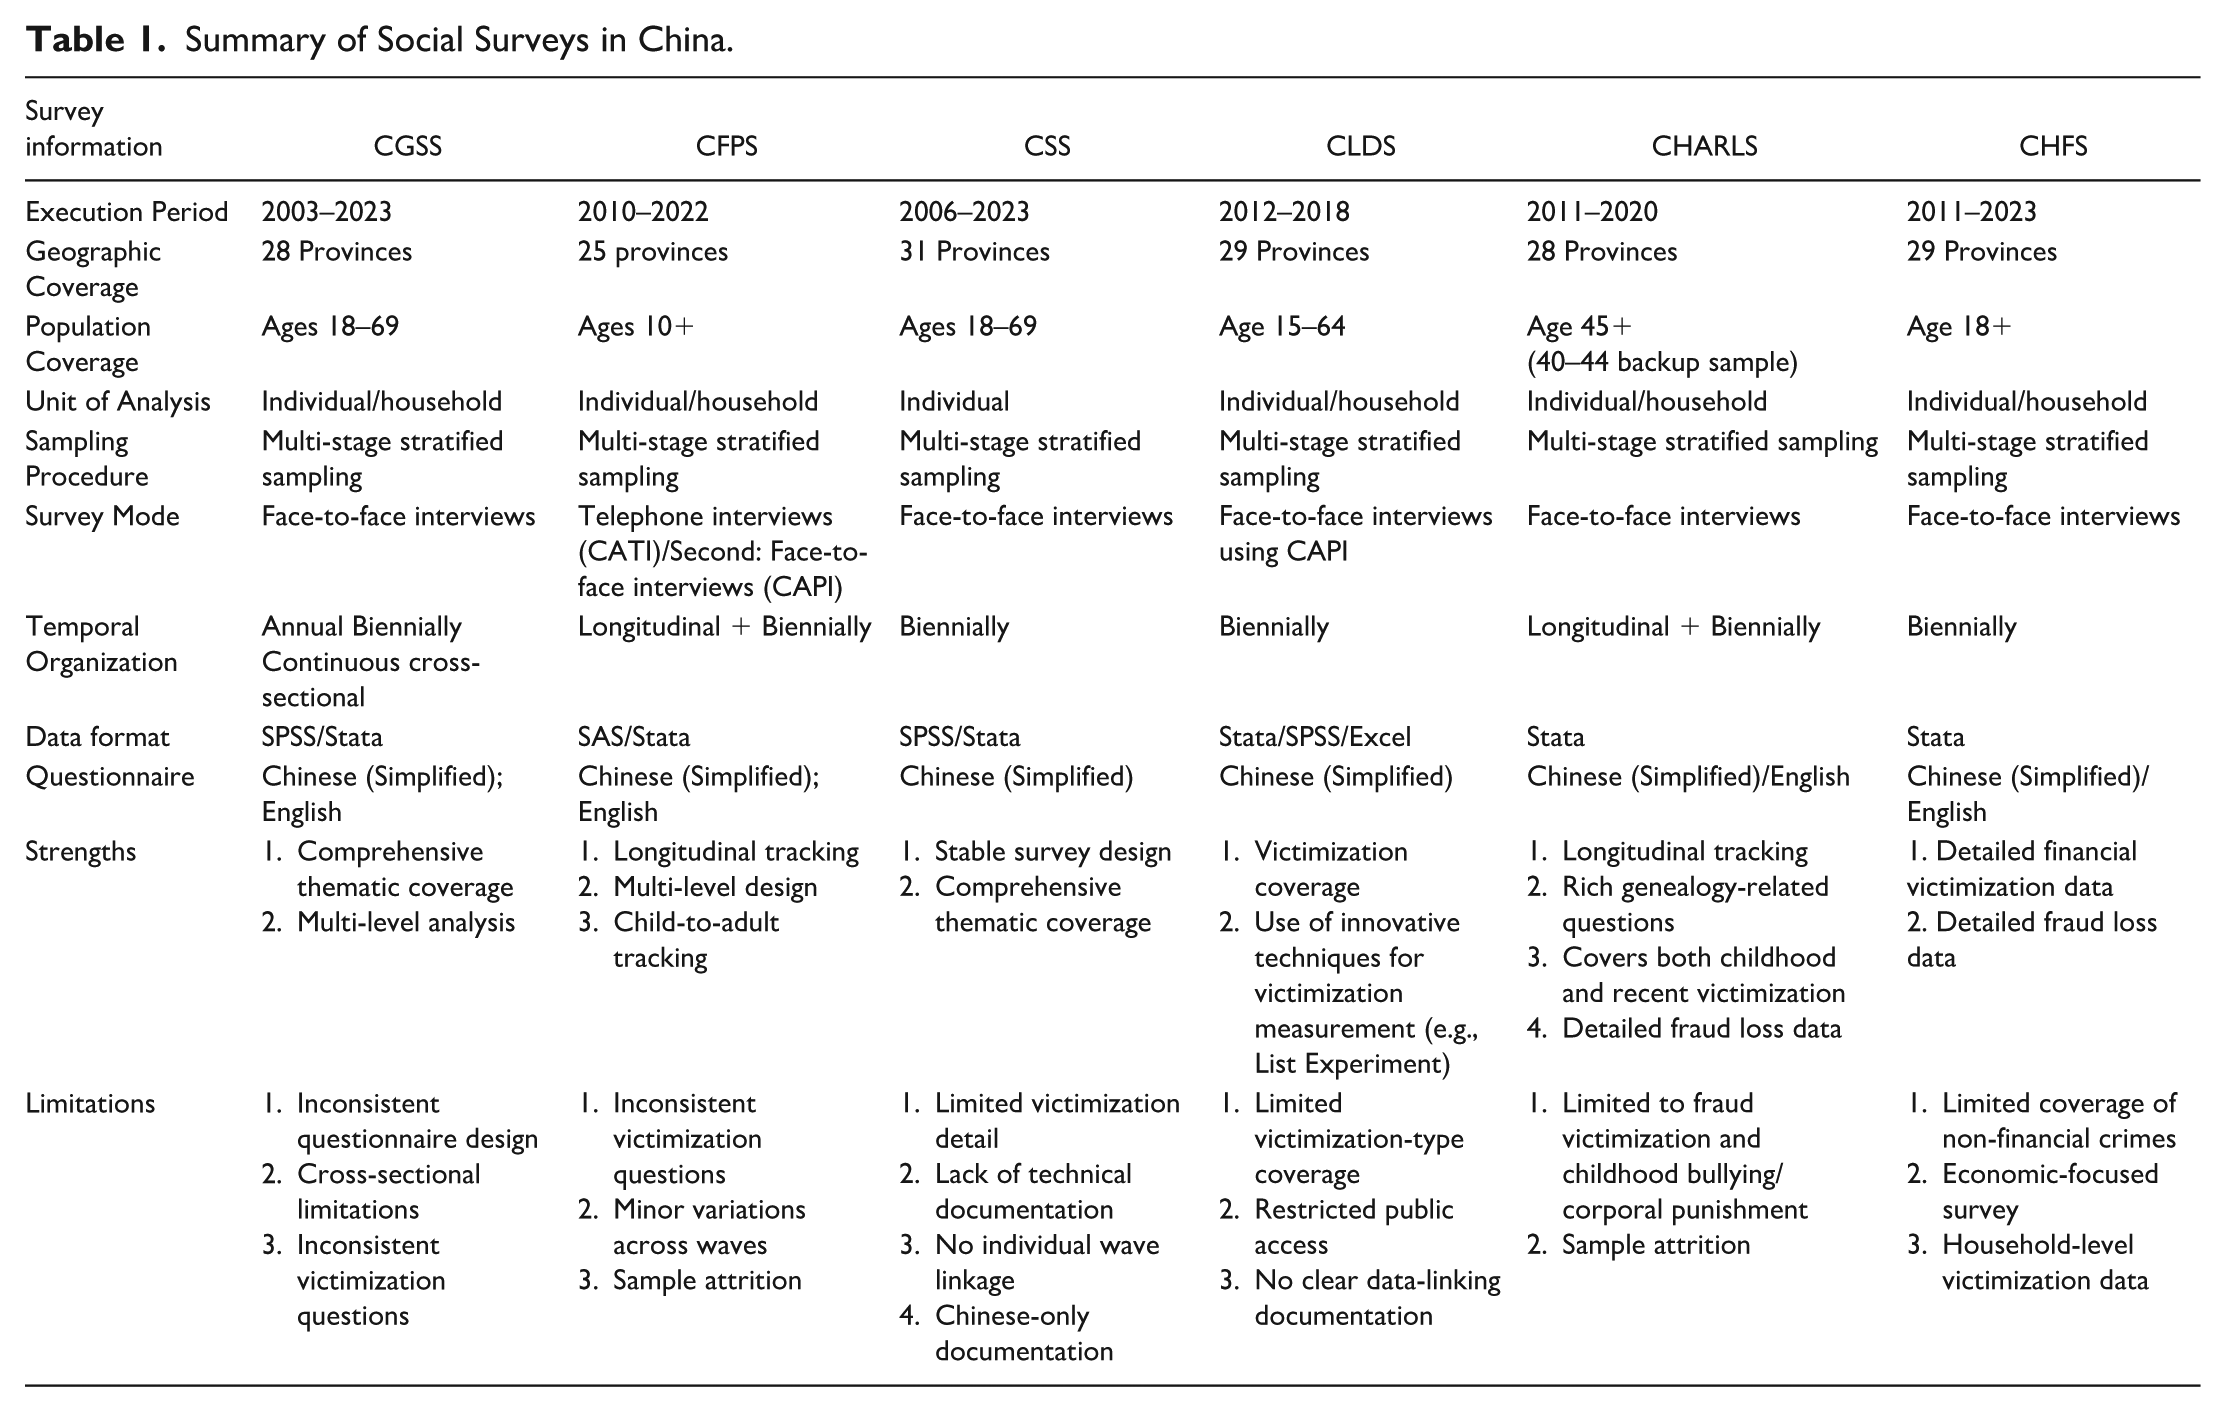
Within this context, this study undertakes a comprehensive review of six major national surveys in China. The review proceeds in four steps: (a) introducing each survey in terms of description, scope, methodology, accessibility, and victimization-related questions; (b) evaluating their strengths and limitations as crime data sources; (c) summarizing existing criminological studies that have employed these surveys; and (d) discussing the implications for developing a dedicated victimization survey and potential strategies for future data collection. In doing so, the review provides a roadmap of existing surveys and helps bridge the gap between their fragmented applications and the broader needs of criminological research in China.
Major National Social Surveys in China
CGSS
Description, Scope, Methodology, and Accessibility
Initiated in 2003, the CGSS (http://cgss.ruc.edu.cn/) is the first nationally representative, repeated cross-sectional survey in mainland China. It was jointly launched by Renmin University of China and the Survey Research Center at Hong Kong University of Science and Technology, with the China Survey and Data Center at Renmin University managing the project since 2010. The CGSS systematically tracks changes in social structure and quality of life across China.
The CGSS focuses on social dynamics, examining factors such as social groups, organizations, and networks, as well as economic and well-being indicators like income, employment, and life satisfaction. The survey targets civilian adults aged 18 and above from diverse geographic regions, including both urban and rural areas, ensuring broad demographic representation.
The CGSS employs a multi-stage stratified sampling design, evolving through three major phases: 2003–2006, 2008, and 2010 onwards. The initial design (2003–2006) used the national census in 2000 as its sampling frame and oversampled urban areas, surveying approximately 10,000 households. The 2008 wave, based on the 2005 1% population survey, was a pilot study with a reduced sample size of 6,000 households. Since 2010, a revised design introduced self-representative strata for major cities (e.g., Beijing, Shanghai) and stratified other regions by Gross Domestic Product (GDP), urbanization, and population density, improving overall representativeness.
The CGSS has conducted multiple waves, including 2003, 2006, 2008, 2010, and subsequent years such as 2011, 2013, 2015, 2017, 2018, 2021, and 2023. The data sets, questionnaires, and related materials are publicly available through the China National Survey Data Archive (CNSDA) (http://www.cnsda.org/), where researchers can apply for access and download necessary documentation. CGSS data are restricted to non-commercial use by academic, research, and government personnel. Because each household has a different probability of being selected, sampling weights are needed to adjust for population inference. It is recommended to use the corresponding sample weights. Detailed weight variable name and methodological information for each wave is provided in Supplemental Appendix Table S1.
Questions Related to Victimization, Public Safety, and Crime
The CGSS incorporates victimization-related questions intermittently across its survey waves, often within supplementary modules. These modules complement the core and thematic sections, which focus on broad socio-demographic and societal topics, such as labor markets, family, health, and social attitudes. Below is an overview of key victimization-related questions and findings across selected survey years, along with descriptive statistics that highlight their relevance to criminological research.
In the 2003 CGSS questionnaire, question J1 asked respondents to identify the top three social problems, with public security as one of the 12 options: 6.4% (n = 379) chose public security as their top priority (ranked the fifth among the top priorities), 11.6% (n = 681) as the second priority (ranked fourth place among the second priorities), and 14.5% (n = 852) as their third priority (ranked the third among the three priorities). These findings highlight that while public security was not the most urgent concern then, it consistently appeared as an important issue, ranked below health care and education.
In 2005, the survey included questions on miscarriage of justice and conflict resolution. For example, question F19 examined public attitudes toward justice, asking respondents to compare the severity of two situations: sentencing an innocent person or releasing a guilty one. A slim majority, 44.4% (n = 4,608), believed that convicting an innocent person was worse, while 42.2% (n = 4,375) prioritized avoiding the release of guilty individuals. Questions F20a–F20c further explored conflict experiences and resolution strategies. Among respondents, 9.1% (n = 947) reported experiencing disputes in the past 4 years, with 16.2% (n = 153) using legal strategies, 30.7% (n = 291) seeking mediation from acquaintances, and 26.5% (n = 251) tolerating the situation. These findings shed light on public experiences with disputes and their approaches to conflict resolution.
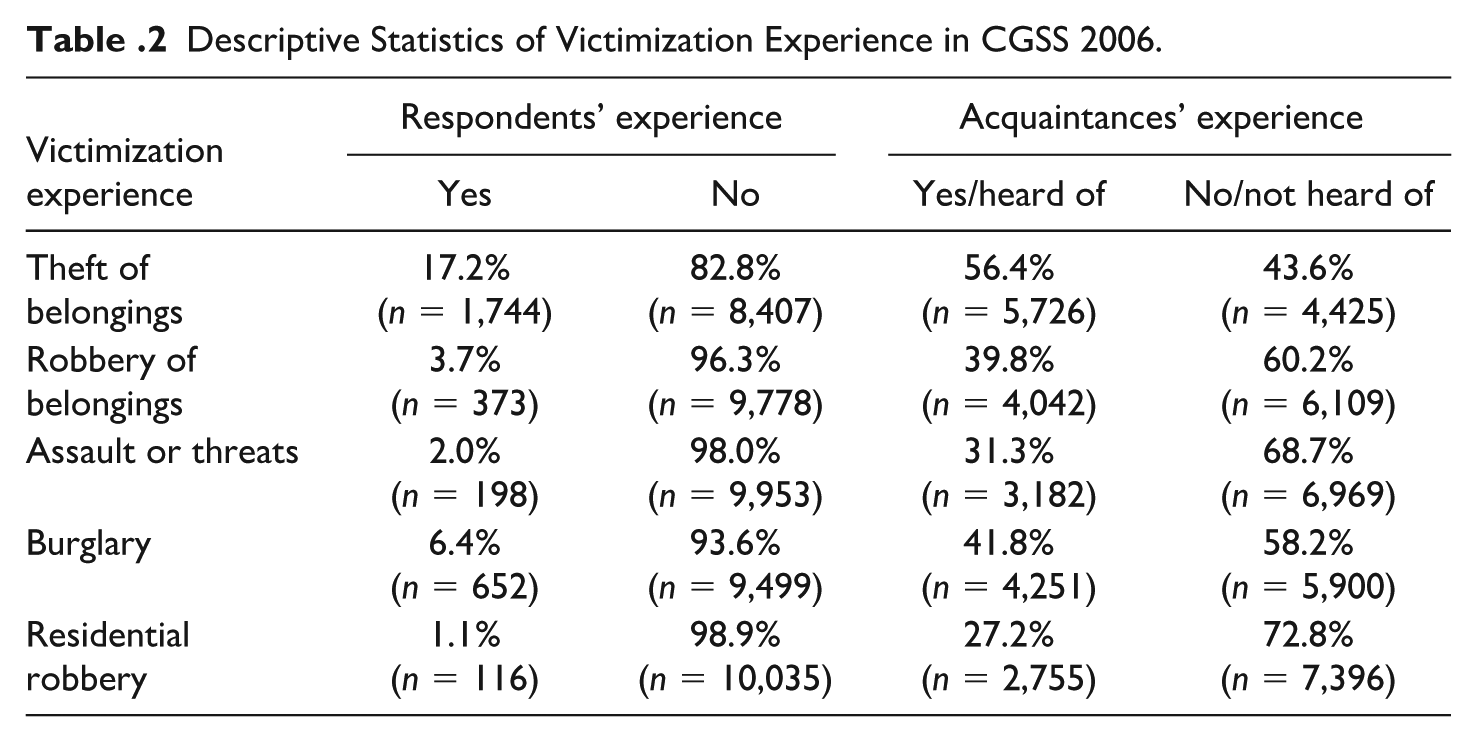
In 2006, the survey directly measured victimization experiences over the past 12 months (E46), asking whether respondents or people they knew had experienced illicit events. The findings reveal relatively low rates of personal victimization but higher awareness of such incidents through acquaintances (see Table 2). For instance, while only 3.7% of respondents personally experienced robbery, 39.8% knew someone affected. These data provide a valuable basis for studying victimization in China, enabling researchers to explore factors influencing victimization and its broader consequences by linking these findings to other parts of the survey.
Descriptive Statistics of Victimization Experience in CGSS 2006.
Among various questions of the CGSS 2010, two questions directly relevant to victimology asked respondents to identify the most important (L1a) and second most important (L1b) societal issues from a list of options, including crime, health care, education, and poverty. For the most important issue, crime ranked fourth, with 5.7% (n = 210) of respondents selecting it. For the second most important issue, crime again ranked fourth, with 5.8% (n = 213) identifying it. These results reflect public recognition of crime as a concern but suggest that other societal issues take precedence.
The 2013 CGSS survey explored public perceptions of crime, safety services, and various social issues. Respondents were asked to rank the top three most pressing social issues from a list of 13 topics, including income disparity, unemployment, corruption, and crime. Crime consistently ranked fourth, with 4.8% (n = 543), 7.2% (n = 822), and 9.8% (n = 1,121) of respondents selecting it as their first, second, and third priorities, respectively. Another question assessed satisfaction with public safety services, where 44.9% (n = 2,590) of respondents were “somewhat satisfied,” but 32.7% (n = 1,887) expressed varying degrees of dissatisfaction. In addition, perceptions of specific societal problems, such as fraud and theft, were also measured. Fraud was seen as “somewhat serious” by 41.4% (n = 2,343) and “very serious” by 12.0% (n = 677), while theft was rated similarly, with 30.8% (n = 1,743) and 10.3% (n = 586) categorizing it as “somewhat” or “very serious,” respectively. These findings reflect a significant level of concern about crime and public safety, even if these issues rank below economic and social welfare priorities.
The 2015 CGSS included a comprehensive legal module covering topics such as the legal framework, law enforcement system, judicial application, social governance, and legal outcomes. Two questions are directly relevant to victimology. Question B15 assessed public satisfaction with the government’s performance in crime control. Among respondents, 52.2% (n = 5,725) were “satisfied,” 8.8% (n = 965) were “very satisfied,” 28.0% (n = 3,073) rated it as “average,” 8.0% (n = 876) were “dissatisfied,” and 1.2% (n = 129) were “very dissatisfied,” with 1.8% (n = 200) unable to provide a response. Question F27 examined perceptions of community safety, with 57.9% (n = 2,188) rating their community as “safe,” 15.5% (n = 584) as “very safe,” 18.0% (n = 679) as “average,” 7.5% (n = 284) as “somewhat unsafe,” and 0.9% (n = 34) as “very unsafe,” while 0.2% (n = 8) did not respond. These results indicate general satisfaction with crime control efforts and a strong sense of community safety.
The 2017 CGSS survey included a detailed set of questions in section B that focused on public perceptions of policing, procedural justice, and engagement with law enforcement (B39.1–B39.20). Key items explored respondents’ trust in police fairness, decision-making process, responsiveness, and performance in areas such as crime prevention (B39.14), victim assistance (B39.15), and police performance in solving cases (B39.13). Notably, the survey also examined willingness to report crimes (B39.20) and suspicious activities (B39.18) or provide information to aid investigations (B39.19). However, Section B of the 2017 CGSS is not available in the publicly released data set.
In the 2021 CGSS survey, respondents were asked to identify the most and second-most important issues facing China (P1a, P1b). For the most important issue (P1a), crime ranked seventh, selected by only 2.3% (n = 64) of respondents. Similarly, for the second-most important issue (P1b), crime ranked sixth, with 3.1% (n = 85) of respondents choosing it. While crime remains a concern, it is perceived as less urgent than other societal challenges.
Finally, in the 2023 CGSS survey, only one question was related to criminology, asking respondents to assess their level of trust in police officers (C17n). This question was included solely in the face-to-face interviews. Of those interviewed, 31.4% (n = 1,751) reported “very high trust,” 55.9% (n = 3,122) “relatively high trust,” 10.4% (n = 579) “low trust,” and 2.3% (n = 131) “no trust at all.”
CFPS
Description, Scope, Methodology, and Accessibility
CFPS is a large-scale, nationally representative, longitudinal social survey conducted by Peking University’s Institute of Social Science Survey (ISSS). Launched in 2010, CFPS aims to provide high-quality data to monitor and analyze changes in China’s society, economy, population, education, and health. Covering 25 provinces, the survey represents approximately 95% of China’s population.
CFPS captures both economic and non-economic welfare indicators, including education, family dynamics, migration, and health (Xie & Hu, 2014). Its primary unit of analysis is the household, encompassing all members within a sampled household unit. The survey tracks “gene members” (biological or adopted family members identified in the baseline survey) and their descendants, ensuring longitudinal consistency. By integrating data across community, household, and individual levels, CFPS supports multi-level analyses, shedding light on both micro-level behaviors and macro-level trends. The baseline survey conducted in 2010 included 14,960 households and 42,590 individuals. Since then, CFPS has conducted follow-up surveys every 2 years, with content expanded to include detailed family dynamics, psychological well-being, and intergenerational relationships. This focus on comprehensive data collection aligns CFPS with internationally recognized panel studies.
The CFPS employs a rigorous multi-stage, stratified probability sampling design with implicit stratification by socioeconomic characteristics. Covering 25 provinces, the sampling process begins at the county level and progresses through villages or urban neighborhoods to individual households. Data collection was initially conducted through face-to-face interviews using computer-assisted personal interviewing (CAPI) technology, but in 2012, it was expanded to include computer-assisted telephone interviews (CATIs). To address community, household, and individual dimensions, CFPS employs modular questionnaires, including village/community questionnaires, household filters, family member questionnaires, adult questionnaires, and child questionnaires. The survey also employs longitudinal tracking strategies to capture life-course data. Core family members and their direct descendants remain part of the panel, while non-core members who leave the household are surveyed via proxy (Xie & Lu, 2015).
The CFPS provides publicly available longitudinal data starting in 2010, with downloadable data sets for the 2012–2022 waves. These include questionnaires, documentation, and Stata/SAS data files, accessible via Peking University’s platforms—preferably through the dedicated CFPS portal (http://www.isss.pku.edu.cn/cfps/download/login), although Opendata PKU (https://opendata.pku.edu.cn/dataverse/CFPS) is also supported. The data can be downloaded once the manual review is approved. In addition, restricted data sets containing sensitive geographic and socioeconomic variables are available (https://www.isss.pku.edu.cn/cfps/en/data/restricted/index.htm?), subject to formal application and privacy compliance; some are downloadable upon approval, and others require on-site access.
Since 2010, CFPS has calculated both cross-sectional and longitudinal weights for household and individual questionnaires separately for the national full sample and the national refreshment sample. Weight calculation involves computing the sampling design weights, non-response adjustment weights, post-stratification adjustment weights, and trimming extreme values. From CFPS 2018 onward, household-level weights include only cross-sectional weights and no longer provide longitudinal weights, reflecting the limited comparability of households across waves due to changes such as member deaths, marriages, or migration. Individual-level weights, however, continue to include both cross-sectional and longitudinal weights, and CFPS no longer provides separate weights for the refreshment sample, offering only weights for the full sample. Detailed methodological information is provided in Supplemental Appendix Table S2.
Questions Related to Victimization, Public Safety, and Crime
In the 2010 CFPS, question N1 examined respondents’ lifetime victimization experiences, covering theft, robbery, assault, and burglary (see Table 3). Theft emerged as the most prevalent, followed by home burglary, assault, and robbery; home robbery was the least reported. Notably, two-thirds of respondents (66.2%) reported no experience of victimization.
Victimization Rate in CFPS 2010 and CFPS 2014.
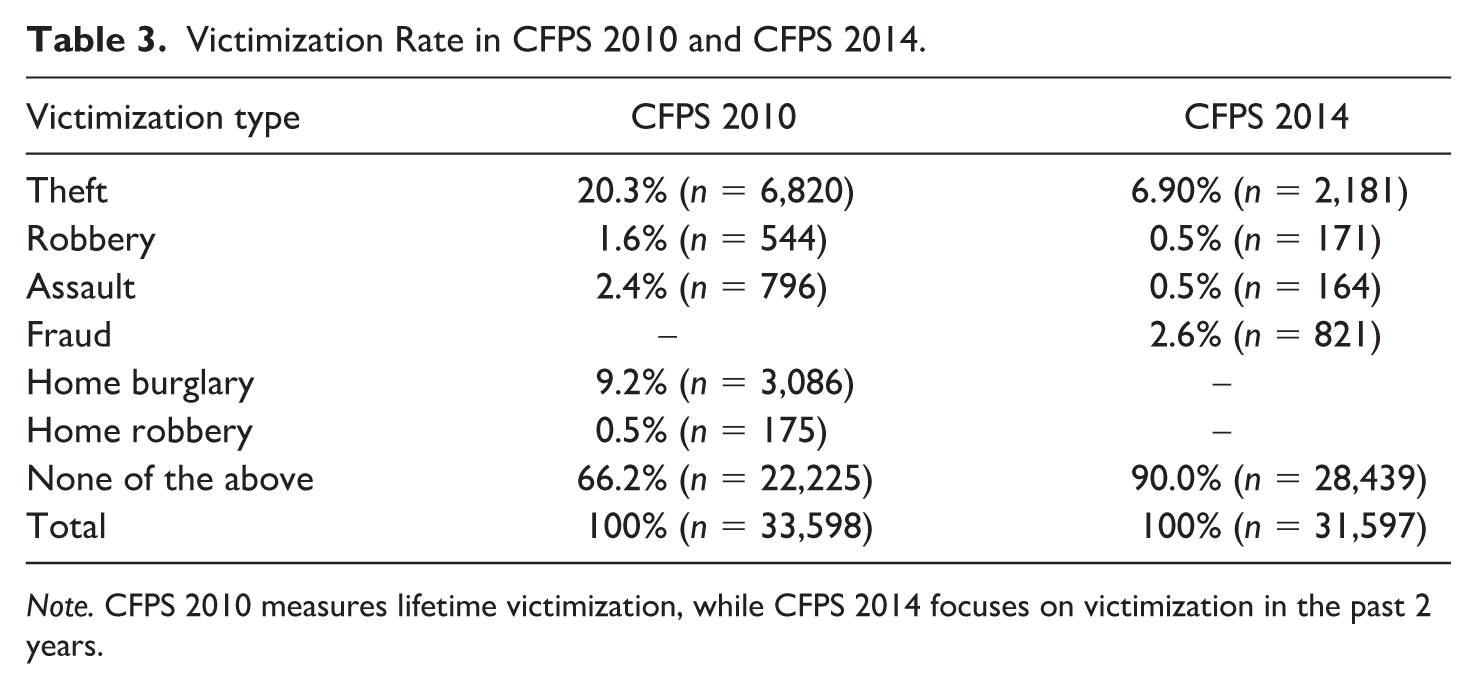
Note. CFPS 2010 measures lifetime victimization, while CFPS 2014 focuses on victimization in the past 2 years.
The 2014 CFPS survey expanded the scope of victimization-related questions, covering a broader range of topics under items N12–N20. These include respondents’ perceptions of public safety (N12), behavioral reactions to crime (N13), recent victimization experiences (N14), and views on criminal justice issues such as punishment severity, sentencing preferences, and the death penalty (N15–N20). These questions (N12–N22) are not publicly available but can be accessed through restricted data applications.
Among these, N14 focused specifically on victimization experiences within the past 2 years. Compared to the 2010 wave, exposure rates were lower—likely due to the shorter reference period—with theft remaining the most frequently reported incident, followed by fraud, assault, and robbery. A large majority (90%) reported no victimization during this period (see Table 3). For those who did report victimization, follow-up questions explored their familiarity with the offender (N1401) and whether they reported the incident to authorities (N1402). Most respondents (86.16%, n = 2,709) did not know the offender, and only 35.04% (n = 1,102) reported the incident, while 64.96% (n = 2,043) chose not to.
In addition to actual experiences, the 2014 CFPS also collected data on subjective perceptions of safety and behavioral responses to crime. Public safety perception (N12) was measured on a scale from 0 (very unsafe) to 10 (very safe), with an average score of 6.70 (SD = 2.47), indicating generally positive assessments, but with notable variation. Regarding reactions to crime (N13), respondents were asked how they would respond if they witnessed a pickpocket. Among 31,368 valid responses, the most common was to quietly warn the victim (32.1%, n = 10,146), followed by secretly alerting the authorities (29.6%, n = 9,350). Other responses included calling the police (15.8%, n = 5,001), doing nothing (15.7%, n = 4,971), and physically restraining the suspect (6.0%, n = 1,903). These patterns suggest a general willingness to intervene, although with a clear preference for non-confrontational strategies.
In the 2016 CFPS, victimization-related questions were unfortunately removed from the survey. However, the questionnaire retained a key item on subjective safety. Question CE3 evaluated respondents’ perceptions of neighborhood safety, on a scale ranging from “very good” to “very poor.” Among the 33,181 valid responses, 13.47% (n = 4,469) rated it as “very good,” 31.57% (n = 10,471) as “good,” 46.48% (n = 15,424) as “average,” 5.59% (n = 1,856) as “poor,” and 2.90% (n = 961) as “very poor.”
CSS
Description, Scope, Methodology, and Accessibility
The CSS is a nationally representative, biennial survey initiated in 2005 by the Institute of Sociology at the Chinese Academy of Social Sciences (CASS; website: http://sociology.cssn.cn/css_sy/). Designed to monitor long-term social changes in China, the CSS collects repeated cross-sectional data on a wide array of topics, including labor markets, family dynamics, social attitudes, and institutional trust.
The CSS is conducted biennially and covers all 31 provinces, autonomous regions, and municipalities in mainland China. The survey includes 151 districts/counties and 604 villages/neighborhood committees, with each wave sampling between 7,000 and 10,000 households. The target population comprises residents aged 18 to 69 years, representing the Chinese adult population. The CSS questionnaire is divided into three sections: (1) a Core Module, which features fixed content across waves, including personal demographics, employment, family structure, and economic conditions; (2) a Rotating Module, which addresses topics such as social mobility, social security, and consumption, repeated at regular intervals; and (3) a Topical Module, which explores contemporary issues such as urbanization, public welfare, and group interests.
The CSS employs probability sampling and face-to-face interviews to collect data. Key methodological features include (1) sampling frames based on China’s fifth and sixth population censuses, (2) the use of map-based address sampling to account for migrant populations, (3) comprehensive training programs for field supervisors and interviewers to ensure high-quality data collection, (4) multi-level quality assurance measures such as questionnaire reviews at both local and national levels and double data entry to minimize errors, and (5) robust anonymization protocols to ensure confidentiality and ethical compliance.
Since its inception, the CSS has completed nine waves: 2006, 2008, 2011, 2013, 2015, 2017, 2019, 2021, and 2023. Public access is available for these data sets, except for the 2023 wave, through two primary channels: China Social Quality Basic Database (http://csqr.cass.cn) and Official Application Process with the CSS. CSS uses an approximately self-weighting multi-stage sampling design, so only post-stratification weights are applied, which adjust the sample for age, gender, and urban–rural status. Detailed methodological information is provided in Supplemental Appendix Table S3.
Questions Related to Victimization, Public Safety, and Crime
The CSS serves as a valuable resource for victimological research by incorporating both direct and indirect measures of victimization and safety perceptions. Although questions on personal victimization are not consistently included in all waves, their periodic inclusion provides critical insights into victimization trends (see Table 4).
Descriptive Statistics of Crime-Related Questions in CSS.
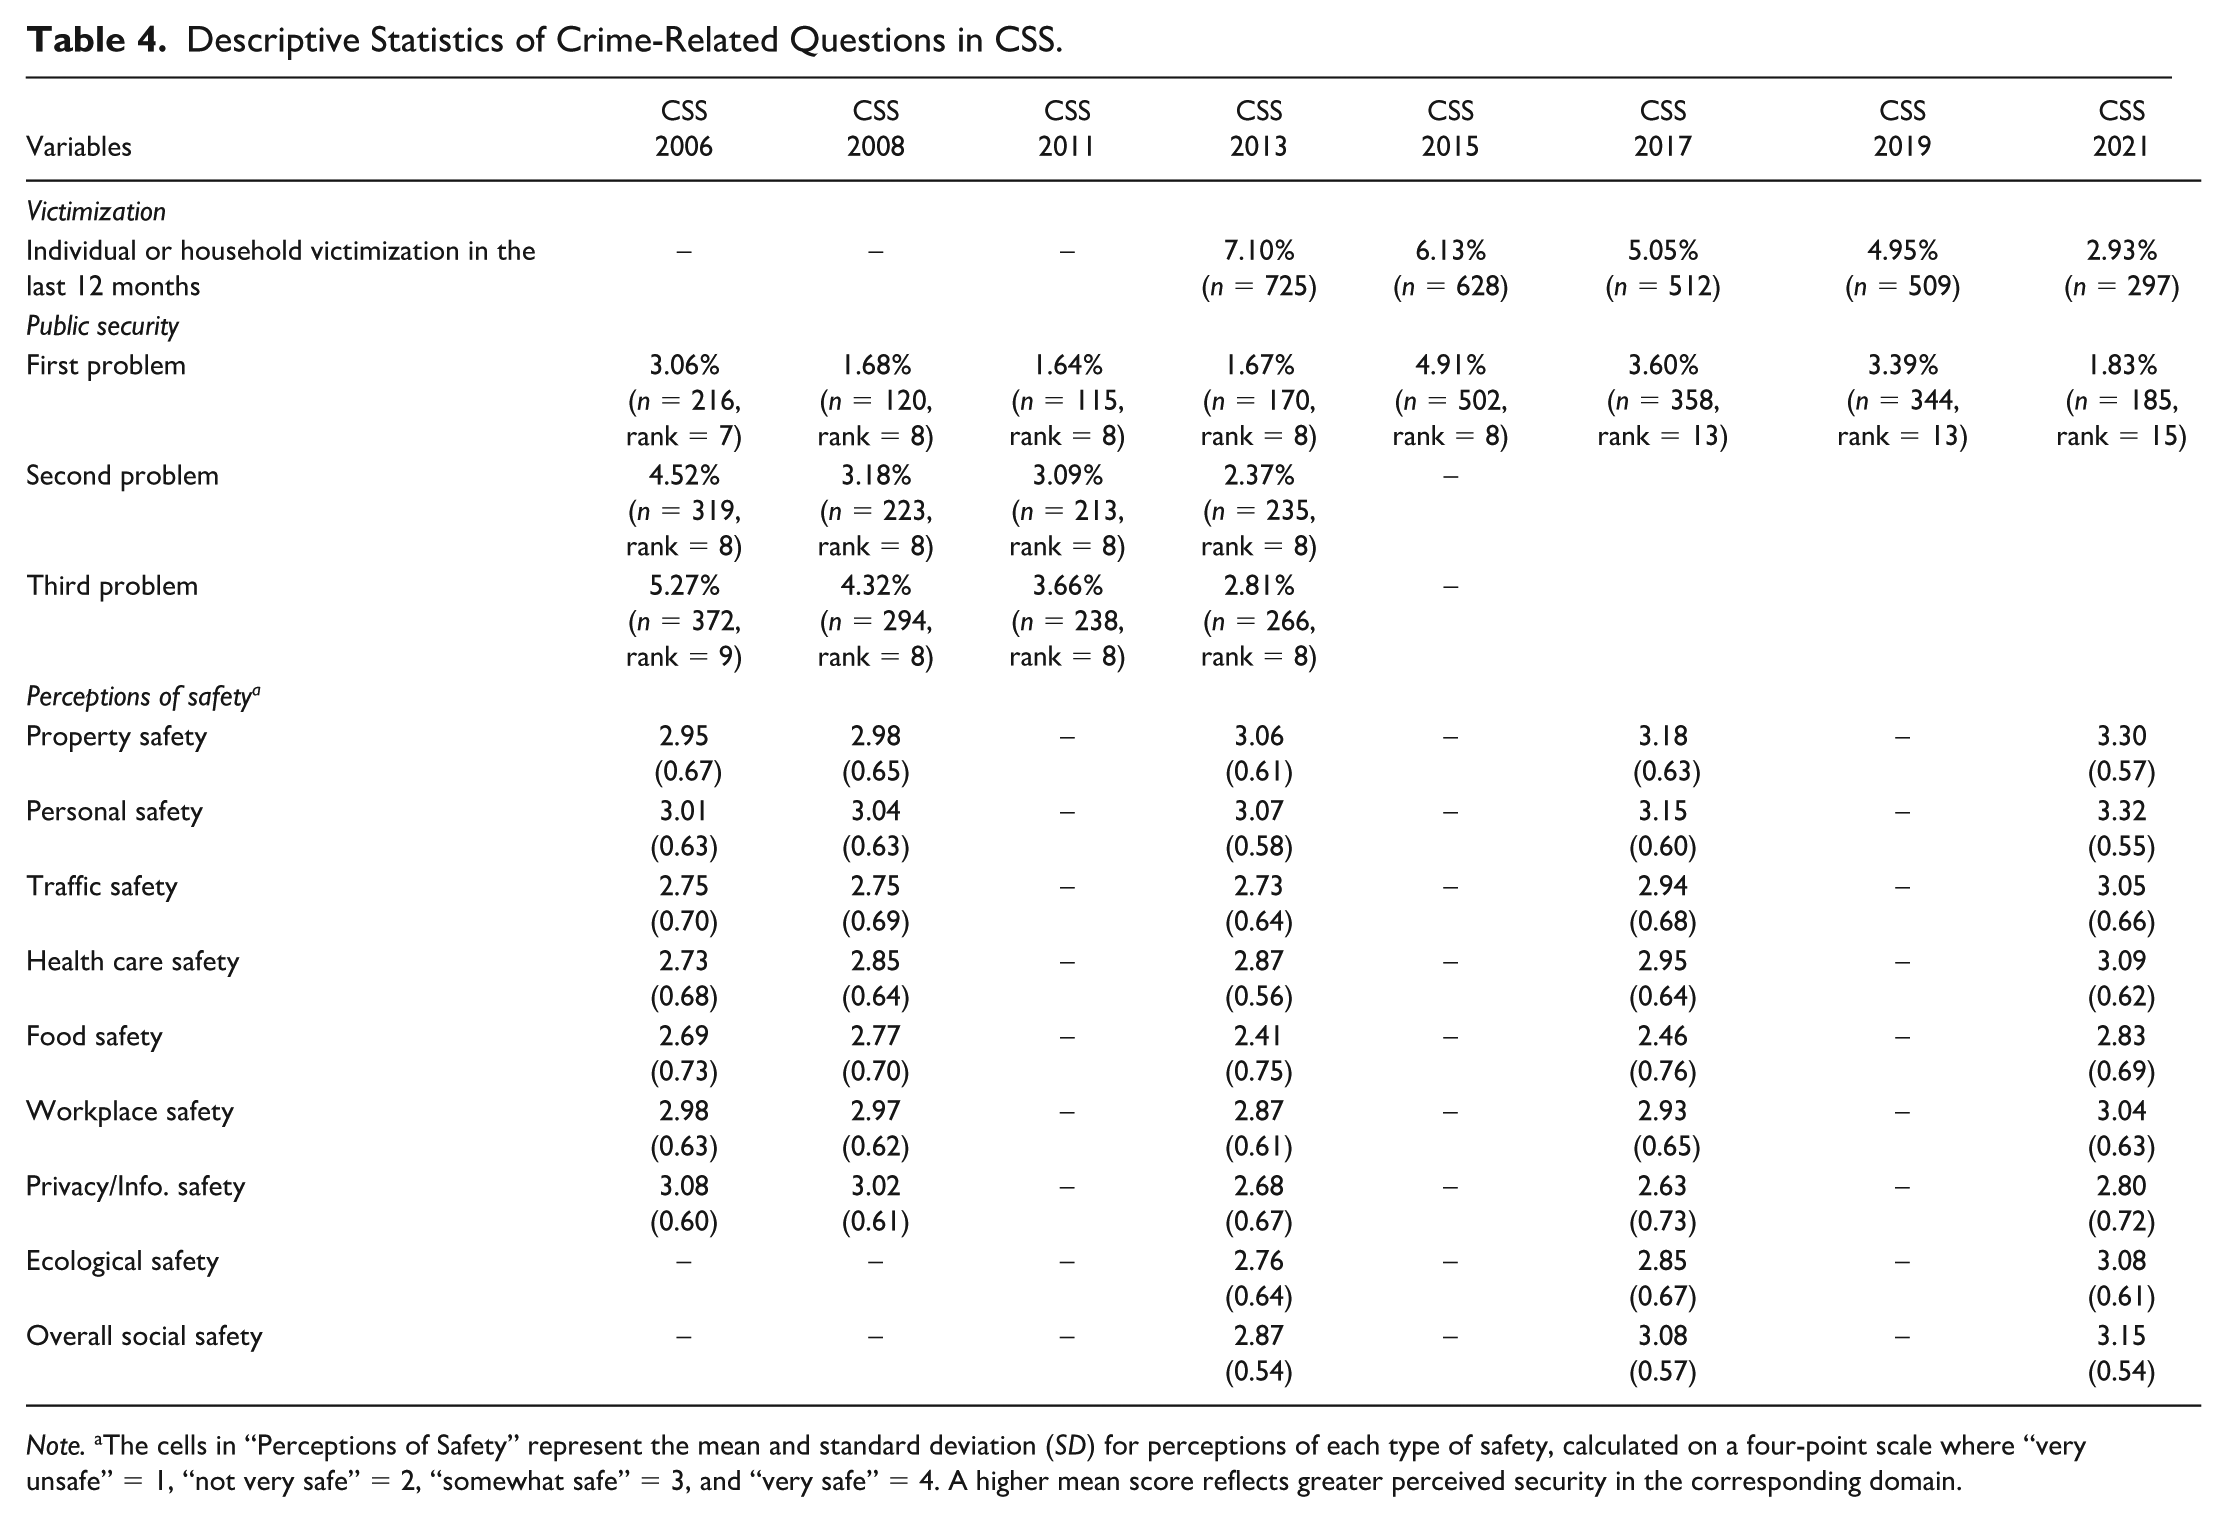
Note. aThe cells in “Perceptions of Safety” represent the mean and standard deviation (SD) for perceptions of each type of safety, calculated on a four-point scale where “very unsafe” = 1, “not very safe” = 2, “somewhat safe” = 3, and “very safe” = 4. A higher mean score reflects greater perceived security in the corresponding domain.
Direct questions about victimization were introduced after 2013, when respondents were asked whether they or their households had encountered crimes such as fraud, theft, or robbery within the past 12 months (D4 in 2013, D1 in 2015, 2017, 2019, 2021, and 2023). These questions offer a concrete measure of victimization and reveal a steady decline in reported rates over time—from 7.10% in 2013 to 2.93% in 2021. This trend may reflect reduced crime rates, shifts in reporting behavior, or both, presenting a rich area for further investigation.
Public security has been consistently included as an option in the CSS’s recurring question on the most pressing social issues, serving as an indirect measure of crime perception (Question D13 in 2006, E2 in 2008, G5 in 2011, F7 in 2013, G3 in 2015, G5 in 2017, 2019, G4 in 2021, G4 in 2023). Over the years, the percentage of respondents identifying public security as a major issue has varied, as outlined in Table 4. For instance, in 2006, 3.06% of the respondents ranked public security as their most pressing concern (seventh place), while by 2021, this figure had declined to 1.83% (15th place). This shift reflects changing societal priorities, with growing attention paid to issues such as health care, income inequality, and housing affordability.
The CSS also assesses perceptions of safety across multiple domains, including property safety, personal safety, traffic safety, health care safety, food safety, workplace safety, and privacy or information safety (E1 in 2006, F1 in 2008). In later waves, the survey was expanded to include assessments of ecological safety and overall social safety (F6 in 2013, G6 in 2017, G5 in 2021, G5 in 2023). Respondents rate these measures on a four-point scale from “very unsafe” to “very safe,” with higher scores indicating greater perceived safety. As shown in Table 4, most dimensions have gradually increased over time. For example, property safety increased from a mean score of 2.95 in 2006 to 3.30 in 2021, while personal safety rose from 3.01 to 3.32 during the same period. These upward trends suggest growing public confidence in these measures.
However, not all areas have shown consistent progress. Food safety experienced a decline in perceived safety during the mid-2010s, likely influenced by high-profile incidents of food contamination, before recovering to a mean score of 2.83 in 2021. Similarly, privacy and information safety showed notable fluctuations, with perceptions declining in earlier waves before rebounding modestly in more recent years. These variations underline the dynamic nature of public safety perceptions and the influence of external events on societal attitudes.
CLDS
Description, Scope, Methodology, and Accessibility
The CLDS is a large-scale, nationally representative longitudinal study initiated by the Social Science Survey Center at Sun Yat-sen University in 2012. The project aims to systematically monitor changes in labor force dynamics, family structures, and community-level developments across urban and rural China. Collecting data at the individual, household, and community levels, CLDS provides a rich, multidisciplinary resource for empirical research and policy evaluation. Key areas of focus include education, employment, migration, health, social participation, and grassroots governance.
CLDS targets working-age individuals aged 15 to 64 across 29 provinces in mainland China. The 2016 wave surveyed 401 communities, 14,226 households, and 21,086 individuals. Its broad scope spans topics such as labor rights, occupational health, job satisfaction, community political and economic conditions, household income and property, and agricultural production in rural areas. The data set provides national and regional data (eastern, central, and western regions) as well as data for Guangdong Province and the Pearl River Delta. This design ensures diverse perspectives and comprehensive coverage of China’s labor force dynamics.
CLDS employs a rigorous, multi-stage stratified probability sampling method proportional to labor force distribution. A distinctive feature of the survey is its rotating sample tracking design, which tracks selected communities for four rounds (6 years) before replacing them with new samples. This approach balances longitudinal tracking with cross-sectional representativeness, enabling the study to adapt to China’s rapidly changing social and economic landscape. Data collection is conducted using CAPI technology to enhance accuracy, supported by detailed interviewer training, robust anonymization protocols, and quality control mechanisms. The 2016 survey incorporated 96 new communities to ensure continued representativeness and data robustness.
The CLDS data set includes the 2011 Guangdong pilot, the 2012 baseline survey, and follow-up waves in 2014, 2016, and 2018. The data sets are accessible to Sun Yat-sen University faculty and students through the university’s Social Science Survey Center, while 2012, 2014, and 2016 data are open to the public via registration on the official CLDS website (http://css.sysu.edu.cn/) or by sending an email to
Questions Related to Victimization, Public Safety, and Crime
The CLDS provides a valuable data set for studying victimization, with direct questions included in every wave from 2012 to 2016 (I6.2 in 2012, I6.9 in 2014 and 2016). These questions focus on respondents’ experiences of victimization in the past 12 months, covering various types such as theft, robbery, assault, fraud, and threats. As shown in Table 5, the prevalence of victimization types declined slightly over time. For example, the theft victimization rate decreased from 8.14% (n = 1,324) in 2012 to 4.43% (n = 1,046) in 2014 and to 4.31% (n = 907) in 2016. Robbery consistently had the lowest rate, declining from 0.73% (n = 118) in 2012 to 0.34% (n = 72) in 2016. Other forms of victimization also exhibited downward trends over time.
Victimization Rate in CLDS.
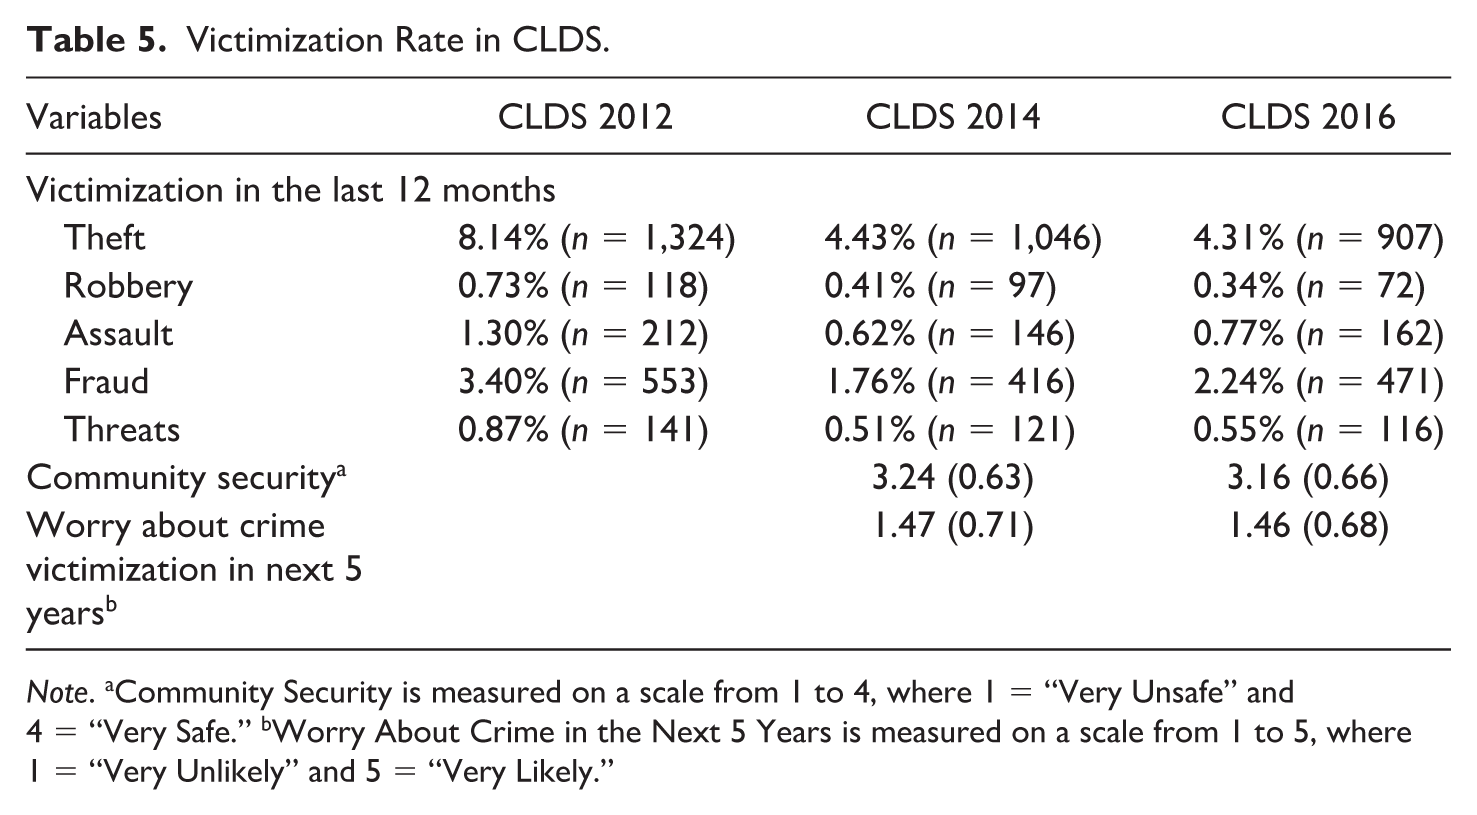
Note. aCommunity Security is measured on a scale from 1 to 4, where 1 = “Very Unsafe” and 4 = “Very Safe.” bWorry About Crime in the Next 5 Years is measured on a scale from 1 to 5, where 1 = “Very Unlikely” and 5 = “Very Likely.”
In addition to victimization experiences, the CLDS expanded its focus in 2014 and 2016 by incorporating questions on community security and anticipated risks of crime victimization. Community security is assessed on a 4-point scale (Question I6.5.1 in 2014 and 2016), where 1 indicates “Very Unsafe” and 4 indicates “Very Safe.” In 2014, the average perceived security was relatively high (M = 3.24, SD = 0.63), but it declined slightly in 2016 (M = 3.16, SD = 0.66).
Anticipation of crime victimization over the next 5 years was measured using a 5-point scale, where higher values indicate greater concern (I6.10 in 2014 and 2016). In both 2014 (M = 1.47, SD = 0.71) and 2016 (M = 1.46, SD = 0.68), the majority of respondents reported low levels of concern, with only a small number indicating high perceived risks of future victimization.
In the 2018 wave, the CLDS implemented innovative methodologies to explore victimization-related topics, differing from the direct questions used in earlier waves (I13_y). The survey employed list experiments to reduce reporting bias and promote truthful responses, particularly for sensitive issues. Respondents were asked to indicate the number of items they agreed with from a list, without specifying which ones. This approach allows researchers to estimate the prevalence of experiences such as sexual harassment, coercion into multi-level marketing schemes, theft or robbery, and coercive over time. This approach protects privacy and mitigates the stigma associated with disclosing victimization. By integrating these techniques with traditional measures, the 2018 wave expands the study of sensitive and underreported victimization experiences, providing valuable insights into these complex issues.
CHARLS
Description, Scope, Methodology, and Accessibility
The CHARLS is a large-scale, nationally representative longitudinal survey initiated in 2011 by the National School of Development at Peking University. Modeled after international aging studies such as the U.S. Health and Retirement Study (HRS) and the Survey of Health, Aging and Retirement in Europe (SHARE), CHARLS aims to provide high-quality microdata on health, economic, and social conditions among Chinese elder adults (Zhao et al., 2014).
CHARLS covers all 31 provinces, autonomous regions, and municipalities in mainland China, providing comprehensive national representation. The baseline survey conducted in 2011 included 17,708 respondents from 450 communities, with biennial follow-up waves implemented to maintain a longitudinal panel. The survey’s target population comprises individuals aged 45 and above, along with their spouses, ensuring coverage of middle-aged and older adults. Its scope extends across diverse domains, including physical and mental health, intergenerational transfers, and the socioeconomic impact of aging.
CHARLS employs a multi-stage stratified (by geographic region, urban/rural designation, and per capita GDP) random sampling design to ensure representativeness of the target population. Data collection is conducted via face-to-face interviews using CAPI technology, which minimizes errors and enhances data quality through real-time logic checks. The survey includes detailed training for field staff, robust anonymization protocols to protect respondent confidentiality, and comprehensive tracking mechanisms for panel continuity. In cases where respondents cannot participate directly, proxy respondents are utilized to minimize attrition.
Since its establishment, CHARLS has completed five waves: 2011–2012 (baseline), 2013, 2014, 2015, 2018, and 2020. Public access to the data sets is provided through the official CHARLS website (https://charls.charlsdata.com/). Upon successful submission and approval of the application, users can access and use the released data. Data files can be downloaded in Stata format, accompanied by questionnaires in Chinese (Simplified) and English, ensuring ease of use for both domestic and international researchers. Detailed methodological information is provided in Supplemental Appendix Table S5.
Questions Related to Victimization, Public Safety, and Crime
The CHARLS includes two sets of questions directly related to victimization: the life history module in 2014 and fraud victimization in 2015 and 2018.
The 2014 CHARLS investigated childhood victimization through questions addressing experiences of bullying and physical discipline. Regarding bullying, respondents were asked how often they were “picked on or bullied” by other children in their neighborhood or at school (F1 and F3). For neighborhood bullying, 72.82% of respondents (n = 14,427) reported “never” being bullied, 13.79% (n = 2,733) experienced it “not very often,” 9.52% (n = 1,887) “sometimes,” and 3.86% (n = 765) “often.” Similarly, for school-based bullying, 78.89% (n = 12,419) reported “never” being bullied, 11.83% (n = 1,863) “not very often,” 7.16% (n = 1,127) “sometimes,” and 2.12% (n = 334) “often.” These results indicate that while the majority of respondents avoided frequent bullying, a significant minority faced victimization during their childhood.
In addition, the 2014 CHARLS explored experiences of corporal punishment during childhood, focusing on interactions with female caregivers (K1_a), male caregivers (K1_b), and siblings (K1_c). Among female caregivers, 45.32% of respondents reported being “never” hit, 29.84% reported “rarely,” 20.49% reported “somewhat,” and 4.35% reported “often.” For male caregivers, 57.25% stated they were “never” hit, 25.35% reported “rarely,” 14.38% reported “somewhat,” and 3.02% reported “often.” Corporal punishment by siblings was less common, with 82.77% reporting “never” being hit, 10.60% reported “rarely,” 5.44% reported “somewhat,” and 1.19% reported “often.” These findings highlight variations in childhood victimization within familial and peer contexts.
The 2015 CHARLS asked respondents whether they had ever experienced fraud (HD005_W3) and, if so, the amount of financial loss incurred (HD005_W3_1). Among the respondents, 9.43% (n = 1,842) reported being victims of fraud, while 90.57% (n = 17,691) indicated no such experience. For those who suffered financial losses (n = 1,833), the average loss was ¥19,243.94, with a standard deviation of ¥123,106.90, and the maximum at ¥3,200,000. These findings reveal that although fraud victimization affected a minority of respondents, the financial impact varied greatly, with some individuals incurring substantial losses.
The 2018 CHARLS expanded its inquiry on fraud victimization and explored both recent and lifetime experiences of fraud (HD005-HD008). In the past year, 7.38% of respondents (n = 1,456) reported being targeted by fraud, with the most common type being telephone fraud (64.77%), followed by sales fraud (17.17%), other types of fraud (11.40%), fundraising fraud (3.57%), and pyramid schemes (3.09%). For those who reported financial losses (n = 1,453), the average loss was ¥5,436.60, with a standard deviation of ¥65,939.55, and losses ranged from ¥0 to ¥2,000,000.
Regarding lifetime fraud experiences involving property loss, 8.54% (n = 1,686) of respondents reported at least one incident. Among them, 70.96% experienced fraud once, while 29.04% experienced multiple incidents. The average single largest financial loss was ¥20,879.31, with a standard deviation of ¥130,671.60 and a maximum of ¥3,000,000. When asked about the year of their largest financial loss, most incidents occurred between 2008 and 2017, with notable peaks in 2013 (9.25%) and 2016 (12.04%).
CHFS
Description, Scope, Methodology, and Accessibility
The CHFS, conducted by the Research Center for China Household Finance at Southwestern University of Finance and Economics, is a large-scale, nationally representative survey designed to collect high-quality microdata on household finances in China. Initiated in 2011, the CHFS employs scientific sampling methods and modern data collection techniques to gather detailed information on household assets, liabilities (e.g., mortgages, credit card debt, and informal loans), income, expenditures, social security, and insurance. The survey serves as a valuable resource for domestic and international researchers studying Chinese household economic and financial behavior, with applications ranging from academic research to policy analysis (Gan et al., 2016).
The CHFS provides a comprehensive data set on household economic and financial behavior, including demographic characteristics, employment, and subjective attitudes. The 2011 baseline survey covered 25 provinces, 80 counties, and 320 villages/communities, with a nationally representative sample of 8,438 households. Subsequent waves expanded the scope to 29 provinces and sampled 28,141 households (2013), 37,289 households (2015), and 40,011 households (2017) in subsequent waves.
The CHFS employs a multi-stage stratified random sampling method, stratified by region and administrative divisions, with proportional allocation to household financial characteristics. Data collection is conducted through structured face-to-face interviews, supported by extensive training for field staff and rigorous quality control measures. The survey also incorporates follow-up visits to track household changes over time, ensuring the reliability and depth of its longitudinal data.
The CHFS has conducted seven waves of household financial surveys (2011, 2013, 2015, 2017, 2019, 2021, and 2023). The data sets are managed by the Research Center for China Household Finance at Southwestern University of Finance and Economics. Only the five waves of the CHFS from 2011, 2013, 2015, 2017, and 2019 are currently available for both internal and external researchers, whereas other data sets remain inaccessible to external researchers. Access to the CHFS data is granted for academic purposes through the center’s official website (https://chfser.swufe.edu.cn/datas/). Data files are provided in Stata format, along with questionnaires, technical documentation, and data usage guides. CHFS provides both household and individual weights. Household weights reflect the probability of selecting households within each community or village. To adjust the sample to national population distributions, individual weights are derived by multiplying household weights by post-stratification factors such as gender, age, and region. Detailed methodological information is provided in Supplemental Appendix Table S6.
Questions Related to Victimization, Public Safety, and Crime
The CHFS 2015 survey includes a comprehensive module on fraud victimization, providing insights into the prevalence and characteristics of such experiences among Chinese households (E3016-E2021). In the past year, 10.73% (n = 4,001) of households reported encountering at least one type of fraud, with an additional 27.75% (n = 10,347) experiencing multiple types. Among the specific types of fraud, phone scams were the most commonly reported, affecting 50.75% (n = 18,901) of respondents, followed by SMS scams, which impacted 44.19% (n = 16,458). Online frauds via platforms such as QQ and WeChat were less prevalent, reported by 9.02% (n = 3,360), while phishing website scams affected 3.07% (n = 1,143). Face-to-face frauds, including those involving acquaintances, multi-level marketing schemes, or dishonest transactions, were reported by 6.98% (n = 2,601).
Among households that experienced fraud, 6.13% (n = 1,332) reported financial losses. Face-to-face scams were the primary cause of these losses (29.98%, n = 396), followed by impersonation of officials or institutions (14.53%, n = 192) and fraudulent product sales (7.57%, n = 100). The average financial loss reported was ¥16,746.17, with a standard deviation of ¥96,830.88.
Responses to fraud among households varied widely. The majority of victims (58.71%, n = 782) chose to “do nothing and accept the loss,” while 19.44% (n = 259) reported the incident to law enforcement, and 19.14% (n = 254) informed others about the scam. When asked about the causes of their victimization, 69.55% (n = 916) cited “trusting others and low awareness,” while 26.20% (n = 345) attributed their experience to the “highly deceptive tactics” used by fraudsters.
The CHFS 2017 wave provided a comprehensive assessment of victimization by including detailed questions about household experiences with crime, financial losses, and psychological impacts (E3350–E3356). Households were asked whether any member had encountered specific crimes in the past year, including pickpocketing (1.93%, n = 771), robbery (0.16%, n = 64), home invasion (1.29%, n = 515), sexual harassment (0.03%, n = 12), sexual violence (0.00%, n = 1), trafficking (0.00%, n = 2), fraud (0.90%, n = 360), traffic accidents (0.51%, n = 203), and personal injury (0.12%, n = 50). Overall, 4.71% of households (n = 1,886) reported at least one type of victimization, while the majority (95.29%, n = 38,125) reported no such experiences.
For households reporting victimization, the survey also collected data on financial losses. Among the 1,780 households providing information, the average loss was ¥17,046, attributed to property damage, medical expenses, and other costs. In addition, 35.8% of victimized households (n = 658) reported experiencing psychological trauma, with 4.1% (n = 27) seeking psychological counseling with an average cost of ¥2,300.
The CHFS 2017 survey further investigated compensation for emotional distress. Of those reporting psychological trauma, 1.98% (n = 13) received compensation for psychological damages, with amounts ranging from ¥0 to ¥600,000.
Evaluation of the Social Surveys as Crime Data Sources
These six national surveys present both strengths and limitations for victimization research. Strengths include their large scale, national representativeness, and regular updates, which ensure broad coverage over time; most are publicly accessible and supported by established infrastructures; and they employ multi-stage stratified sampling while collecting individual- and household-level information, enabling analyses that situate victimization within broader social, economic, and demographic contexts. Limitations, however, are equally notable: victimization items are sparse, inconsistent across waves, and limited in scope; critically, many items were not designed with criminological theory in mind, which weakens construct validity and constrains theory-driven inference; some surveys report victimization only at the household level; panel linkage can be unclear and attrition is nontrivial; and access to restricted variables or full documentation can be difficult. Consequently, although these data sets offer valuable opportunities, their criminological utility is curtailed by limited detail, comparability, theoretical grounding, and accessibility.
Each survey also has distinctive strengths and weaknesses. The CGSS, with its cross-sectional design and thematic modules, offers insights into public attitudes, safety perceptions, and indirect victimization, although it lacks longitudinal comparability. The CFPS enables tracking of individuals and households over time, supporting analyses of cumulative risks and long-term effects, yet variations in victimization items hinder wave-to-wave comparability. The CSS is notable for its stability across waves, allowing consistent trend analyses, but provides limited detail and no panel linkage. The CLDS, focused on the working-age population, supplies valuable information on labor dynamics and community security with direct measures of victimization, although only for a narrow set of crime types. The CHARLS contributes a life-course perspective, particularly on childhood experiences and fraud among older adults, but is constrained by attrition and limited coverage. Finally, the CHFS, although centered on household finance, contains detailed modules on fraud and crime-related financial losses, enabling economic analyses of victimization, albeit mainly at the household level. Table 1 provides a structured comparison of their strengths and limitations.
The Value and Utility of the Social Surveys as Crime Data Sources
Despite their value, the application of these data to criminological and victimological research remains limited, with few studies systematically exploring victimization trends, contributing factors, and consequences. To date, research has utilized these data sets to address three major topics. First, research has investigated environmental victimization and its societal implications. For instance, Munro (2014), using CGSS 2006 data, analyzed public awareness of pollution-related harm and its contributing factors and found that self-identification as a pollution victim does not easily translate into willingness to take action against it.
Second, studies have examined the social and psychological impacts of victimization. For social impacts, Zhong et al. (2017), utilizing CLDS 2012 data, illuminated the relationship between social exclusion and victimization among rural-to-urban migrants, emphasizing the vulnerabilities of marginalized populations. While Xia et al. (2025), based on CFPS 2012–2020 data, showed that fraud victimization significantly reduces generalized trust for up to 2 years, after which trust levels gradually recover. Regarding psychological impacts, Cheng and Smyth (2015), using CGSS 2006 and 2010 data, found that both being a crime victim and knowing someone who has been victimized negatively affect individuals’ sense of happiness. Drawing on CHARLS 2014 life-course data, Lv and Li (2023) explored the link between childhood exposure to domestic violence and depressive symptoms in middle and older age. Similarly, Wang (2020), also using CHARLS 2014 data, highlighted how childhood intrafamilial aggression contributes to adult depression, both directly and indirectly through peer bullying. Then, Jiang and Shi (2024), with CHARLS 2014 and 2018 data, revealed a significant association between childhood bullying victimization and severe depression in later life, underscoring the enduring impact of early-life victimization.
Third, significant attention has been given to the factors influencing victimization, with particular focus on fraud victimization and older adults. For social determinants, Meng and Yi (2025), using CLDS 2012, 2014, and 2016 data, showed that heat exposure increases the probability of crime victimization, while Zhang (2021), based on CGSS 2015 data, identified the prevalence, risk factors, and consequences of workplace victimization and discrimination. In parallel, researches drawing on CHFS 2015 data has highlighted the role of financial literacy, overconfidence, low self-control, and risk exposure in shaping fraud victimization (Chen & Xia, 2025; Du & Chen, 2023; Fan & Yu, 2021, 2022; Xiao et al., 2022). Turning to older adults, several studies using CHARLS 2018 data reveal heightened vulnerabilities: Xin et al. (2024) examined fraud re-victimization and the moderating role of routine activities; Wang et al. (2023) showed that different types of fraud, such as telecommunication scams and pyramid schemes, exert distinct effects on depressive symptoms; Yao et al. (2025) demonstrated that social participation increases fraud risk while social support and security mitigate it; and Liu and Zhao (2025) found that retirement raises both the likelihood of fraud victimization and the associated economic losses.
Conclusion and Discussion
This study reviewed six major social surveys in China and evaluated their relevance for criminology and victimology. These data sets shed light on victimization patterns, public safety perceptions, and broader crime-related dynamics, providing a valuable yet fragmented foundation for victimological research. Although other national or regional surveys sometimes include victimization items, they lack systematic coverage and were therefore not considered here. Overall, the reviewed surveys highlight important opportunities for criminologists who engage with their content to analyze victimization patterns, causes, and prevention.
Building on these observations, it is clear that China still lacks a systematic victimization survey comparable to the National Crime Victimization Survey, the Crime Survey for England and Wales, or the European Union Crime and Safety Survey, which capture crime experiences, reporting behavior, and consequences in a comprehensive manner. Developing such instruments in China, however, faces substantial obstacles. Politically, crime is highly sensitive and requires official approval. Culturally, collectivist norms and deference to authority undermine the validity of self-reports. Methodologically, the absence of detailed census data hampers refined sampling, and sensitive questions are often excluded. Practically, financing, confidentiality, and cross-national quality control demand compromises between scientific ideals and local constraints. Together, these barriers underscore the distinctive complexity of conducting large-scale victimization surveys in China (Wei et al., 2023; L. Zhang et al., 2007).
Despite these barriers, several strategies can still advance victimization data collection in China. First, a stand-alone, nationally representative victimization survey could be developed and implemented by academic institutions or research organizations. This approach would allow for rigorous sampling and in-depth data collection but would require substantial financial investment and high-level coordination. Second, victimization modules could be embedded within existing national surveys, such as the CGSS or CFPS. These platforms already provide nationally representative samples and institutionalized data infrastructures. Adding thematic modules through collaborative funding mechanisms would offer a cost-effective and methodologically sound solution. Among the three, this approach appears the most feasible and impactful in the short term. Third, online surveys administered via crowdsourcing platforms (e.g., MTurk, Credamo) can be employed to flexibly and efficiently gather data on victimization experiences. However, such methods face challenges regarding sample representativeness and data validation, which may limit their generalizability for policy-oriented research.
In conclusion, advancing victimization data collection requires Chinese criminologists to advocate for and collaborate on the systematic inclusion of such questions in large-scale social surveys. Doing so would strengthen the empirical foundations of victimological research, support evidence-based crime prevention and victim services, and contribute to broader criminological knowledge.
Supplemental Material
sj-docx-1-ccj-10.1177_10439862251387468 – Supplemental material for Approaching Crime Information from Major National Social Surveys in China: A Comprehensive Review of Their Value and Utility for Criminological Research
Supplemental material, sj-docx-1-ccj-10.1177_10439862251387468 for Approaching Crime Information from Major National Social Surveys in China: A Comprehensive Review of Their Value and Utility for Criminological Research by Yiwei Xia, Zijun Liu and Yanyu Xin in Journal of Contemporary Criminal Justice
Footnotes
Declaration of Conflicting Interests
The authors declared no potential conflicts of interest with respect to the research, authorship, and/or publication of this article.
Funding
The authors received no financial support for the research, authorship, and/or publication of this article.
Supplemental Material
Supplemental material for this article is available online.
Author Biographies
Email:
Email:
Email:
References
Supplementary Material
Please find the following supplemental material available below.
For Open Access articles published under a Creative Commons License, all supplemental material carries the same license as the article it is associated with.
For non-Open Access articles published, all supplemental material carries a non-exclusive license, and permission requests for re-use of supplemental material or any part of supplemental material shall be sent directly to the copyright owner as specified in the copyright notice associated with the article.