
Abstract
Deaths of despair (15+ years) are described for two peer county groups. Each county experienced competitive, transitional, or monopoly governance based on the duration of one political party’s control. Highest mortality among non-Hispanic Black (Black) people occurred in monopolies, affecting all age-sex-specific groups from 15–19 to 65–69. Transition to Democratic or Republican party monopolies produced similar overall trends. Governance by the same political party produced different rates depending on the length of one-party control. Black: White mortality rate ratios were reduced or reached 1.0 in competitive counties, and 51,801 fewer Black deaths might have occurred in monopoly counties based on competitive rates. The association between duration of one-party control and death rates was statistically significant and independent of state gun law strength. The data generate a hypothetical framework for structural racism based on political privilege/political monopoly rather than racial privilege/political affiliation. Analytic epidemiologic research is needed for testing.
Introduction
The idea of a syndrome comprising deaths from alcohol, substance abuse, and self-harm was developed during the second decade of the 21st century (King et al., 2022). It gained traction from two influential papers by Case and Deaton (2015, 2017), who coined the term, “deaths of despair” (Case & Deaton, 2017, 2020; King et al., 2022). Prominent theories about the origins of this syndrome included economic disruption (leading to hopelessness) (Case & Deaton, 2020; King et al., 2022) and the availability of lethal intoxicants, with lower educational attainment associated with higher vulnerability (Case & Deaton, 2020; Cutler & Lleras-Muney, 2010; King et al., 2022).
Recent strategies for building national resilience to this syndrome have included better access and coordination of health care, behavioral health, and social services; improving pain treatment; and harm reduction (for example, expanded access to naloxone and clean needle programs) (Auerbach & Miller, 2018). Nonetheless, deaths of despair remain a significant and increasing source of mortality in the United States (King et al., 2022; Mejia et al., 2024). The present report, therefore, aims to generate new hypotheses by describing racial inequities in deaths of despair in two groups of populous urban counties in the United States, each group being internally matched for 19 socioeconomic factors, including income inequality. Also, instead of broad, national policies, the present report will focus more closely on local politics, in particular, mayoral governance at the county seat.
Unlike state or national contests, U.S. mayoral elections focus more closely on local issues (Das et al., 2022). The local power to tax, issue bonds, and annex/zone land (Farmer, 2018; Gordon, 2008) provides county governments with significant autonomy to shape local employment, educational offerings, environmental exposures, safety infrastructure, and local and regional services (Farmer, 2018; Gordon, 2008). Local resources may also be extensive. As of 2015, the 100 largest U.S. cities had average budgets of $2.145 billion (Ballotpedia, n.d.). Primary centers of urban county government (county seats) may therefore have far-reaching influence on the infrastructure of smaller governmental units and neighborhoods within their purview (Baerwald, 1977). Moreover, local political forces are upstream from socio-economic determinants, and as noted by Navarro (2011), “It is not inequalities that kill people. It is the people who produce and reproduce inequalities through their public and private interventions that kill people. . . .”.
Political competition is a key aspect of local politics and may be pertinent to Navarro’s warning. Vibrant political competition has been found to rein in strident single-issue groups, temper conflict, and aggregate disparate interests (Parry et al., 2022). One-party dominance may reduce government efficiency (Gamm & Kousser, 2010), produce neglect of education and transportation policy in favor of hot-button issues important to narrow segments of the electorate (Burke, 2020), diminish bipartisan cooperation (Barrilleaux et al., 2002; Hare & Poole, 2014), decrease state spending on welfare programs in some instances (Holbrook & Van Dunk, 1993; Terry, 2016), and decrease representation of lower socioeconomic groups (Gamm & Kousser, 2021). Political scientists have also shown that non-competitive gubernatorial elections are associated with higher infant mortality, poorer educational outcomes, and shorter life expectancy, partly because expenditures for social services decrease when politicians are uncontested (Gamm & Kousser, 2021). Similarly, state-level analysis has shown that states with systems of political accountability and checks and balances are associated with more favorable health outcomes (Pacheco & LaCombe, 2022).
The present report will also account for steadily evolving concepts pertaining to “Deaths of despair”. For example, the term, “Despair” itself has been characterized as a hypothesis in need of testing by some (Shanahan et al., 2019), and the original Case-Deaton definition (Case & Deaton, 2015, 2017) has been modified by Dwyer-Lindgren et al. (2018), who broadened the syndrome to include assault (King et al., 2022). Under the Dwyer-Lindgren definition, the constellation of causes may be better described as “Harm to self or others” (Dwyer-Lindgren et al., 2018). This is more consistent with psychological theory than a definition based on self-harm alone (Eisner et al., 2021; Feinberg et al., 1982; Hiroto, 1974; National Academies of Sciences, Engineering, and Medicine, 1994; Rotter, 1966; Seligman, 1974; Weiss et al., 1985; Zuroff, 1980). While it was initially proposed that prolonged exposure to adversity produces learned helplessness, it was later recognized that helplessness is not learned. Instead, it is passive and ingrained (Seligman, 1974). Passivity and anxiety, in turn, map well to symptoms of depression, a significant risk factor for self-harm and suicide (Eisner et al., 2021; National Academies of Sciences, Engineering, and Medicine, 1994; Weiss et al., 1985). Also, a perceived external locus of control (people who feel that they do not control their own lives (Hiroto, 1974) is an important psychological factor that has long been understood to interact positively with helplessness (Lefcourt, 1966; Rotter, 1966; Zuroff, 1980). In contrast, others may perceive that violent behavior and/or violent ideation constitutes a valid response to prolonged, uncontrollable, and inescapable adversity (Feinberg et al., 1982).
Adopting Ecosocial Theory (Krieger, 2012), we expect that governance by one political party for extended periods could be associated with harm to non-dominant groups based, in part, on political privilege, whether or not the politically privileged are of the same race as non-dominant residents (Hyra, 2017). Further, we compare socially matched communities with differing exposure to political monopoly, thereby seeking to describe results pertinent to the observation that social determinants of health (Cockerham et al., 2017) have political roots (Dawes, 2020). A list of public internet sites used to compile the duration of mayoral terms and political affiliations is shown in Supplemental Table 1.
Method
Study Design
The method of using peer county analyses to identify modifiable determinants of inequities adversely affecting a racial minority has been previously reported (Levine et al., 2007). Detection of differences within peer county groups other than socioeconomic factors is facilitated as counties are matched for social and economic factors.
Setting and Data
Data for 2001 to 2023 were from all decedents ages 15 to 85+ years issued death certificates in America’s two most populous peer county groups (Group 1, n = 34 counties; Group 2, n = 32 counties) as defined by the Robert Wood Johnson Foundation (RWJ) (County Health Rankings and Roadmaps, 2017, 2023), with the exception of Collin County, TX in Group 2 as information about mayoral political party affiliations was not available. RWJ peer county classifications are based on matching for the following: median household income, population growth, percent high school graduates, receipt of government financial assistance, population density, single-parent households, Gini index of income inequality, population mobility, median home value, overall poverty, percent children, housing stress, elderly poverty, percent elderly, percent foreign-born, population size, percent owner-occupied housing units, unemployment, and sex ratio (County Health Rankings and Roadmaps, 2017, 2023). The RWJ classification for peer group one represents the most populous and established 34 major urban centers/cities across 20 states and the District of Columbia – with 19 having been among the most densely populated cities in the United States as early as the 1900 Census (U.S. Census Bureau, 1906): Orleans, LA (New Orleans); Fulton, GA (Atlanta); Suffolk, MA (Boston); Cook, IL (Chicago); St. Louis City, MO; Philadelphia, PA; Essex, NJ (Newark); Union, NJ (Elizabeth); Milwaukee, WI; District of Columbia; Wayne, MI (Detroit); Cuyahoga, OH (Cleveland); Hudson, NJ (Jersey City); Providence, RI; and New York, Kings, and Queens, New York City); these will be called Historic Metropolitan Peer Counties. Peer group two comprises less populous and later emerging places, with only five of the 33 counties being among the most densely populated in 1900 (San Francisco, CA; Richmond, NY (Staten Island); Allegheny, PA (Pittsburgh); Ramsey, MN (St. Paul); and Alexandria City, VA); these will be called Emerging Urban Peer Counties.
Thus, peer group one counties are larger, long-established, and globally recognized metropolitan centers. These will be called Historic Metropolitan Peer Counties. Peer group two includes smaller, newer, or rapidly expanding urban areas. These will be called Emerging Urban Peer Counties.
Exposure to the lack of political competition is based on the duration of governance in years by a single political entity at the county seat during the observation period (2001–2023). We used a modification of Sørensen’s definition (one-party victory for consecutive terms totaling at least 24 years with margins of 60% or more (Sørensen, 2014). Instead, we classified counties having 24 or more years of one-party governance throughout the observation period (2001–2020) = Monopoly; having <24 years as of both 2001 and 2020 = Competitive; or Transitional (<24 years in 2001 and 24 or more years as of 2020). In part, our rationale was that one-party control may be maintained without an election if the chief executive leaves before completing a term. In addition, the 60% criterion is a rare and moving target in local U.S. elections, partly because the percentage of voters who vote is both variable and small. A study conducted during the observation period found that the median turnout was 20% of registered voters in urban mayoral elections, with turnouts varying from 6% to 52% (Jurjevich, 2018; Jurjevich et al., 2016), so achieving 60% of the vote could have represented anywhere from 3.6% to 31.2% of registered voters in those communities.
Data Sources and Rationale
Death certificate data (county-race-ethnicity-gender-age-specific mortality rates as applicable, standard errors and 95% confidence intervals [CI]) are provided on the public internet site (Wide ranging Online Data for Epidemiologic Research [WONDER]) of the US Centers for Disease Control and Prevention (CDC) (Centers for Disease Control and Prevention, National Center for Health Statistics, 2021). Multiple Cause of Death Files were used to identify deaths of harm to self or others for all people ages 15 to 85+ years for whom deaths of despair were considered underlying or contributory causes of death, thereby averting underestimation (Fedeli et al., 2015). The constellation of causes comprising deaths of harm to self or others included the following: (a) Drug-related – mental and behavioral disorders due to use of opioids, cannabinoids, sedatives, hypnotics, cocaine, other stimulants, hallucinogens, volatile solvents, multiple drug use, and use of other psychoactive substances (F11-F19); Finding of opiate drug (R78.1), cocaine (R78.2), hallucinogen (R78.3), or psychotropic drug in blood; accidental poisoning by and exposure to non-opioid analgesics, antipyretics, antirheumatics; antiepileptic, sedative-hypnotic, anti-parkinsonism, and psychotropic drugs not elsewhere classified; and narcotics, psychodysleptics [hallucinogens] not elsewhere classified; drugs acting on the autonomic nervous system; other and unspecified drugs, medicaments, and biological substances (X40-X44); (b) Alcohol-related – mental and behavioral disorders due to use of alcohol (F10), alcohol-induced pseudo-Cushing syndrome (E24.4), degeneration of nervous system due to alcohol (G31.2), alcohol polyneuropathy (G62.1), alcoholic myopathy (G 72.1), alcoholic cardiomyopathy (I42.6), alcoholic gastritis (K29.2), alcoholic liver disease (K70), alcohol-induced acute pancreatitis (K85.2), alcohol-induced chronic pancreatitis (K86.0), newborn affected by maternal use of alcohol (P04.3 – deaths beyond infancy), fetal alcohol syndrome (dysmorphic) (Q86.0), finding of alcohol in blood (R78.0), accidental poisoning by and exposure to alcohol (X45), poisoning by and exposure to alcohol, undetermined intent (Y15); and (c) Violence – assault (X85-Y09), intentional self-harm (X60-X84), sequelae of intentional self-harm (Y87.0), and sequelae of assault (Y87.1) (Dwyer-Lindgren et al., 2018; King et al., 2022).
In these analyses, we considered each New York City County (four in the Historic Metropolitan Peer Counties (Bronx, Kings (Brooklyn), New York (Manhattan), and Queens), and one in the Emerging Urban Peer Counties (Richmond [Staten Island]) as unique, even though they all have the same mayor. Previous research has shown that different New York City counties have distinctly different environmental and sub-mayoral governance characteristics (Wallace & Wallace, 2000) associated with varying outcomes of mortality (Fry-Johnson et al., 2010; Wallace & Wallace, 2000). Compilation of the duration of single political party governance at the county seat is based on multiple public internet sources (Supplemental Table 1). A table that includes content from the referenced sites may be obtained on request.
Because gun law strength has been observed to reduce deaths from both homicide (Lee et al., 2017) and suicide (Saunders, 2022) during the observation period, ordinary least squares multiple regression (Freemantle, 2000; Glantz, 1992) was used to learn whether duration of one-party mayoral governance was associated with deaths of harm to self or others independently from average state gun law strength as per estimates which approximate the observation period (Chien et al., 2022).
Sign tests were used to compare age (5-year age groups)-race-sex-specific (crude) Black (monopoly):Black (competitive) and White (monopoly):White (competitive) mortality rates. Two-sided probabilities were based on both cumulative probability and the normal approximate z (Freemantle, 2000).
Additional Statistical Methods
Yearly, age-adjusted mortality rates (2001–2023) and 95% Confidence Intervals were presented according to political exposure (Monopoly, Transitional, or Competitive). Mortality rate ratios for non-Hispanic Black:non-Hispanic White people were used to further estimate the magnitude of inequity, while intra-racial rate ratios were used to compare monopoly and competitive county rates. Estimates of excess deaths in monopoly versus competitive counties were made by applying age-race-sex-specific mortality rates from competitive counties to corresponding populations in monopoly counties, subtracting the resulting hypothetical numbers of deaths from the actual numbers of deaths, and obtaining totals.
Results
Table 1 shows the political classification of counties in peer groups one and two as monopoly, transitional or competitive. All monopolies as of 2023, except for Oklahoma City, OK (Republican), have been governed by the Democratic Party. Nonetheless, 11 of 13 Competitive counties in the Historic Metropolitan Peer County group were also governed by the Democratic Party as of 2023 (with one Republican Party and one Independent comprising the rest). Similarly, in the Emerging Urban group, six of nine transitional counties became Democratic monopolies (with two transitioning to Republican and one to Independent monopolies). In comparison, 6 of 10 competitive counties in the Emerging Urban group were governed by the Democratic Party as of 2023, while three were Republican and one was Independent.
Counties and County-Equivalents, Governmental Center (County Seat), and Duration of Mayoral Political Party Affiliation (2001 and 2023).
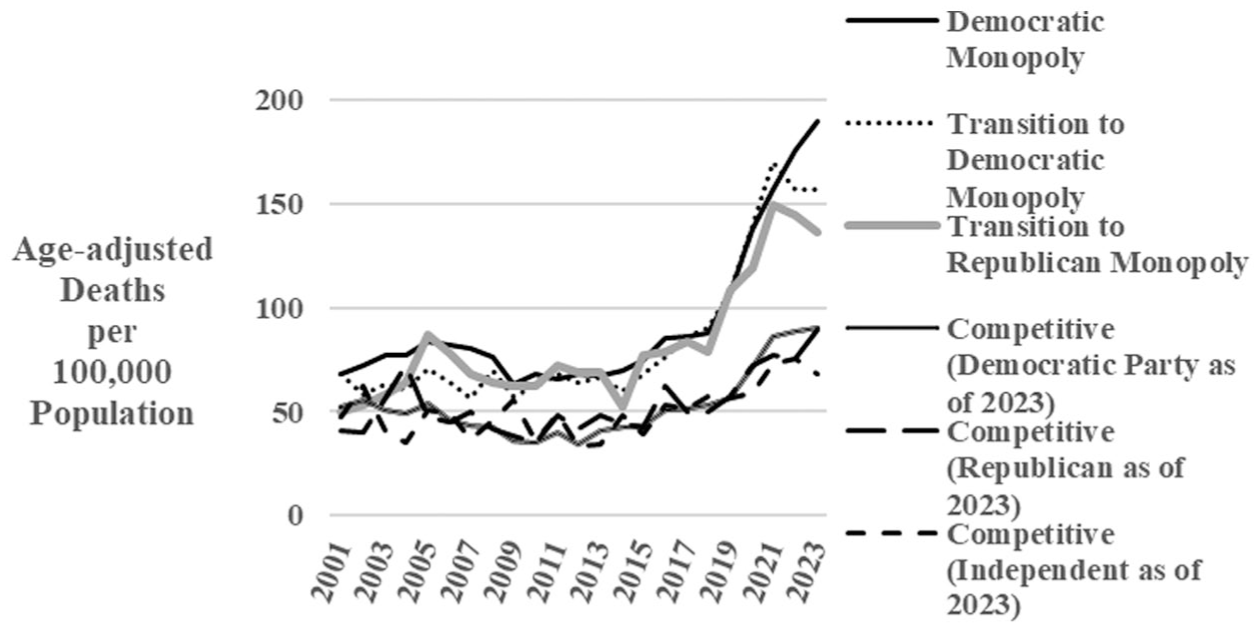
Figures 1 and 2 show yearly mortality rates for non-Hispanic Black residents according to political exposure: monopoly throughout the observation period; transitional (from competitive in 2001 to monopoly as of 2023); and Competitive throughout the observation period. Both peer groups show that rates are significantly higher in monopoly counties than in competitive counties throughout the observation period. In contrast, rates in transitional counties are initially similar to competitive counties and then over time become significantly higher than competitive counties; they are intermediate between monopoly and competitive counties as of 2023. Supplemental Figures 1 and 2 depict these results using the original, Case-Deaton (Case & Deaton, 2015, 2017) definition of Deaths of Despair. Again, monopoly counties have the highest rates, competitive counties have the lowest, and transitional counties become intermediate.
Deaths of despair in monopoly, transitional, and competitive counties among non-Hispanic Black residents (15+ years) according to type of local governance. Historic metropolitan peer counties, 2001 to 2023.
Deaths of despair among non-Hispanic Black residents (15+ years) and 95% confidence intervals in monopoly and competitive counties according to the type of local governance. Emerging urban peer counties, 2001 to 2023.
Figures 3 (Historic Metropolitan) and 4 (Emerging Urban) depict rates according to political party. All Transitional counties among the Historic Metropolitan peer counties became Monopoly Democratic, but in the Emerging Urban peer counties, there was evolution to both Monopoly Democratic and Monopoly Republican. Within Competitive counties in both peer groups, there were control by Democratic, Republican, and Independent mayors as of 2023. In both peer groups, counties with monopoly governance throughout have the highest rates, while those transitioning to monopoly status are intermediate between monopoly and competitive counties. Counties transitioning to monopoly status had similar values regardless of which major political party monopoly was reached, and the same was true of political party classification within the competitive groups. The lowest rates as of 2023 were found for counties with competitive Independent Party governance as of that year in both peer groups.
Deaths of despair among Black residents (15+ years) according to the type of local governance and political party. Historic metropolitan peer counties, 2001 to 2023.
Deaths of despair among Black residents (15+ years) according to the type of local governance and political party. Emerging urban peer counties, 2001 to 2023.
Figure 5 depicts sex-specific, Black:White mortality rate ratios in monopoly and competitive counties in the most recent 5-year period for which data are available. In both Historic Metropolitan and Emerging Urban Peer counties, inequities are either reduced or eliminated in competitive compared to monopoly counties.
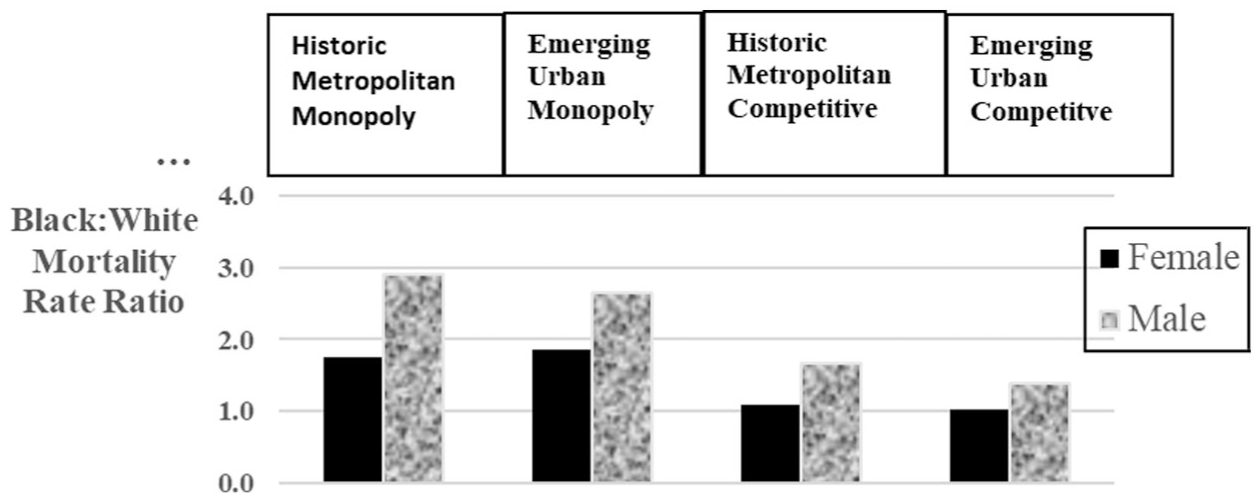
Black:White mortality rate ratios in monopoly and competitive peer counties. Deaths of despair. Ages 15+ years. 2019 to 2023.
Table 2 shows comparisons of age (5-year age groups)-race-ethnicity (non-Hispanic)-sex-specific (crude) mortality rates among Black monopoly and competitive county residents and White monopoly and competitive county residents in the Historic Metropolitan and Emerging Urban peer county groups for which reliable rates (at least 20 deaths) (Centers for Disease Control and Prevention, National Center for Health Statistics, 2021) were available. Among Black residents, rates were significantly higher in monopoly counties in all but one of 51 instances (75- to 79-year-old females in Historic Metropolitan Peer Counties); two-sided Cumulative and Normal Approximate z probabilities both <0.001. In contrast, comparable comparisons for White residents were not significantly different in 40 of 56 instances (two-sided Cumulative and Normal Approximate z probabilities both = 0.002).
Age-Race-Ethnicity-Sex-Specific Mortality Rates From Deaths of Despair Among Black Monopoly and Competitive County Residents and White Monopoly and Competitive County Residents in the Historic Metropolitan and Emerging Urban Peer County Groups for Which Reliable Rates Were Available.
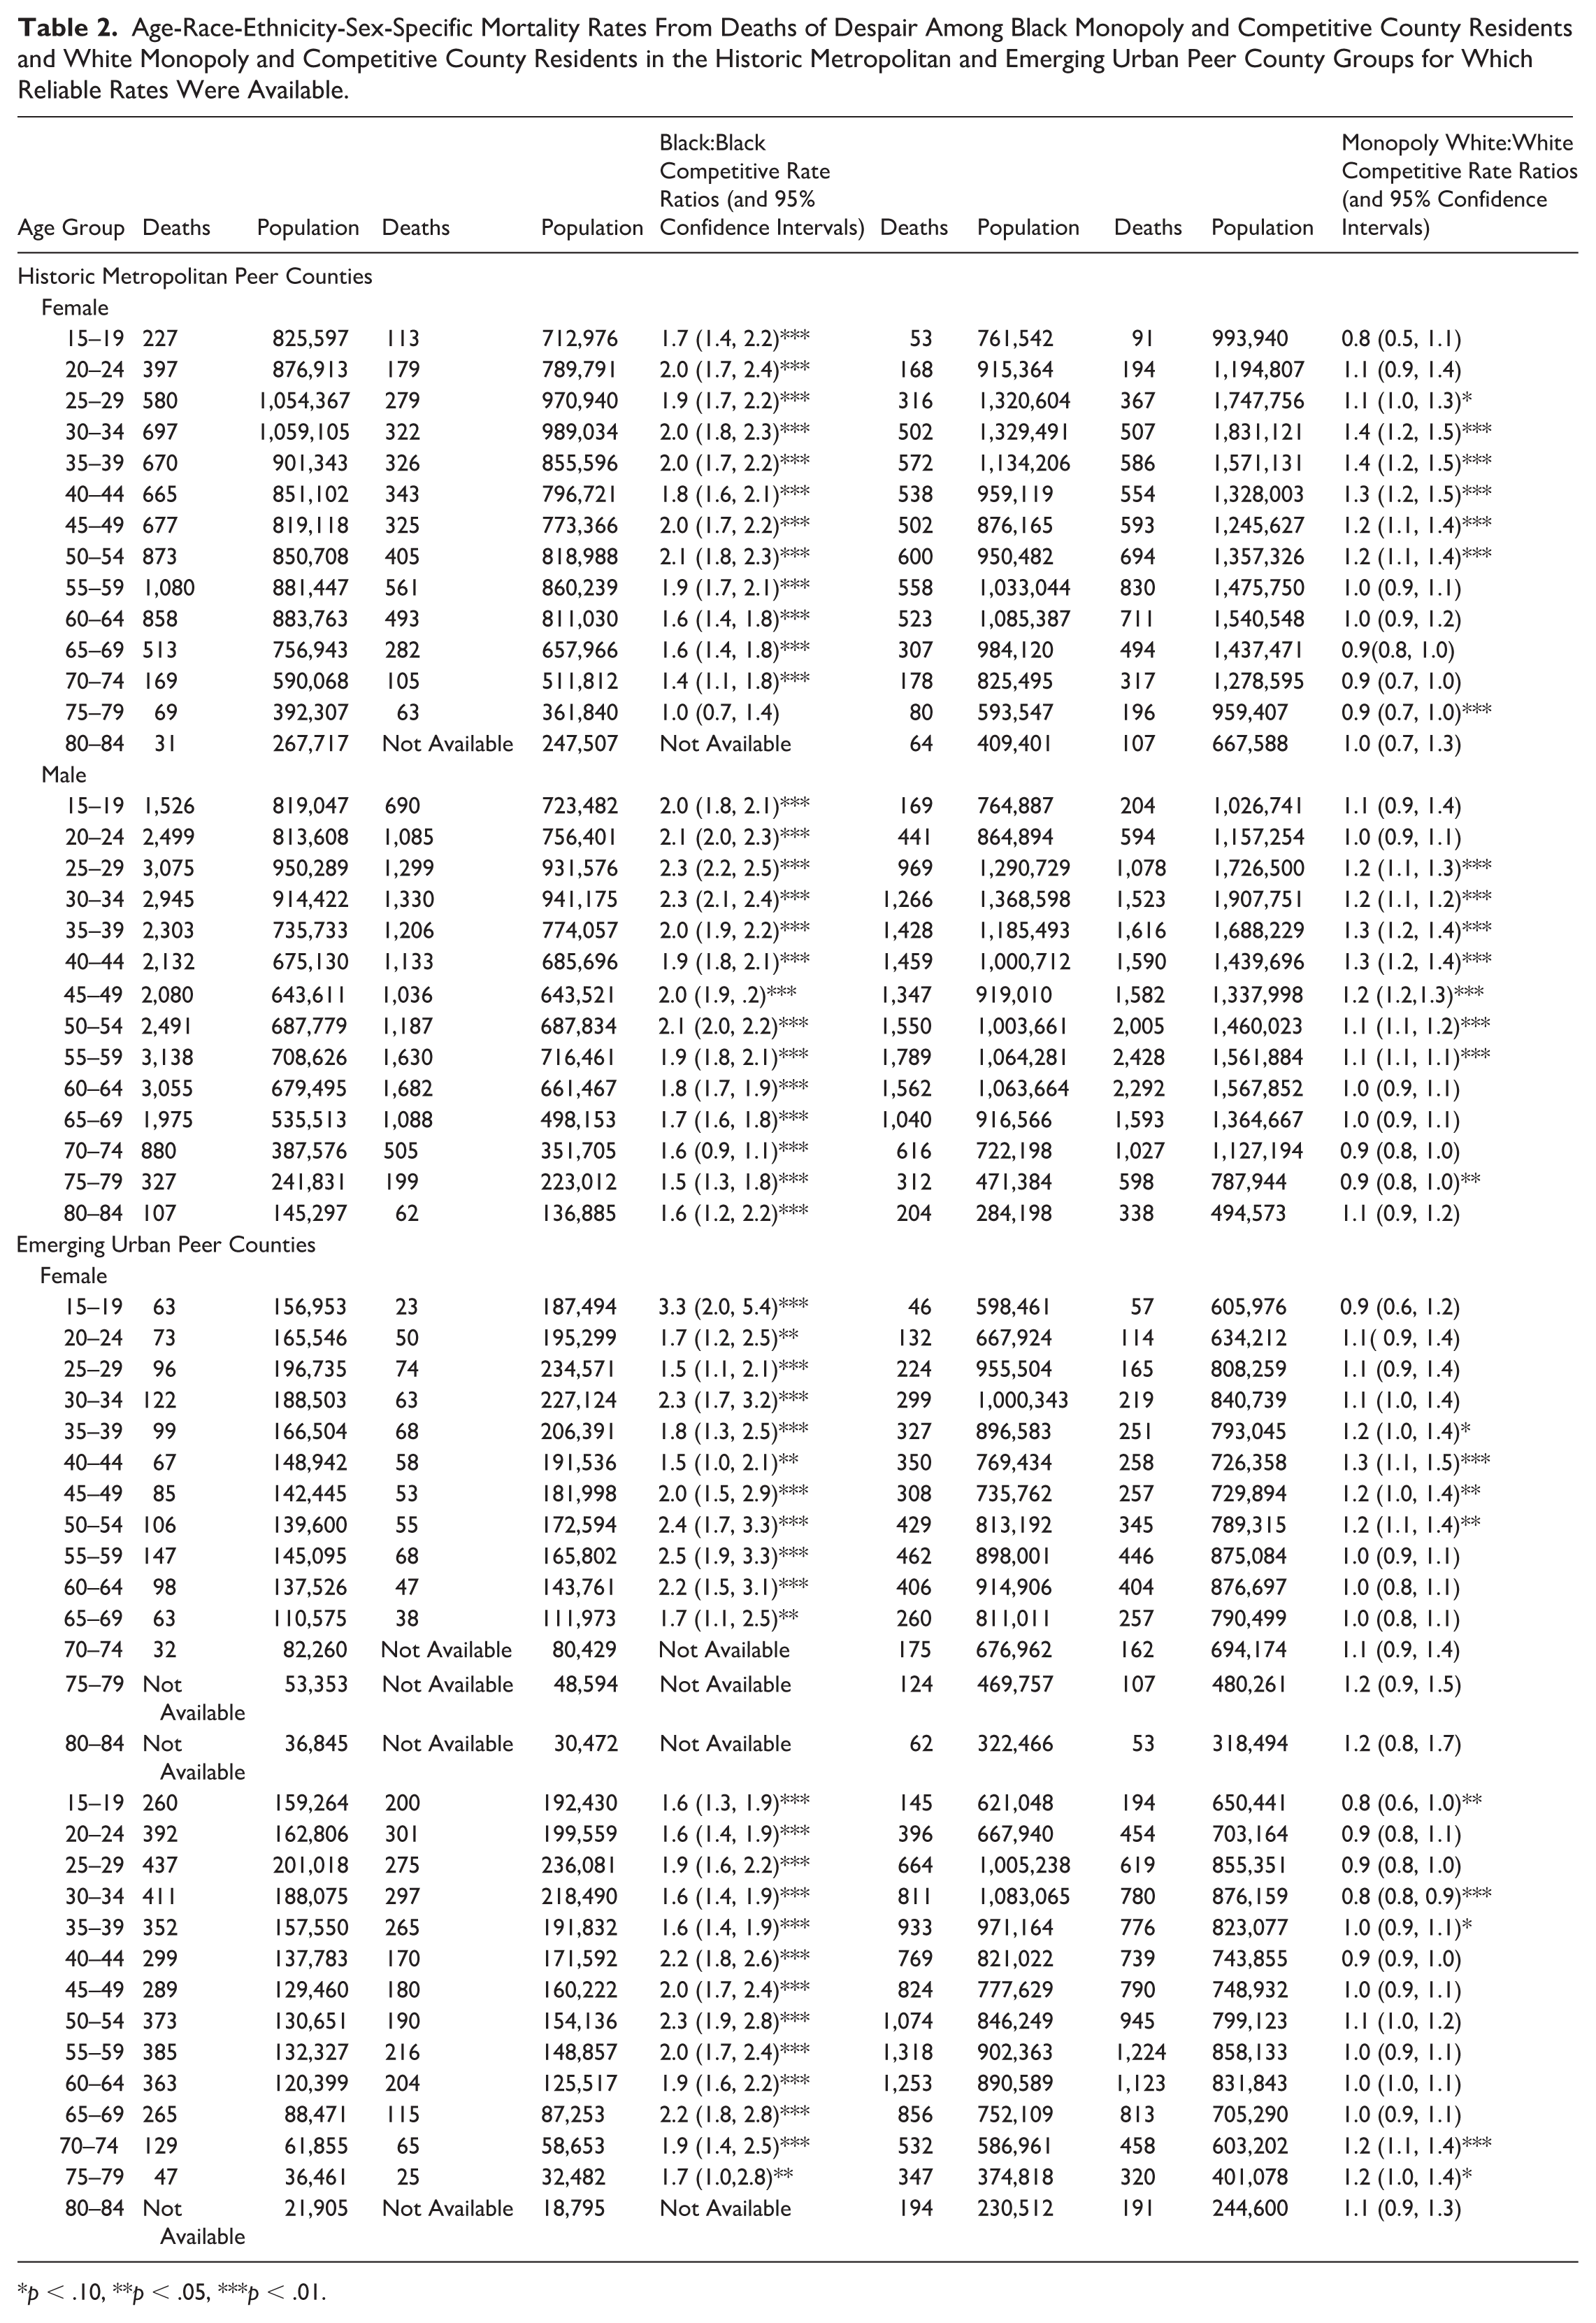
p < .10, **p < .05, ***p < .01.
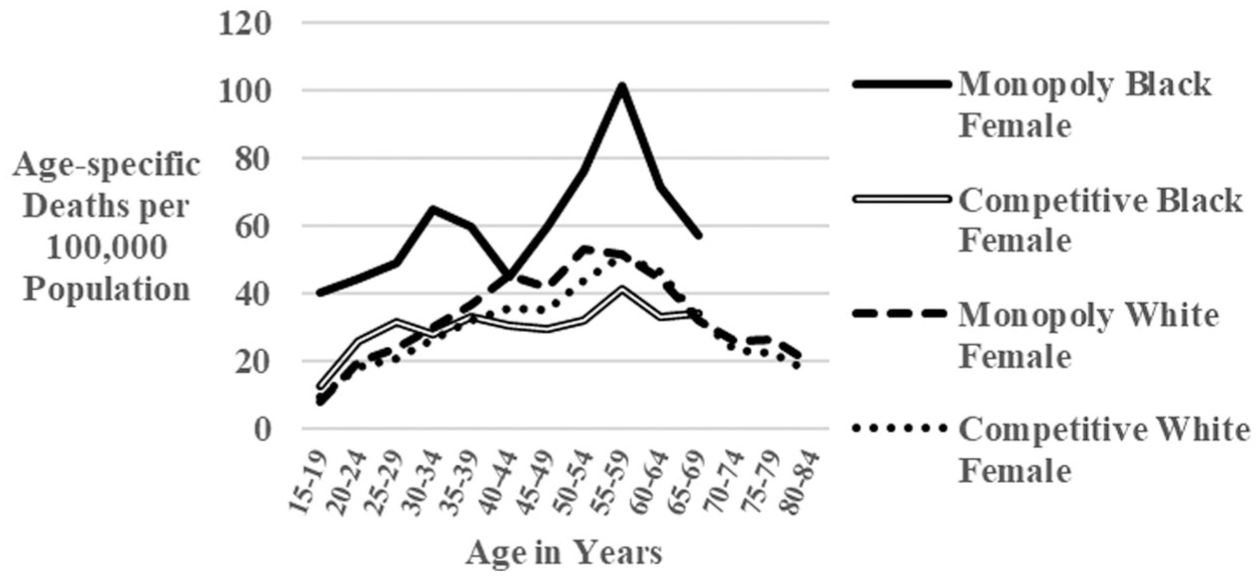
Figures 6 through 9 depict age-race-ethnicity-sex-specific mortality rates in monopoly and competitive counties from 2019 to 2023. Except for the oldest age groups and for Monopoly Black and Monopoly White females at ages 40 to 44 years, rates are highest among both female and male Black residents from ages 15 to 19 years forward, with rates for males exceeding those for females. Strikingly, however, rates for Black females residing in competitive Historic Metropolitan and Emerging Urban peer counties were similar to or lower than those at comparable ages for White females residing in Historic Metropolitan or Emerging Urban competitive counties.
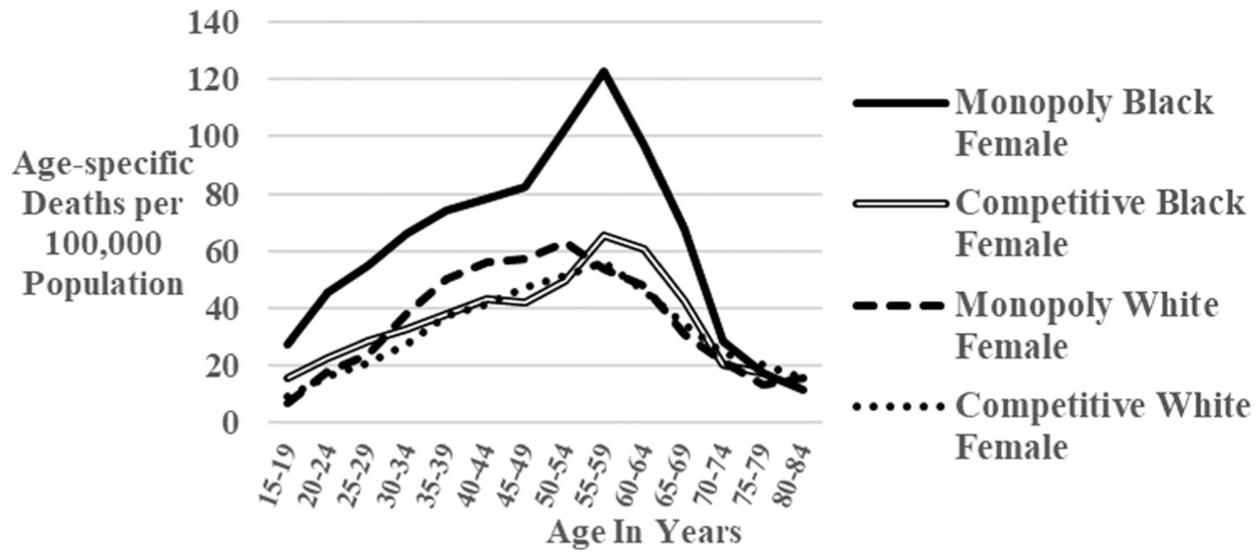
Deaths of despair among Black females and White females in monopoly and competitive historic metropolitan peer counties, 2019 to 2023.
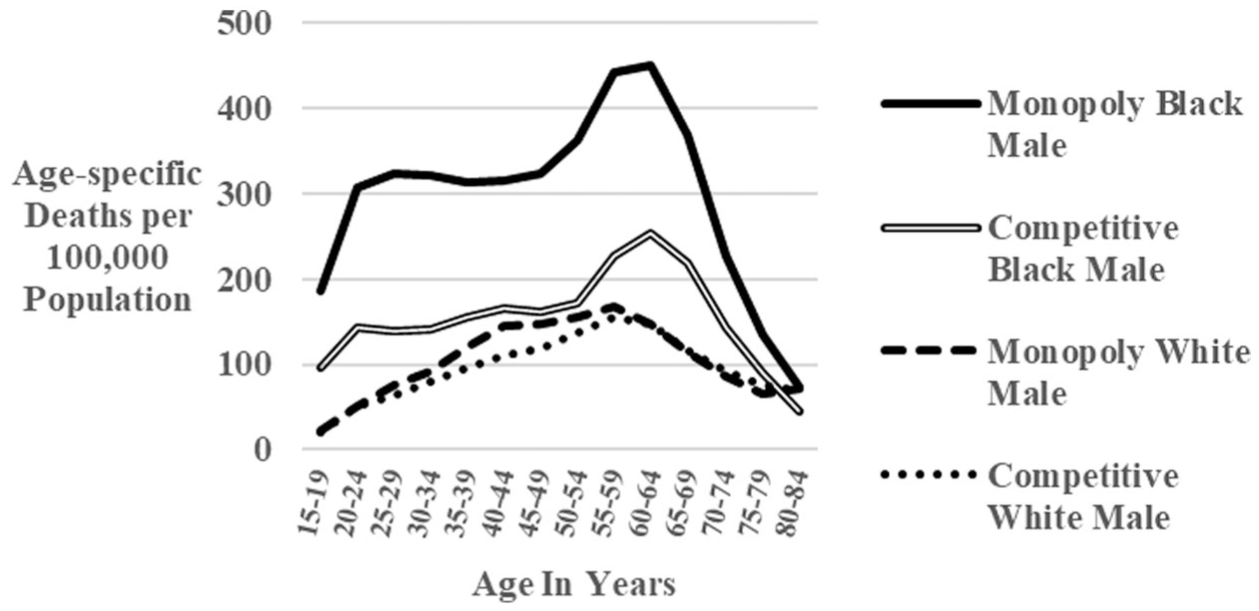
Deaths of despair among Black males and White males in monopoly and competitive historic metropolitan peer counties, 2019 to 2023.
Deaths of despair among Black females and White females in monopoly and competitive emerging urban peer counties, 2019 to 2023.
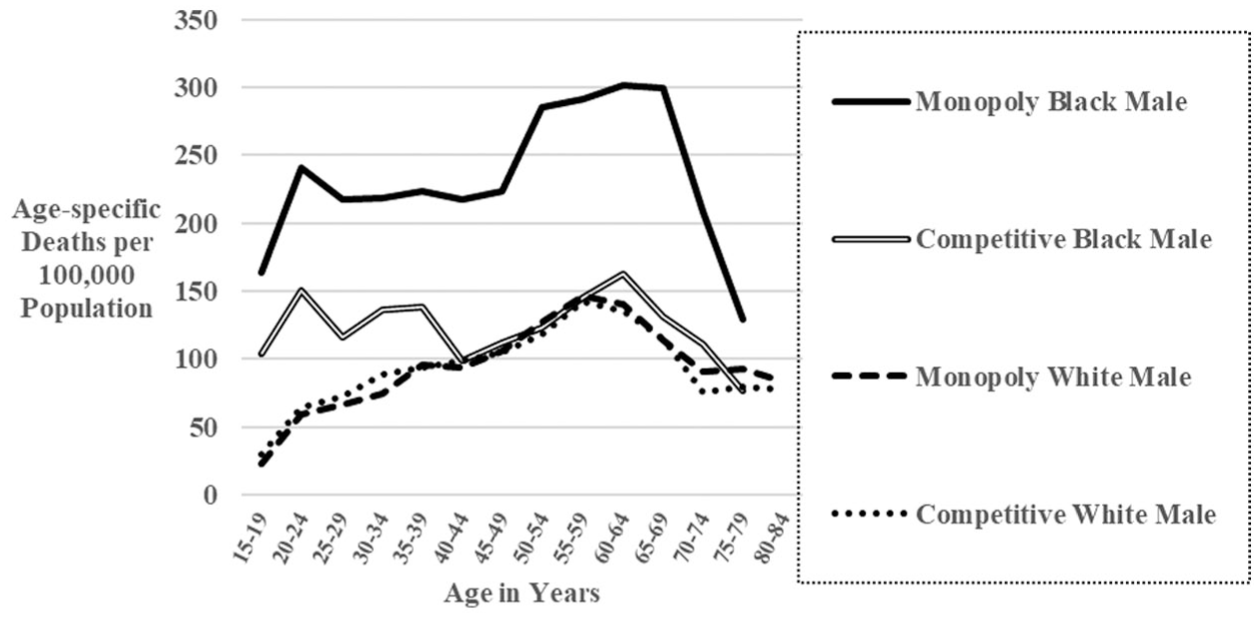
Deaths of despair among Black males and White males in monopoly and competitive emerging urban peer counties, 2019 to 2023.
Tables 3 and 4 show county values for age-adjusted (15 to 85+ years) rates of harm to self or others among Black residents and Black: White residents’ mortality rate ratios for 2016–2020, the most recent years for which county-specific WONDER data are available. Rates varied widely, with the highest county rate among Historic Metropolitan Peer Counties (St. Louis City, MO = 290.2 per 100,000 population) being 7.0 times that of the lowest in peer group one (Queens County, NY = 41.4), and with the highest value among the Emerging Urban Peer Counties (Jackson County, MO = 150.5) being 4.6 times that of the lowest in that group (Orange County, CA = 32.5). Greatest inequities were found in Washington, DC, among Historic Metropolitan Peer Counties (Black:White Mortality Rate Ratio = 5.6) and San Francisco, CA = 3.2 among the Emerging Urban Peer Counties. Eight Historic Metropolitan Peer Counties (seven competitive (Miami-Dade, Providence, Riverside, Queens, Orange (FL), Bronx, and Duval) and one transitional (Hillsboro) and eight Emerging Urban Peer counties (four transitional (Clark, Travis, Orange (CA), and Pinellas), three competitive (Wake, Tarrant, and Virginia Beach), and one monopoly (Hartford) had ratios of 1.0 or less. Of these sixteen, nine were in the South U.S. Census Region, four in the East, and three in the West, leaving the Midwest unrepresented (Centers for Disease Control and Prevention, National Center for Health Statistics, 2021).
Age-Adjusted (15 to 85+ Years) Mortality per 100,000 Population From Deaths of Despair Among Black Residents and Black:Non-Hispanic White Resident Mortality Rate Ratios. Historic Metropolitan Peer Counties, 2016 to 2020.
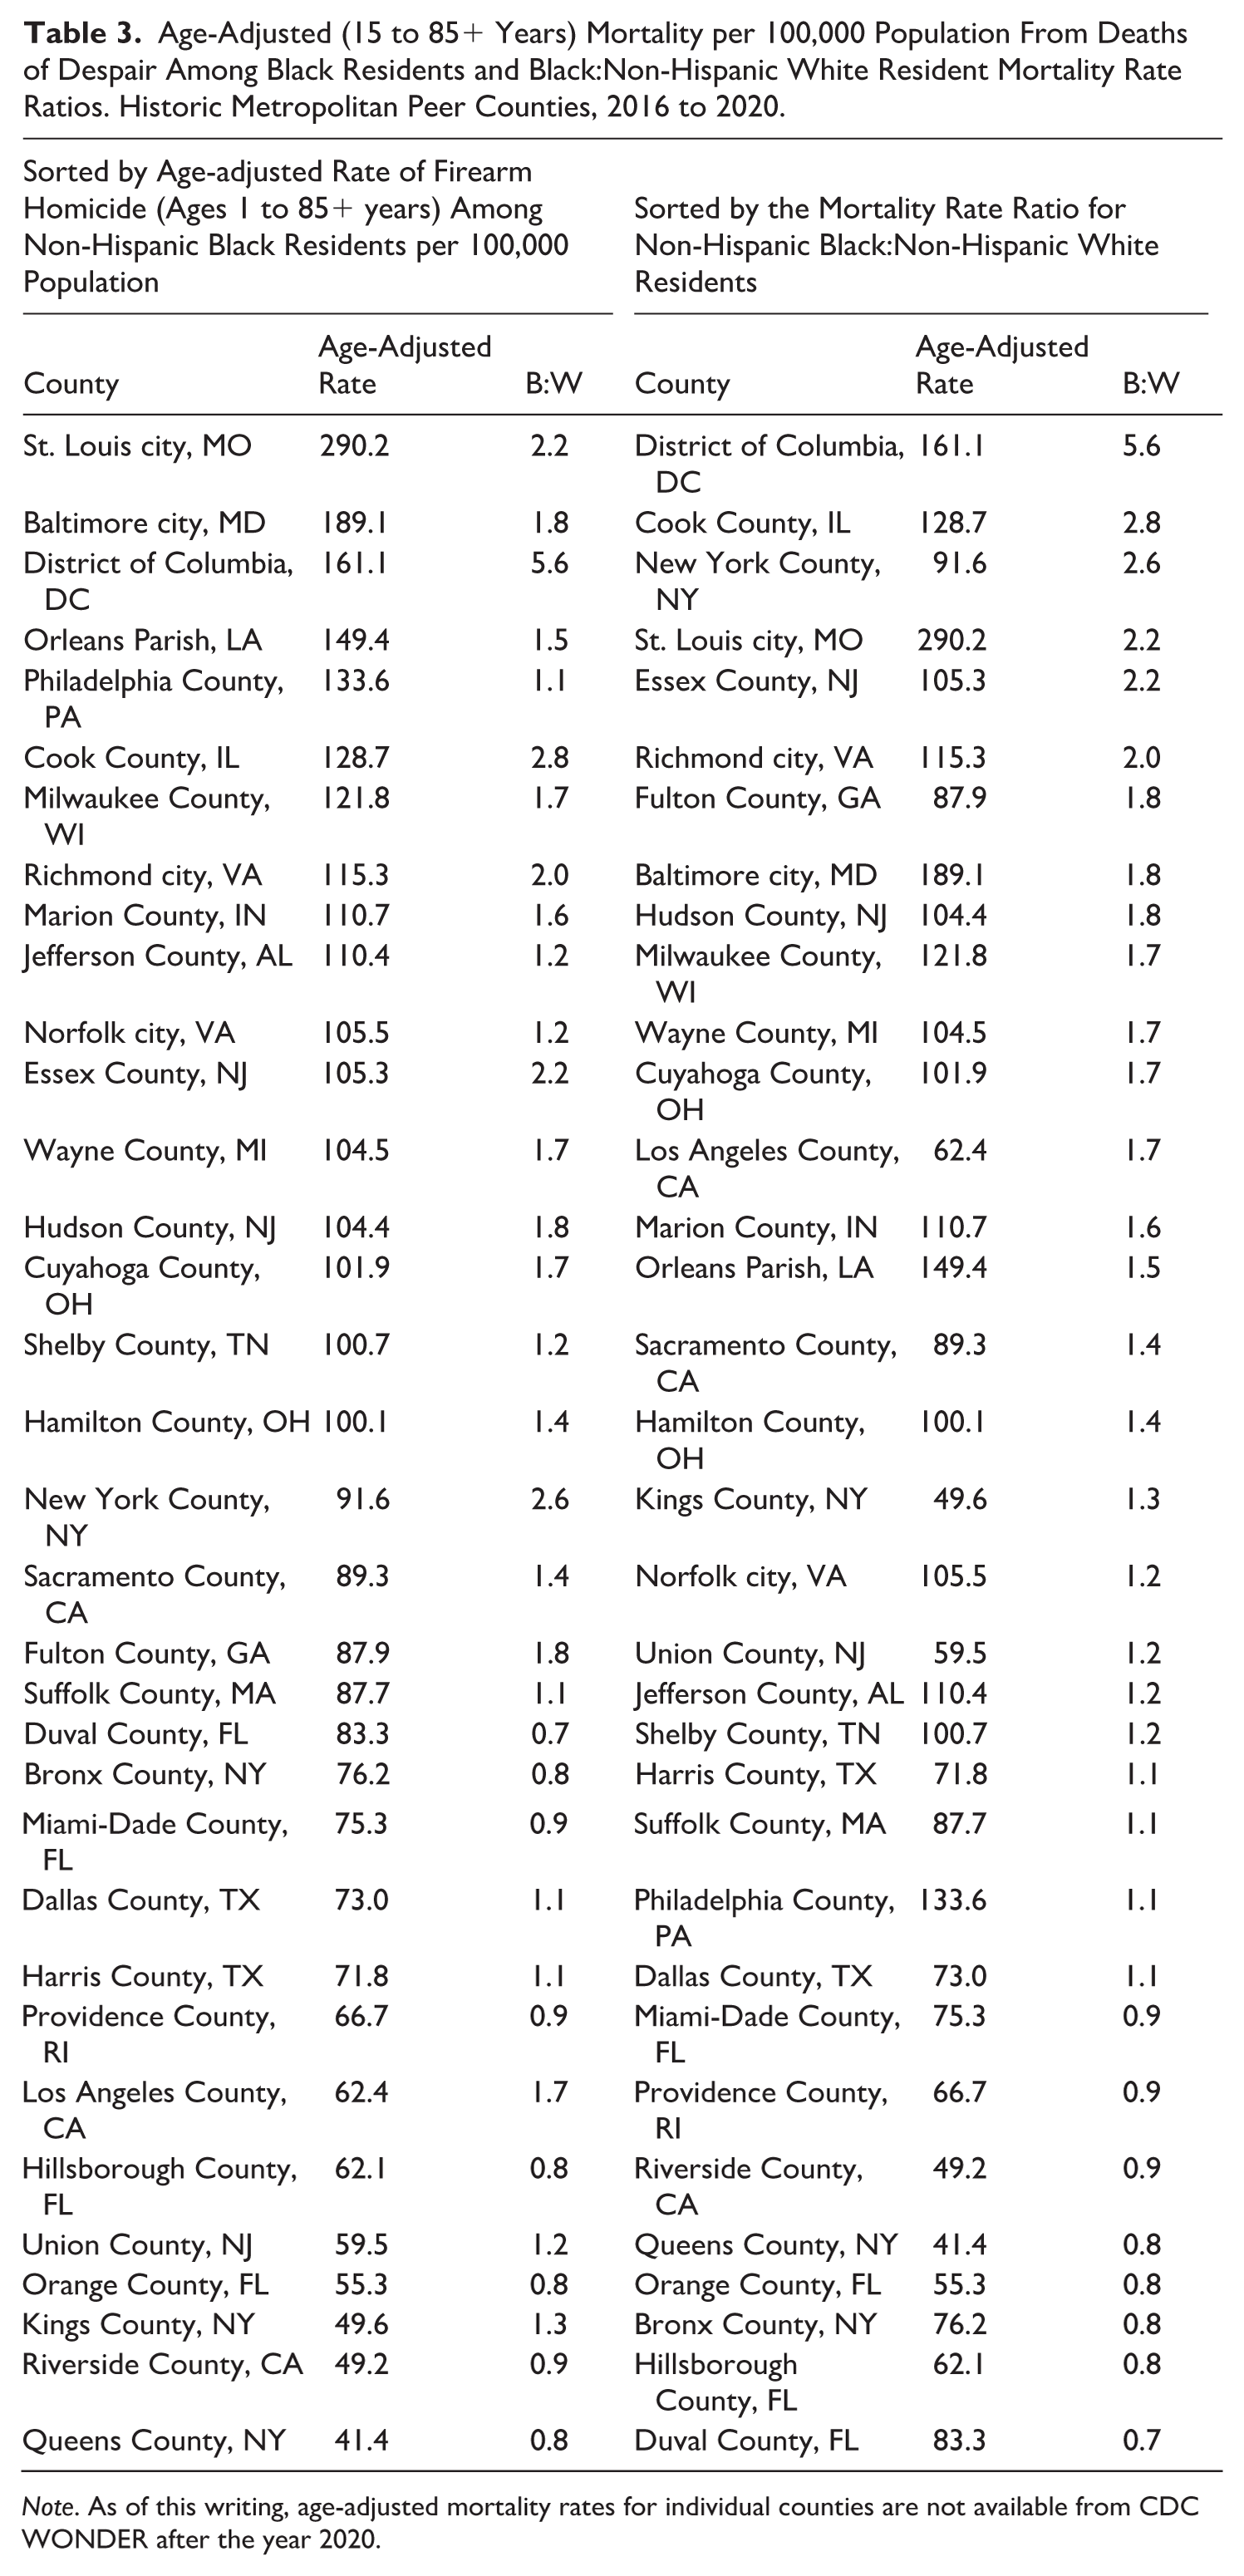
Note. As of this writing, age-adjusted mortality rates for individual counties are not available from CDC WONDER after the year 2020.
Age-Adjusted (15 to 85+ Years) Mortality per 100,000 Population From Deaths of Despair Among Non-Hispanic Black Residents and Non-Hispanic Black:Non-Hispanic White Resident Mortality Rate Ratios. Emerging Urban Peer Counties, 2016–2020.
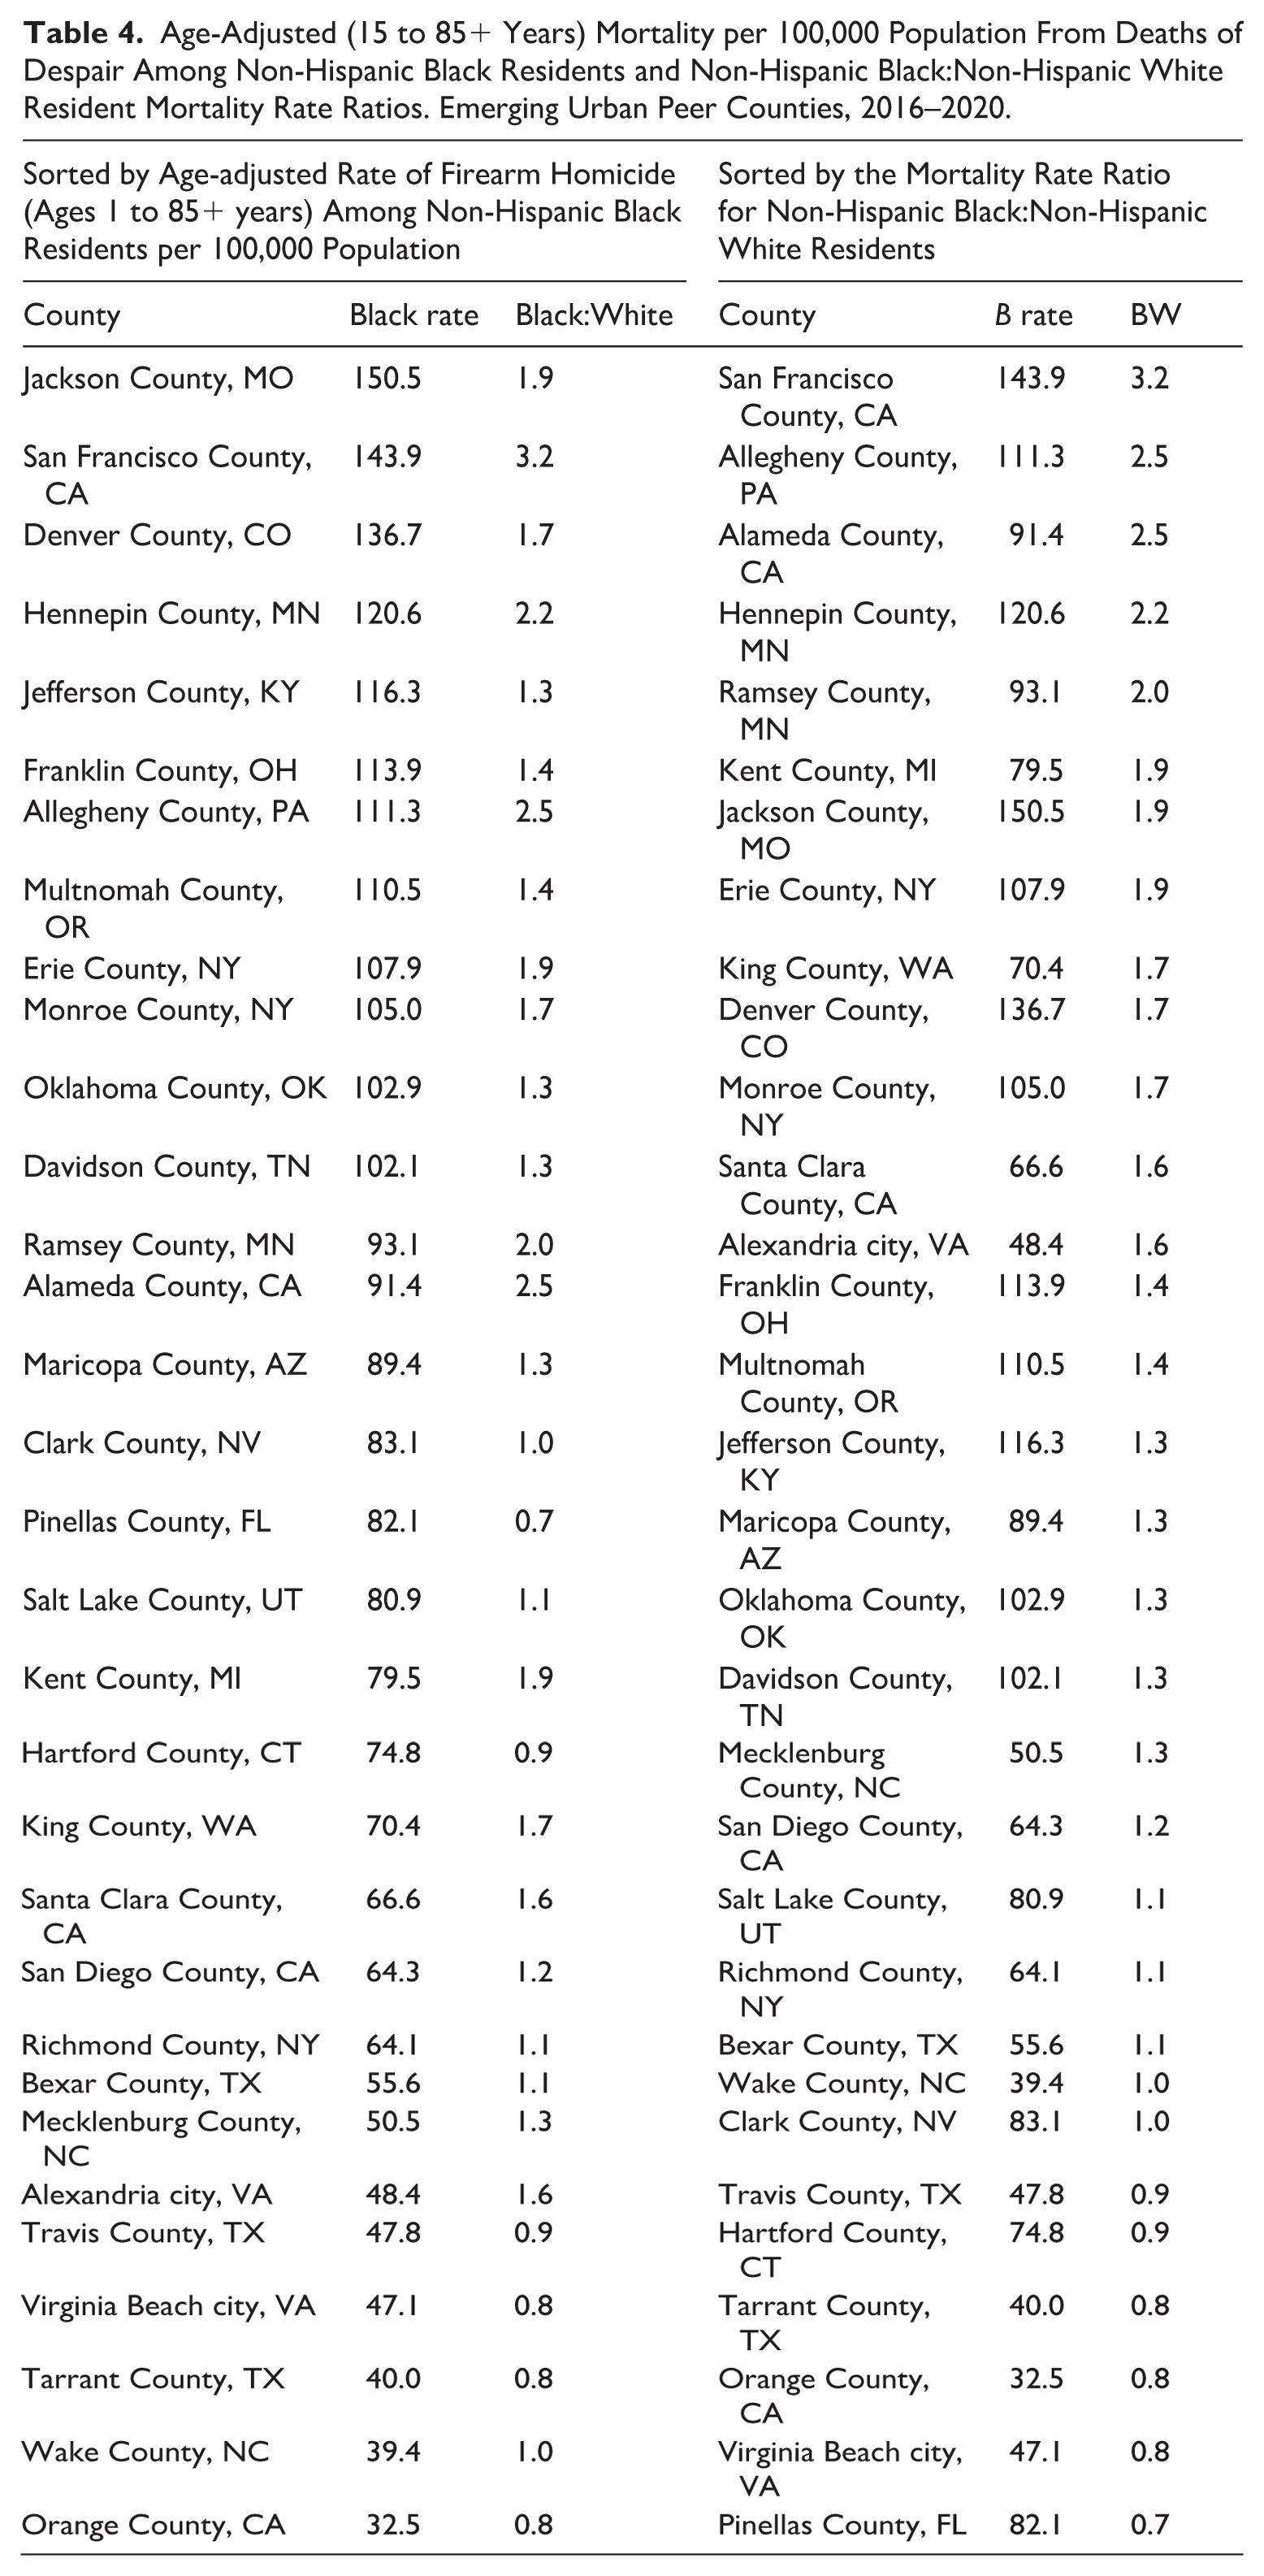
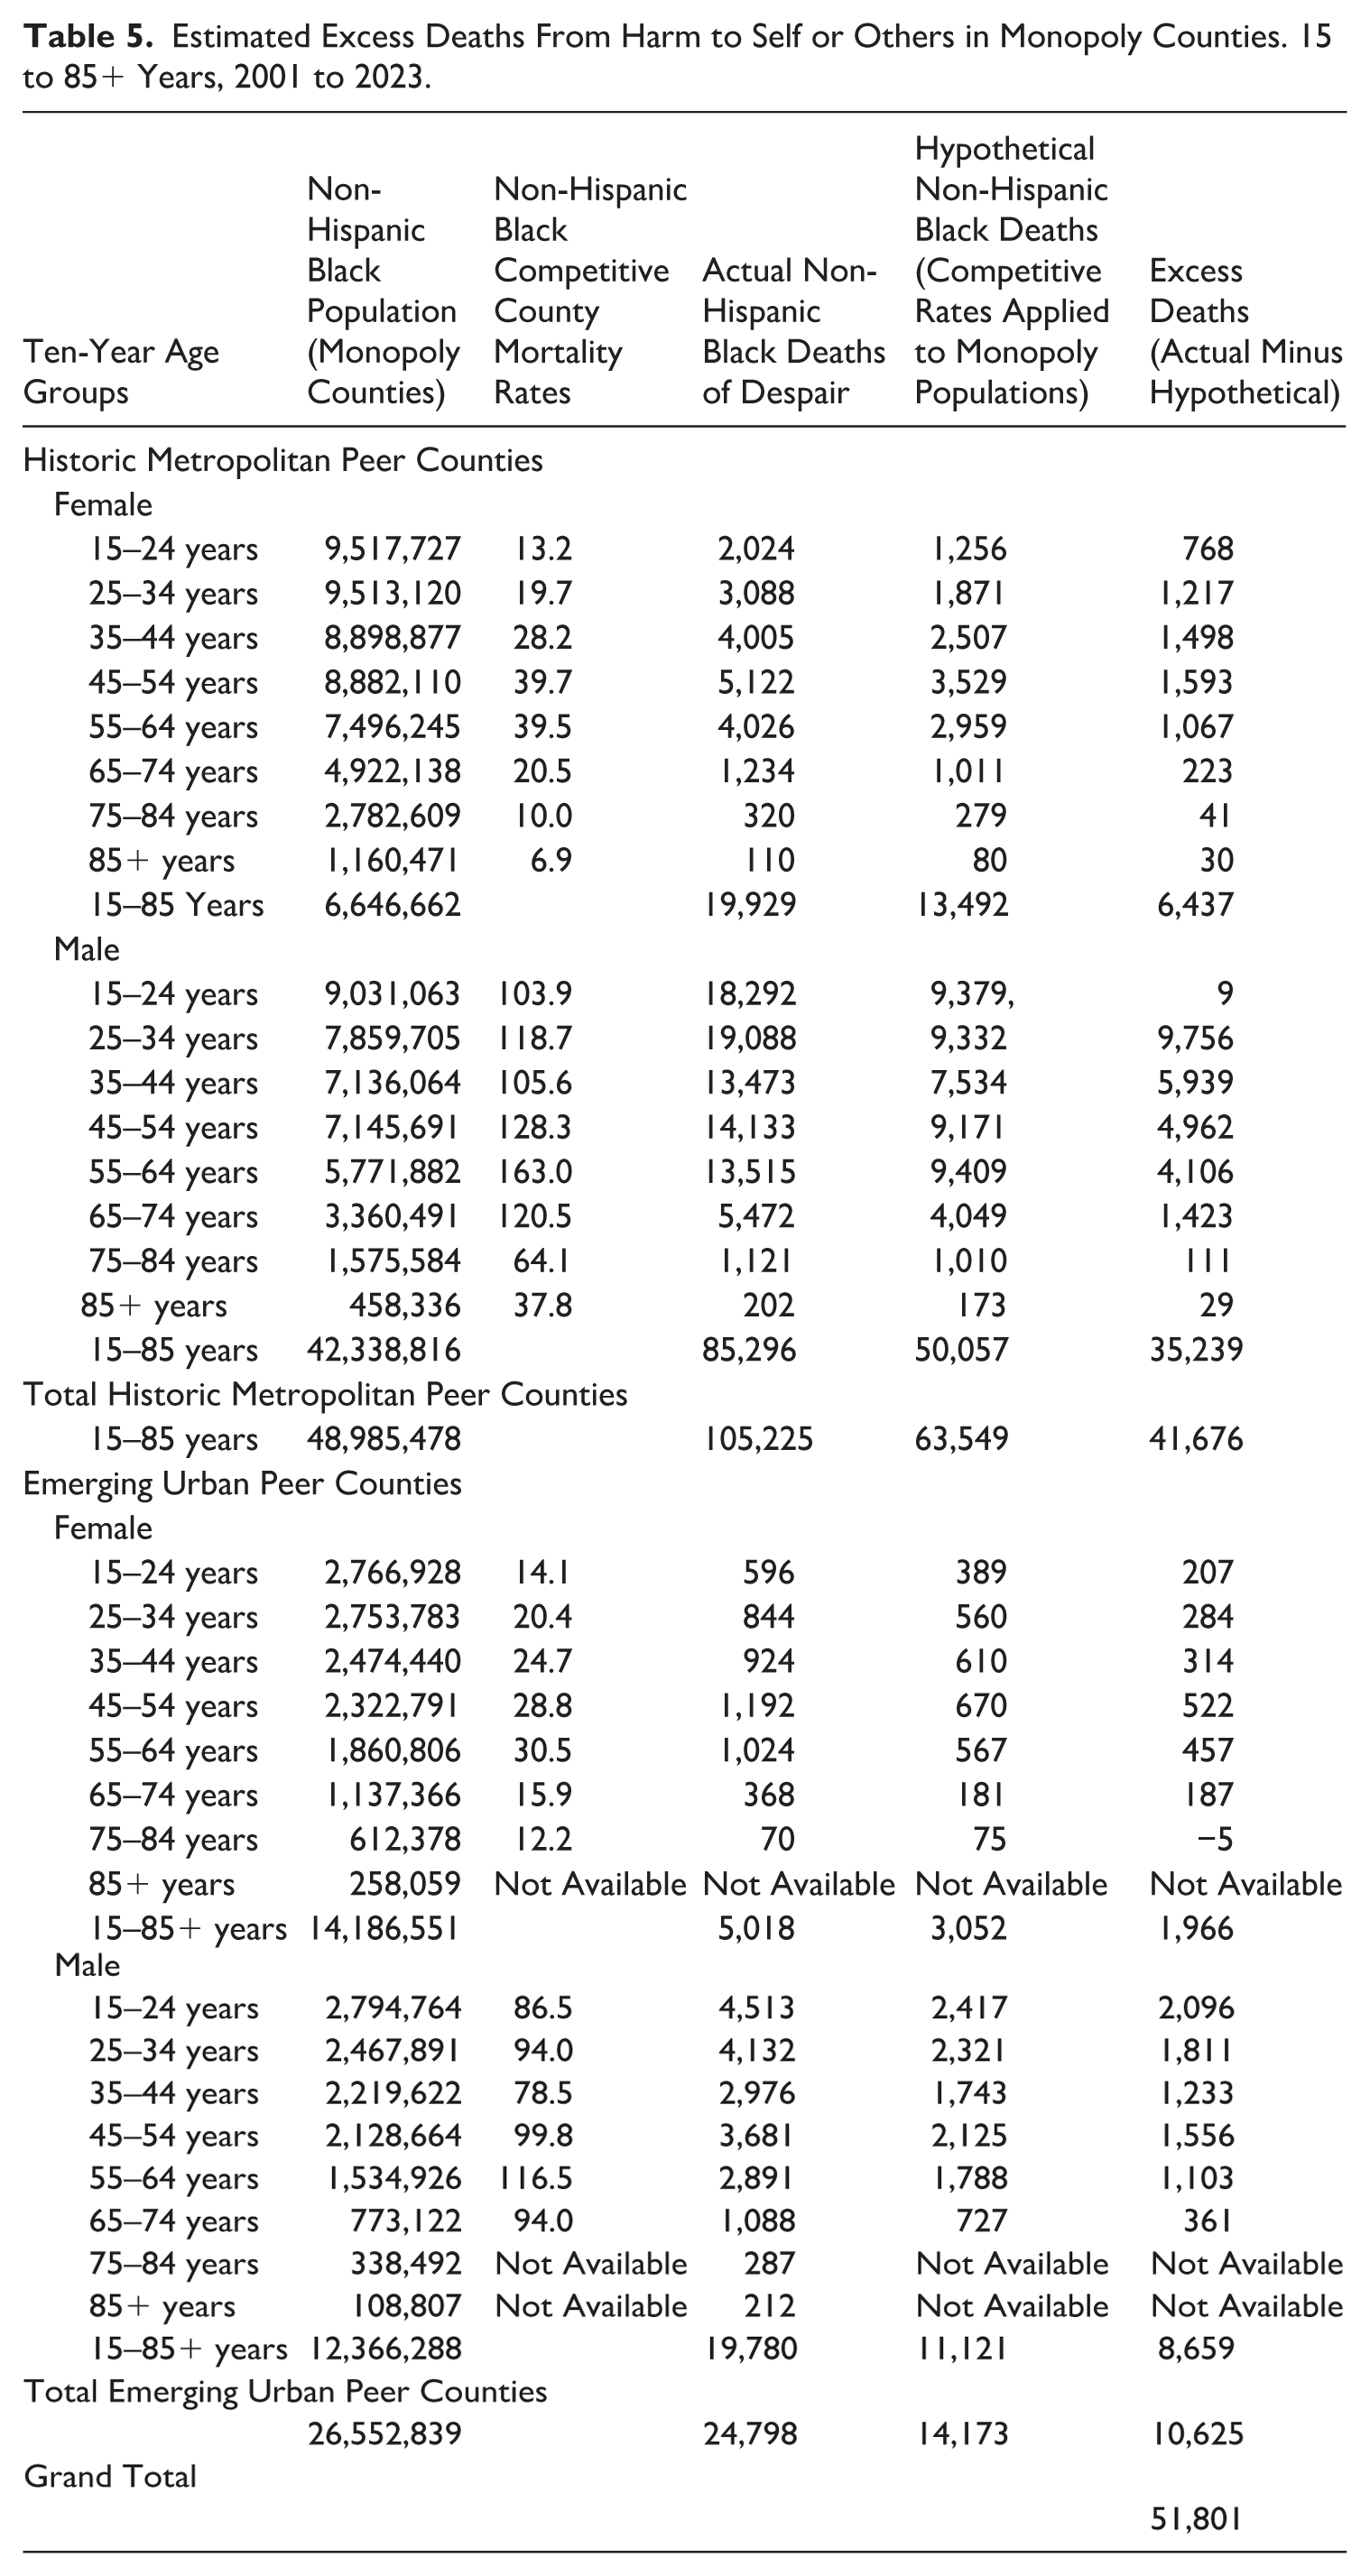
Table 5 presents the estimated number of excess deaths in monopoly counties based on reductions that would have occurred had age-race-sex-specific mortality rates from competitive counties been applied to monopoly counties. Overall, there were 51,801 excess deaths from 2001 to 2023. In Historic Metropolitan peer counties, 84.6% of the excess (35,239/41,676) occurred in males, while the corresponding figure in Emerging Urban peer counties was 81.5% (8,659/106.25).
Estimated Excess Deaths From Harm to Self or Others in Monopoly Counties. 15 to 85+ Years, 2001 to 2023.
Multiple regression analysis with county age-adjusted (15+ years) mortality from deaths from harm to self or others (2001–2020) as the dependent variable and years of single political party governance as of 2020 and mean state gun law index (2001–2018) as independent variables in Historic Metropolitan Peer Counties showed b = 71.73, t = 8.31, and p <.001 for the intercept; b = .32, r = .47, t = 2.90 and p = .01 for duration of one-party governance; and b = −29.90, r = −0.28, t = 1.58, and p = .12 for mean state gun law index. The mean variance inflation factor was 1.02, and the Durbin–Watson test statistic was 1.83. For Emerging Urban Peer Counties, b = 48.88, t = 5.11, and p ≤.001 for the intercept; b = .43, r = 0.40, t = 2.34, and p = .03 for duration of one-party governance; and b = 12.54, r = .10, t = .51, and p = .61 for mean state gun law index. The mean variance inflation factor was 1.01, and the Durbin–Watson test statistic was 2.17.
Discussion
The study generates the hypothesis that political monopolies are associated with high mortality from deaths of despair in these counties (Figures 1 and 2). An additional hypothesis generated is that differences in mortality and racial inequity from deaths of despair may be specific to levels of political competition rather than party affiliation. Among these urban counties, the Democratic party was dominant among all Monopoly counties, and all counties transitioning from Competitive to Monopoly status in peer group 1, Historic Metropolitan Peer Counties (Table 1). In peer group 2, Emerging Urban Peer Counties, however, transitions occurred to both Republican and Democratic Monopoly status (Table 2). Figures 3 and 4 show that the transition from Competitive to Democratic or Republican Monopoly status was similar. Moreover, Monopoly counties in both peer groups may be described as authoritarian (Magaloni & Kricheli, 2010). Mayoral elections are held, but they are token events whose outcome is rarely in doubt, even if the election is nominally non-partisan (Schaffner et al., 2001). Some evidence suggests that increases in markers of despair contribute to decreased voter turnout (Franko & Pacheco, 2025). In particular, the observed transition in these data from Competitive to Monopoly status in both peer groups generates the hypothesis that as monopolies arose in these counties, Black people died at increasing rates from deaths of despair, regardless of whether the Democratic or Republican party was gaining control.
While political monopolies appeared to be important in both peer groups, multiple regression analyses generated the hypothesis that political forces operated differently in each peer group. In peer group two, the duration of one-party governance as of 2020 was key. We hypothesize that just as state political monopolies tend to reduce investment in human capital, particularly as it affects education, transportation, and health (Das et al., 2022), so too may county-level political monopolies. Ecosocial theory (Krieger, 2012) postulates that the poor and underserved are likely to experience the greatest adverse effects.
In contrast, the percent nH Black population was important in peer group one. Nonetheless, while the percentage of nH Black residents stayed the same or declined in Monopoly, Transitional, and Competitive counties, mortality from Deaths of Despair increased (p < .001 in all three groups). As shown by the stability of percent nH Black population over time in the study, however, the observed increases in mortality from Deaths of Despair were not driven by increases in the percentage of nH Black residents. An alternative explanation derives from evidence of intense social pressure to vote for the Democratic Party within the Black community (White & Laird, 2020). Moreover, Black people whose friendship networks are mostly made up of other Blacks are significantly more likely to identify as Democrats (White & Laird, 2020). The latter observation is corroborated in the study results by the significantly higher exposure indices in Monopoly than in Competitive historic metropolitan areas in peer group one. Collectively, the present data generate the hypothesis that a high percent nH Black population may equate with high mortality from deaths of despair, at least in part, because political boundary setting within the Black community results in support for Democratic Party governance.
Political scientists have previously disagreed about the effects of one-party support. White and Laird (2020) argue that the ability of the Black community to define its political boundaries in support of one political party is, “Essential to its existence and its ability to mobilize . . . [and] effectively make demands on government” (p. 173). Cohen (1999), in contrast, points to deep fractures within the Black community and proposes that boundary setting by Black leaders may have paradoxical effects: . . .as indigenous institutions increasingly involve themselves in the political, social and economic activities of dominant groups, the goal of maintaining and expanding integration into dominant society often becomes the primary concern of such institutions. This may come at the expense of more radical transformation and redistribution of dominant institutional resources. (p. 64)
Future research should explore this issue within the context of differential access to safety resources in the face of an increasingly toxic illicit drug supply, worsening economic worries, increased allostatic load, and poorer access/utilization of mental health and substance abuse programs (Brown et al., 2016; Friedman & Hansen, 2024).
Limitations of the present data include its descriptive nature, which makes the information suitable for generating but not testing hypotheses. Moreover, the data are ecological. It is therefore possible that observed results reflect differences in the characteristics of people residing in counties with different levels of local political monopoly rather than political monopoly alone. The usual limits of death certificate data, including the exclusion of persons who are not legal residents of the United States, also apply (Hennekens & Buring, 1987), as does the inability to address potential confounding by matching variables. The most important limitation, however, may be the slender capacity of widely used epidemiological and biostatistical analyses to account for the vast array of potential confounders, which might be affecting the observed outcomes (Langston et al., 2014). Such confounders range from the multitude of forces shaping governmental structures to the thousands of other social, demographic, and environmental factors which have been identified as part of the public health exposome (Juarez et al., 2014). Shifts in state-level policies have been associated with changes in life expectancy by state (Montez et al., 2020), and therefore, the complex interplay between state and local policies on population health might be aided by exposome analyses – pioneered by geographers and community scientists – which make it possible to simultaneously assess those thousands of factors in scientifically rigorous ways (Juarez et al., 2014; Monnat & Brown, 2017).
Deaths of despair are often discussed as a social problem among rural, non-Hispanic Whites in areas that have experienced substantial economic decline (Lee et al., 2023; Stein et al., 2017). In these areas of declining industry, non-Hispanic Whites with lower education and poor access to resources have been identified as particularly vulnerable to this phenomenon (Lee et al., 2023), although additional analysis suggests that drug overdose is also a disproportionate driver of mortality increases (Masters et al., 2018). In the 1990s and 2000s, this theme was demonstrated as drug-related mortality increased substantially among non-Hispanic Whites (Tilstra et al., 2021). However, post-2010, non-Hispanic Black men and women have exhibited substantial increases in drug-related mortality as the opioid crisis has shifted to heroin and synthetic opioids such as fentanyl (Friedman & Hansen, 2024; Tilstra et al., 2021).
In summary, these results generate the hypothesis that political monopolies in these urban peer counties are associated with increased mortality from deaths of despair among their urban, non-Hispanic Black residents. As with this and all other hypotheses generated by these data, testing by analytic epidemiologic research is required to confirm or deny.
Supplemental Material
sj-docx-1-ccj-10.1177_10439862261448586 – Supplemental material for Political Determinants of Health: Mayoral Governance and Deaths of Despair in Urban American Peer Counties
Supplemental material, sj-docx-1-ccj-10.1177_10439862261448586 for Political Determinants of Health: Mayoral Governance and Deaths of Despair in Urban American Peer Counties by Robert S. Levine, Lisaann S. Gittner, Jeff A. Dennis, Jerry M. Stott, Jaden M. Harris, Frederick Ernst and Dennis Patterson in Journal of Contemporary Criminal Justice
Footnotes
Ethical Considerations
This study received ethical approval from the Baylor College of Medicine IRB (approval for protocol # H-57501) on June 05, 2025. This is an IRB-approved retrospective study. All patient information was de-identified, and patient consent was not required. Participant data will not be shared with third parties. Baylor College of Medicine Institutional Review Board Statement of June 5, 2025: “The information included in the proposed activity will not consist of identifiable information, so no authorization or waiver of authorization by patients for the release of individually identifiable protected health information will be required. This activity does not fall under the regulations for IRB review of human subjects research found at 45 CFR 46.102(e)(5) and 45 CFR 46.102(e)(6) as the information is not considered identifiable information.”
Funding
The authors disclosed receipt of the following financial support for the research, authorship, and/or publication of this article: The authors received no external financial support for the research, authorship, and/or publication of this article. Access to email services was provided by the Baylor College of Medicine and Texas Tech University; access to the Texas Medical Center Library was provided by the Baylor College of Medicine; Texas Tech University provided access to the University Libraries.
Declaration of Conflicting Interests
The authors declared no potential conflicts of interest with respect to the research, authorship, and/or publication of this article.
Data Availability Statement
Data are available for sharing.
Supplemental Material
Supplemental material for this article is available online.
Author Biographies
References
Supplementary Material
Please find the following supplemental material available below.
For Open Access articles published under a Creative Commons License, all supplemental material carries the same license as the article it is associated with.
For non-Open Access articles published, all supplemental material carries a non-exclusive license, and permission requests for re-use of supplemental material or any part of supplemental material shall be sent directly to the copyright owner as specified in the copyright notice associated with the article.