
Abstract
In this article, we examine the relationship between self-reported opioid use and employment outcomes among Social Security Disability Insurance (SSDI) applicants who applied to SSDI in 2009. We use a machine learning method to identify opioids recorded in text fields on SSDI applications. Studying outcomes for 4 years after the U.S. Social Security Administration (SSA) determined the application outcome, we find a negative and statistically significant association between self-reported opioid use at application and post-determination employment-related outcomes. Notably, opioid use at the time of application was associated with a 3% point decline in the likelihood of employment in the first 4 years after determination and represents a 7.5% decline relative to the mean employment rate for the period. Results from a reduced-form model estimating the relationship between local opioid prescribing patterns and employment outcomes suggest that a 10% increase in the local opioid prescribing rate is associated with employment that is, at most, 0.3% points lower, which is similar to the documented association among the broader U.S. population. However, the potential implications for SSDI applicants are particularly notable because opioid use is about 50% higher among SSDI applicants.
Opioids permeated the U.S. medical system in the late 1990s and continue to be pervasive more than 20 years later (U.S. Department of Health and Human Services, 2019). Opioids gained prevalence in part through promotion by the pharmaceutical industry as a safe and effective solution for chronic pain. Opioid prescription rates peaked in 2010–2012, with 81 prescriptions written for every 100 Americans (Centers for Disease Control and Prevention [CDC], 2018). As the prevalence of opioids increased, so did the evidence of their potential harmful effects, such as addiction, misuse, and overdose. Opioids were responsible for more than 700,000 overdose deaths from 1999 to 2017 (CDC, 2019). In 2017, the U.S. Department of Health and Human Services declared a public health emergency to address the so-called opioid epidemic.
The opioid epidemic is particularly notable for people with disabilities, who use opioids at a higher rate than the general population. This is likely because of the relatively high prevalence of health conditions associated with opioid use—such as musculoskeletal conditions. Between one quarter and one third of applicants to Social Security Disability Insurance (SSDI)—the nation’s largest safety net program for workers with disabilities—reported using opioids at the time of application in the period from 2007 to 2017 (Wu et al., 2020). An even higher proportion of SSDI beneficiaries, 44%, filled at least one opioid prescription in 2011 (Morden et al., 2014). Furthermore, opioid overdose deaths are disproportionately high among SSDI beneficiaries relative to the general population and Medicare recipients above age 65 years (Kuo et al., 2019).
If opioids deliver their intended therapeutic benefits, they could help facilitate work. There is evidence that non-opioid pain relievers increase labor force participation (Garthwaite, 2012).
However, there are also reasons to suspect that opioids could interfere with work. There is no evidence documenting the long-term effectiveness of opioids on pain and functioning (CDC, 2016), and studies show that opioids may worsen these outcomes (Frienden & Houry, 2016). Opioids may also exacerbate problems with cognition and executive function (Schiltenwolf et al., 2014) and are associated with an increased risk of depression (Scherrer et al., 2016). In addition, opioids are associated with a high risk of dependence and abuse. Up to 26% of primary care patients who receive opioids for chronic pain become dependent (CDC 2016), and 21%–29% of them misuse opioids (Vowles et al., 2015). Furthermore, Cutler et al. (2017) suggest that the wider availability of opioids is linked to increases in SSDI applications and awards.
Indeed, several studies document an association between opioids and a decline in employment-related outcomes. In the United States, Harris et al. (2019) and Aliprantis et al. (2019) document adverse effects on labor force participation, employment, and unemployment rates. Krueger (2017) hypothesizes that as much as 20% of the observed decline in the male labor force participation rate between 1999 and 2015 might be attributed to an increase in opioid prescriptions. There are, however, also some studies that show null or some beneficial effects of opioids. Currie et al. (2019) find causal evidence of a positive effect of prescription opioids on employment for women.
It is uncertain whether similar relationships hold among people with disabilities. Indeed, there are reasons to think that the relationship between opioids and employment might be different among those with disabilities than among people without disabilities. It is possible that opioids are overprescribed to the general population but appropriately prescribed to people with disabilities, who experience the potential benefits of opioids. However, if there is already a strained connection to work, it is also possible that opioids may have a notable harmful effect on employment outcomes among people with disabilities.
Overall, little is known about the relationship between opioids and employment outcomes among people with disabilities, and the existing literature yields somewhat conflicting results. Using state implementation of Prescription Drug Monitoring Programs as an instrument for individual opioid consumption, Kilby (2015) finds that a decrease in opioids is associated with increases in absenteeism among short-term disabled and injured workers. Savych et al. (2018) use local opioid prescribing patterns as an instrumental variable for opioid use and find no statistically significant effect of any opioid prescription within 2 years of injury on receipt of temporary disability; however, they find that longer-term opioid prescriptions triple the duration of temporary disability benefit receipt among workers with low back injuries. Harris et al. (2019) note that the relationship between opioid use, labor market outcomes, and disability is complicated, in part because it can be difficult to disentangle the causal relationship between opioids and disability. We add to the literature by exploring the relationship between prescription opioids and employment outcomes among SSDI applicants.
Background
In 2019, more than 2 million Americans applied for SSDI Disabled Worker benefits (Social Security Administration [SSA], 2020). To qualify, workers must have a sufficient work history in jobs covered by Social Security and must be younger than full retirement age. They must also have a physical or mental impairment—which has lasted or is expected to last for at least 12 months or result in death—that prevents substantial gainful activity (SGA). In 2021, SGA is defined as monthly work activity valued above US$1,310 for non-blind beneficiaries. If awarded, beneficiaries receive cash benefits averaging about US$1,100 per month and, after a 2-year waiting period, Medicare.
SSDI application processing may involve several steps and last for a prolonged period. SSA staff work with staff at the applicant’s state Disability Determination Services office to make an initial determination based on non-medical criteria and medical evidence. If the initial determination is a denial, an applicant may appeal up to four levels: (a) reconsideration by the state Disability Determination Services, (b) hearing by an administrative law judge, (c) Social Security Appeals Council review, and (d) federal court review. Historically, about 22% of applicants are awarded at initial determination, 11% are awarded after appeal, and 64% are denied (SSA, 2019).
SSDI beneficiaries qualify for the program based on a wide range of physical and mental conditions; however, drug addiction or alcoholism on its own cannot merit an SSDI award. Before 1996, drug addiction or alcoholism of a severity that prevented SGA could be the primary medical basis for an SSDI award. In 1996, Congress ended medical eligibility for beneficiaries for whom drug addiction or alcoholism was a contributing factor material to the finding of disability.
Although neither substance abuse nor substance use is the qualifying condition for SSDI, we might expect that a notable portion of SSDI applicants and beneficiaries use prescription medications (such as opioids) because this population is likely to have conditions that are associated with opioid use. For example, 30% of SSDI beneficiaries have musculoskeletal conditions (SSA, 2019), which are associated with opioid use (Mathieson et al., 2020). Opioids may be prescribed for many other conditions, including cancer (2.8% of beneficiaries) and injury (3.5% of beneficiaries). Indeed, in 2011, 32% of SSDI applicants and 44% of SSDI beneficiaries reported opioid use (Morden et al., 2014; Wu et al., 2020).
It is well documented that the employment outcomes of SSDI applicants differ based on whether they are awarded or denied benefits. This association was first established when Bound (1989) reported that, in the 1970s, between 40% and 45% of rejected male applicants above age 45 years worked at some point in the previous year, compared with 5.5%–7.5% of beneficiaries. The same paper documented that employed rejected applicants had annual earnings more than five times larger than that of employed beneficiaries. Von Wachter et al. (2011) update Bound’s work and find that these differences persisted in the 1980s and 1990s and also among males ages 30–44 years. Chen and van der Klaauw (2008) include applicants of both genders and find that, in the 1990s, 21% of rejected applicants were employed, compared with 7% of beneficiaries. Several other studies produced similar evidence (French & Song, 2014; Maestas et al., 2013).
The difference in employment outcomes by award decision could occur because those who are awarded benefits meet the strict SSDI eligibility criteria, including the inability to engage in SGA, while those who are denied benefits do not. In addition, it is possible that awarded beneficiaries could restrict employment to receive SSDI benefits (Schimmel et al., 2011). In our analysis estimating the relationship between opioid use and employment outcomes among SSDI applicants, we stratify results by application outcome.
Data and Study Sample
Data
Our analysis is based on four SSA administrative data sources. We obtained data on applications that met the technical eligibility criteria (related to non-medical factors) from the Structured Data Repository (SDR). The Data Analysis Support Hub (DASH) provided data on final adjudication decisions and adjudication dates for most applications. Using data from a different time frame, we estimate that roughly 8% of records are excluded from DASH. Information on all employment-related outcomes comes from the Master Earnings File (MEF), which captures annual earnings (wages and self-employment income) reported to the Internal Revenue Service and subject to Social Security taxes. Finally, the Numerical Identification System (NUMIDENT) provides information on death.
We also included information on local opioid prescribing rates in analysis. First, we measured 2,009 annual county-level retail opioid prescriptions dispensed per 100 persons (CDC, 2020). These rates are available for most counties and this measure was available for 98.5% of our sample. Sample members residing in counties with missing data were excluded from analyses using these data. The available data show that prescribing rates for opioids varied widely across counties, ranging from 1 prescription per 100 persons in Chambers County, Texas, to 520 prescriptions per 100 persons in Martinsville, Virginia.
We also included a measure of local opioid prescribing based on the DEA’s Automated Reports and Consolidated Ordering System (ARCOS). Drug manufacturers and distributors are required to report sales of opioids through ARCOS in an effort to identify illegal activity and combat the opioid epidemic. ARCOS reports retail drug distribution at the three-digit zip code level and information is available for nearly all (99.9%) three-digit zip codes.
Study Sample
We derived a sample of individuals who applied to SSDI in 2009 from SSA’s SDR. We selected a 30% random sample of initial-level SSDI applications recorded in the SDR in 2009, based on their case establishment date. For those who submitted multiple applications in 2009, we selected the first application. Thus, there was one application per applicant in our sample. The sample included applicants ages 18–67 years at the time of application who applied for SSDI-disabled worker benefits, disabled adult–child benefits, and disabled widow(er) benefits. The sample includes those who applied for SSDI only and those who concurrently applied for Supplemental Security Income (SSI; a means-tested income support program for people with disabilities). We used 2009–2011 DASH data on the final determination decision and determination date, and restricted the sample to those who had a final determination by the end of 2014.
Our initial sample included 580,542 applicants who applied for SSDI in 2009. We excluded 45,626 records (7.8% of the initial sample) because they did not have records in the 2009, 2010, or 2011 DASH files. We excluded an additional 1,198 cases (0.2% of the initial sample) because their cases were determined after 2014, and we excluded 2,287 cases (0.4% of the initial sample) that did not have a valid decision and decision date in DASH.
Our final sample included 531,431 applicants. Most applicants received final determination decisions the year of or year after application: 49% of applicants received the final determination decision in 2009, and 35% received the decision in 2010. For others, the determination process was prolonged: 13% received the decision in 2011, 2% received it in 2012, and 0.7% received it in 2013 or 2014.
Method
Our analytic approach included two main steps: (a) identification—from the analytic sample of 2009 SSDI applicants—of those who self-reported opioid use at the time of application, (b) estimating the association between self-reported opioid use and employment outcomes.
We identify opioids based on information provided as part of the SSDI application. Applicants are asked to report any prescription or non-prescription medicines being taken at the time of application and may do so via a pull-down list of 630 medication names (available for online applicants), enter their medications in a free-text field, or both. Most applicants reported medications as free-text entries.
To identify opioids in applicants’ disability reports, we used a supervised machine learning algorithm based on natural language processing, implemented in Python. Supervised machine learning is a common approach to identifying smoking status, substance use, and alcohol use from clinical notes or other unstructured medical records (Patra et al., 2021; Singleton et al., 2023). This approach is particularly useful when the burden of manually annotating the full dataset is cost-prohibitive, but a smaller subset of the data can accurately be annotated for the purpose of training a machine learning model. In the context of this study, our goal was to identify millions of free-text fields of self-reported medications, which was not feasible to do manually for the full dataset. Although unsupervised techniques, which do not require training data, can provide a strong starting point for building coding schemes, they tend to yield inaccurate results when used to classify text into predefined categories (Schopf et al., 2022).
Our supervised machine learning approach used labeled datasets with the classification of opioid status assigned by a pharmacist as a model for algorithm development. A subset of the labeled data and comprehensive medical resources listing opioids were used to train the computer to recognize patterns of classification from the matches of text entries to their corresponding categories. Then, we applied the computer-generated algorithm to the remaining subset of labeled data to test the performance. We ultimately achieved an accuracy rate of 99.9% when compared with a test sample manually coded by a pharmacist. We developed and used this method in previous work, which also provides more details about our algorithm (Wu et al., 2019, 2020).
We drew on wages and self-employment income in the MEF to describe the employment and earnings patterns for applicants in our analytic sample in the year their application was determined (the final adjudication of the case after any appeals) and in the first 4 calendar years after that. Because determination could have occurred from 2009 through 2014, the window for employment and earnings outcomes ranges from 2009 through 2013 for those with cases determined in 2009 (49% of the sample) to as late 2014 through 2018 for those with cases determined in 2014 (0.2% of the sample).
We first constructed three outcome measures in the first for years after determination: any employment, the log of average annual earnings, and any engagement in annualized SGA. We determined any engagement in annualized SGA by comparing applicants’ annual earnings to 12 times the non-blind SGA threshold for that year. Because SGA decisions are determined on a monthly basis, this measure may incorrectly characterize beneficiaries relative to what would be recorded in SSDI administrative records for beneficiaries. However, other earnings and SGA measures are not available for denied applicants. We used the annualized measures to compare employment and earning patterns among applicants stratified by opioid use as reported at application, determination decision, and gender.
Next, we examined the association between opioid use at SSDI application and subsequent employment outcomes, estimating the following ordinary least squares regression model:

In this model, Yi is one of the three employment outcomes for applicant i. Opioidi is an indicator for self-reported opioid use at the time of application. Xi is a vector of baseline control variables, including age, gender, education level, receipt of or planned medical care for a mental condition, concurrent application to SSI, geographic region, and the county-level unemployment rate. We also included the determination outcome as a baseline control variable in one specification of equation (1) and conducted alternate specifications in which we estimate separate regressions for those who were awarded and those who were denied benefits. Ti is a dummy variable for the year of SSDI application determination, and Y-2i is the employment outcome 2 years prior to benefit determination. Finally, we tested a specification in which we excluded those who had died before the end of the fourth year after determination, as this group may have a different employment trajectory due to their health condition.
Applicants who reported using opioids at the time of application may differ from those who did not on important dimensions that are not observed in the data, and these differences may contribute to different employment outcomes. First, opioid use may increase with the severity of disability (which is unobservable but can adversely affect employment). In this scenario, the ordinary least square estimates could incorrectly attribute adverse employment outcomes to opioid use, rather than to severe disability. Second, opioid use could be associated with unobserved differences in propensity to return to work. For example, workers who have a higher propensity for work might also be more likely to fill opioid prescriptions as a tool to facilitate their employment. Alternatively, workers less prone to work may be undeterred by the potential for opioids to interfere with work and seek opioid prescriptions. We do not know, a priori, the direction of this association. Accordingly, the association between self-reported opioid use and employment outcomes may not indicate a causal relationship.
We implemented an instrumental variable approach to estimate the causal effect of opioid use on employment outcomes. The approach used local prescribing patterns to instrument for individual opioid prescriptions. However, we believe the instruments suffer from weak instrument bias and that results may be unreliable. See Appendix A for more details.
We also estimate the reduced-form ordinary least squares regression of the association between local opioid prescribing patterns and the subsequent employment outcomes:

The advantage of this approach is that the local opioid prescribing pattern could be correlated with the probability of an individual’s reported opioid use but does not suffer from the endogeneity concerns associated with using the measure of individual-level opioid use. The reason for this is that local opioid prescribing patterns are independent of important unobservables of individual employment behaviors, such as severity of disability and propensity to work. In this analysis, we account for other local economic indicators, such as the county unemployment rate.
Results
Characteristics of SSDI Applicants
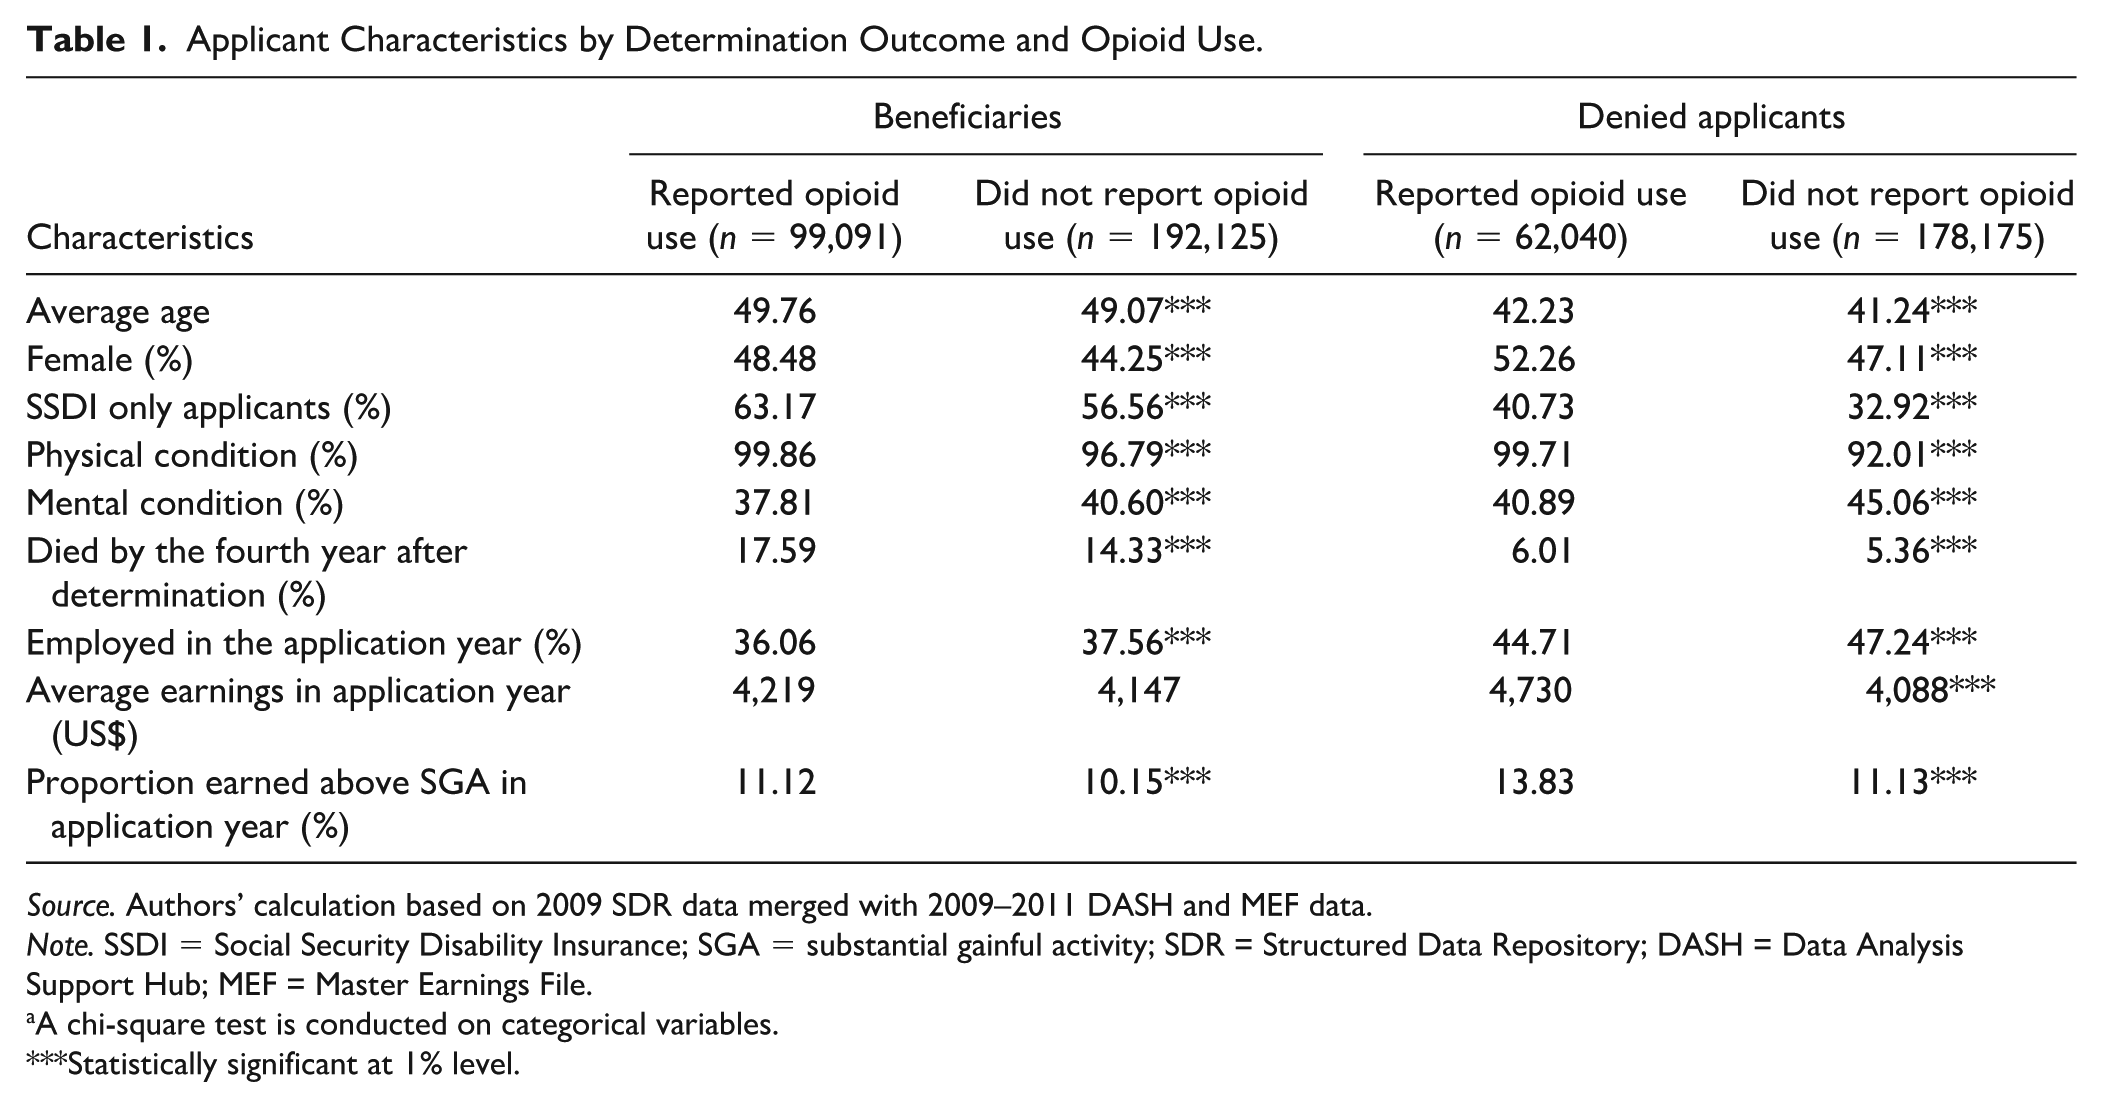
In Table 1, we present the characteristics of the analytic sample by application outcomes and opioid use at the time of application. The majority of the sample (54.8%) were awarded benefits. The first two columns show the characteristics for beneficiaries by opioid use, and the next two columns show the same for denied applications. Overall, 30.3% of our sample reported using opioids at the time of application. Opioid use was higher among those awarded benefits: 34.0% among beneficiaries versus 25.8% among denied applicants.
Applicant Characteristics by Determination Outcome and Opioid Use.
Source. Authors’ calculation based on 2009 SDR data merged with 2009–2011 DASH and MEF data.
Note. SSDI = Social Security Disability Insurance; SGA = substantial gainful activity; SDR = Structured Data Repository; DASH = Data Analysis Support Hub; MEF = Master Earnings File.
A chi-square test is conducted on categorical variables.
Statistically significant at 1% level.
Allowed SSDI applicants differed from denied applicants across several domains (Table 1). Beneficiaries were more likely to die by the fourth year after the determination. Beneficiaries also had a higher likelihood of visiting a physician for physical conditions compared with denied applicants; however, they were less likely to visit a physician for a mental condition. Beneficiaries were less likely to be employed or to have earned above SGA at the calendar year of application. These outcomes are consistent with the design of SSDI, which is meant to support those with the most severe disabilities affecting work. There are other observed differences between allowed and denied applicants, such as those in gender and SSDI-only application.
Applicants who self-reported using opioids at the time of SSDI application differ from those who did not, regardless of award decision. Relative to applicants who did not report opioid use at the time of application, opioid users were more likely to be female and were more likely to be SSDI-only applicants. As indicated by several measures, applicants who used opioids were also in poorer health compared with non-users. They were more likely to be a recipient of or have planned medical care for a physical condition and to die by the fourth year after determination, but they were less likely to visit a physician for a mental condition.
Opioid users were less likely than non-opioid users to be employed at calendar year (2009) of application. We find that, while there is no statistically significant difference in average earnings at the time of application for beneficiaries who used opioids relative to non-opioid users, denied opioid users earned more relative to denied non-opioid users. Both allowed and denied opioid users were more likely to have earned above SGA relative to non-opioid users.
Post-Determination Employment and Earnings Patterns by Opioid Use
In this section, we present post-determination employment and earnings patterns by determination decision and by opioid use at application. In Figure 1, we present employment rates in the year of and in the first 4 years after determination.
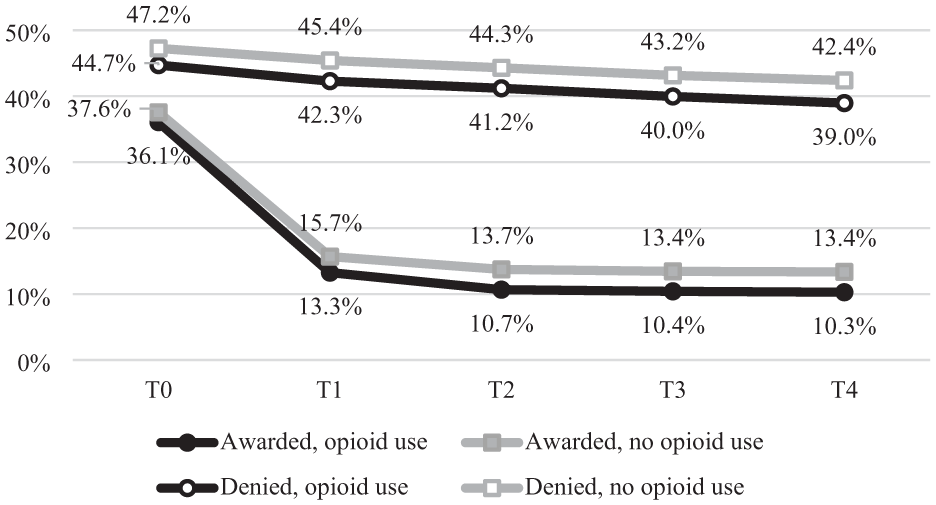
Proportion Employed, by Determination Outcome and Opioid Use.
Across the four applicant groups (awarded opioid user, awarded opioid non-user, denied opioid user, and denied opioid non-user), the employment rate declined over time. The most notable decline was among beneficiaries: the employment rate in the year after determination was less than half the rate in the year of determination and continued to gradually fall for the next 3 years.
The decline in employment after determination was primarily influenced by beneficiaries whose cases were determined in the same year of the application (not shown). Among beneficiaries with 2009 applications and determinations, 55% of opioid non-users and 58% of opioid users were employed in 2009, and 16% and 18% were employed in 2010, respectively. This could signal that the onset of disability interfered with their ability to work. Furthermore, many worked partially in the year they applied. Their partial year earnings and employment in 2009 mostly reflect the pre-disability determination period and 2010 represents a full-post disability determination earnings period.
Among beneficiaries who learned of their award in 2010 or later, the employment rate was already low at the calendar year of determination and the decline was much less pronounced (not shown). For example, among beneficiaries who had cases determined in or after 2011, employment rates ranged between 12% and 15% in the year of determination and fell slightly to 11%–13% 4 years after determination.
Beneficiaries continued to have lower employment rates than denied applicants in the year of and each of the first 4 years after determination (Figure 1). The gap in employment across beneficiaries and denied applicants grew over time as the employment rate among beneficiaries declined. In the year of determination, denied applicants were about 9% points more likely than beneficiaries to be employed, while in the fourth year after determination, denied applicants were about 29% points more likely to be employed than beneficiaries.
Among both awarded and denied applicants, those who self-reported using opioids at the time of application were less likely to be employed compared with non-opioid users. For example, in the year of determination, 47% of denied applicants who did not report opioid use were employed compared with 45% of denied applicants who reported opioid use. This difference persisted and gradually increased over time to about a 3% point difference. A similar pattern exists among beneficiaries. In the year of determination, 38% of beneficiaries who did not report opioid use were employed, compared with 36% of awarded opioid users. In the fourth year after determination, 13% of those who did not report opioid use and 10% of opioid users were employed.
Among those awarded benefits, earnings followed a somewhat similar pattern as employment: total annual earnings were highest in the year of determination and fell sharply in the first year after determination (Figure 2). This reflects the annual nature of the earnings data: the year of award may include pre-disability months. After that point, however, earnings gradually increased in each year. This suggests that those who remain employed are those with higher earnings. Average annual earnings for opioid and non-opioid users awarded benefits were similar in the year of determination, but those without opioid use had earnings that were higher in each of the 4 years after determination. For example, in the fourth year after determination, beneficiaries who did not use opioids earned an average of US$1,509, compared with US$1,277 among beneficiaries who reported opioid use at the time of application.
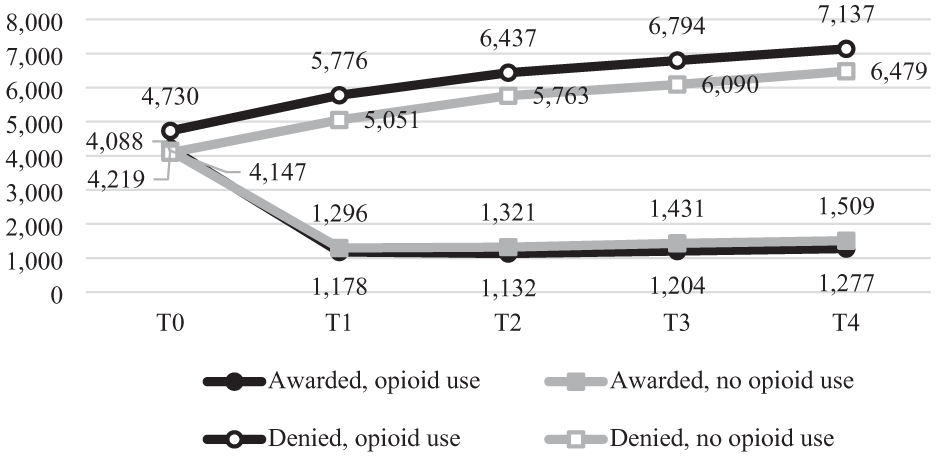
Mean Annual Earnings, by Determination Outcome and Opioid Use.
The relationship between earnings and opioid use among denied applicants was different than the relationship between earnings and opioid use among beneficiaries. Earnings were higher among denied applicants who use opioids than for denied applicants who did not use opioids (Figure 2). In the year of determination, denied applicants who used opioids had earnings that were about 16% higher than among denied applicants who did not use opioids (US$4,730 vs. US$4,088), and an earnings gap persisted through the fourth year after determination. These differences are almost entirely driven by male applicants (not shown).
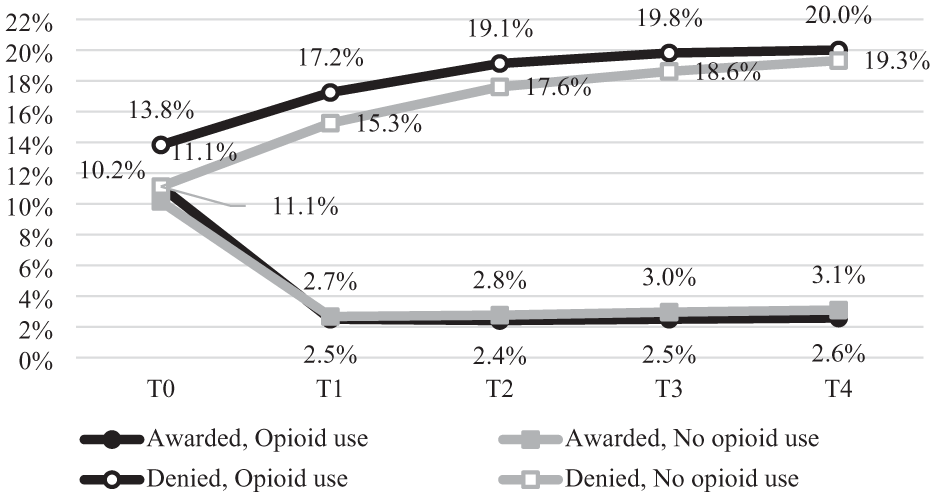
Like the pattern we observe for mean earnings, we find that the proportion that earned above SGA is highest for denied opioid users (Figure 3). Among denied applicants, the gap between opioid users and non-users is largest in the year of determination (13.8% vs. 11.1%, respectively) and begins to converge over the subsequent 4 years. Among beneficiaries, non-opioid users are slightly more likely to have earned above SGA post-SSDI determination.
Proportion Earned Above SGA, by Determination Outcome and Opioid Use.
Collectively, these trends suggest a negative correlation between self-reported opioid use and employment-related outcomes among beneficiaries, but a positive correlation between opioid use and earnings among denied applicants. However, these relationships appear to vary based on factors other than opioid use, including determination year and gender (not shown). In the next section, we estimate the relationship between opioid use and employment outcome, controlling for gender and determination year, and other observable characteristics that potentially influence employment and earnings.
Association Between Opioid Use and Employment-Related Outcomes
The results of the regression model presented in equation (1) indicate that opioids generally have either a negative or no association with employment-related outcomes (Table 2). Opioid use at the time of application was associated with a decline of 3% points in the likelihood of any employment in the first 4 years after determination. This decline is statistically significant at the 1% level and represents a 7.5% decline relative to the mean employment rate of 39.8% in this period. The estimated association between opioids and employment was the same among the sample excluding those who died by the end of the fourth year after determination, and only looked at beneficiaries, but was slightly larger among denied applicants. All estimates were statistically significant.
Association Between Opioid Use and Post-Determination Employment Outcomes.
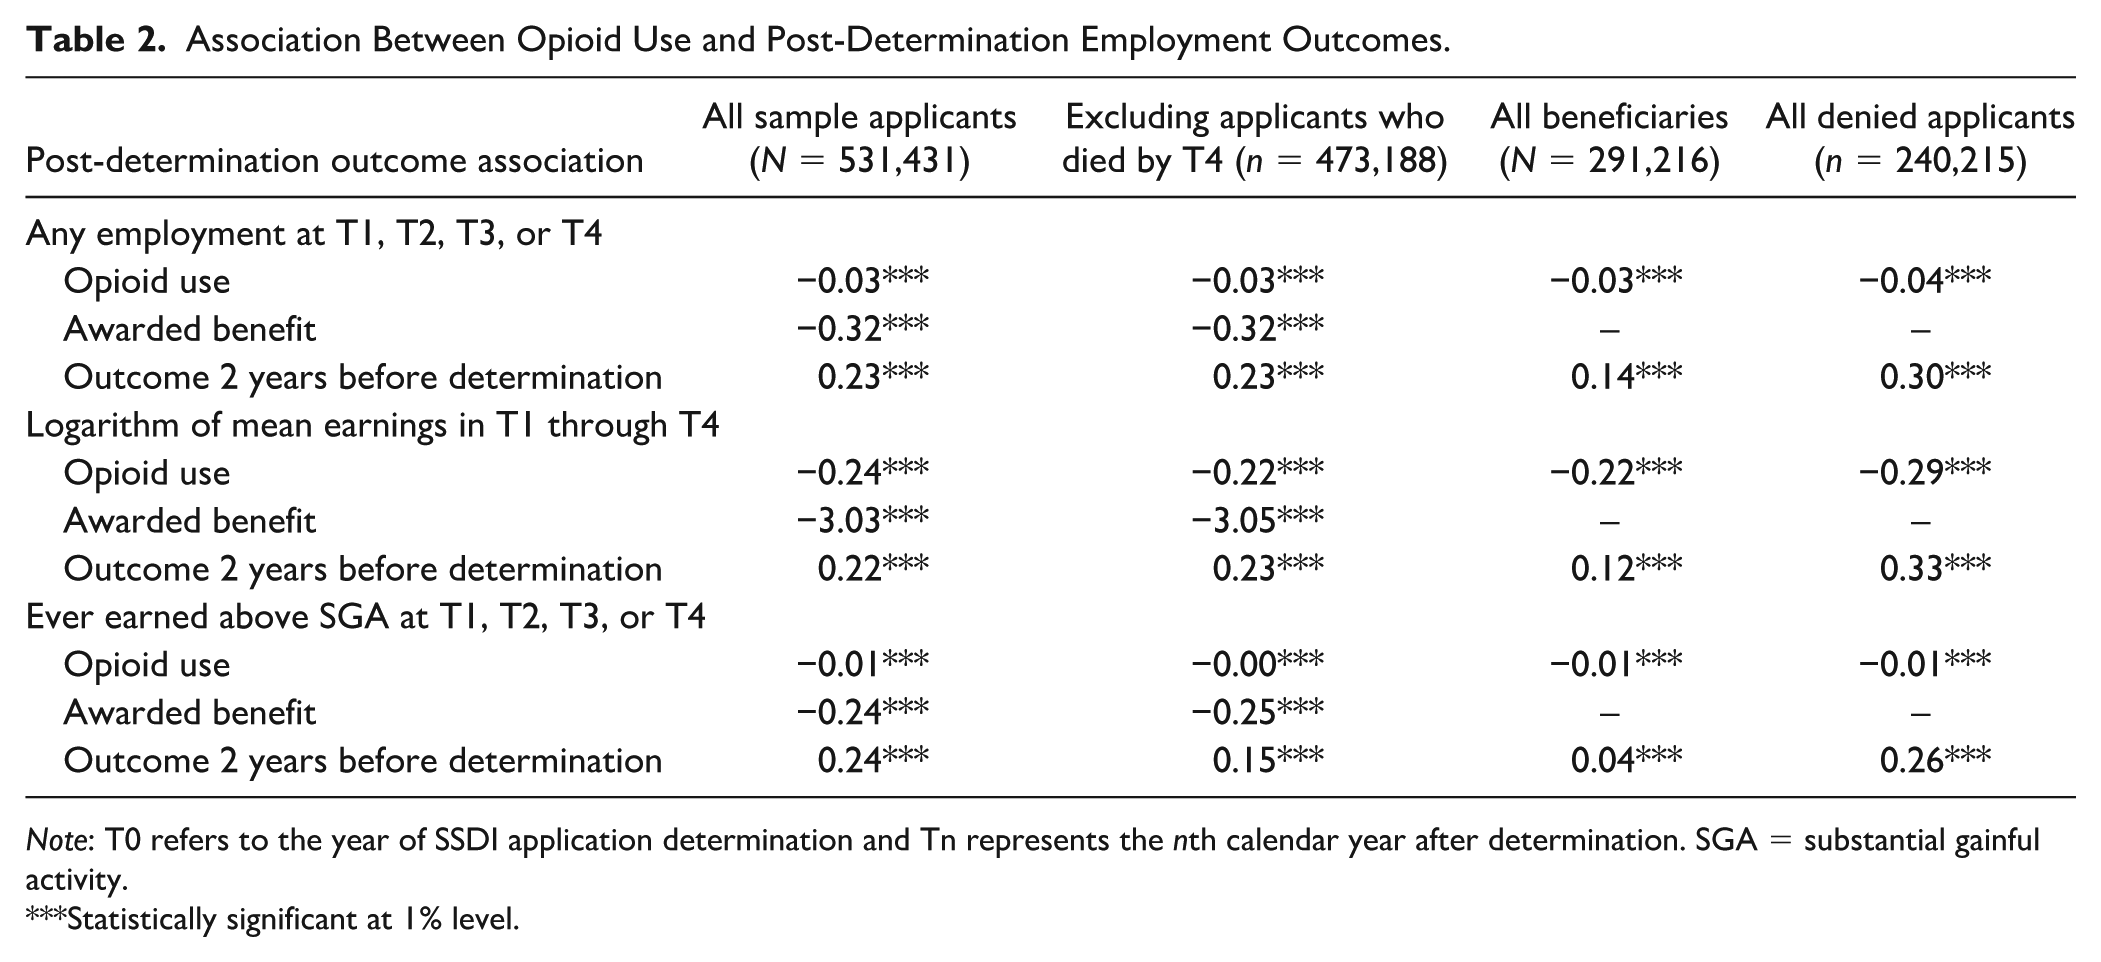
Note: T0 refers to the year of SSDI application determination and Tn represents the nth calendar year after determination. SGA = substantial gainful activity.
Statistically significant at 1% level.
Opioid use was associated with statistically significant lower earnings. Specifically, opioid use at the time of application was associated with a 24% decline in earnings over the 4-year period. The magnitude of the reduction in earnings was slightly smaller among the sample excluding those who died by the end of the fourth year after determination and among the sample of all beneficiaries. The decline was larger for denied applicants, with a 29% decline in earnings over the 4-year period. All estimates were statistically significant.
Opioid use was associated with a statistically significant reduction in SGA engagement in all specifications. Among all applicants, opioid use was associated with a 1% point decline in SGA that was statistically significant at the 1% level. This represents a 6% reduction relative to the 16.4% of all applicants who engaged in SGA. This association held among those who were alive through the end of the analysis period—although it was smaller in magnitude—and for both awarded and denied applicants.
Consistent with what we observed from descriptive patterns, SSDI award is negatively associated with post-determination employment outcomes. For example, being awarded benefits was associated with a decline of 32% points in the likelihood of any employment in the first 4 years after determination. This decline is statistically significant at the 1% level. The difference could occur because those who are awarded benefits are unable to engage in SGA, whereas this might not be true of denied applicants, also, awarded beneficiaries may restrict employment to maintain eligibility for SSDI benefits. We also find that pre-determination employment outcomes are positively correlated with post-determination employment outcomes. Those who worked 2 years before determination are 23% points more likely to work in the first 4 years after determination.
In Table 3, we present results from the reduced-form model estimating the relationship between local opioid prescribing patterns and employment outcomes. For context, we also include results from the ordinary least squares model estimating the association between self-reported opioid use and employment outcomes for all applicants in our analytic sample (results from the first column of Table 2). As discussed in the previous section, the reduced-form approach enables us to correlate the local opioid prescribing pattern with the probability of an individual’s reported opioid use but does not suffer from the endogeneity concerns associated with using the measure of individual-level opioid use. The reduced-form estimates show that a 10% increase in local opioid prescribing rate per 100 persons is associated with a 0.1%–0.2% point decline in the likelihood of any employment in the first 4 years after determination, a 1.3%–1.8% decline in earnings over the 4-year period, and a 0.1%–0.2% point decline in the likelihood of earning above SGA.
Association Between Local Opioid Prescribing Patterns and Post-Determination Employment-Related Outcomes.
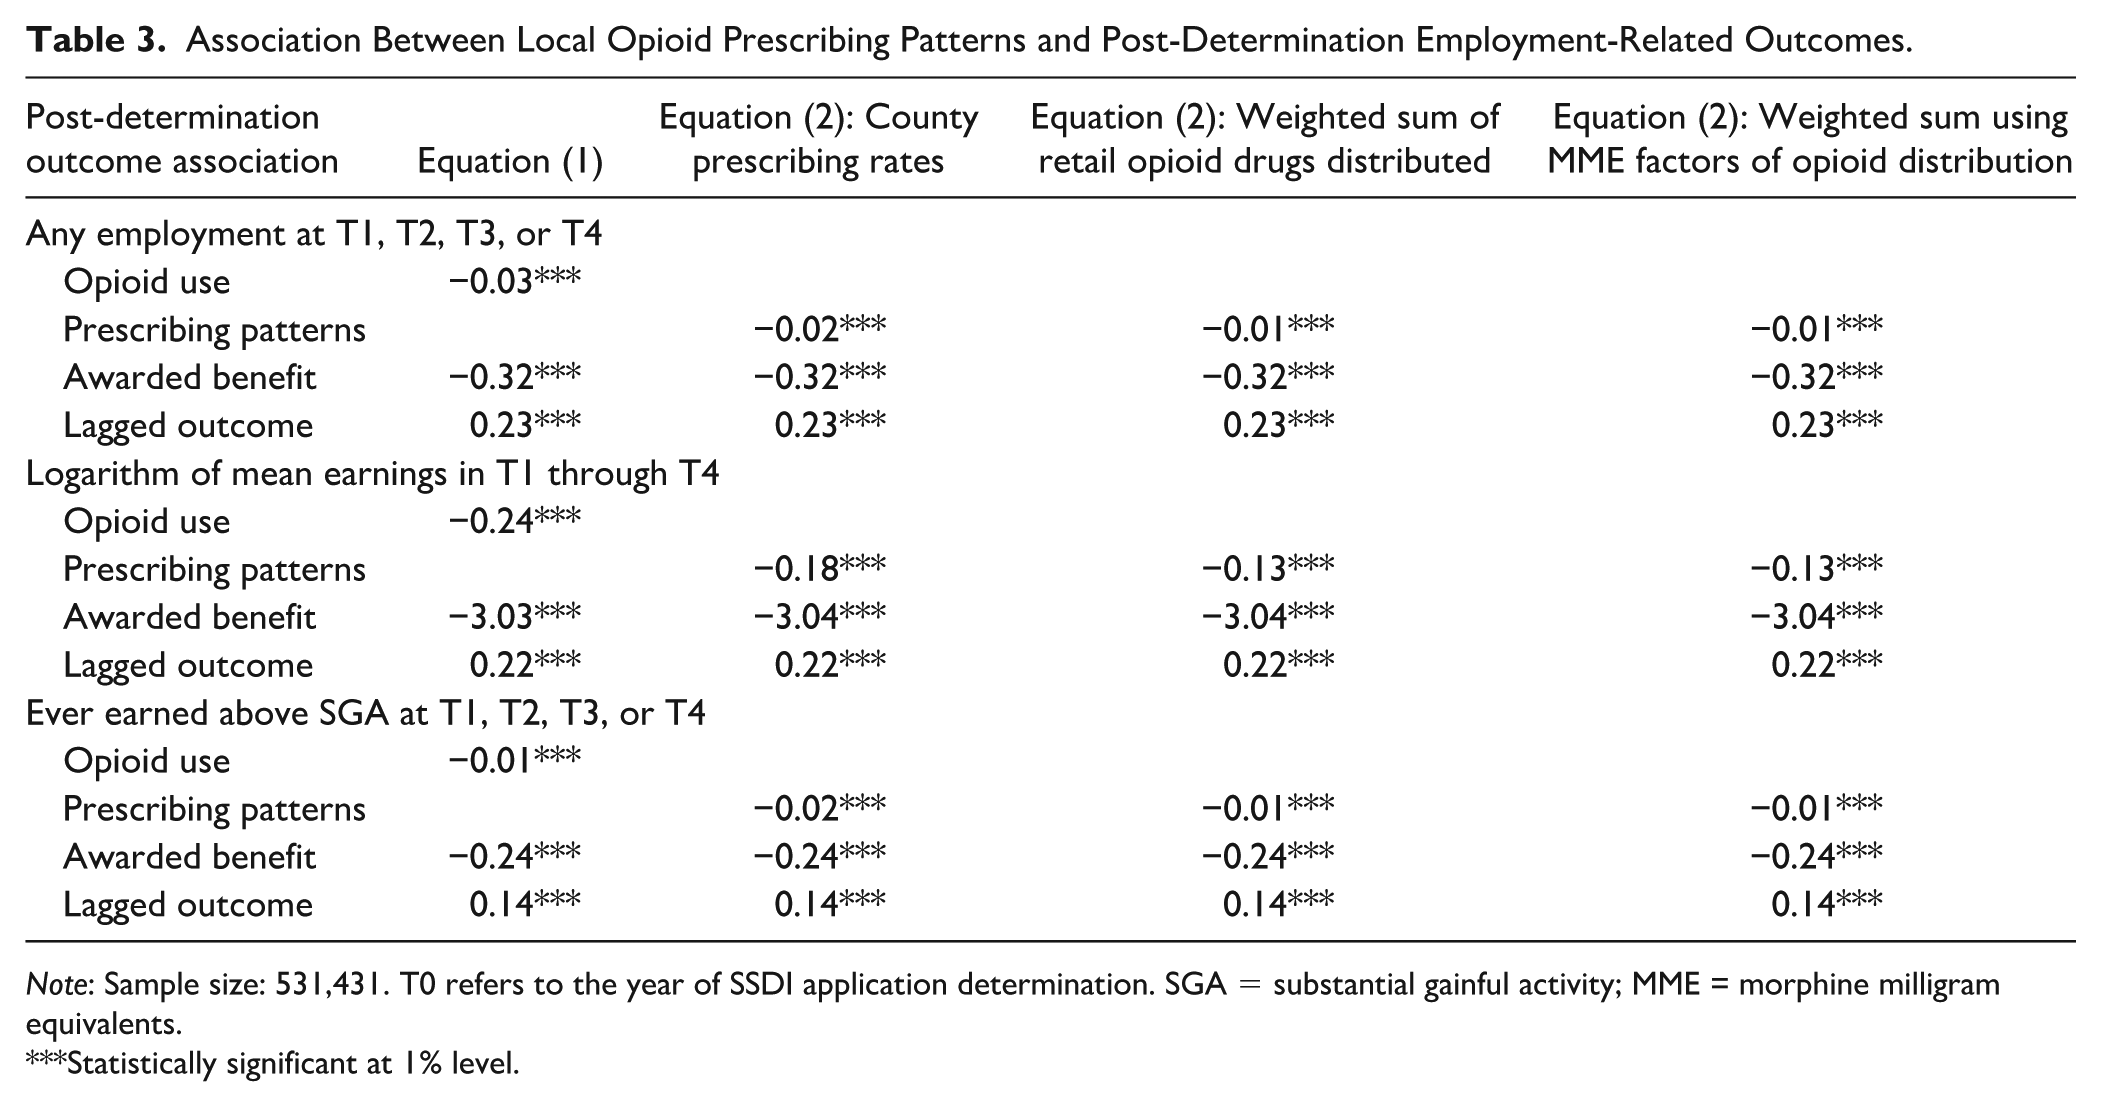
Note: Sample size: 531,431. T0 refers to the year of SSDI application determination. SGA = substantial gainful activity; MME = morphine milligram equivalents.
Statistically significant at 1% level.
Discussion
This case contributes to our understanding of the relationship between self-reported opioid use and employment outcomes among individuals with disabilities. To our knowledge, this is the first study to investigate this relationship among SSDI applicants. Among a cohort of SSDI applicants who applied for the program in 2009, we find lower rates of employment and earnings among beneficiaries who reported opioid use compared with those who did not. Among denied applicants, we find that opioid users are less likely to be employed, but, among those who are employed, earnings are higher. However, these relationships could vary based on factors other than opioid use, such as gender and the length of time between application and determination; this variation emphasizes the importance of controlling for these characteristics.
Controlling for characteristics observable in our data, estimates suggest a negative and statistically significant association between (a) self-reported opioid use at application and (b) post-determination employment and earnings outcomes. We find similar relationships between the levels of local opioid prescribing patterns and employment-related outcomes. This relationship holds among all sample members, in the subsample for which we excluded those who had died before the end of the fourth year after determination, and separately among beneficiaries and applicants who were denied benefits.
The magnitude of our estimates is similar to estimates for the broader population in the literature. Among the larger population of people with and without disabilities in the United States, previous research has found that a 10% increase in opioid prescriptions reduces labor force participation by 0.2%–0.6% points (Aliprantis et al., 2019; Harris et al., 2019). Our results suggest that a 10% increase in the local opioid prescribing rate is associated with, at most, a 0.3% point decline in employment. Although our results are not directly comparable for several reasons—including that the previous literature focused on labor force participation rather than employment—they suggest that, for SSDI applicants, opioid use has a negative association with employment that is of a similar magnitude as for the broader population of people with and without disabilities in the United States.
When interpreting our results, it is important to recognize several limitations of the analysis. First, because the SDR has limited research-ready data on the characteristics of applicants, our estimates of the relationship between opioid use and subsequent labor market outcomes do not control for several factors that may be important determinants of post-determination employment outcomes—such as the applicant’s type of impairment, overall health status, and work history.
In addition, the statistics in this case are based on self-reported opioid use among applicants. Generally, survey respondents tend to underreport stigmatized behaviors, and there is a documented tendency of drug users to underreport drug use in surveys, particularly illicit drug use (Center for Behavioral Health Statistics and Quality, 2015; Fendrich et al., 2004). Although our data are from administrative rather than survey data, it still seems likely that non-prescription opioid use is underreported, and it is also possible that the degree of underestimation varies by applicant subgroup. This measurement error may contribute to estimation bias.
Finally, we are not able to produce causal evidence on the relationship between opioid use and employment outcomes because our instruments suffer from weak instrument bias that leads to improbably large and hard to interpret estimates. In ordinary least squares estimates, self-reported opioid use may be a marker for unobserved dimensions of disability severity or for unobserved worker characteristics related to employment and earnings outcomes.
Conclusion
This study represents an important first step in documenting the association between opioid use and employment outcomes among SSDI applicants. Although the association for this subgroup appears to be similar to the association among the larger population, the implications are particularly important for SSDI applicants. SSDI applicants include a larger share of opioid users than in the broader population. In 2016, 29% of this group self-reported opioid use (Wu et al., 2020), compared with 19% of the U.S. population (Mytelka et al., 2018). Hence, any adverse associations with employment outcomes will be particularly pronounced among SSDI applicants.
We find that the negative association between self-reported opioid use and post-determination employment and earnings holds among both awarded and denied applicants. This finding suggests that future research can inform SSA about several aspects of the SSDI program. For instance, a better understanding of the role of opioids in employment may lead to a better understanding of employment trajectories for SSDI beneficiaries. Future research could also investigate whether opioid use might contribute to SSDI reapplication.
Finally, although the results point to a negative association between opioid use and employment outcomes, this study does not address the medical appropriateness of opioid use among SSDI applicants, rather it focuses on the employment and earnings effects of opioid use for this population. Because we do not demonstrate a causal association, our measures of opioid use could be conflated with unmeasured factors, such as disability severity or attachment to the labor force.
Supplemental Material
sj-docx-1-dps-10.1177_10442073241304108 – Supplemental material for Employment Outcomes for Social Security Disability Insurance Applicants Who Use Opioids
Supplemental material, sj-docx-1-dps-10.1177_10442073241304108 for Employment Outcomes for Social Security Disability Insurance Applicants Who Use Opioids by Denise Hoffman, April Yanyuan Wu and Paul O’Leary in Journal of Disability Policy Studies
Footnotes
Declaration of Conflicting Interests
The author(s) declared no potential conflicts of interest with respect to the research, authorship, and/or publication of this article.
Funding
This research was supported by a grant from the U.S. Social Security Administration as part of the Retirement and Disability Research Consortium.
References
Supplementary Material
Please find the following supplemental material available below.
For Open Access articles published under a Creative Commons License, all supplemental material carries the same license as the article it is associated with.
For non-Open Access articles published, all supplemental material carries a non-exclusive license, and permission requests for re-use of supplemental material or any part of supplemental material shall be sent directly to the copyright owner as specified in the copyright notice associated with the article.