






Abstract
Introduction:
Recurrent psychiatric hospitalizations in youth are costly and burdensome to patients and families. While postdischarge planning rarely stratifies patients based on their risk of readmission, predictive modeling could identify at-risk youth to facilitate targeted intervention strategies. This study developed and validated machine learning models to predict psychiatric readmission in children and adolescents.
Methods:
This retrospective cohort study included 11,225 patients (20,339 psychiatric admissions) ≤ 18 years old with at least one psychiatric admission and an anxiety or depressive disorder diagnosis at any time during the study period from two tertiary-care academic medical centers. Machine learning models were developed to predict psychiatric readmission versus no readmission within 30, 90, and 180 days of discharge using electronic health record data from one institution. These models were internally validated at the development site and externally validated at the second institution.
Results:
Model development and internal validation using random forest models predicted 30-, 90-, and 180-day readmission with area under the receiver operating characteristic curves (AUROC) equal to 0.739, 0.742, and 0.746, respectively. The most important features identified across follow-up periods included previous psychiatric admissions, length of stay, age, and antipsychotic prescriptions. Models trained using a reduced set of 18 features obtained similar performance, with AUROCs ranging from 0.741 to 0.745. External validation of the models retrained using 12 features available at both institutions yielded AUROCs of 0.598, 0.634, and 0.657 for 30-, 90-, and 180-day readmission, respectively.
Conclusion:
The findings of this study suggest that machine learning models can identify children and adolescents at risk of psychiatric readmission.
Introduction
Psychiatric admissions in children and adolescents increased by 26% from 2009 to 2019 and have occurred in parallel with escalating health care utilization (e.g., inpatient length of stay, interfacility transfers) (Arakelyan et al., 2023; Lebrun-Harris et al., 2022; Tkacz and Brady, 2021). Psychiatric disorders are expensive to treat, and hospitalizations are costly, with pediatric psychiatric hospitalizations estimated to cost $1.37 billion in 2019 and depressive disorders being the most costly to treat (Arakelyan et al., 2023; Bardach et al., 2014; Soni, 2001). Furthermore, 12%–28% of youth requiring psychiatric hospitalization are readmitted within 6 months of discharge (Arnold et al., 2003; Joyce et al., 2019; Phillips et al., 2020; van Alphen et al., 2017), and most readmissions occur within 90 days (Blader, 2004; Fontanella, 2008; James et al., 2010; Miller et al., 2020). Unplanned, recurrent admissions can be disruptive and deleterious because they impair emotional and social functioning, hinder academic success, adversely affect quality of life into adulthood, and impose substantial burdens on families (Best et al., 2004; Weller et al., 2015). Identifying children and adolescents at risk of readmission could improve the allocation of institutional resources and ensure that high-risk patients receive adequate treatment and interventions (McBain et al., 2022; Trask et al., 2016; Zima et al., 2016).
Previous all-cause pediatric readmission models have commonly excluded psychiatric admissions (Davis et al., 2022; Goodman et al., 2022). Furthermore, only one rule-based (i.e., risk factors determined by literature review) psychiatric readmission tool has been developed in a cohort of patients aged 2–12 years old (Ramsbottom and Farmer, 2018). Therefore, the objective of this study was to develop and validate machine learning models to predict psychiatric readmission within 30, 90, and 180 days of discharge in children and adolescents diagnosed with anxiety or depression using real-world data from the electronic health record (EHR).
Methods
Patient population
This is a retrospective cohort study using EHR data from two tertiary-care academic medical centers. Patients ≤ 18 years of age who had at least one psychiatric admission at Cincinnati Children’s Hospital Medical Center (CCHMC) between September 1, 2013, and December 31, 2022, or Vanderbilt University Medical Center (VUMC) between January 1, 2017, and December 31, 2019, were eligible. Inclusion criteria included having a diagnosed anxiety or depressive disorder during the study period as identified using the International Classification of Diseases (ICD)–9-CM (309.21, 313.0) and ICD-10-CM codes (F32, F33, F41, F43.1, F43.21, F43.22, F43.23, F40). No other exclusionary criteria based on disease or diagnosis history were made. This study was approved by the local institutional review boards at CCHMC and VUMC. The reporting of these data follows the Transparent Reporting of a Multivariable Prediction Model for Individual Prognosis or Diagnosis (TRIPOD) Reporting Guidelines (Collins et al., 2015).
Definition of outcomes
The three outcomes evaluated in this study were any psychiatric readmission to the same hospital within 30, 90, and 180 days of discharge from an index psychiatric hospitalization. A specific primary diagnosis or reason for psychiatric hospitalization (e.g., anxiety or depression) was not required to be considered as a readmission. Furthermore, admissions and readmissions to other regional psychiatric hospitals were not considered. Each admission was classified as a case if there was a subsequent psychiatric hospitalization within the respective follow-up period or a control if there was no psychiatric hospitalization. To mitigate the risk of redundant admissions due to interdepartmental transfers (e.g., patient initially boarded in hospital medicine and transferred to inpatient psychiatry), admissions were merged if a discharge and subsequent admission for a patient occurred within three hours of each other.
Data collection
Patient data were obtained from the EHR at both institutions and used for model development. These included demographics, diagnoses, prescription orders, laboratory results, pharmacogenetic testing results (e.g., cytochrome P450 2C19 and CYP2D6 phenotypes from routine clinical testing) (Ramsey et al., 2019), hospital encounters, health insurance, and data captured in flowsheets, which are tabular documentation forms (e.g., Columbia-Suicide Severity Rating Scale, Brief Rating of Aggression by Children and Adolescents) (Barzman et al., 2011). When multiple measurements were obtained during an admission, the average was calculated.
Missing data and imputation
Features that had >25% missingness were removed (see the Feature Selection section). For features related to substance abuse panel results (e.g., amphetamine, marijuana, cotinine), a new value corresponding to a “missing” result was imputed. Patients with missing CYP2C19 or CYP2D6 phenotypes were imputed to be normal metabolizers because clinicians treat patients with unknown pharmacogenetic testing in accordance with the standard of care. For each observation, one feature was created to flag observations where ≥50% of that admission’s laboratory values (e.g., complete blood count and comprehensive metabolic panel results) were missing. This was implemented to capture potential differences in care between observations that could influence readmission. Individual laboratory variables that were missing >25% were still excluded prior to the creation of this feature during the feature selection process. The remaining features were imputed using a bootstrap aggregation, or bagged trees, approach based on all available features. Heights and weights were imputed separately using the same approach but used only sex, age, and either height or weight when available, as these are known biological determinants for child and adolescent anthropometrics. Imputation via bagged trees was implemented using the recipes package in R. Nominal variables were one-hot encoded, ordered variables were ordinal encoded, and continuous variables were centered at a mean of zero and scaled to a standard deviation of one.
Feature selection
Prior to preprocessing, the raw feature set included over 200 variables. To improve the generalizability and interpretability of the final feature set and reduce model complexity, feature selection steps were performed using only the training set. First, two board-certified child and adolescent psychiatrists (S.E.V. and J.R.S.) reviewed the raw feature set to identify any irrelevant or missing covariates that could be removed or added, respectively. Second, features that had >25% missingness were removed from the dataset (N = 50). This step ensured features that would require a large proportion of imputation did not enter the model development phase and risk biasing predictions. Third, variance thresholding removed features that were sparse or exhibited low variance. Finally, recursive feature elimination (RFE) was implemented to identify a subset of features that can predict readmission. Three-fold cross-validation and a random forest algorithm with 1000 trees were used to optimize the area under the receiver operating characteristic curve (AUROC). Through this approach, models were sequentially trained using progressively smaller subsets of features. The final feature set was selected by identifying the smallest set of features where the mean AUROC was within a 1% difference of a model including all features. The 1% difference threshold was chosen a priori to balance predictive performance with model parsimony. Visual inspection of plots comparing the performance of the top n selected features provided supplementary guidance in the selection of the final feature set. RFE was implemented separately for each outcome (i.e., n = 3 total for predicting 30-, 90-, and 180-day readmission) to ensure that the final features used for training each model were representative of that follow-up period. Because the top features were similar for each outcome, additional models were developed using the features that completely overlapped between the top 20, 40, and 60 features for each endpoint. The top 60 features identified by the RFE procedure for each outcome are available in Supplementary Table S1. Feature reduction occurred only in the training set and did not incorporate data from the testing set.
Model development
A time-based cross-validation procedure of data from CCHMC was implemented to create independent training and testing sets. Data from 2013 to 2019 were used for training, and data from 2022 were used for testing the models. The readmission status of patients in the testing set whose follow-up period extended into 2023 was included to avoid right-censoring due to insufficient follow-up time. Data from 2020 and 2021 were not utilized for model training or testing because of changes in the frequency of admissions and the potential for variation in clinical care during or due to the COVID-19 pandemic (Amill-Rosario et al., 2022; Gutiérrez-Sacristán et al., 2022; Leeb et al., 2020; Sorter et al., 2024). Admissions <1 day or >21 days in length were excluded because they potentially correspond to observations that do not represent regular care (e.g., discharge against medical advice, prolonged stay due to issues related to residential placement or state custody). The following algorithms were compared for each outcome: logistic regression, L1-regularized (lasso) regression, L2-regularized (ridge) regression, elastic net regression, random forest, naïve bayes, extreme gradient boosting (XGBoost), support vector machines, and multilayer perceptron. Hyperparameter tuning was performed using 10-fold cross-validation via grid search during model training, with AUROC as the optimization metric. A description of the hyperparameter tuning procedures is provided in Supplementary Table S2. Variable importance scores were calculated for the random forest models to aid in the interpretability of the model predictions and correspond to the scaled Gini impurity index. All models were developed using the recipes and caret packages in R.
Sensitivity analysis
Three sensitivity analyses were conducted to assess the stability of the model predictions. First, because a temporal split was used for creating training and testing sets, there were patients who were included in both sets due to when they were admitted, which could cause data leakage. Therefore, in the final model, patients who appeared in duplicate were removed during model training, and performance was reevaluated on the testing set. Second, to ensure that the imputation of missing data did not influence predictions, the performance of the models was evaluated using only observations with complete data in both the training and testing sets. Finally, while admissions during the COVID-19 pandemic (2020–2021) were not initially included during model development, the testing set was expanded to include psychiatric admissions from 2020 to 2022 to assess how robust the models were to temporal variations in admissions during this period.
External model validation
The models developed at CCHMC were externally validated using data from VUMC to assess the generalizability of the predictions. However, certain data were not collected outside of CCHMC (e.g., Brief Rating of Aggression by Children and Adolescents, pharmacogenetic testing). During internal model development, we identified 18 features that ranked in the top 20 across all follow-up periods. Of these, 12 were available at both sites; therefore, the models at CCHMC were retrained using these 12 features, and performance was evaluated at VUMC. Preprocessing steps applied to the data from CCHMC were similarly applied to the data from VUMC. The models trained and tested at CCHMC were developed independently from the validation data at VUMC.
Statistical analysis
The AUROC was used to evaluate model performance on the test set. The optimal probability threshold for classification was determined using the Youden index, which maximizes the sum of sensitivity and specificity. The AUROCs of models were compared using DeLong’s test. For the final model, the sensitivity, specificity, positive predictive value (PPV), and negative predictive value (NPV) were calculated at probability thresholds ranging from 0.05 to 0.5 on the testing set. Additionally, the number needed to detect (NND) one case correctly and the number needed to screen (NNS) to prevent one misclassification were calculated to provide additional measures of model efficacy (Linn and Grunau, 2006; Rembold, 1998). The NND was determined by taking the inverse of the sensitivity + specificity – 1, or the inverse of the Youden index, and the NNS was determined by taking the inverse of the PPV + NPV – 1. The expected calibration error, slope, and intercept were used to assess model calibration (Schwarz and Heider, 2019). Univariate logistic regression was implemented to evaluate associations between model features and readmission outcome and calculate odds ratios. p-values were considered statistically significant at α = 0.05. All analyses were performed using R (version 4.4.0).
Results
Patients
From CCHMC, there were 18,493 admissions (mean [standard deviation] age, 14.7 [2.3] years; 12,697 [69%] female) from 9,705 patients included in the study, with 2,707 (15%), 4,799 (26%), and 6,379 (34%) admissions with a readmission within 30, 90, and 180 days, respectively. At the patient level, 2,743 of 9,705 (28%) patients had at least one readmission within 180 days of discharge. A total of 16,195 (87%) admissions were used for training, and 2,298 (13%) admissions were used for testing. Anxiety and depression were the most common diagnoses and were frequently comorbid at each admission (Supplementary Table S3). From VUMC, there were 1,846 admissions (mean [SD] age, 14.1 [2.8] years; 1,139 [62%] female) from 1,520 patients, with 134 (7%), 211 (11%), and 283 (15%) admissions with a readmission within 30, 90, and 180 days, respectively. A summary of admission characteristics at both sites is provided in Table 1.
Admission Characteristics
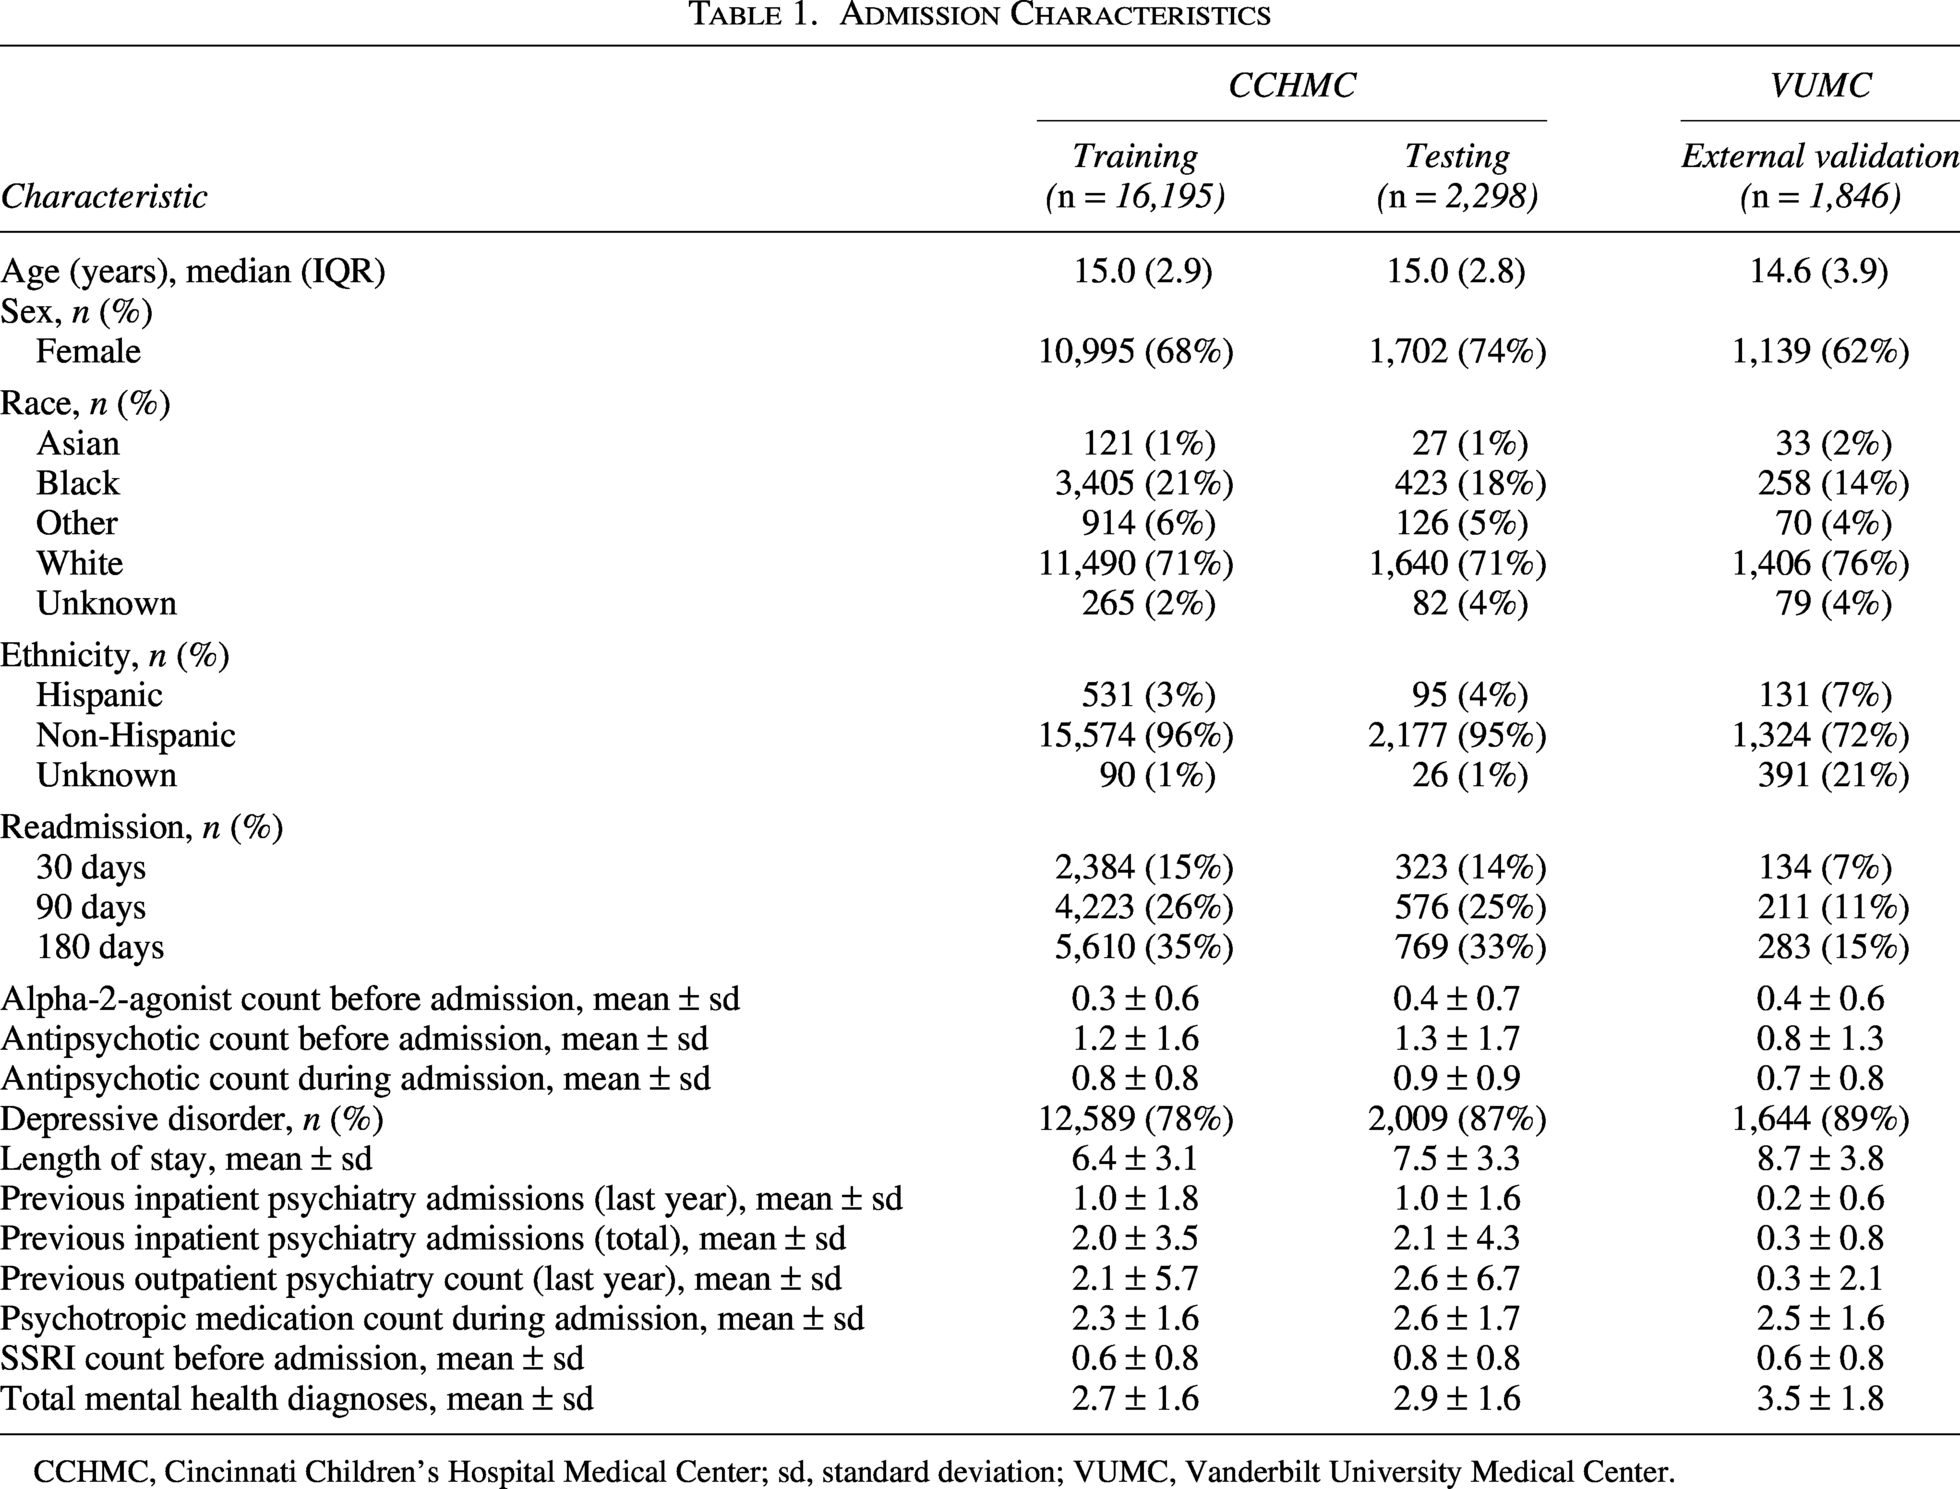
CCHMC, Cincinnati Children’s Hospital Medical Center; sd, standard deviation; VUMC, Vanderbilt University Medical Center.
Model performance
A total of 22, 31, and 33 features were selected for the 30-, 90-, and 180-day readmission models, respectively. The AUROCs of the models in predicting 30-, 90-, and 180-day readmission ranged from 0.694 to 0.743, 0.709 to 0.742, and 0.704 to 0.750, respectively (Table 2). Predicted probabilities were highly correlated across individual models and model types for each follow-up period (Supplementary Fig. S1). The random forest and XGBoost models yielded the highest AUROCs and had similar performance across follow-up periods. Because these were all not statistically different (all p > 0.05), we focused on random forest due to its balance between performance, interpretability, and generalizability. The AUROC of the random forest models on the testing set for predicting 30-day readmission was 0.739 (95% CI: 0.710–0.768), 90-day readmission was 0.742 (95% CI: 0.719–0.765), and 180-day readmission was 0.746 (95% CI: 0.724–0.767) (Fig. 1A–C). The predicted probabilities of readmission by the observed class are shown in Figure 1D–F. The expected calibration errors for the 30-day (0.02, slope = 1.3, intercept = 0.3), 90-day (0.05, slope = 1.3, intercept = 0.05), and 180-day (0.04, slope = 1.2, intercept = −0.1) were low, indicating good calibration (Fig. 1G–I). Sensitivity analyses demonstrated that model performance was unaffected by duplicate patients in training and testing sets, data imputation, and the COVID-19 pandemic (Supplementary Table S4).
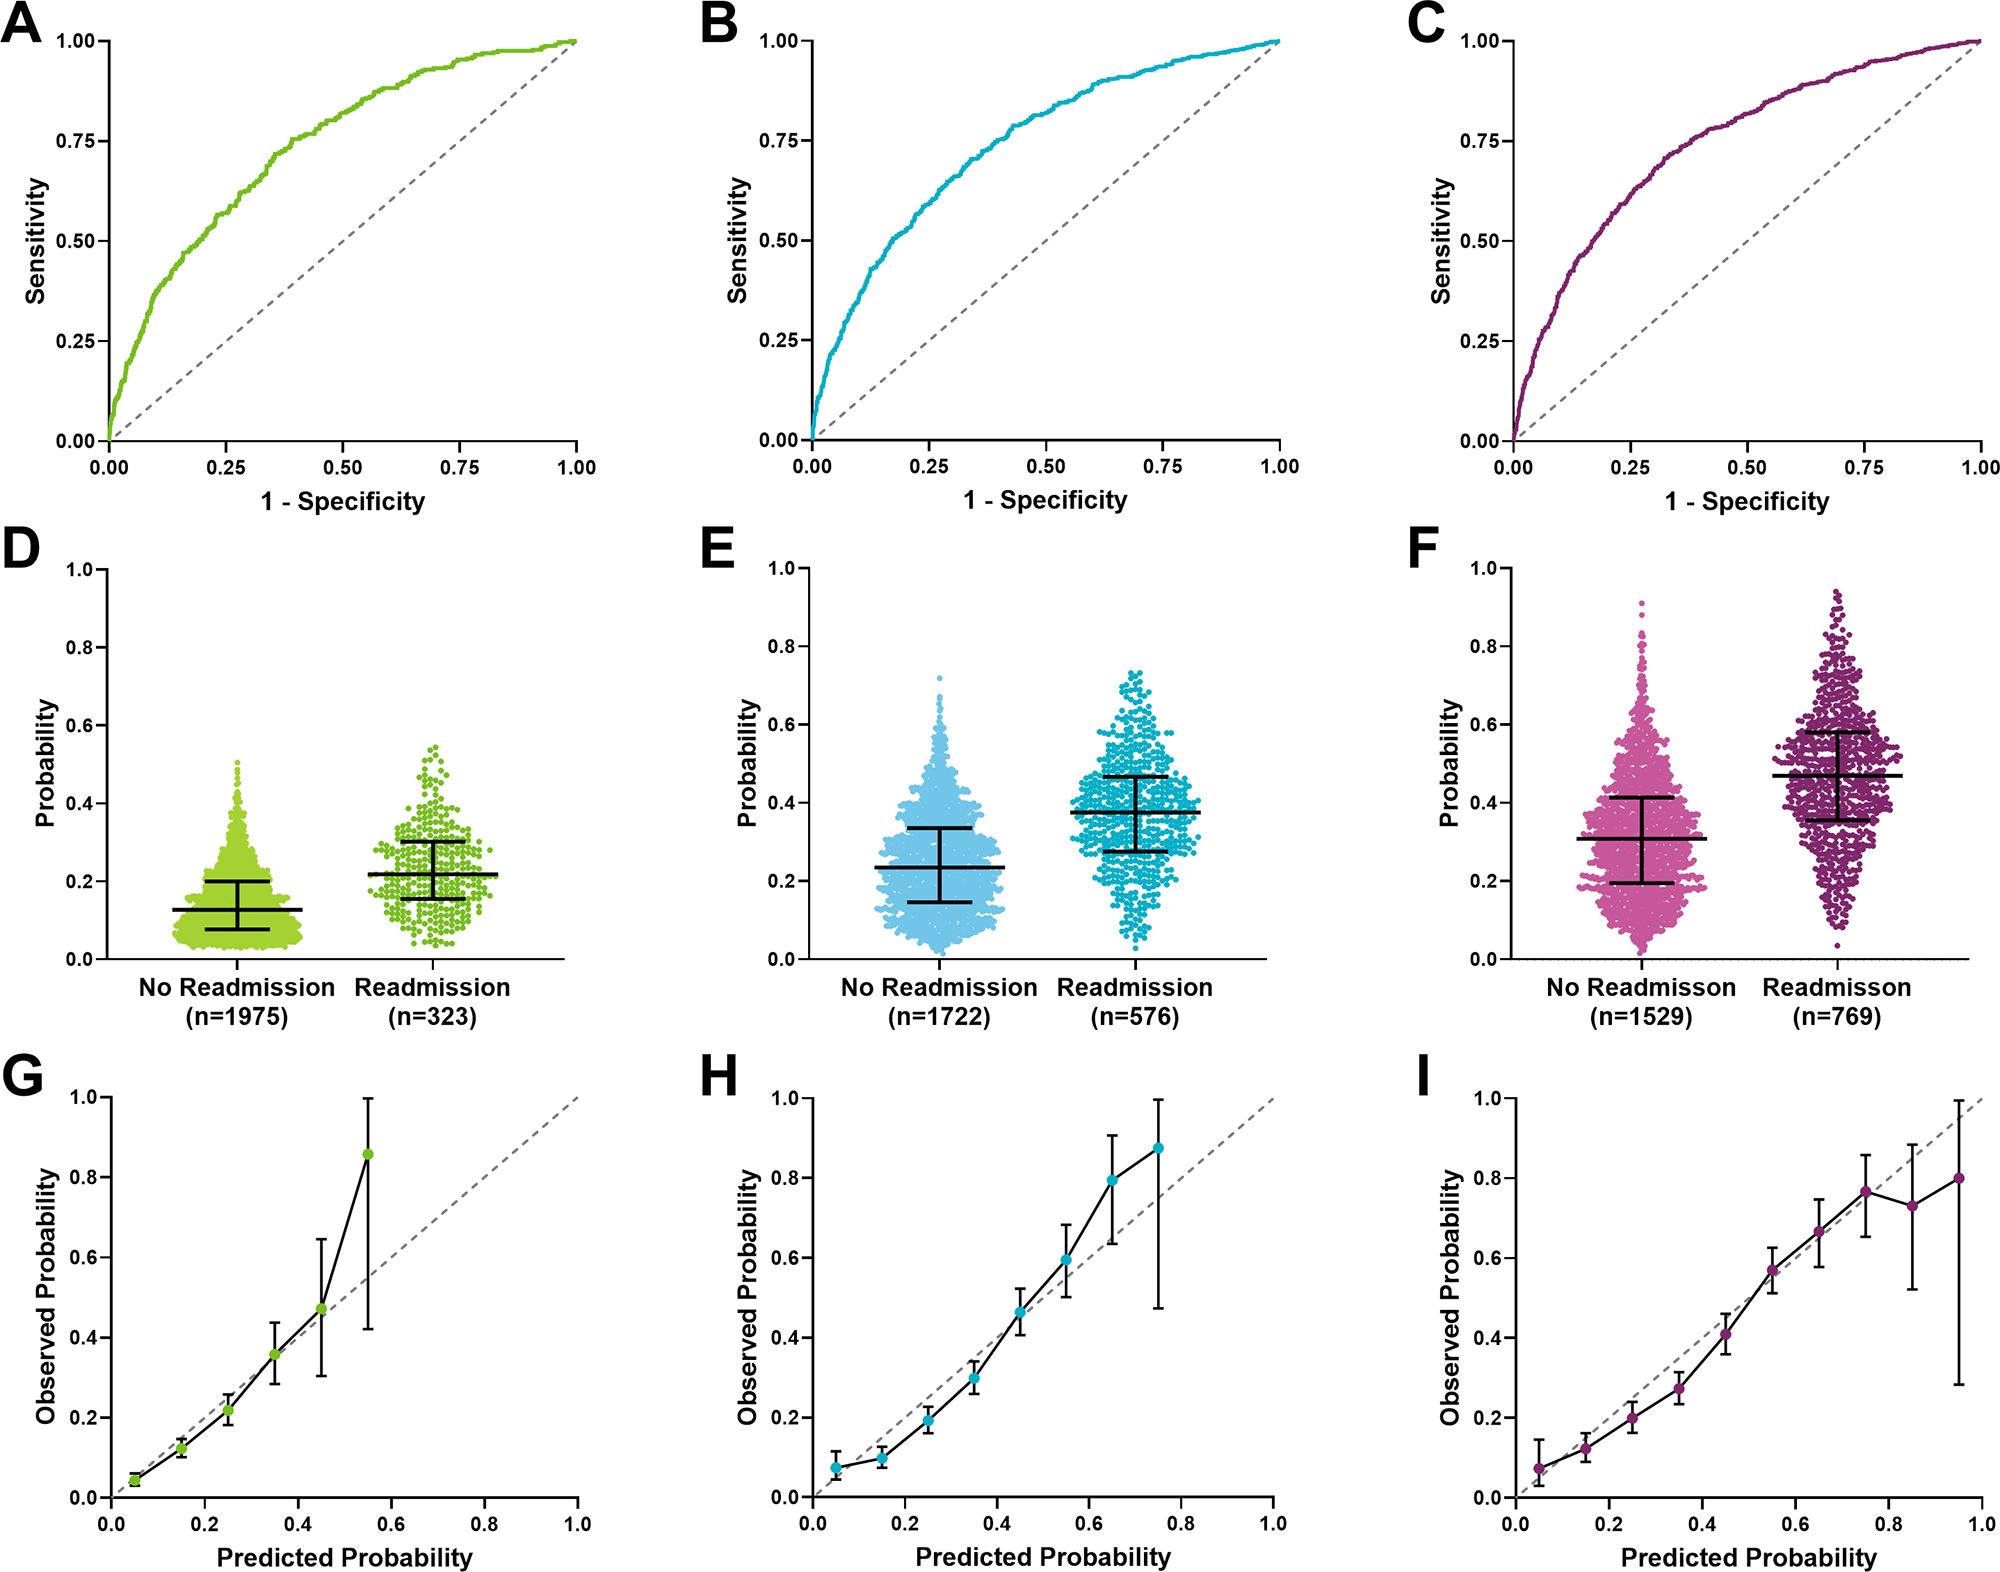
Random forest model performance for predicting 30-, 90-, and 180-day readmission. Area under the receiver operating characteristic curve (AUROC) for predicting
Machine Learning Model Performances for Predicting 30-, 90-, and 180-Day Readmission
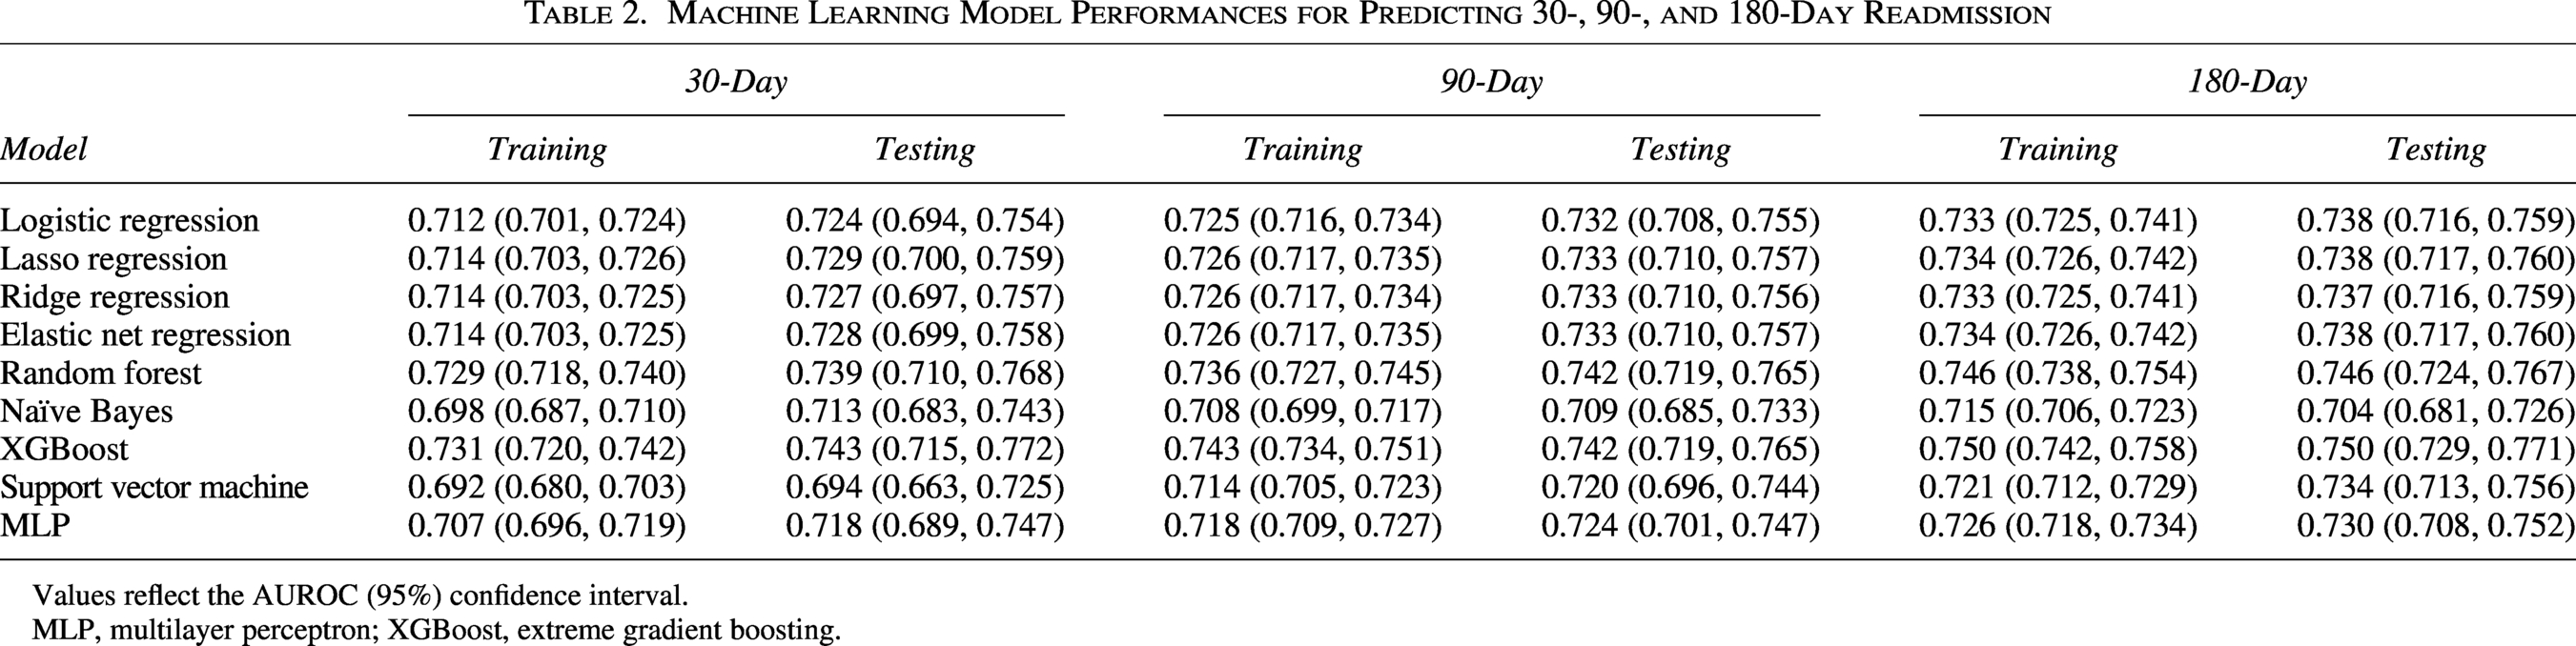
Values reflect the AUROC (95%) confidence interval.
MLP, multilayer perceptron; XGBoost, extreme gradient boosting.
Figure 2 shows the sensitivity, specificity, NND, and NNS across probability thresholds for each model. For predicting 30-day readmission, setting the threshold at a value that minimized the NND (or maximized the Youden index) achieved a sensitivity of 0.718 (95% CI: 0.667–0.765), specificity of 0.646 (95% CI: 0.624–0.666), PPV of 0.249 (95% CI: 0.222–0.278), NPV of 0.933 (95% CI: 0.919–0.945), NND of 2.75, and NNS of 5.49. For predicting 90-day readmission, setting the threshold at a value that minimized the NND achieved a sensitivity of 0.703 (95% CI: 0.665–0.739), specificity of 0.661 (95% CI: 0.639–0.683), PPV of 0.410 (95% CI: 0.380–0.441), NPV of 0.869 (95% CI: 0.850–0.887), NND of 2.74, and NNS of 3.58. For predicting 180-day readmission, setting the threshold at a value that minimized the NND achieved a sensitivity of 0.717 (95% CI: 0.684–0.747), specificity of 0.668 (95% CI: 0.644–0.692), PPV of 0.521 (95% CI: 0.491–0.551), NPV of 0.824 (95% CI: 0.802–0.844), NND of 2.60, and NNS of 2.90.
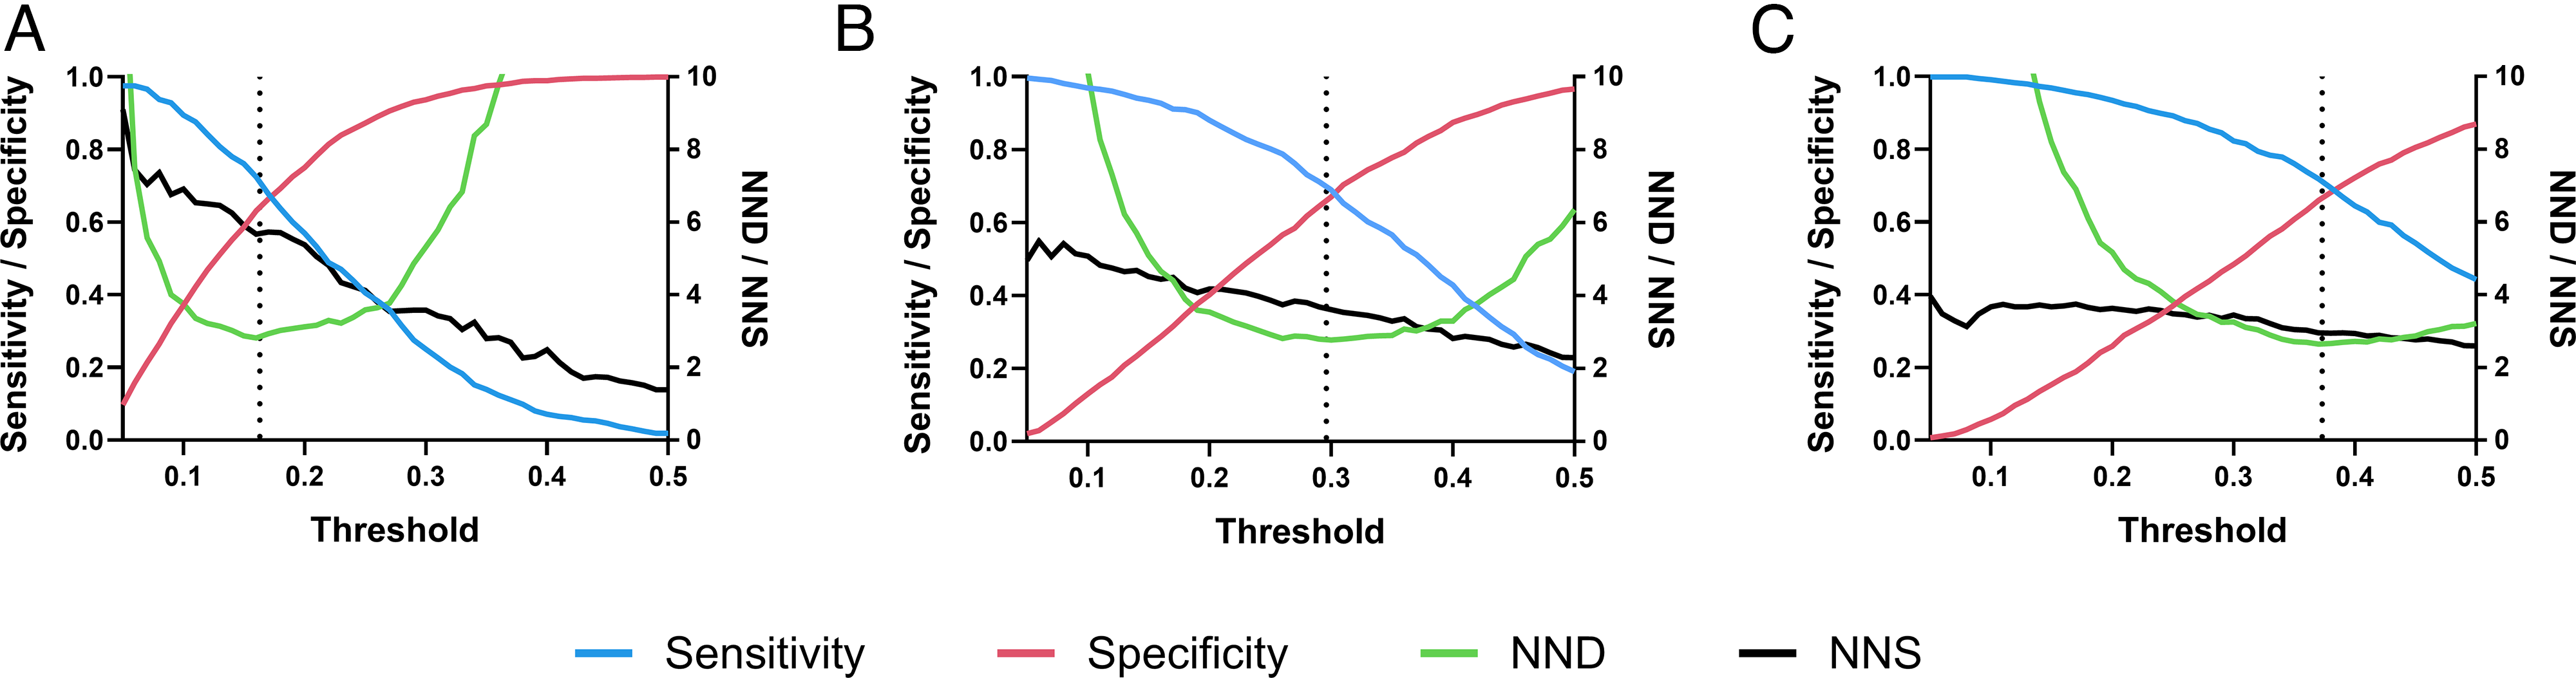
Random forest probability thresholds. Sensitivity and specificity (left y-axis) and the number needed to detect (NND) and the number needed to screen (NNS) (right y-axis) across probability thresholds for the random forest
The selected features and their coefficients for each model, along with results from univariate logistic regression analyses, are reported in Supplementary Tables S5, S6, and S7. Across all three follow-up periods, many features demonstrated increased likelihood of readmission, including having previous psychiatric admissions, longer length of stay, and being prescribed antipsychotics before or during admission. For example, each day of hospital stay increased the odds of being readmitted within 30 days following discharge by 11%. Comparatively, features like age and having a depressive disorder diagnosis were protective. While these findings help to elucidate how these features contribute to model predictions, they do not support causal relationships, especially as the random forest models can capture interactive and nonlinear associations, which are likely contributing to the model’s superior performance over logistic regression (Table 2).
In comparing the top 20, 40, and 60 features identified during feature selection for each outcome, 18, 31, and 45 features overlapped between all three periods, respectively (Supplementary Table S1). For predicting 30-, 90-, and 180-day readmission using the 18 features that overlapped in the top 20, the AUROCs were 0.744 (95% CI: 0.716–0.773), 0.741 (95% CI: 0.717–0.764), and 0.745 (95% CI: 0.723–0.766), respectively. All three were not statistically different (all p > 0.05) or superior to their respective models developed using the top 22, 31, and 33 features. Using the 31 features that overlapped in the top 40 yielded AUROCs ranging from 0.738 to 0.744 (95% CI: 0.709–0.755), while using the 45 features that overlapped in the top 60 yielded AUROCs ranging from 0.734 to 0.742 (95% CI: 0.706–0.763). The coefficients of the top 18 features for each model developed during internal validation are shown in Figure 3A, with previous inpatient psychiatry admissions within the last year, total previous inpatient psychiatry admissions, and length of stay as top features across models.
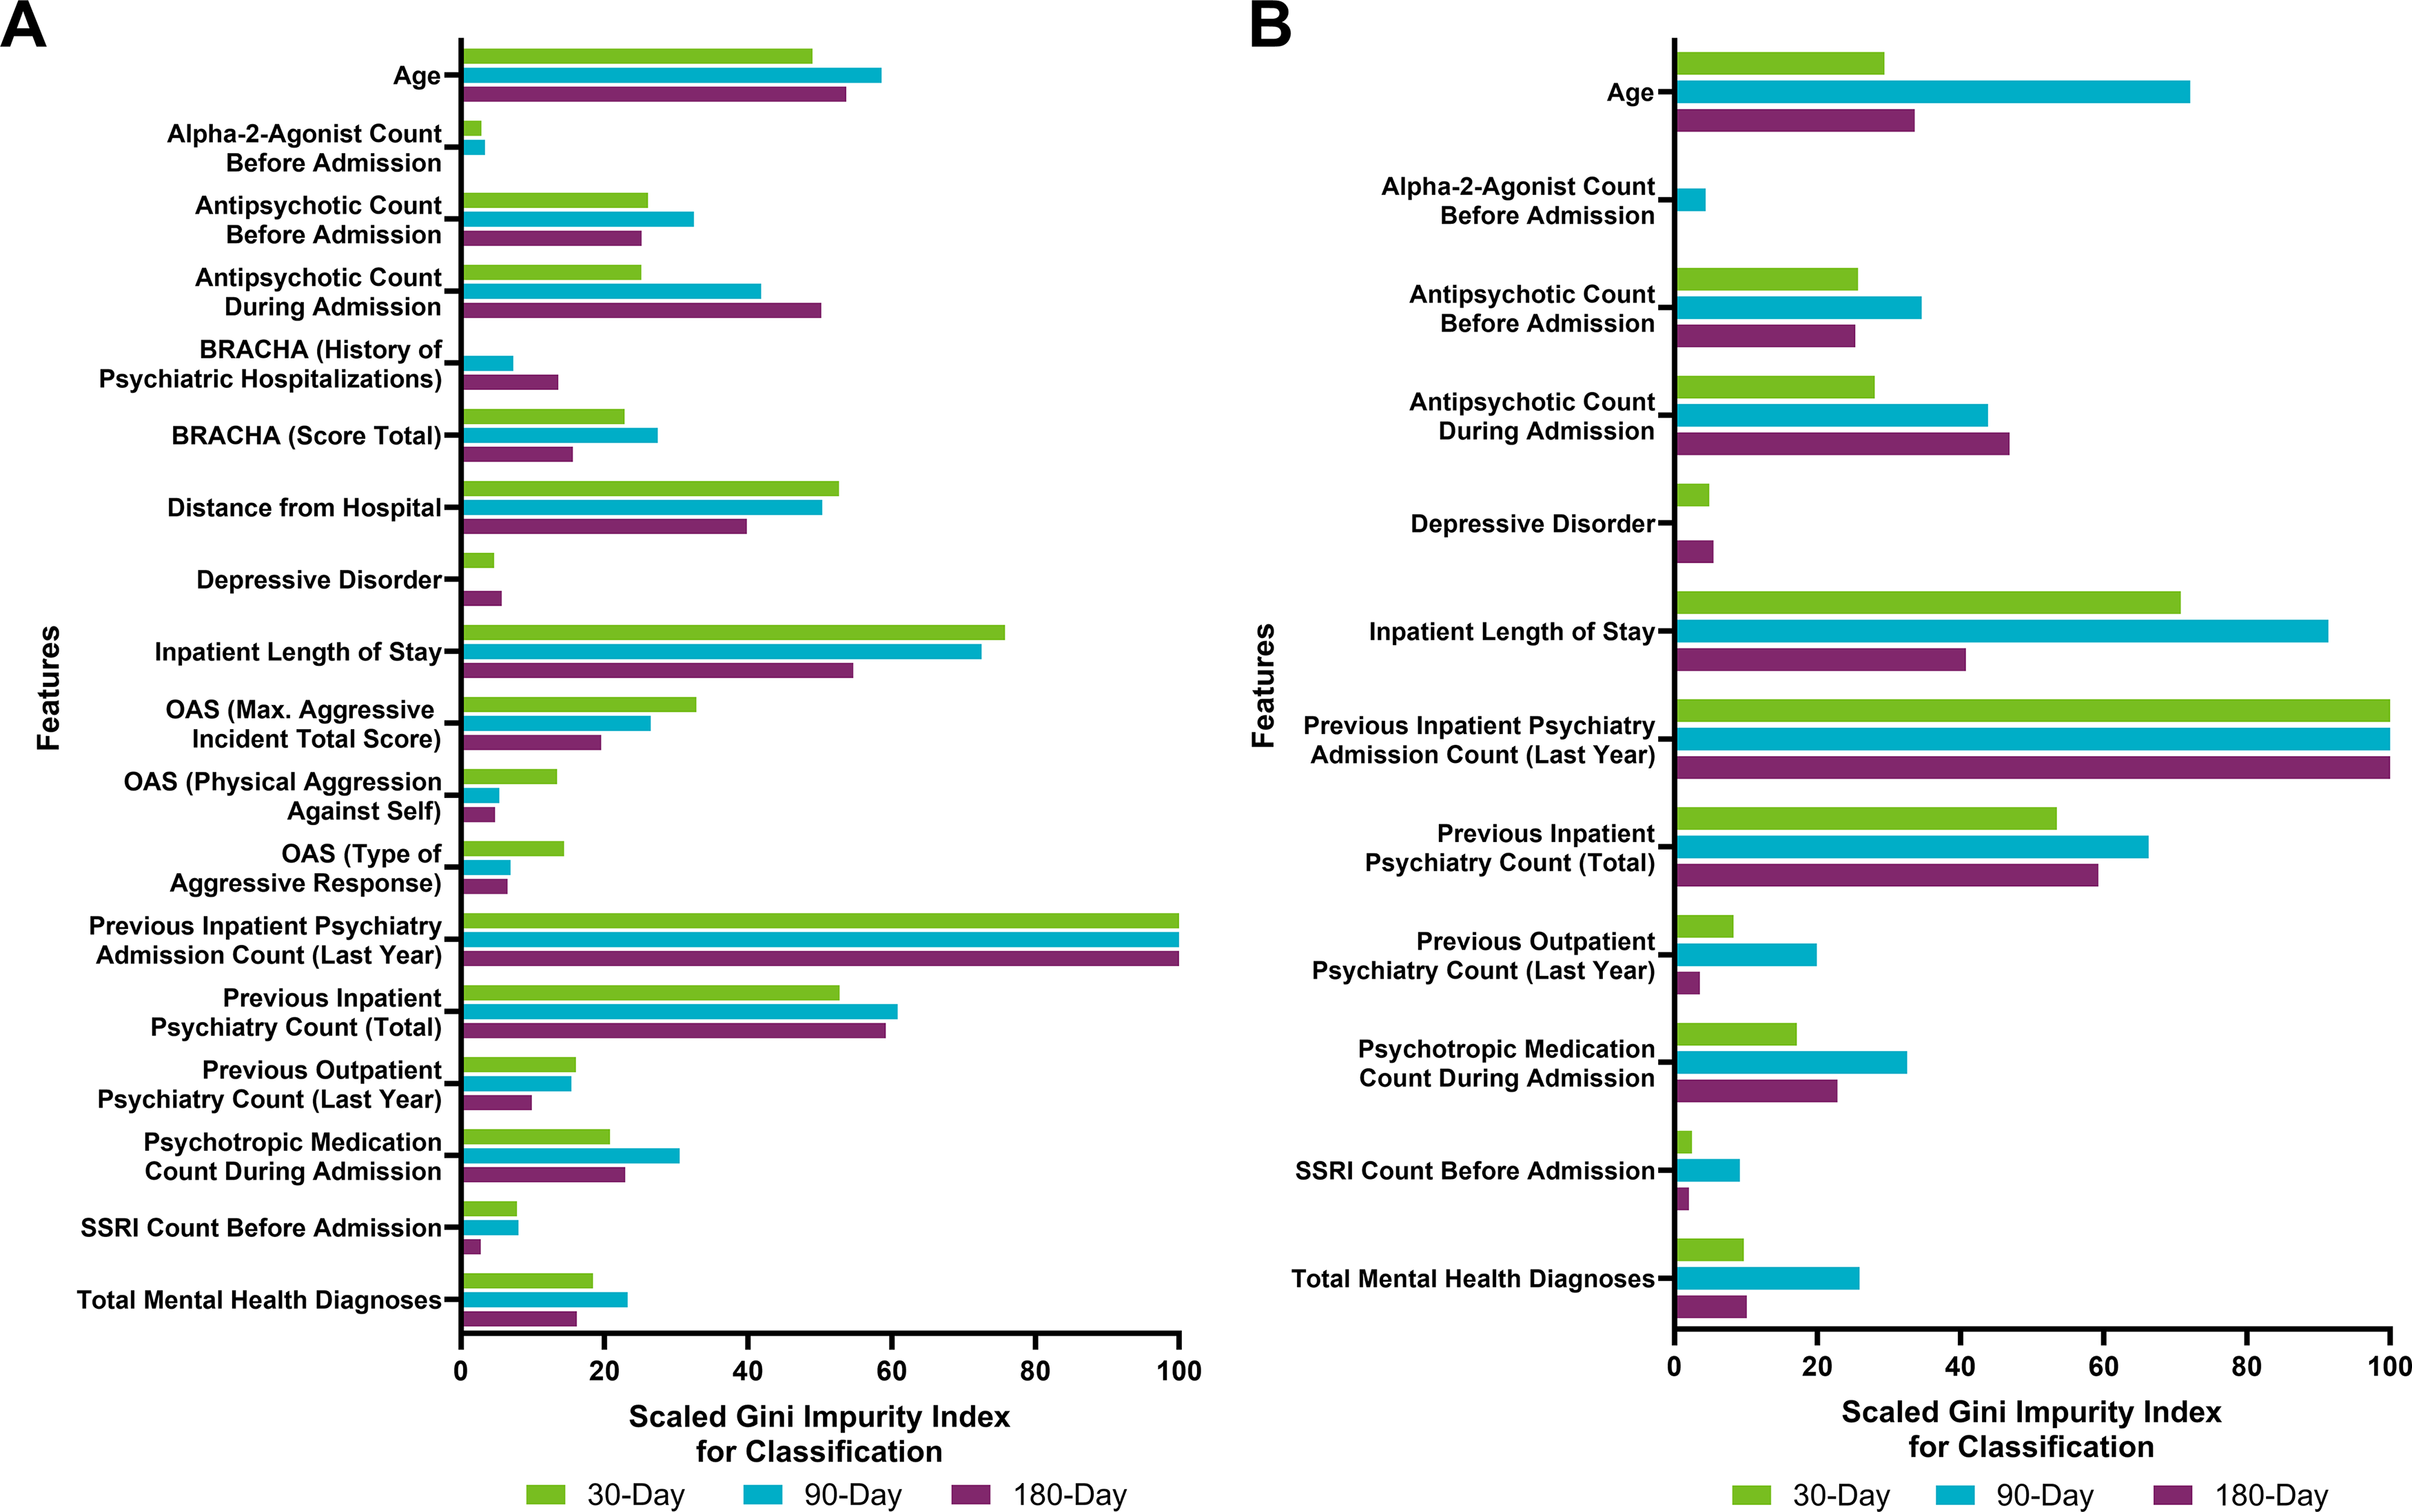
Scaled feature coefficients of the random forest models for
External model validation
Considering the 18 features overlapping across follow-up periods during internal validation, 12 were available at both sites. The models at CCHMC were retrained using these 12 features and then externally validated using data from VUMC (Fig. 3B), which predicted readmission within 30, 90, and 180 days with AUROCs of 0.598 (95% CI: 0.551–0.645), 0.634 (95% CI: 0.596–0.671), and 0.657 (95% CI: 0.624–0.690), respectively. Comparatively, the performance of these models on the CCHMC testing set predicted 30-, 90-, and 180-day readmission with AUROCs of 0.735 (95% CI: 0.706–0.765), 0.737 (95% CI: 0.714–0.761), and 0.743 (95% CI: 0.722–0.765), respectively.
Discussion
In this prognostic study, we developed and validated machine learning models to predict psychiatric readmission within 30, 90, and 180 days from discharge using EHR data from a large pediatric population. Internal model validation yielded good performance for this application across models (AUROCs: 0.739–0.746). The NND also ranged from 2.60 to 2.75, meaning that under three admissions need to be assessed by these models to correctly identify one readmission case. However, external validation performances were modest, with AUROCs equal to 0.598–0.657. The top predictive features were also similar across follow-up periods and aligned with previously identified risk factors of psychiatric readmission in youth (Edgcomb et al., 2020; Madden et al., 2020). These models have the potential to provide individualized readmission risk to identify those in need of tailored intervention strategies at discharge.
This is the first study to predict pediatric psychiatric readmission using machine learning, and our models provided comparable performance to previous adult and all-age psychiatric readmission models (AUROC: 0.63–0.81) (Boag et al., 2021; Cearns et al., 2019; Morel et al., 2020; Palacios-Ariza et al., 2023; Rumshisky et al., 2016; Vigod et al., 2015; Zhu et al., 2022). However, two of these previous models demonstrated superior performance, which could be because they incorporated features derived from clinical notes using natural language processing techniques. For example, Rumshisky et al. (2016) used a latent Dirichlet allocation model to extract topics from inpatient discharge summaries and observed better discrimination of psychiatric readmission risk when training models with topics versus baseline clinical features alone (AUROC: 0.784 vs. 0.618). Similarly, Zhu et al. (2022) included features corresponding to the most informative words from chief complaint narrative notes and predicted 30-, 90-, and 180-day psychiatric readmission with AUROCs of 0.814, 0.798, and 0.740, respectively. This decreasing performance over longer follow-up periods also contrasts with our study, as we observed similar performance across outcomes. It would be prudent for future work to investigate whether free-text narratives (e.g., discharge summaries, progress notes) improve readmission predictions in youth. Nevertheless, one strength of our study is using a time-based cross-validation procedure to evaluate our models, which better reflect real-world predictions as compared to holdout cross-validation utilized by previous studies. Furthermore, as evidenced by the sensitivity analyses, our models were robust to potential biases related to data leakage, data imputation, and temporal variations impacting the incidence of admissions during the COVID-19 pandemic. Finally, although we externally validated our models using features available at both sites, this yielded modest performance across follow-up periods, which may be associated with population heterogeneity or differences in care at each site (Fontanella, 2008; Phillips et al., 2020). This conclusion is supported by similar performance between the 12- and 18-feature models on the CCHMC testing set, suggesting these features are not influencing the decrease in performance in the external validation.
We identified a set of features that were consistent predictors of 30-, 90-, and 180-day readmission. Prior psychiatric hospitalizations, longer inpatient length of stay, younger age, and more psychiatric diagnoses and comorbidities were associated with greater readmission risk, which align with previous psychiatric readmission models (Boag et al., 2021; Cearns et al., 2019; Morel et al., 2020; Palacios-Ariza et al., 2023; Vigod et al., 2015; Zhu et al., 2022). Several variables related to increased aggression were associated with greater readmission risk and may capture differences related to behavioral function and symptom severity (Fontanella et al., 2009; Vigod et al., 2015). Given associations between medication regimen and readmission, additional attention to treatment effects, medication adherence, and polypharmacy may be warranted, especially in youth prescribed antipsychotics (Cearns et al., 2019; Fontanella et al., 2009; Grudnikoff et al., 2019; Saldaña et al., 2014; Sanchez et al., 2021; Strawn et al., 2025). It is important to emphasize, however, that the association of antipsychotic medication prescriptions with readmission is likely a proxy for illness severity and complexity and is not a direct cause of readmission. Furthermore, having a depressive disorder diagnosis was associated with reduced odds of readmission across follow-up periods, consistent with previous adult studies (Morel et al., 2020; Vigod et al., 2015), although this was not significantly associated in a meta-analysis for psychiatric readmission in children and adolescents (Edgcomb et al., 2020). Other studies also identified that shorter length of stay is associated with greater readmission risk (Morel et al., 2020; Vigod et al., 2015; Zhu et al., 2022), which contrasts with our study and Edgcomb et al. (2020), who observed longer length of stay is associated with readmission. This could reflect differences in care between adults and children and adolescents, as well as the possibility that longer stays in youths corresponds to increased resource utilization and intervention for severely ill patients.
These findings have important clinical implications and may identify youth who could benefit from targeted postdischarge interventions. Those who are more ill (e.g., have had multiple prior hospitalizations, longer hospitalization, and taking antipsychotic medication) are more likely to be readmitted. Yet, postdischarge planning rarely stratifies patients based on the risk of readmission. This suggests a need to move beyond one-size-fits-all approaches to discharge planning and raises the possibility that tailored strategies could be developed. Operationally, a predictive model could be integrated into EHR systems to calculate risk scores at or near discharge. This would enable identification of higher-risk patients who may require more resources or services versus lower-risk patients who could follow standard discharge protocols. For example, patients at an elevated risk may benefit from enhanced case management, postdischarge care conferences, or step-down interventions like intensive outpatient programs (Rubenson et al., 2024). Additionally, school-based support, such as individualized education programs or 504 plans, may help to mitigate the impact of academic stressors on psychiatric symptom worsening and subsequent hospitalizations in youth at high risk for readmission (Weiss et al., 2015). Family-based interventions, particularly for patients with high familial conflict and dysregulation, could be used for secondary prevention (Walkup et al., 2021). These results also raise the possibility that improved capture of diagnostic features (e.g., heterotypic comorbidity and presence of mixed features), which predict longitudinal course, may enhance risk stratification and inform interventions that reduce rehospitalization (Leppanen et al., 2025; Lohr et al., 2023). By identifying which youth are most vulnerable to readmission, these models may ultimately enable clinicians to personalize follow-up care, improve outcomes, and allocate limited outpatient resources more effectively.
The probability threshold for our models was selected by minimizing the NND, or maximizing the Youden index, a common approach to optimizing the sensitivity and specificity of predictive models. While further work is needed to identify an appropriate threshold that considers the cost-effectiveness for this application, it may be beneficial to prioritize higher sensitivities to correctly identify positive cases in the future. Although this approach would reduce specificity and increase false positives, it may be acceptable for prognostic interventions in this context. Importantly, our models also have high NPVs (0.827–0.933), demonstrating their ability to predict non-readmission cases. This could be useful for improving resource allocation, including identifying patients who are at low risk of readmission to ensure resources are directed toward patients who are at high risk. Additionally, with longer follow-up periods, we observed a wider, stabler range of NND and NNS values across thresholds. This flexibility would allow for selecting a threshold that optimizes clinical benefit (i.e., reducing the threshold to improve sensitivity with minimal impact on NND or NNS).
Our study focused on patients with anxiety or depressive disorders—the most common primary psychiatric diagnoses associated with psychiatric hospitalization in youth (Arakelyan et al., 2023; Bardach et al., 2014; Bitsko et al., 2022). However, these diagnoses were not required to be the primary reason for psychiatric hospitalization or to be documented at the time of an index admission. This decision was made because psychiatric diagnoses and diagnostic coding vary and evolve across encounters and providers, and restricting to admissions with only these diagnoses may exclude clinically relevant patients. In fact, our cohort included individuals with other psychiatric comorbidities that were assessed as prospective features in our models (e.g., trauma/stress disorder, eating disorder). Therefore, the model may be broadly applicable to predicting psychiatric readmission rather than specific to admissions for anxiety or depression, although the cohort it was developed in was enriched for patients with anxiety and depression.
There are several limitations that require discussion. First, we were unable to account for patient data or changes in care, including psychiatric treatment, that occurred outside of the academic medical centers (e.g., community-based psychotherapy). Additionally, selection bias may exist if certain patients are more likely to be lost to follow-up (Gianfrancesco et al., 2018). Second, missing CYP phenotypes were imputed as normal metabolizers and may not reflect their natural distribution, yet these features were not included in the final model. Using random forest as the RFE algorithm may also lead to favoring features that are informative to tree-based algorithms (e.g., random forest and XGBoost) over other algorithms during model development. Furthermore, an ensemble model was not explored as individual models provided similar performance (AUROC: 0.69–0.75), and predictions were highly correlated, suggesting the available feature space may be limiting improvements in performance more than the type of algorithm. Additionally, this study solely utilized structured EHR data and did not incorporate features derived from clinical narratives, which may have limited model discrimination compared to previous studies and models leveraging these data and natural language processing techniques (Rumshisky et al., 2016; Zhu et al., 2022). Future research may consider these other features and ensemble approaches to determine how they affect predictions. Third, machine learning models can learn biases from the data on which they are trained and could perpetuate inequalities in healthcare (Gianfrancesco et al., 2018). Our patient population was predominantly white and non-Hispanic, which may limit the generalizability of our findings to more diverse populations. We also did not evaluate whether there are differences in predictions across sociodemographic subgroups. Future analyses should assess for bias in these predictions while recognizing that sociodemographic variables have been associated with differences in readmission risk in youth, although these findings are inconsistent (Carroll et al., 2022; Edgcomb et al., 2020; Madden et al., 2020). Finally, the prevalence of readmission at CCHMC was higher than previously reported rates in youth and across all follow-up periods compared to VUMC, although this varies among hospitals (Feng et al., 2017; Fontanella, 2008; Leon et al., 2006). One reason for this could be that CCHMC is among the largest child and adolescent inpatient psychiatric hospitals nationally and has greater bed capacity compared to other psychiatric hospitals for children and adolescents. Further validation across multiple institutions will be needed to ensure the generalizability of these findings.
This study is the first to develop and externally validate machine learning models to predict psychiatric readmission within 30, 90, and 180 days following discharge in children and adolescents. A subset of features provided comparable performance across follow-up periods. These models will be foundational in identifying youth at risk of psychiatric rehospitalization, which can improve institutional resource allocation and mental health treatment outcomes for children and adolescents.
Supplemental Material
sj-docx-1-cha-10.1177_10445463261466534 — Supplemental material for Predicting Psychiatric Readmission of Children and Adolescents Using Machine Learning
Supplemental material, sj-docx-1-cha-10.1177_10445463261466534 for Predicting Psychiatric Readmission of Children and Adolescents Using Machine Learning by Ethan A. Poweleit, Jeffrey R. Strawn, Rhonda D. Szczesniak, Wei-Qi Wei, Tracy A. Glauser, Laura B. Ramsey, and Judith W. Dexheimer
Footnotes
Acknowledgments
The authors thank Dr. Samuel Vaughn and Dr. Cheryl Cobb for their expertise regarding inpatient psychiatric care at CCHMC and VUMC, respectively. They also thank Mr. Parth Divekar, Mr. Christopher Guardo, and Dr. Henry Ong for assisting with EHR data extraction. Portions of this article were previously published as part of a PhD dissertation and can be found at:  .
.
Author Disclosure Statement
L.B.R. has received research support from BTG International. J.R.S. has received research support from AbbVie, the National Institutes of Health, PCORI, the Yung Family Foundation, and receives material support from Myriad. He receives royalties from UpToDate and Cambridge and has consulted with Cerevel, Otsuka, and Intracellular Therapeutics. All other authors declared no competing interests for this work.
References
Supplementary Material
Please find the following supplemental material available below.
For Open Access articles published under a Creative Commons License, all supplemental material carries the same license as the article it is associated with.
For non-Open Access articles published, all supplemental material carries a non-exclusive license, and permission requests for re-use of supplemental material or any part of supplemental material shall be sent directly to the copyright owner as specified in the copyright notice associated with the article.
