
Abstract
In this study, an output-only method for extraction of modal macrostrain and damage identification of bridges under ambient excitation is presented. It is theoretically proved that the modal macrostrain within the gauge length of a long-gauge macrostrain sensor is uniquely determined by the peak value of the power spectral density (PSD) of dynamic macrostrain response. Then damage occurred within the gauge length of a sensor can be identified by the ratio change between the peak value of PSD of this sensor response and that of the reference sensor response. The damage extent has also been verified to have corresponding relationship with the ratio change. Numerical simulation was carried out to confirm the feasibility of the proposed method. Analysis results of the numerical simulation reveal that the maximum error of the identified modal macrostrain relative to that of the modal analysis is 3%. Results of simulation show that the proposed PSD-based method can not only accurately localize the damage but also assess the damage extent. The influence of several typical excitations on real bridges was also investigated that further proves the robustness of the method. It is worth mentioning that only the first-order mode is necessary for the method to identify damage. Finally, the proposed method is employed for condition assessment of a real bridge located in New Jersey, wherein 17 long-gauge macrostrain sensors with the gauge length of 1 m were distributedly arranged along the critical region of the girder. Analysis results of the field measurements further verify that the PSD-based method can be utilized to assess the damage state of structures under ambient excitation.
Keywords
Introduction
Generally, large-scale civil engineering structures such as bridges, tunnels, pipeline systems, and buildings are vital for most countries. These lifeline engineering structures concern both people’s safety and economic benefits. The designed life expectancy of these structures is several decades or even centuries, and they inevitably deteriorate after being subjected to normal continuous loading, occasional excessive loading, and extreme natural disaster during their service life. It is necessary to acquire accurate and real-time information about the damage state of the structures in order to efficiently manage, evaluate, and sustain the performance and reliability of a large number of such infrastructures. For this purpose, structural health monitoring (SHM) technique for civil engineering has attracted growing attention and developed at a rapid speed. SHM-based condition assessment technique can not only detect and localize damage at the early stage but also evaluate damage extent so that the owners can make use of such information to optimize maintenance and retrofitting program at lowest cost (Catbas and Aktan, 2002).
Vibration-based damage identification (VBDI) techniques have developed rapidly during the past several decades because of rise in societal and economic demands for periodic assessment of structural safety and their performance against their long-term degradation. The essence of VBDI is that any deterioration in the structural properties results in changes of the modal parameters such as natural frequencies, mode shapes, and modal damping ratios. Based upon these changes, a number of damage identification techniques have been successfully investigated, for example, modal flexibility, modal stiffness, modal strain energy, frequency response function (FRF), and its curvature. Extensive literature reviews on VBDI have been reported by Doebling et al. (1996), Sohn et al. (2003), and Carden and Fanning (2004).
Although a number of such damage strategies have been explored to make the best of dynamic measurements, most of which are obtained by traditional sensors such as accelerometers, velocimeters, or displacement transducers, some challenges still confront practicality of VBDI techniques. For one thing, damage locating is usually implemented by employing model-free methods that do not require a detailed finite element (FE) model and can work by directly utilizing features extracted from recorded data. However, frequency holding high measuring precision is too ‘global’ to locate local damage (Fox, 1992; Osegueda et al., 1992; Salawu, 1997), whereas mode shape and its derivatives such as modal curvature and modal flexibility, which are theoretically sensitive to damage, are susceptible to measurement noise making them practically unreliable for civil SHM when displacement or acceleration data are used (Adewuyi et al., 2009). For another, strain as a local measurement has been verified to be more sensitive to damage. However, traditional foil strain gauges cannot reflect the influence of damage effectively unless covering the damage region. As a result, the traditional ‘point’ sensors are not quite suitable for the large-scale infrastructures, and it is necessary to develop some new types of distributed and long-gauge strain sensors.
Under this background, Wu et al. (2005) and Li and Wu (2007) have dedicated special effort toward developing a feasible implementation of distributed long-gauge fiber Bragg grating (FBG) sensing techniques to utilize the strain distributions throughout the full or critical regions of structures to detect the arbitrary and unforeseen damage. These techniques propose a promising novel alternative due to the high sensitivity to local damage and the potential to catch integrated structural information by utilizing ‘distributed’ sensor placement and dynamic measuring capability.
In SHM of real large-scale bridges, it is often very difficult to apply dynamic excitation often used in the laboratory. The real bridges under operational conditions are only excited by random excitation from unregulated traffic, wind, flowing water, earthquakes, and ground-transmitted vibrations. So an output-only (distributed dynamic macrostrain) method for damage identification is critical for effective application of distributed long-gauge macrostrain-sensing techniques. Many researchers have focused their researches on output-only method under ambient vibration. The methods can be totally categorized into two methods: frequency domain method (Brincker et al., 2000; De Roeck et al., 2000) and time domain method (Akaile, 1969; James, 1994; Peeters et al., 1995).
On the basis of preceding efforts on the development and application of distributed long-gauge macrostrain-sensing techniques, this study puts forward an output-only method for extraction of modal macrostrain and damage identification of structures under ambient excitation using distributed dynamic long-gauge macrostrain response. The basic idea is to extract the power spectral densities (PSDs) of dynamic random macrostrain measured by distributed long-gauge macrostrain sensors. The ratio between the peak value of PSD of the target sensor response and that of the reference sensor remains around a constant if no damage occurs within the gauge length of the target sensor. However, when damage occurs within the gauge length, the ratio will obviously change. After explaining the principle of output-only method for damage identification, numerical simulation was carried out to verify their ability to identify damage of structures under ambient excitation. Meanwhile, the influence of typical excitations on real bridges was also investigated to prove the robustness of the method. Finally, a field testing is implemented for condition assessment of a real steel stringer bridge in New Jersey excited by operational and environmental loading using PSD-based method.
PSD-Based Damage Identification Technique Using Distributed Long-Gauge Dynamic Macrostrain Under Ambient Excitation
Output-Only Method for Extraction of Modal Macrostrain
From the modal macrostrain derivation (Wu and Li, 2007), the combination of macrostrain magnitude FRFs from distributed long-gauge macrostrain sensors can construct a vector called modal macrostrain vector. But in monitoring real structures, the excitation is often unknown, and therefore, macrostrain FRF defined by the ratio of output macrostrain signals and input signals is unknown.

in which the superscript
Taking into account the relationship between FRF and PSD (Ewins, 2000; Maia and Silva, 1997), the PSD of dynamic macrostrain from mth long-gauge sensor can be given as

where Sp(ω) represents PSD of excitation at the pth point.
For a given mode, Equation (2) can be expressed as
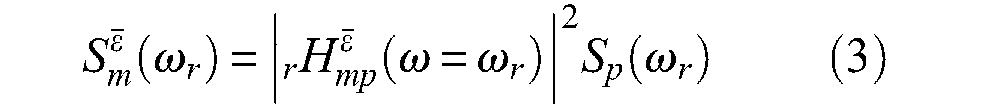
Substituting Equation (1) into Equation (3) can lead to

in which δ mr is modal macrostrain within the gauge length of mth sensor, and the macrostrain modal constant Apr can be written as

where
Assembling each PSD of dynamic macrostrain response from every long-gauge macrostrain sensor, the modal macrostrain can be normalized with respect to the reference sensor (mth sensor is supposed) and can be achieved by
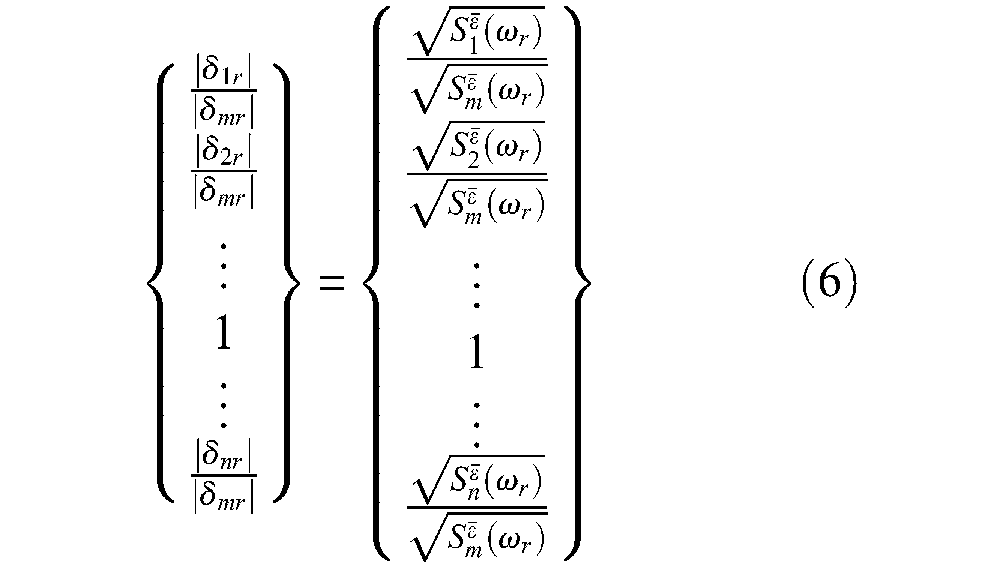
Equation (6) indicates that the modal macrostrain is uniquely determined by PSDs of dynamic macrostrain response from all long-gauge sensors. That is, the natural frequencies and the modal macrostrain can be identified from the values at the peaks of the PSDs of dynamic macrostrain.
Output-Only Method for Damage Localization
Equation (6) shows that PSD of dynamic macrostrain response from one certain long-gauge sensor has a direct relation to the modal macrostrain from the same sensor. Considering that modal macrostrain is a natural feature of the structure, PSD-based method can be applied for damage identification of the structure under ambient excitation. For analysis convenience, one reference sensor is chosen. In undamaged cases, the ratio of PSD at ω i of dynamic macrostrain from target sensor to that of the reference remains around a constant. If some damage occurs within the area the target sensor covers, the ratio will obviously change. Although only one sample data are needed to calculate the ratio of target sensor PSD at ω i to that of the reference sensor, it is better that the ratio can be calculated by fitting several data in the test to improve the accuracy and stability of the method in practical monitoring. If the ratio is calculated, the modal macrostrain within the gauge length of target sensor normalized by the reference sensor can therefore be obtained from Equation (6).
It is reasonable to select any sensor near the support as the reference sensor, because the chance of occurrence of damage is very small. However, if the gauge length of the reference sensor is too long, the probability of occurrence of damage is relative big. The damage identification method discussed earlier is independent of the gauge length of the reference sensor. So it is advisable to select a reference sensor with the short gauge length.
If no damage occurs within the reference sensor, the ratios (mentioned earlier) of target sensors covering the damaged zones to the reference sensor will obviously increase. If the ratios of most of the target sensors to the reference sensor obviously decrease, it can be judged that damage has occurred within the reference sensor. So the reference sensor should be changed.
Output-Only Method for Damage Quantification
Stubbs et al. (1995) presented a damage index method based on modal strain energy to quantify damage in structures using the mode shape. However, it is difficult to apply this method to real structures because it is difficult to normalize mode shape by mass normalization. In this section, output-only method based on distributed long-gauge macrostrain-sensing technique is discussed. To investigate the quantitative relation between the structural damage extent and modal strain energy, a series of case studies on beam structures were performed. The modal strain energy of the mth element of a beam can be defined as follows
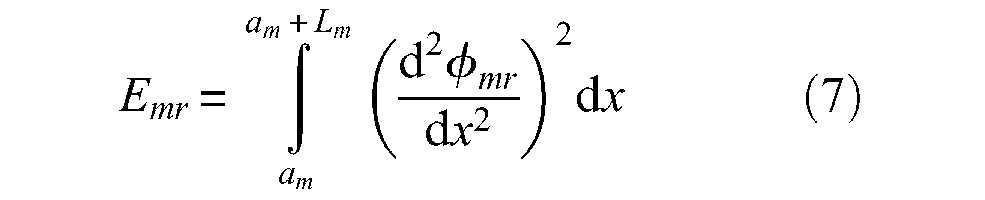
where am is the start point of spatial coordinate of the mth element of length Lm, and φ mr is the displacement mode shape for the rth mode at mth element.
For long-gauge macrostrain sensor, every point within the gauge length shares the identical strain and hence the identical modal macrostrain. Therefore, the curvature mode shape can be given as

where hm is the distance from inertial axis to sensor location of mth element, and δ mr is the modal macrostrain within the gauge length of mth element.
The relative change of modal strain energy for the first mode before and after damage occurs can be obtained with a reasonable assumption that the average inertial axis height within the gauge length basically remains the same:
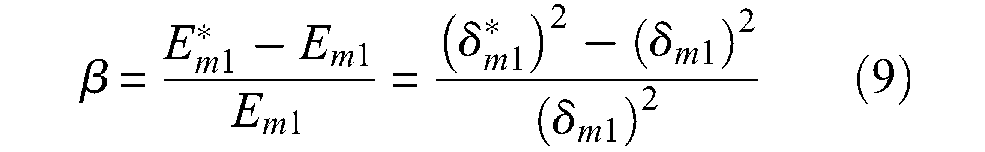
The relation between the relative change of modal strain energy and damage extent can be built by the following discussion. It is worth mentioning that the modal macrostrain is only necessary to be normalized by the reference sensor without the necessity of mass normalization.
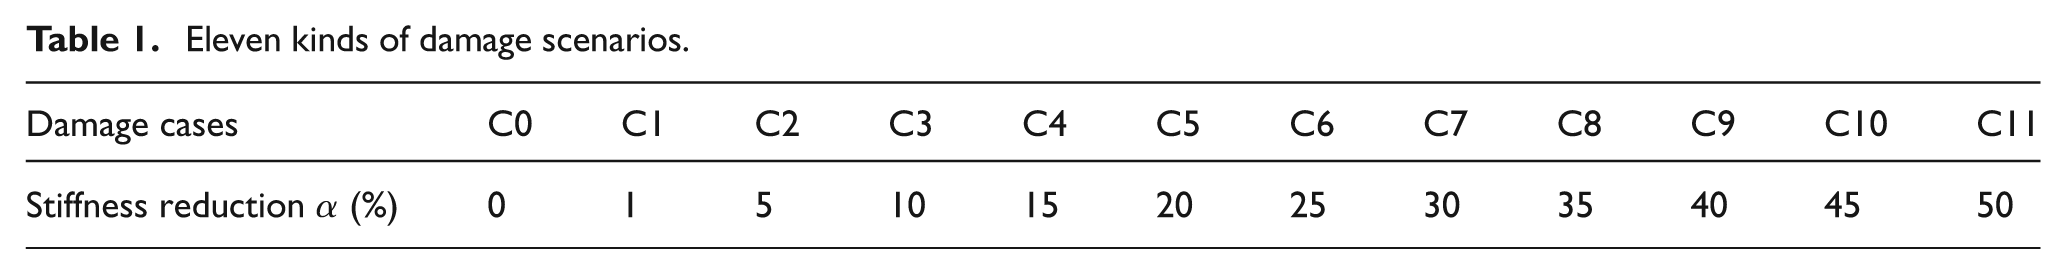
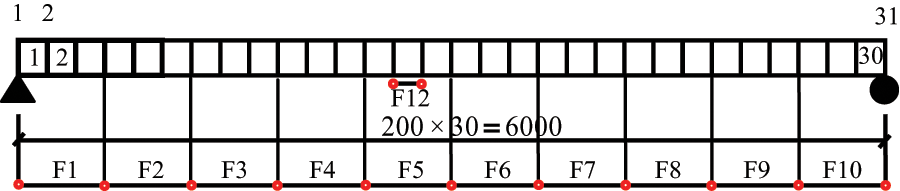
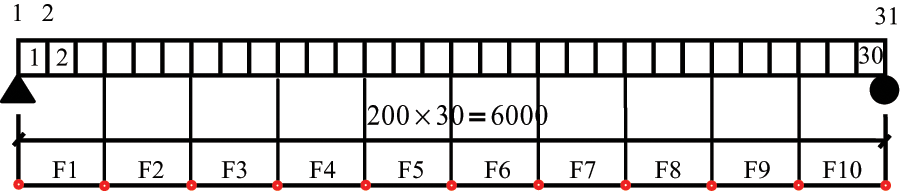
A simply supported concrete beam with 6 m length, 300 mm width, and 360 mm height was designed for simulation. The beam is an Euler–Bernoulli type with two local degrees of freedom (one for vertical translation and the other for rotation) at each node. Its FE model (shown in Figure 1) includes 30 elements and 60 DOFs. Suppose the beam is installed with 10 long-gauge macrostrain sensors (F1–F10) with the gauge length of 600 mm, each for the macrostrain measurements of three elements. Values for the material properties of the beam were assigned as follows: the elastic modulus E = 3.45 × 10¹⁰ N/m2 and the linear mass density ρ = 2.5 × 10³ kg/m3. The intact structure is designated C0, and 11 damage states namely C1–C11 with varying degree of severity at elements 13–15. The detailed damage information is listed in Table 1.
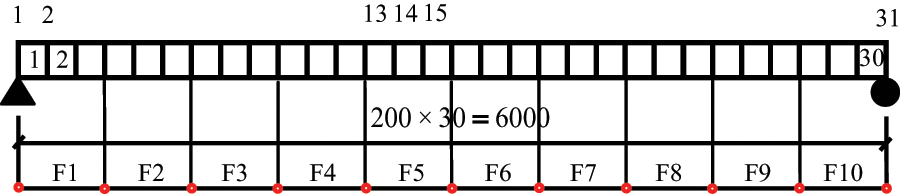
Beam model and sensor placement.
Eleven kinds of damage scenarios.
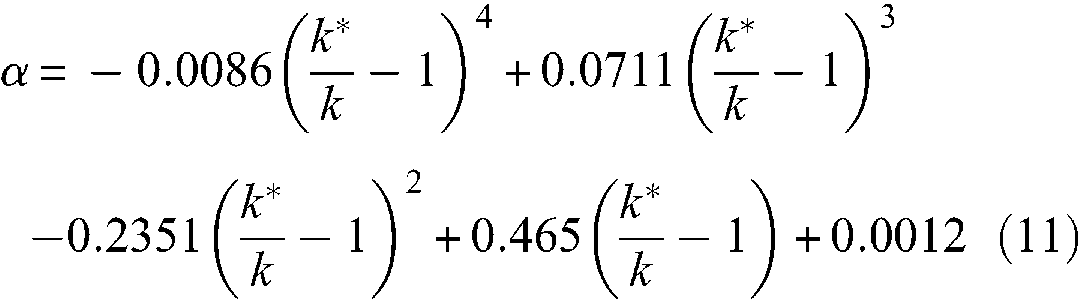
Modal analysis of all damage cases was conducted to calculate the relative change of modal strain energy defined in Equation (9). Sensor F2 is selected as the reference. So the relation of damage extent α versus the relative change of modal energy β can be plotted. It can be seen in Figure 2 that a perfect curve was constructed. Via polynomial fit, the fitting line can be expressed as
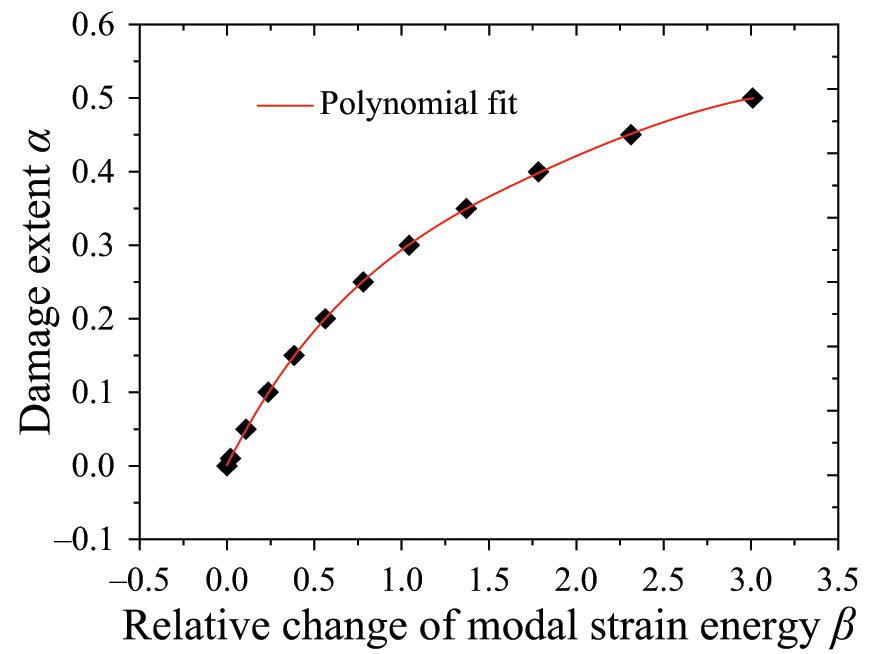
Damage extent versus relative change of modal strain energy β.

In order to verify Equation (10) to be of universal significance, many factors are also considered: (1) the influence of selecting reference sensor; (2) the influence of the gauge length of reference sensor; (3) the influence of the gauge length of target sensor; and (4) the influence of occurrence of multiple damages. Several cases are designed to verify this tentative idea: Case 1: sensor F5 is selected as target sensor and F2 for the reference (shown in Figure 1); Case 2: sensor F5 is selected as target sensor and F3 for the reference (shown in Figure 1); Case 3: sensor F5 is selected as target sensor and F11 for the reference (shown in Figure 3); Case 4: sensor F12 is selected as target sensor and F2 for the reference (shown in Figure 4); Case 5: sensor F5 is selected as target sensor and F2 for the reference (shown in Figure 5); Case 6: sensor F7 is selected as target sensor and F2 for the reference (shown in Figure 5).
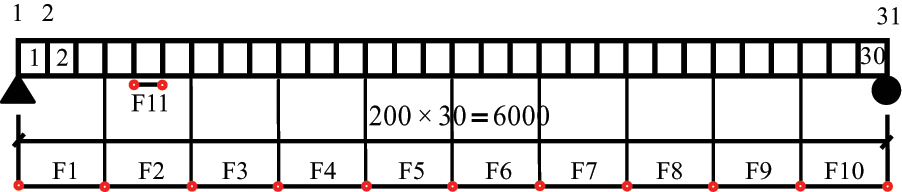
The case considering the influence of the gauge length of the reference sensor.
The case considering the influence of the gauge length of target sensor.
The case considering the influence of multiple damages.
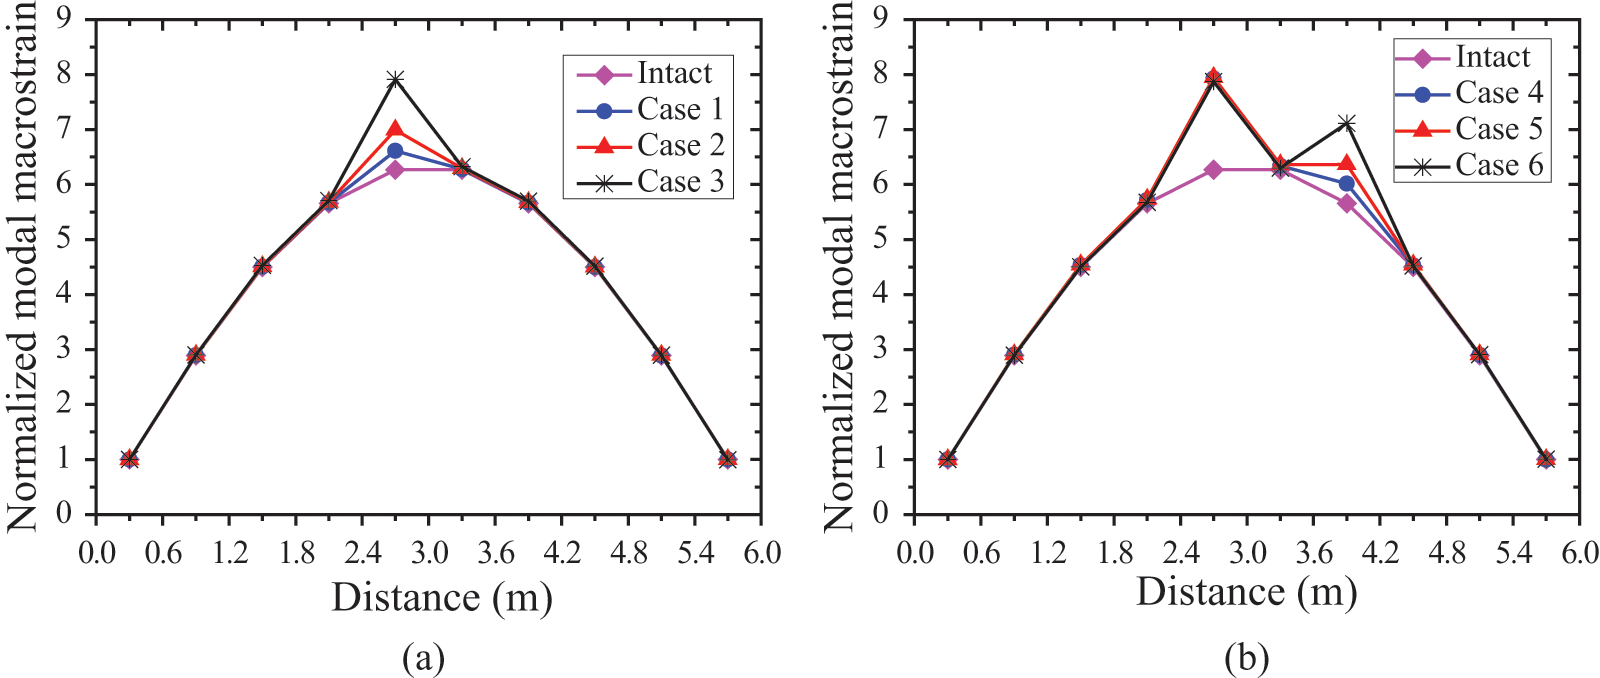
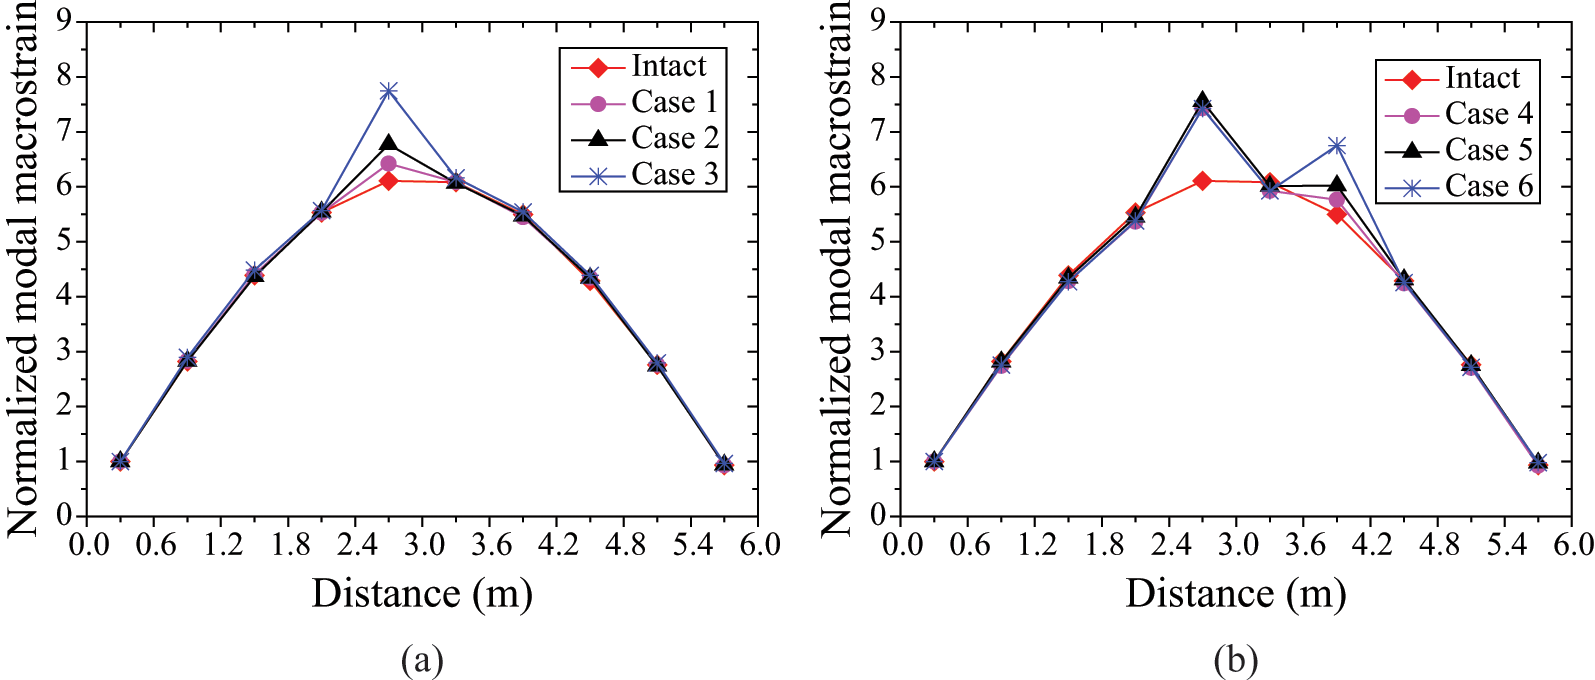
Modal analysis results of the six cases depicted in Figure 6 show that Equation (10) is of universal significance. The average damage extent within the gauge length can be calculated using the reference-normalized modal macrostrain. It should be noted that the average damage extent within the gauge length of a target sensor is only dependent on the target sensor and a reference sensor.
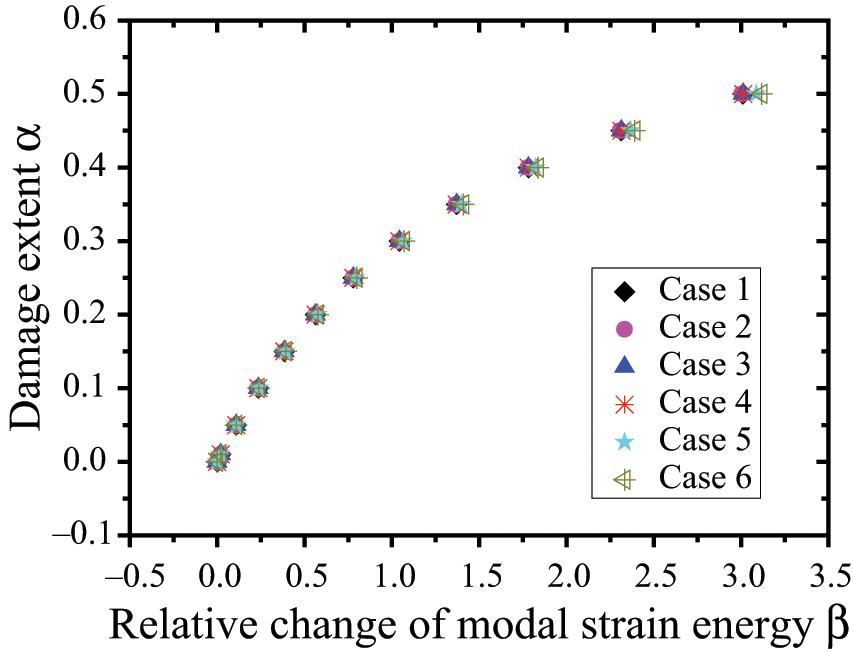
Damage extent versus relative change of modal strain energy β for different cases.
Considering Equation (6), damage quantification under ambient excitation can be further expressed as
where k* is the ratio of PSD at ω1 of dynamic macrostrain from target sensor to that of the reference sensor for the damage case while k is for the intact case.
All damage cases discussed earlier are only concentrated on damage of uniform distribution within the gauge length. Considering damage is a local phenomenon but a long-gauge sensor definitely covers a certain length along a structure, in many cases, damage is sure to appear somewhere inside the sensor gauge length. Suppose one long-gauge macrostrain sensor with the gauge length L is attached on the beam element (Figure 7) and damage occurs in the region of L2.
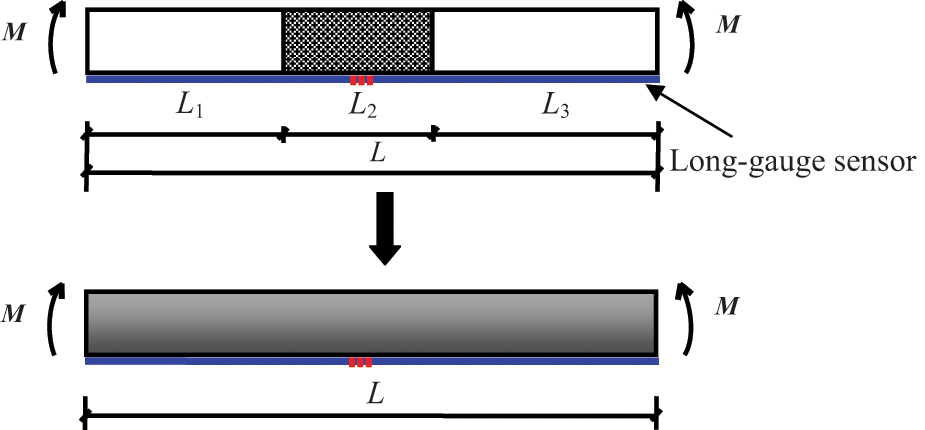
Average stiffness corresponding to the gauge length.
The average stiffness corresponding to the gauge length using strain equivalent method can be expressed as follows:
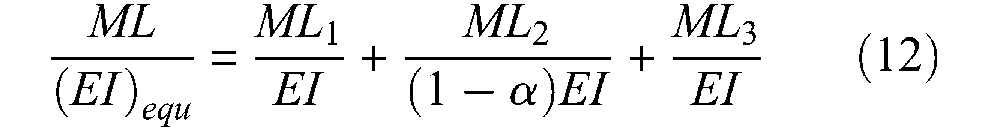
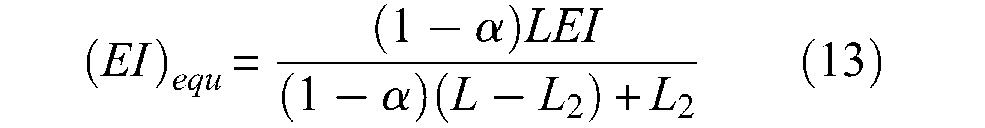
where EI is the flexural stiffness of the intact beam, α is the stiffness reduction coefficient due to the damage, M is the bending moment, and (EI)equ represents the equivalent flexural stiffness within the gauge length.
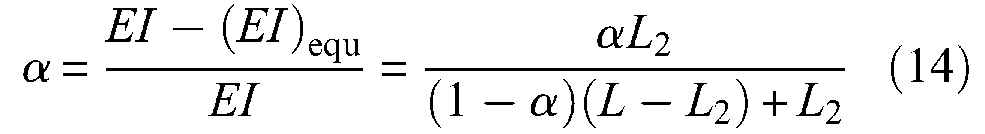
So the average damage extent corresponding to the gauge length can be theoretically calculated by
Numerical Simulation
In order to study the effectiveness of the presented method for extraction of modal macrostrain and damage identification of structures under ambient excitation, the same simply supported concrete beam as shown earlier was designed for simulation. The beam is an Euler–Bernoulli type with two local degrees of freedom (one for vertical translation and the other for rotation) at each node. Suppose the beam is installed with 10 long-gauge macrostrain sensors (F1–F10) with the gauge length of 600 mm (shown in Figure 8), each for the macrostrain measurements of three elements. Applying a random force, a linear dynamic analysis was performed and the signals at each nodal point were measured.

Simply supported beam for simulation.
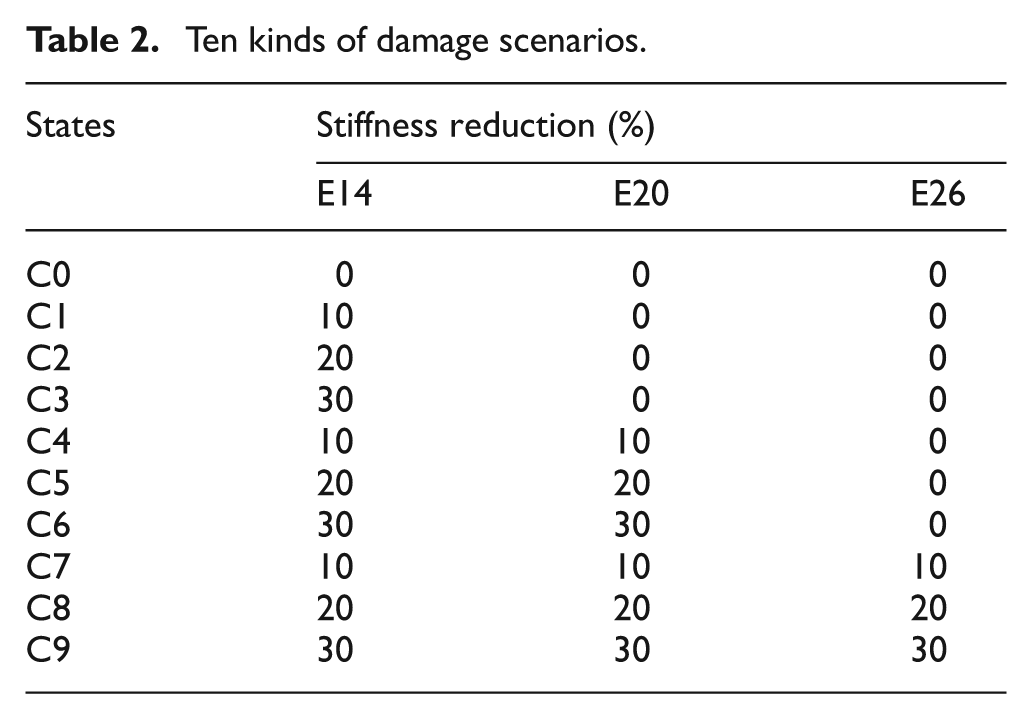
In order to evaluate the sensitivity of PSD-based method, the analytical beams (shown in Figure 9) are employed for different scenarios. The intact structure is designated C0, and nine damage states namely C1–C9 with varying degrees of severity at each damaged location. C1, C2, and C3 are single damage cases with 10%, 20%, and 30% stiffness reduction, respectively, at element 14. C4, C5, and C6 are double damage cases with 10%, 20%, and 30% stiffness reduction, respectively, at elements 14 and 20. C7, C8, and C9 are multiple damage cases with 10%, 20%, and 30% stiffness reduction at elements 14, 20, and 26, respectively. The detailed damage information is listed in Table 2.
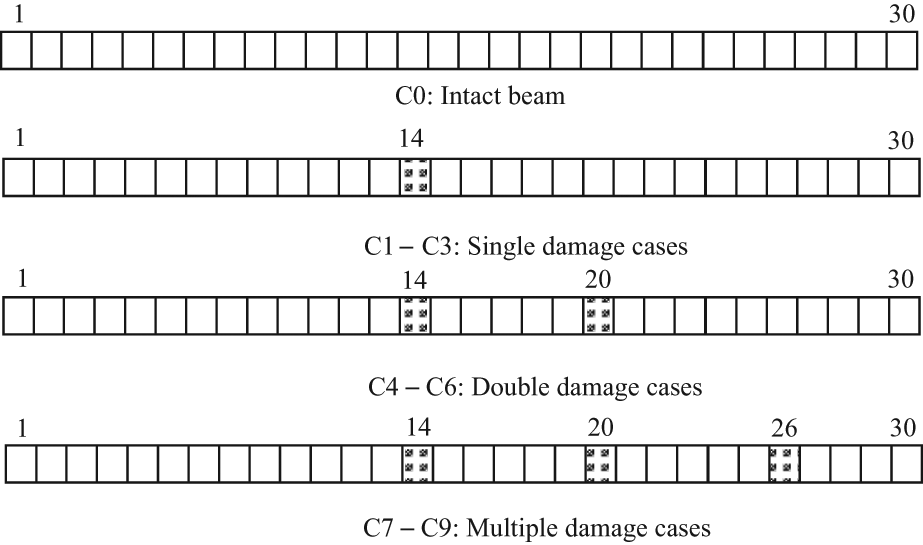
Different damage types for the simply supported beam.
Ten kinds of damage scenarios.
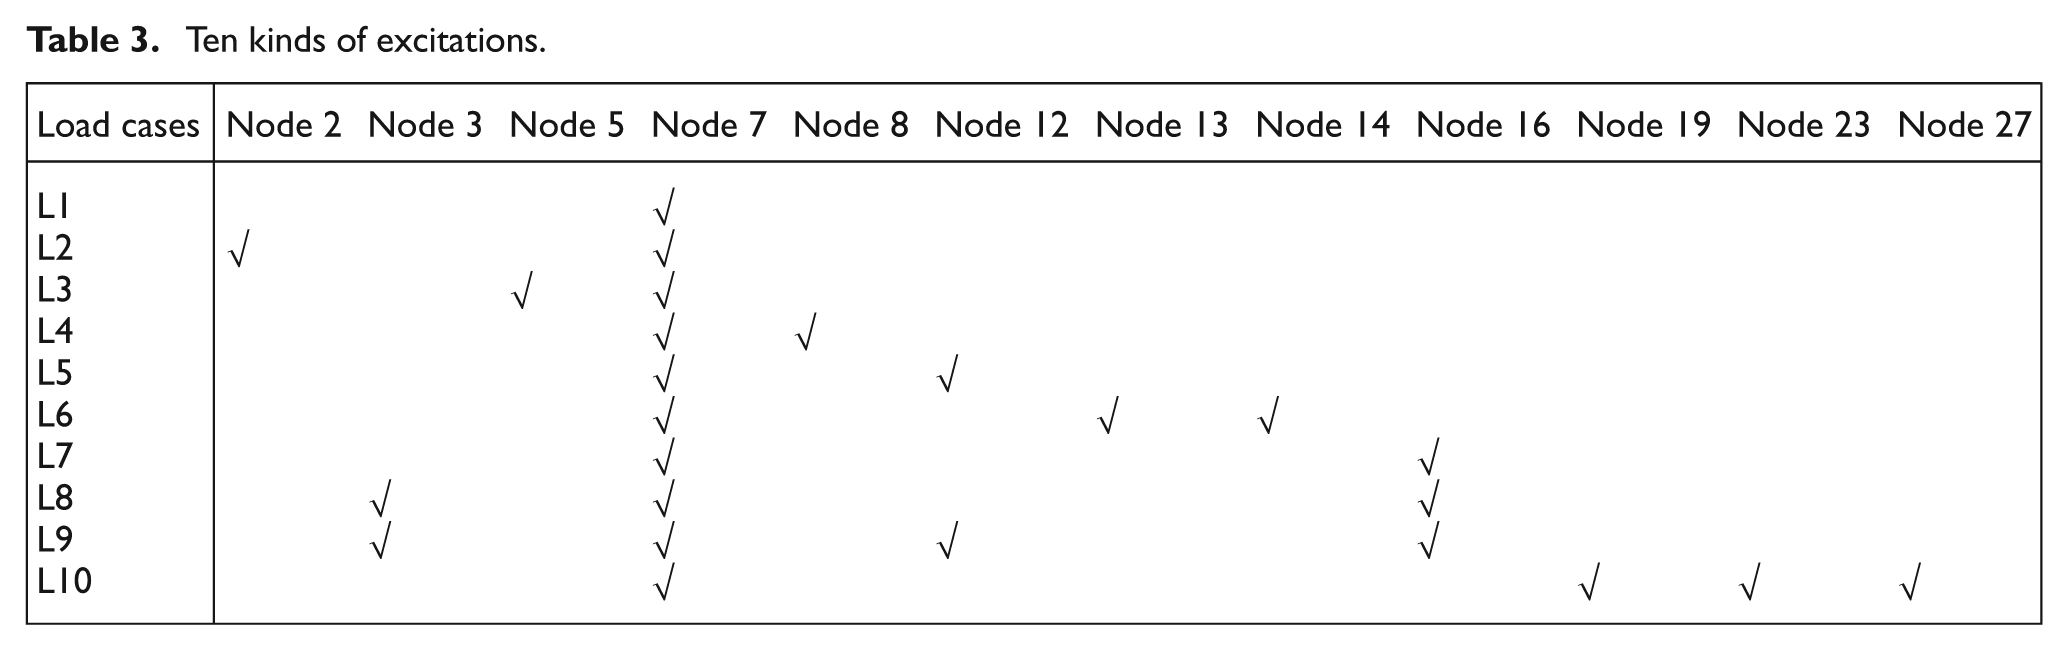
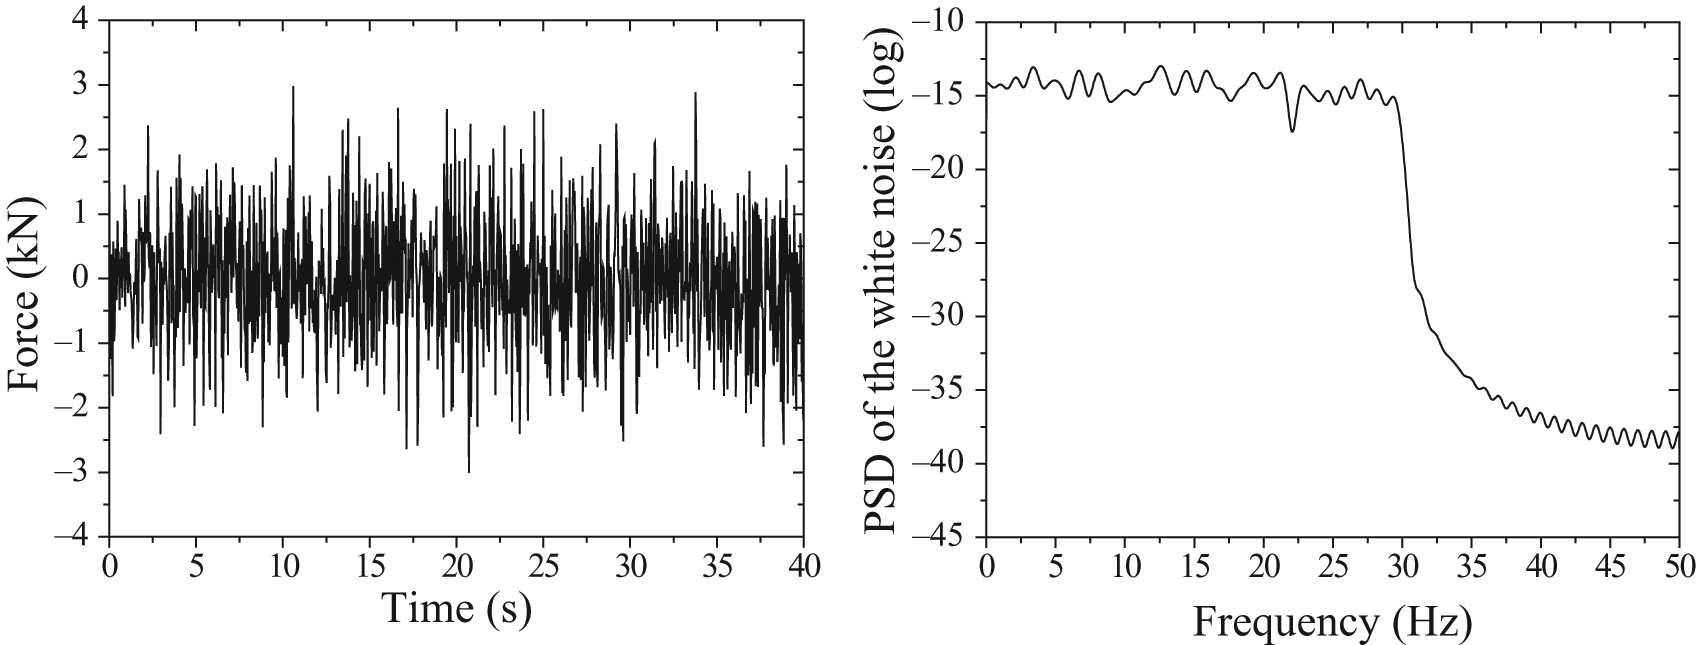
The forced excitation of broadband white noise was applied as a fixed-location concentrated load with a random time history defined such that the peak magnitude was 4 kN and the resulting force PSD was approximately uniform from the range of 0–500 Hz. The random force for a period of 40 s (Figure 10) was applied to nodes of the presented beam with the sampling time of 0.001 s. Ten kinds of load cases as specified in Table 3 are considered. Take L1 and L2 for example, L1 denotes that random force is applied at node 7 while L2 denotes that random forces are applied at nodes 2 and 7. All the beams with different damage extents were excited by 10 kinds of load cases, respectively.
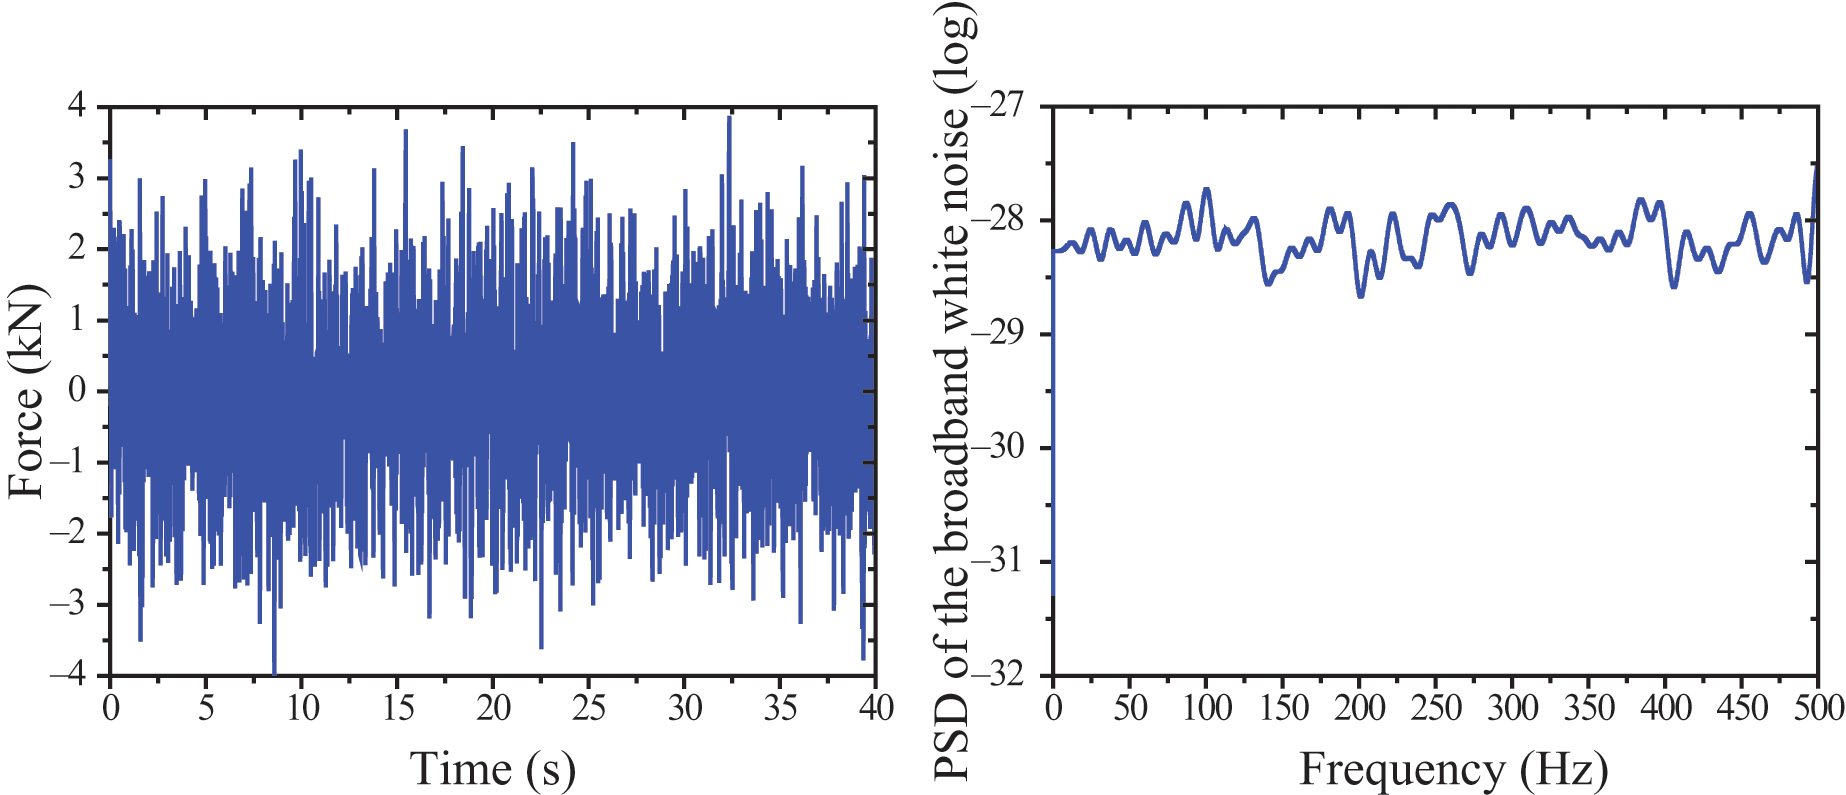
Random force of broadband white noise and its PSD.
Ten kinds of excitations.
The macrostrain time history from mth sensor with Lm gauge length can be calculated by

in which h is the distance from inertial axis to the sensor location while vi(t) and vj(t) represent rotational degree at first node of first element (ith DOF) and that at second node of last element (jth DOF).
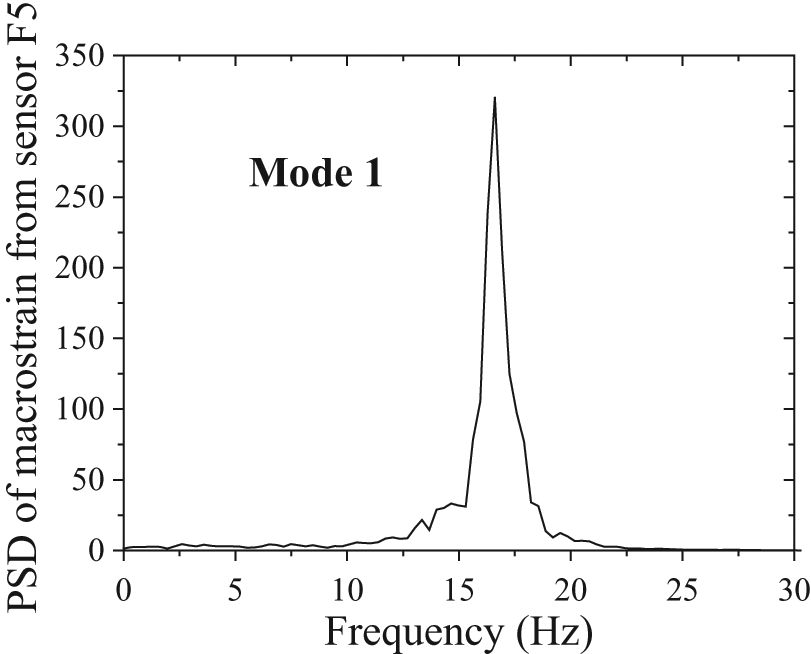
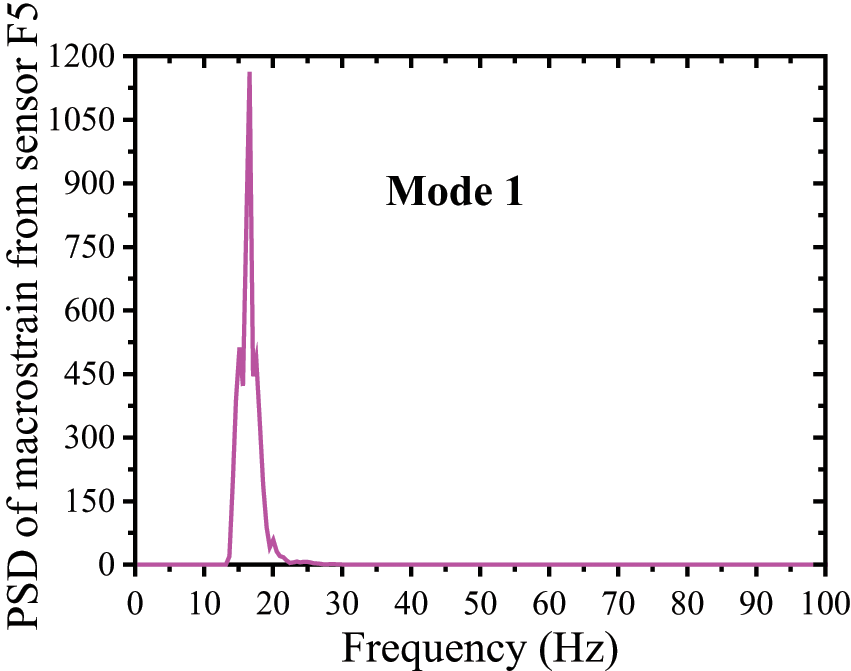
The typical PSDs of macrostrain time histories for the intact beam are shown in Figure 11. From this figure, it is evident that the first-order natural frequency of the intact beam can be identified as 16.60 Hz.
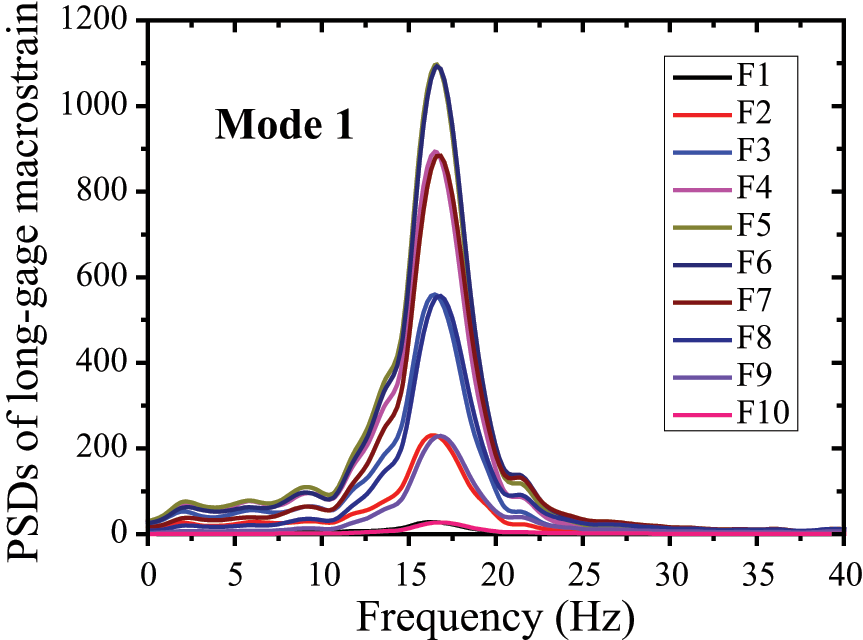
Typical PSDs of macrostrain time histories for the intact beam.
Damage Localization
It is reasonable to select any sensor near the support as the reference, because the chance of occurrence of damage is very small and the Euler–Bernoulli beam neglects the shear deformation and rotational inertia. Hence, F1 is selected as reference sensor for easy comparison. The state of health of the regions covered by macrostrain sensors F3, F5, F7, and F9 is clearly identifiable as shown in Figures 12–14. The ratio of the peak value of PSD at ω1 from sensor F5 to that from the reference sensor progressively increases for C1–C3 while that of other sensors basically remains unchanged for all the scenarios. The ratio of the peak value of PSD at ω1 from sensors F5 and F7 progressively increases for C4–C6 while that of other sensors basically remains unchanged for all the scenarios. The ratio of the peak value of PSD at ω1 from sensors F5, F7, and F9 progressively increases for C7–C9 while that of other sensors basically remains unchanged for all the scenarios. It is worth noting that the ratios from different load cases for the same damage scenario basically remain the same. So the slope of fitting several testing data can represent the ratio in order to improve the accuracy and stability of the method.
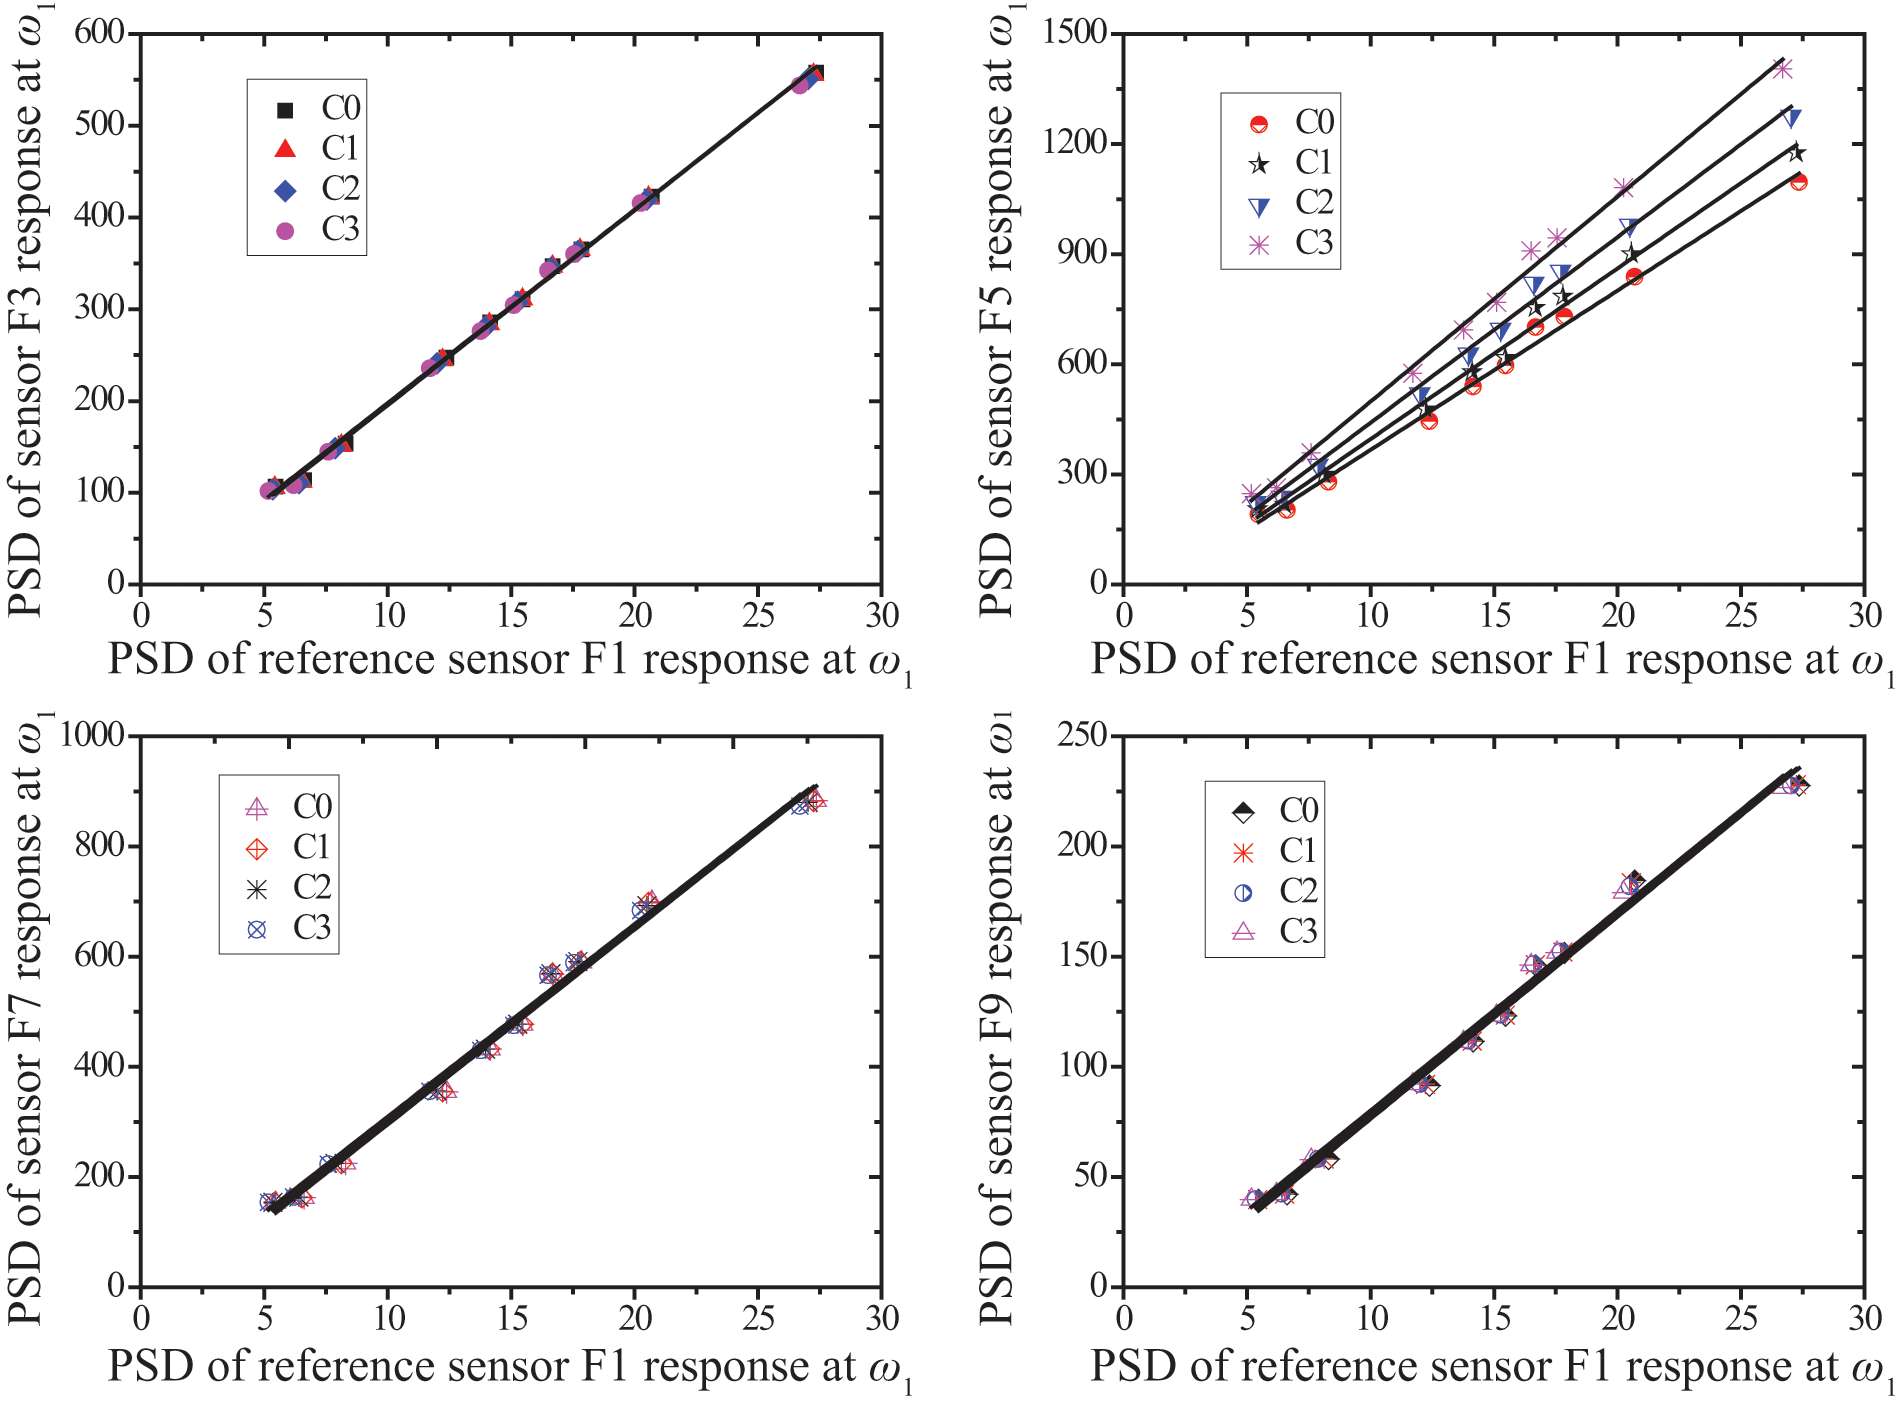
Damage identification results for single damage cases.
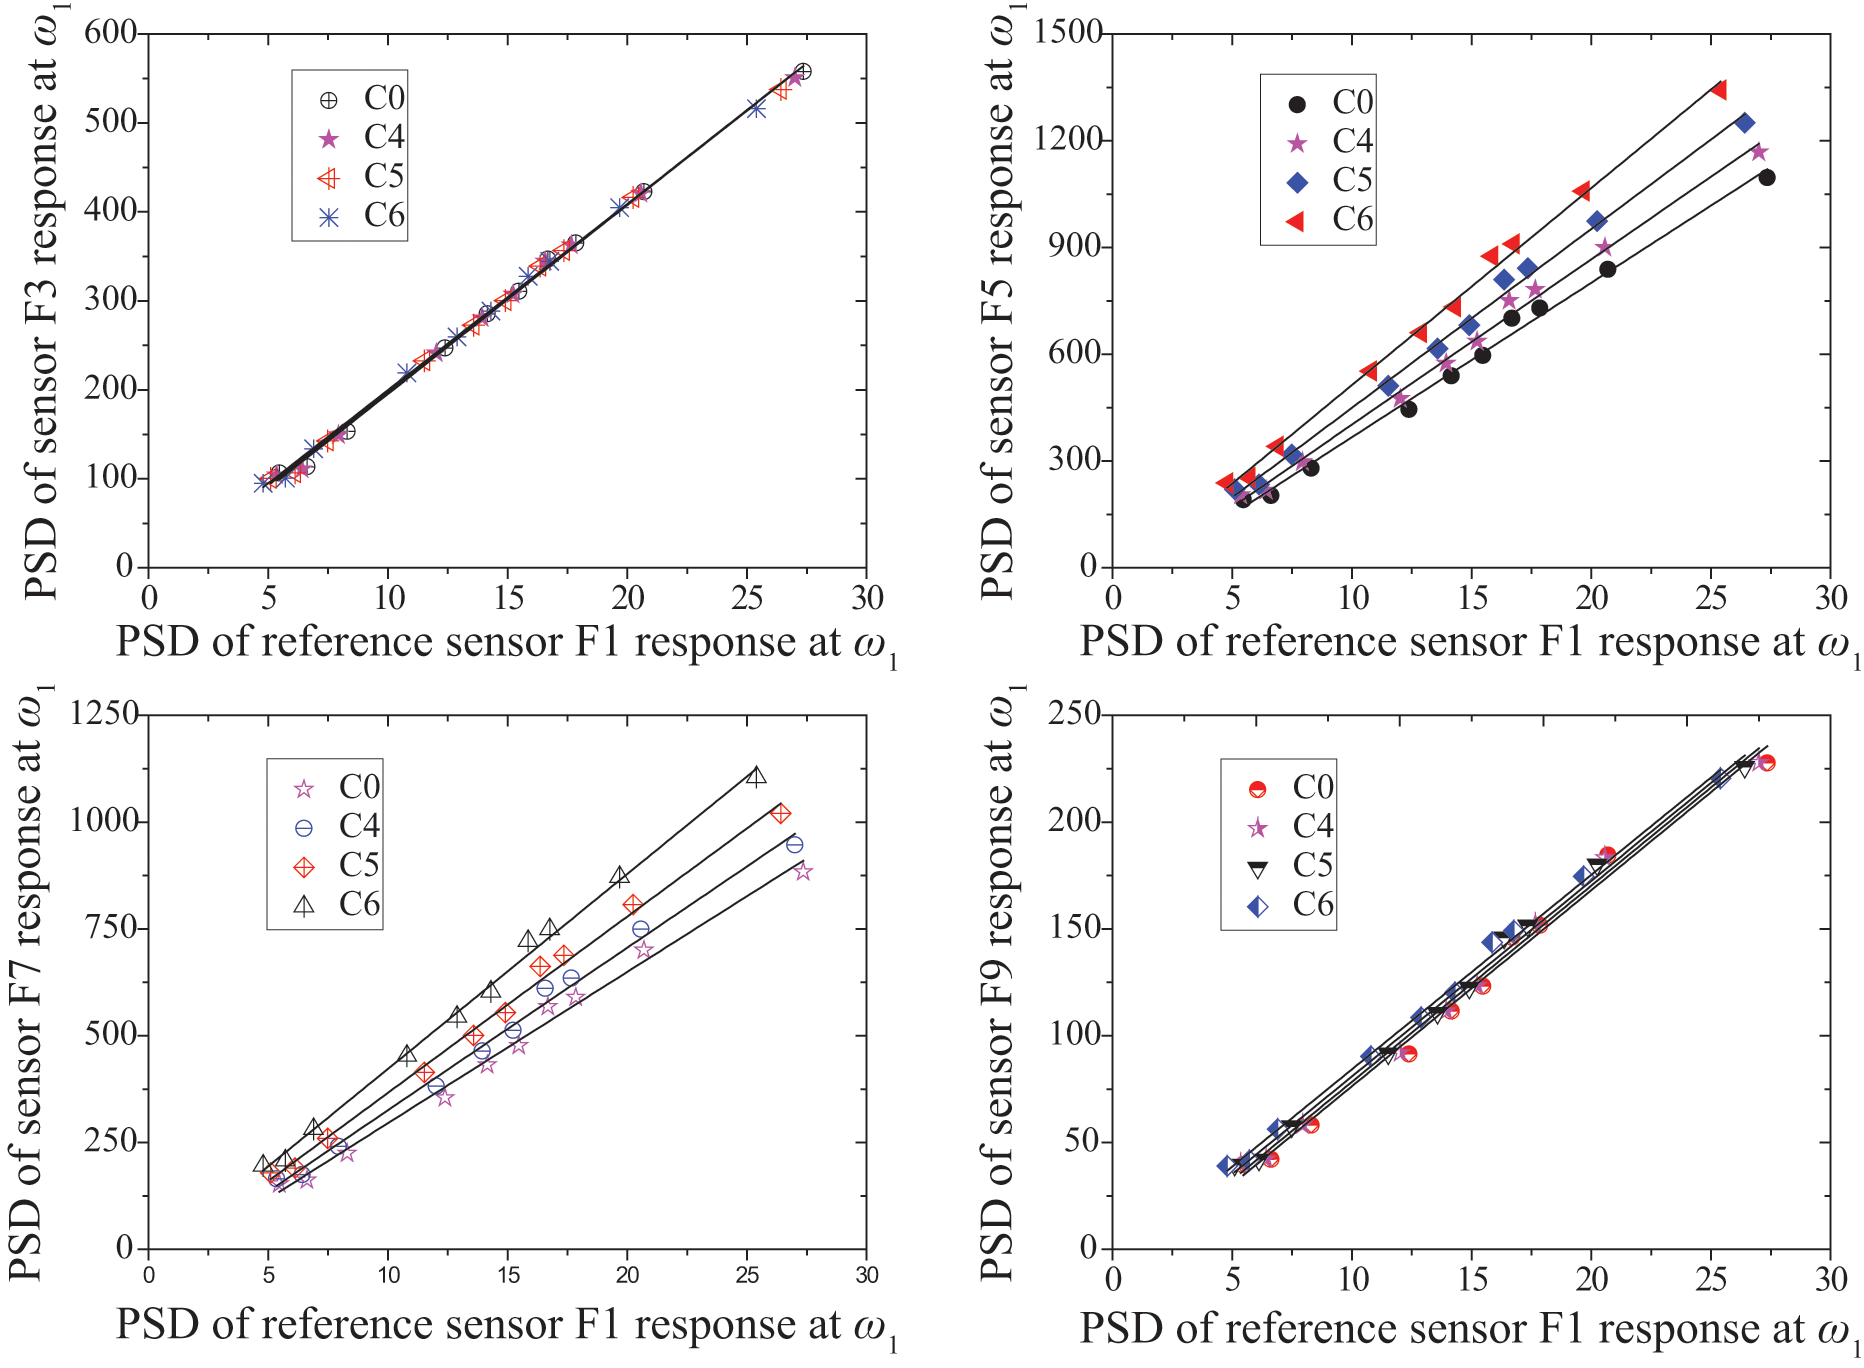
Damage identification results for double damage cases.
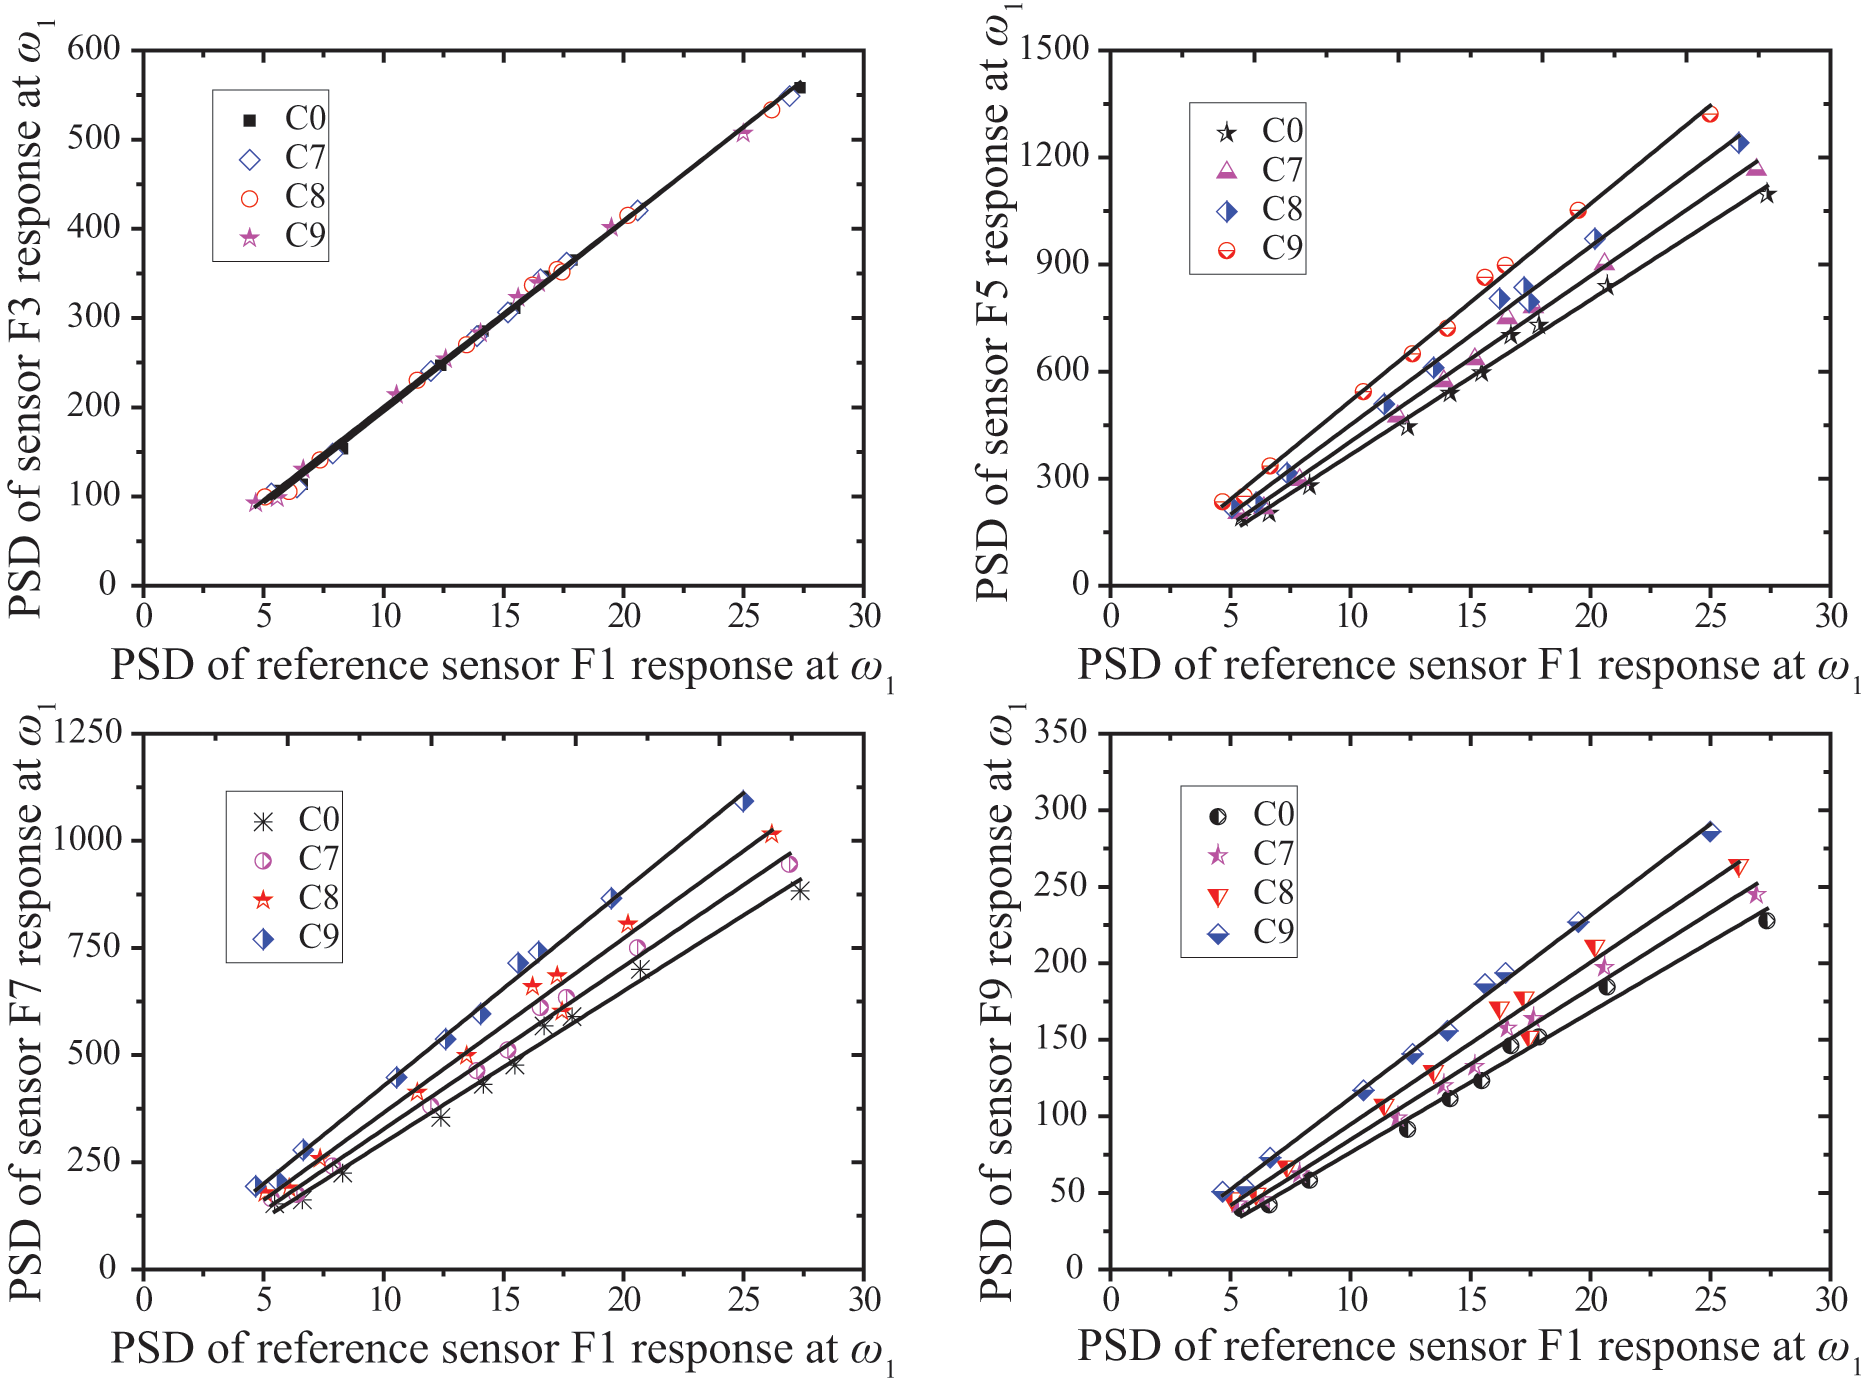
Damage identification results for multiple damage cases.
The slopes and correlation coefficients from the fitting line of the simulation data are labeled in Table 4. The perfect linear correlations show that modal macrostrain is uniquely determined by the peak value of the PSD of dynamic macrostrain response. The slopes can sensitively reflect the damage extent.
Slopes of target sensor relative to reference sensor for different damage scenarios.
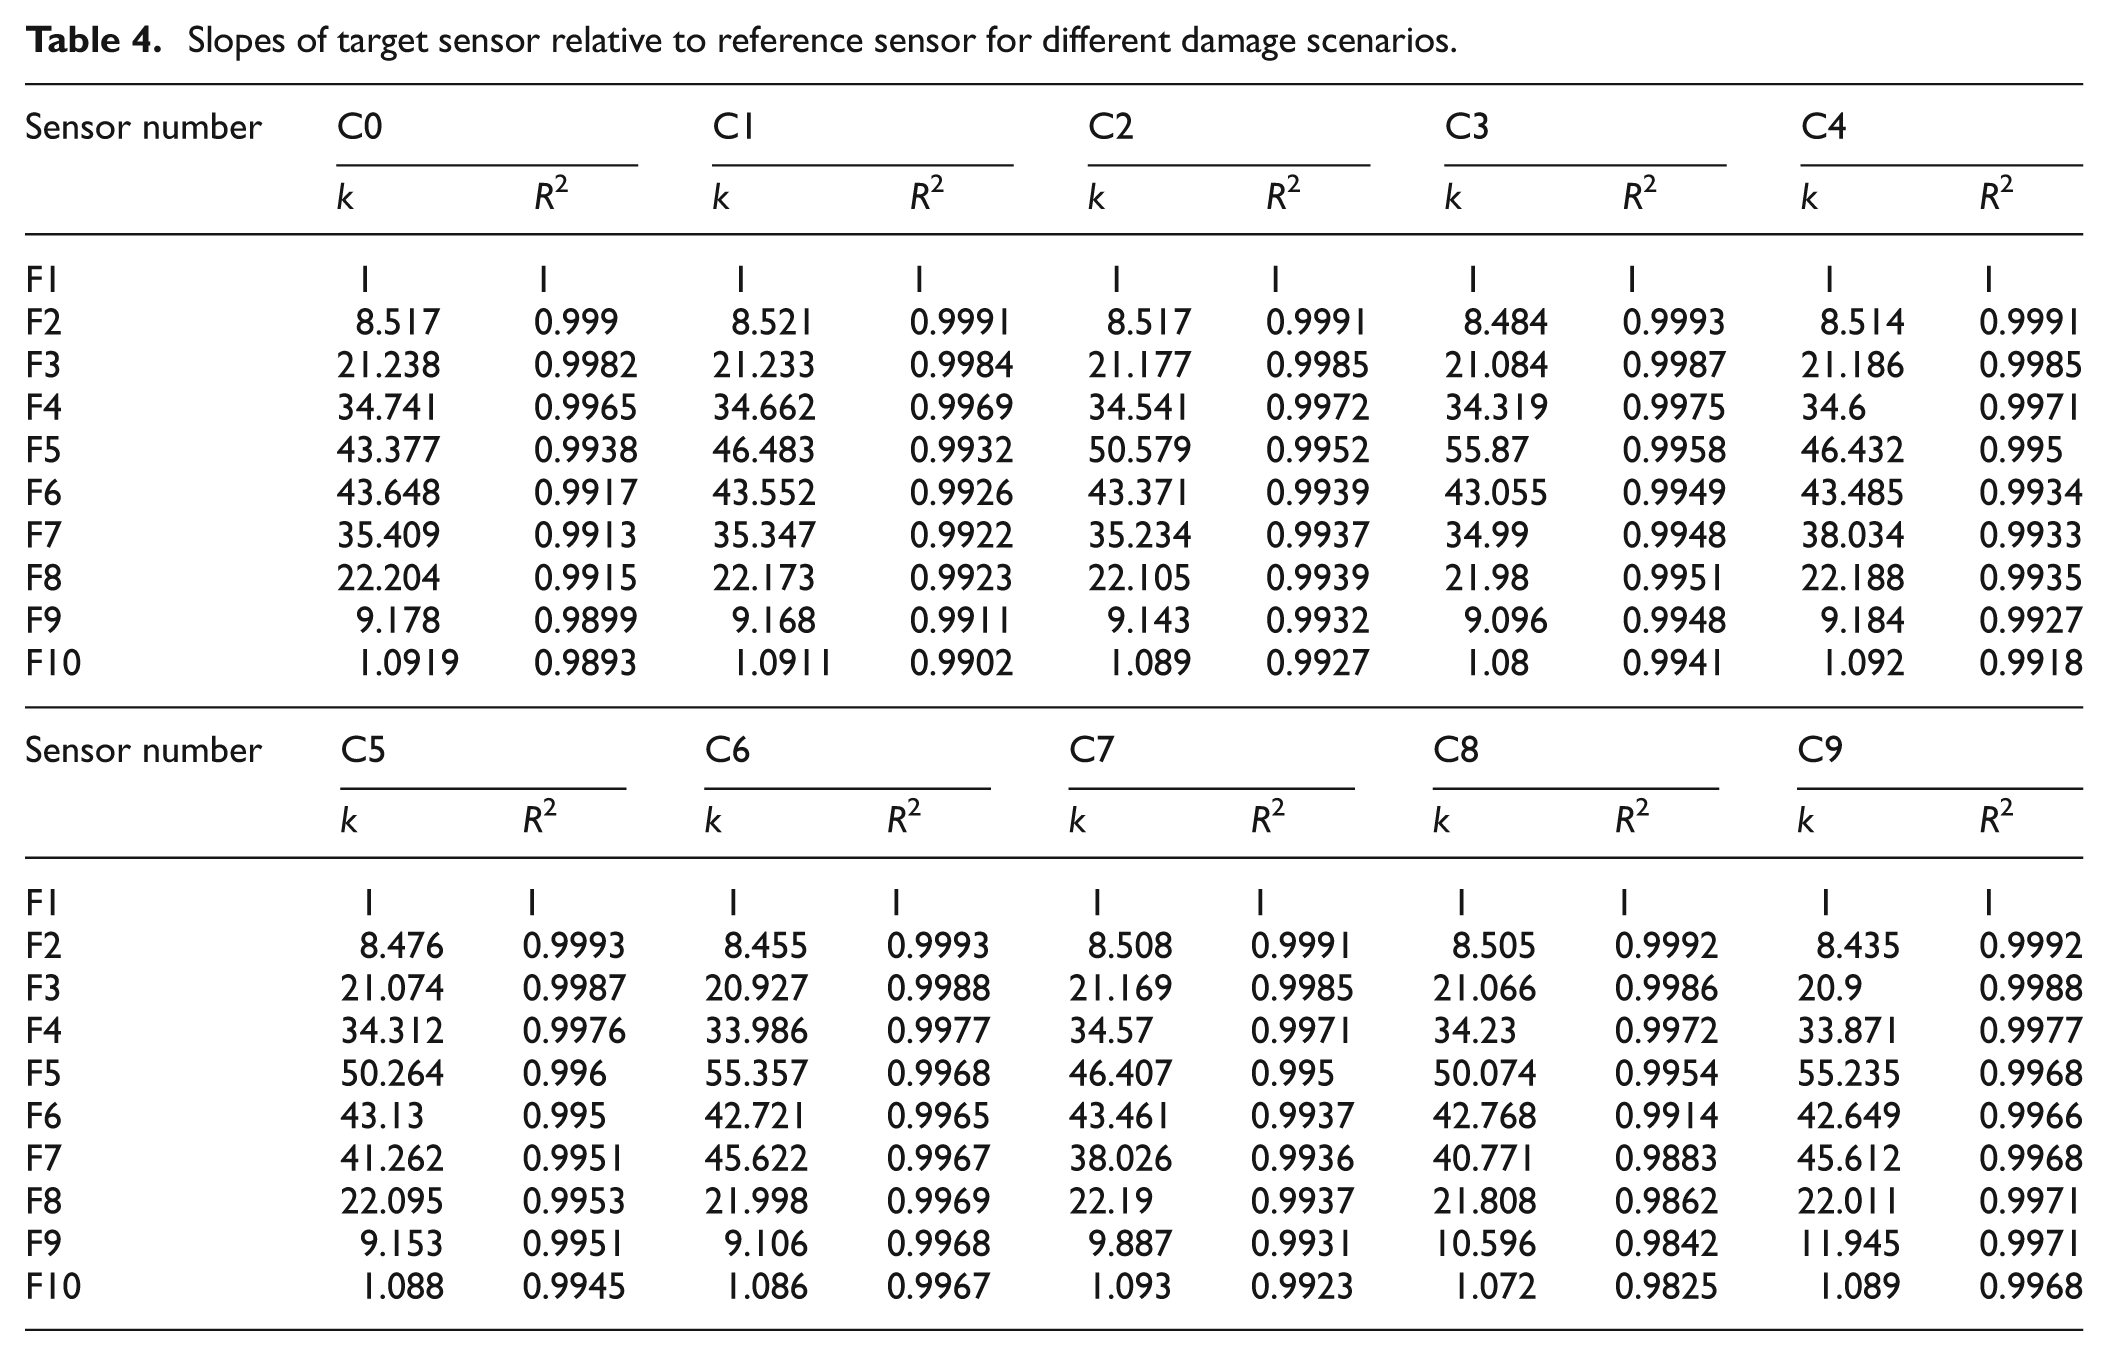
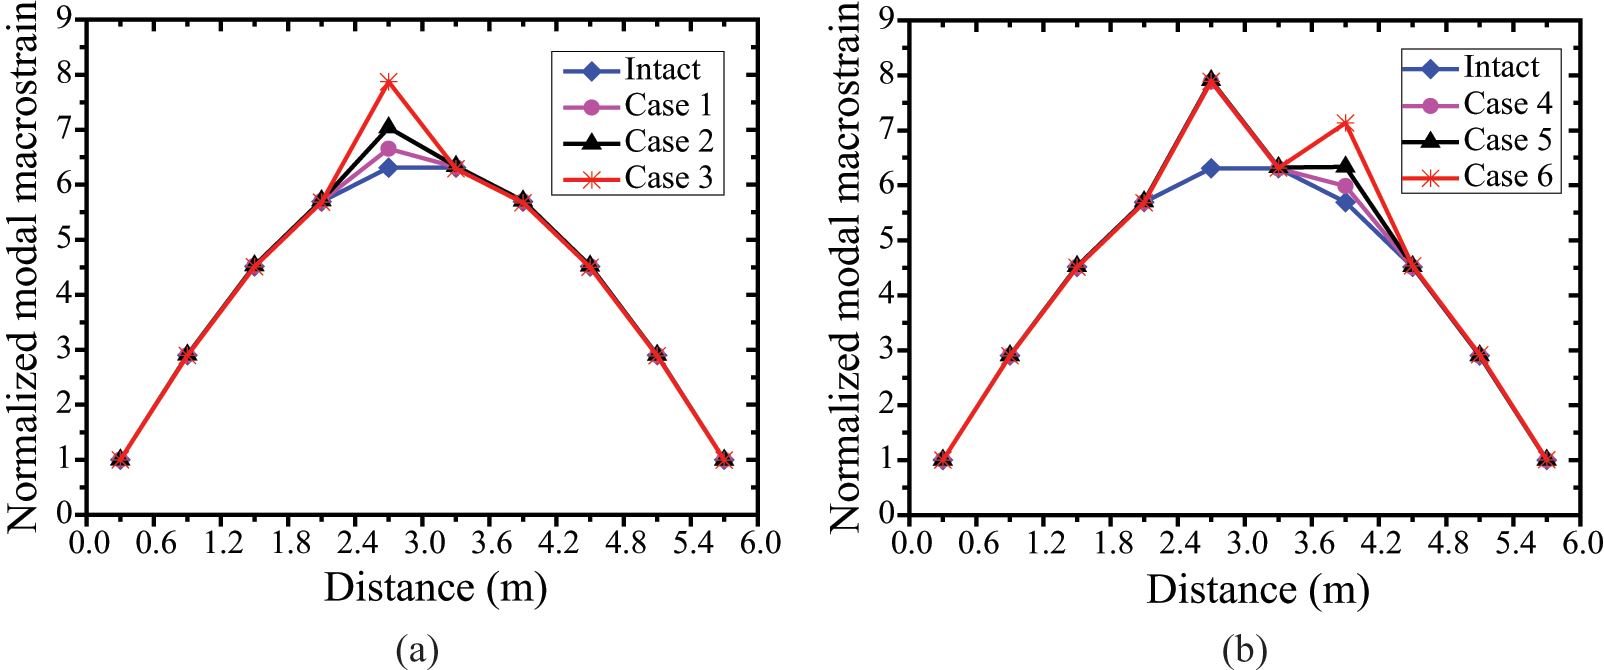
The normalized modal macrostrain along the distance of the beam for different damage scenarios (shown in Figure 15) can therefore be obtained by substituting all the slopes into Equation (6). For comparison, modal analysis of the intact beam is also conducted. Figure 15(a) reveals that the identified modal macrostrain agrees well with that of obtained by modal analysis for the intact beam. The maximum error of the identified modal macrostrain relative to that of the modal analysis is 3%. Figure 15(b)–(d) shows the normalized macrostrain for single damage cases, double damage cases, and multiple damage cases, respectively.
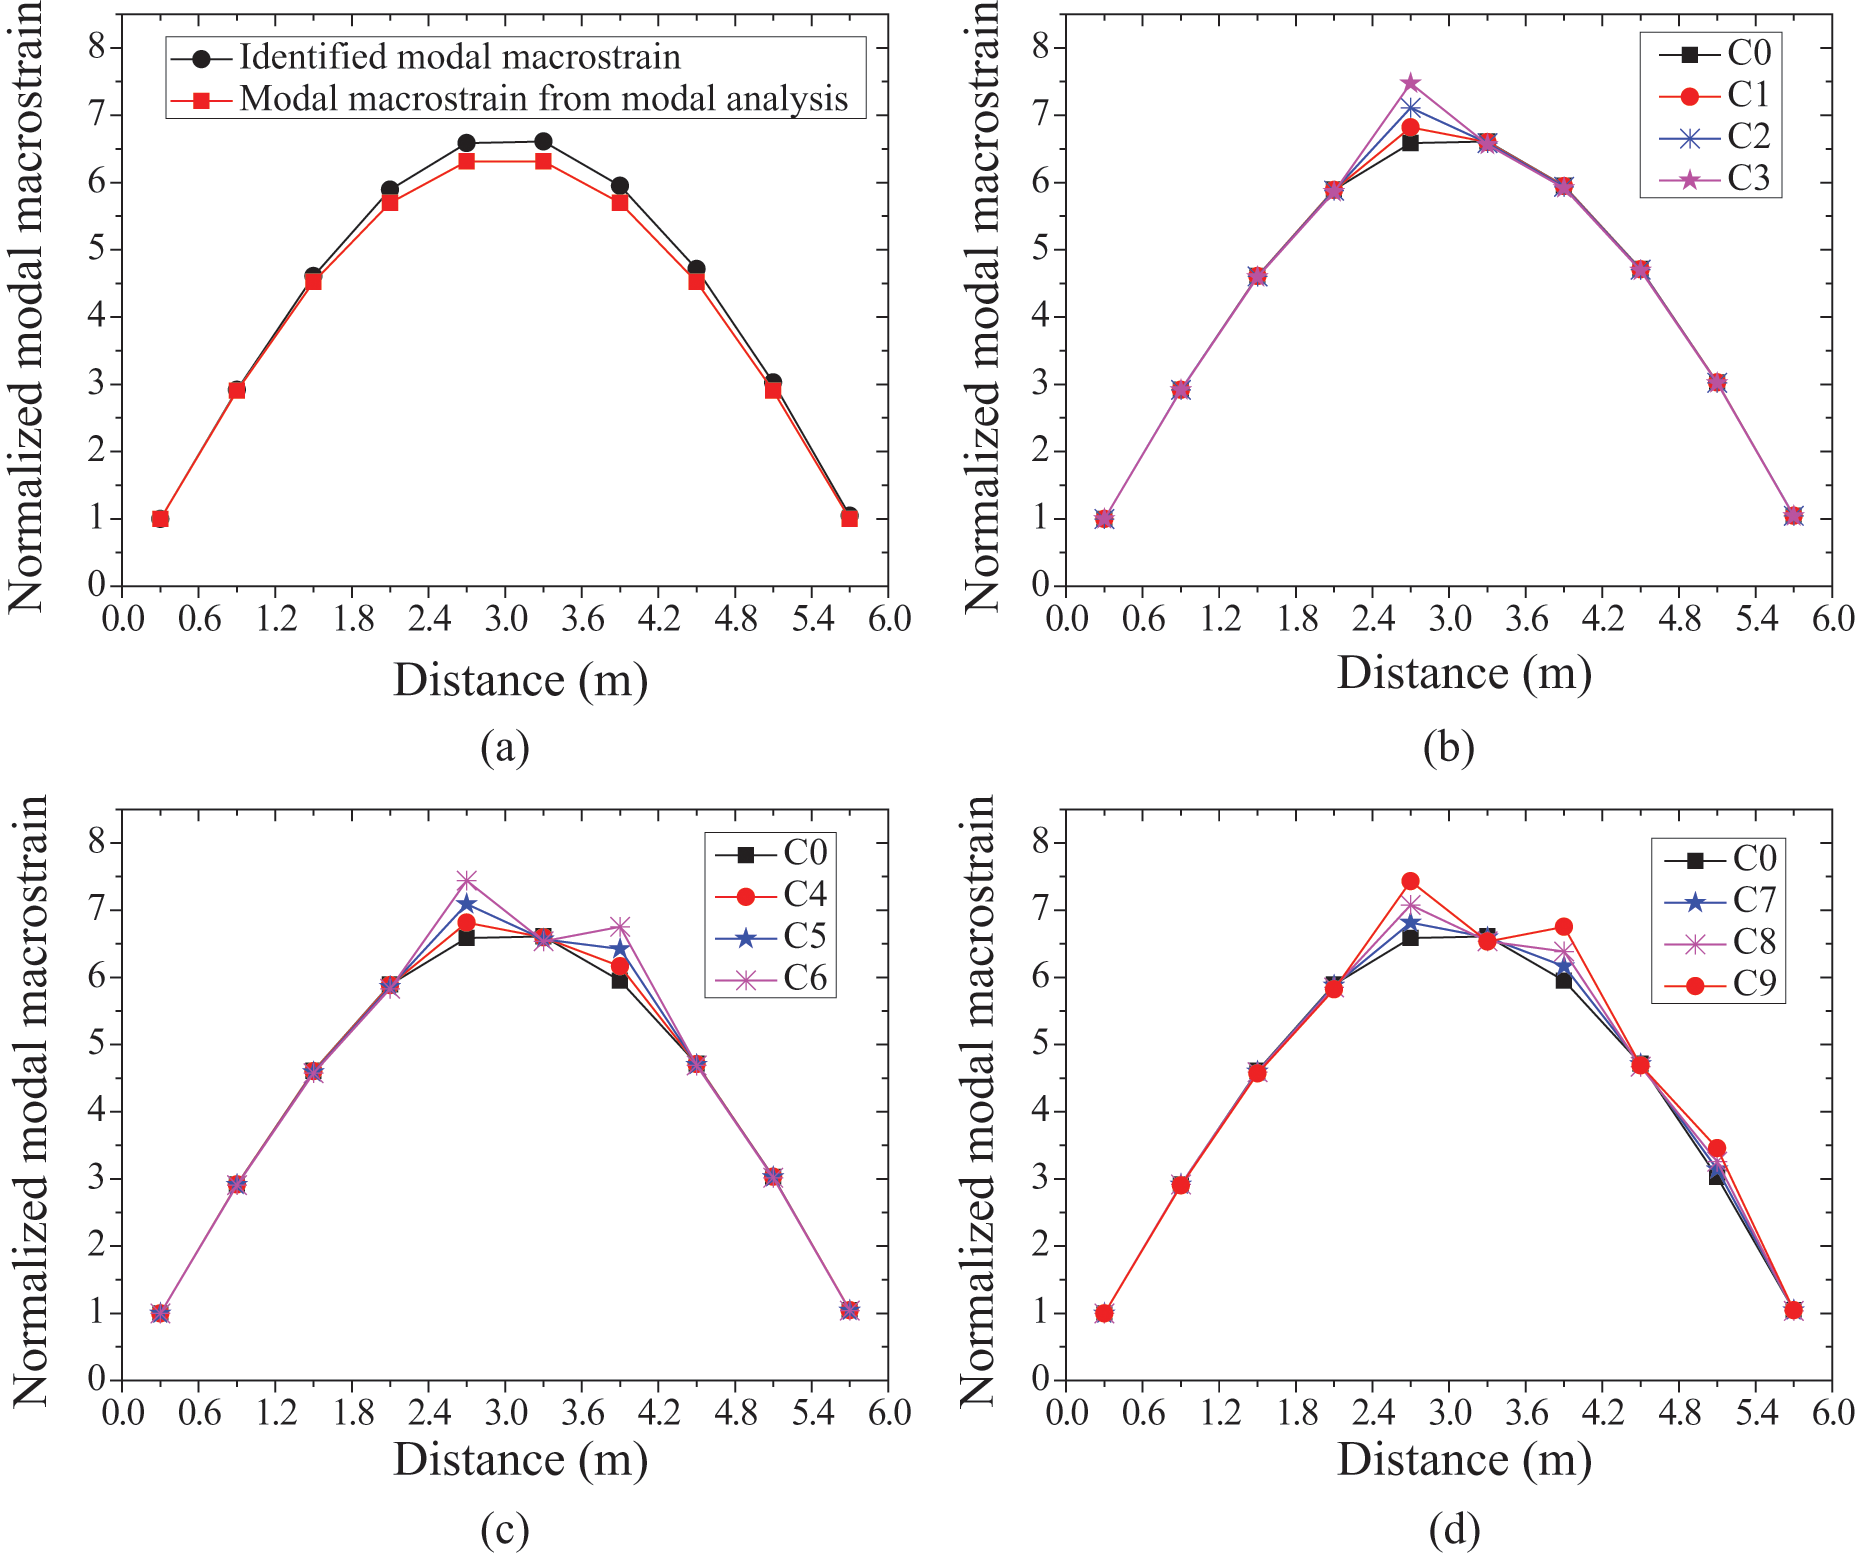
Identified modal macrostrain for all damage cases: (a) comparison of identified normalized modal macrostrain and modal analysis result for C0; (b) single damage; (c) double damage; and (d) multiple damages.
Damage Quantification
Due to local damage occurrence within the long-gauge sensor, the actual average damage extent within the gauge length can be calculated by Equation (14). The average damage extent can also be identified by Equation (11). It is obvious from Table 5 that the identified damage extent is very close to the calculated damage extent for both single damage and multiple damage cases.
Damage quantification for different damage scenarios.

Influence of Excitation on PSD-Based Damage Identification Method
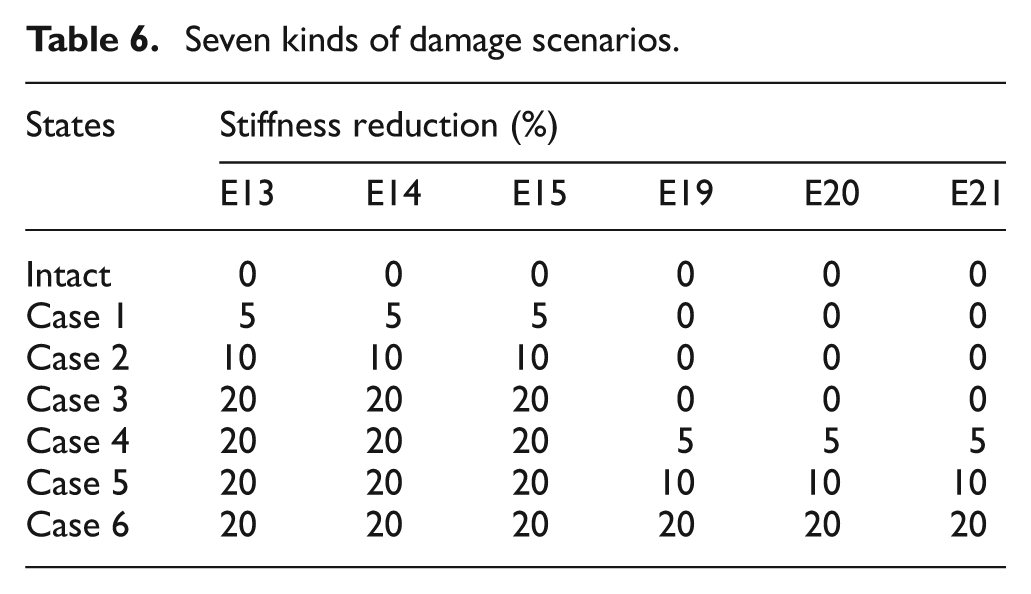
In ‘Numerical Simulation’ section, damage identification based on PSD-based method was verified by simply supported beam excited by broadband white noise. Although excitation on real bridges is mostly assumed to be broadband white noise by many researchers, actual excitation does not always conform to this assumption. In this section, the influence of several typical excitations on damage identification was investigated. The same model as shown in Figure 8 is excited by band-limited white noise, vertical seismic waves, and moving load, respectively. The analytical beams are employed for different scenarios (shown in Table 6). E13–E15 are covered by the sensor F5 while E19–E21 are covered by the sensor F7.
Seven kinds of damage scenarios.
Forced Excitation of Band-Limited White Noise
For the numerical study, the forced excitation of band-limited white noise was applied as a fixed-location concentrated load with a random time history defined such that the peak magnitude was 4 kN and the resulting force PSD was approximately uniform over the range of frequencies of interest (first-order natural frequency in this article). Considering the first order of natural frequency is about 16.6 Hz, the white noise from the range of 0–30 Hz is simulated by filtering out other spectrum components (shown in Figure 16). The random force for a period of 40 s was applied to mid-span of the presented beam with the sampling time of 0.001 s.
Forced excitation of band-limited white noise and its PSD.
The macrostrain time histories from all the sensors can be calculated by Equation (15), and therefore, the PSDs of the macrostrain time histories can be obtained. Figure 17 shows the typical PSD of macrostrain from sensor F5.
Typical PSD of macrostrain time history for the intact beam.
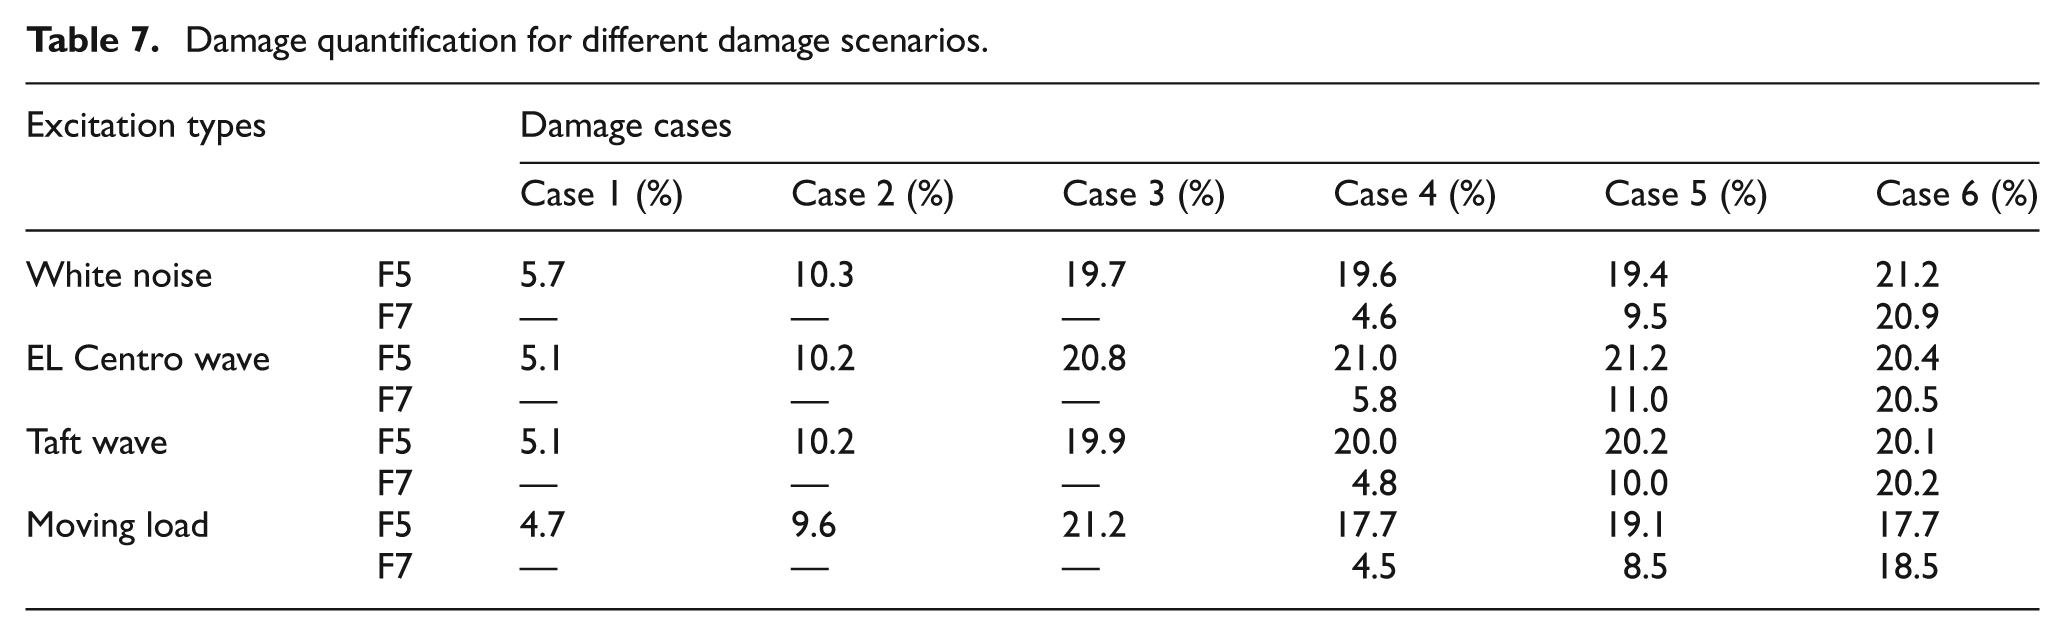
The modal macrostrain of the beam for all damage scenarios can be achieved using Equation (6). Both single damage and double damages were localized from the distributed modal macrostrain distribution (shown in Figure 18). The damage extent can also be quantified by Equation (11) in Table 7.
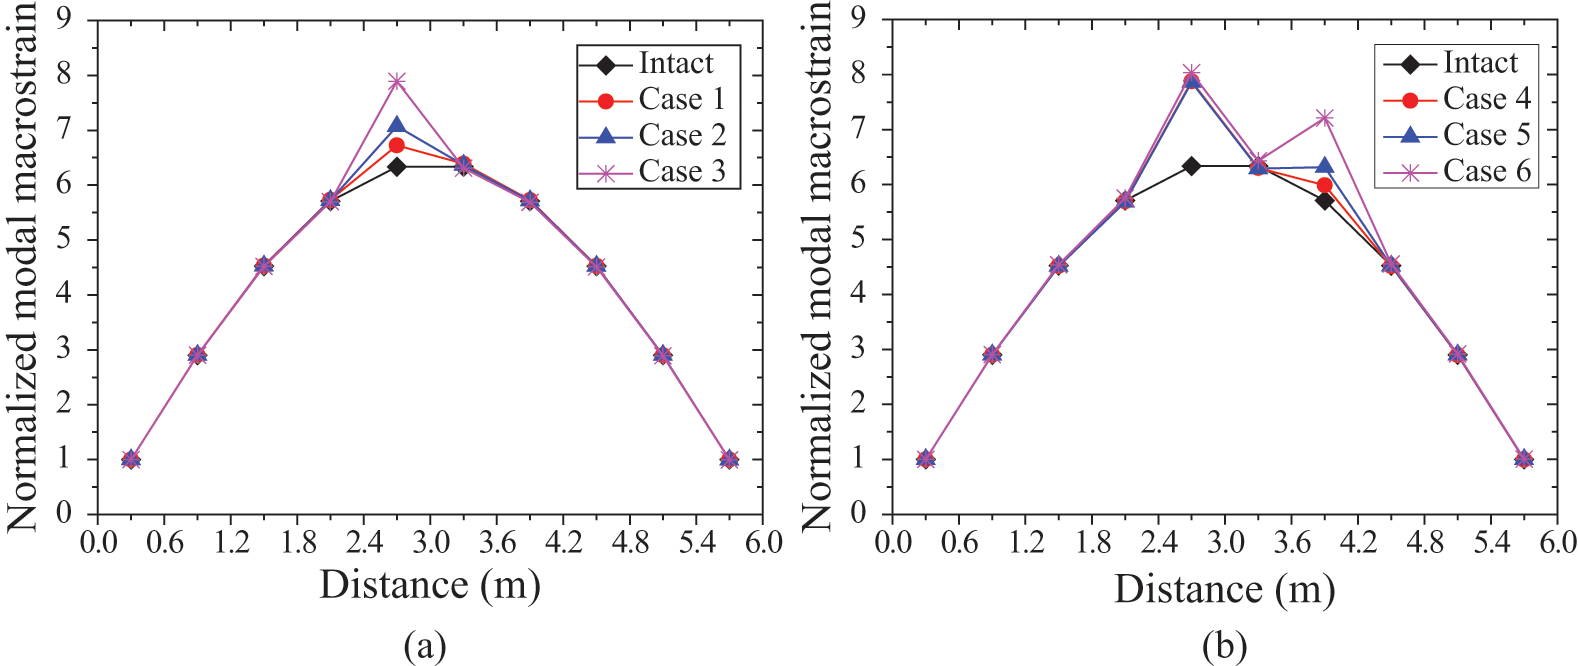
Damage identification results under excitation of band-limited white noise: (a) single damage and (b) double damages.
Damage quantification for different damage scenarios.
Seismic Wave Excitation
Two typical seismic wave excitations are also utilized to verify the effectiveness of the PSD-based method. One is vertical El Centro wave and the other is vertical Taft wave.
Vertical El Centro Wave
The vertical El Centro wave time history and its PSD are shown in Figure 19. The seismic wave was exerted along the height of the beam. The macrostrain time histories from all the sensors can be calculated by Equation (15), and therefore, the PSDs of the macrostrain time histories can be obtained. Figure 20 shows the typical PSD of macrostrain from sensor F5.
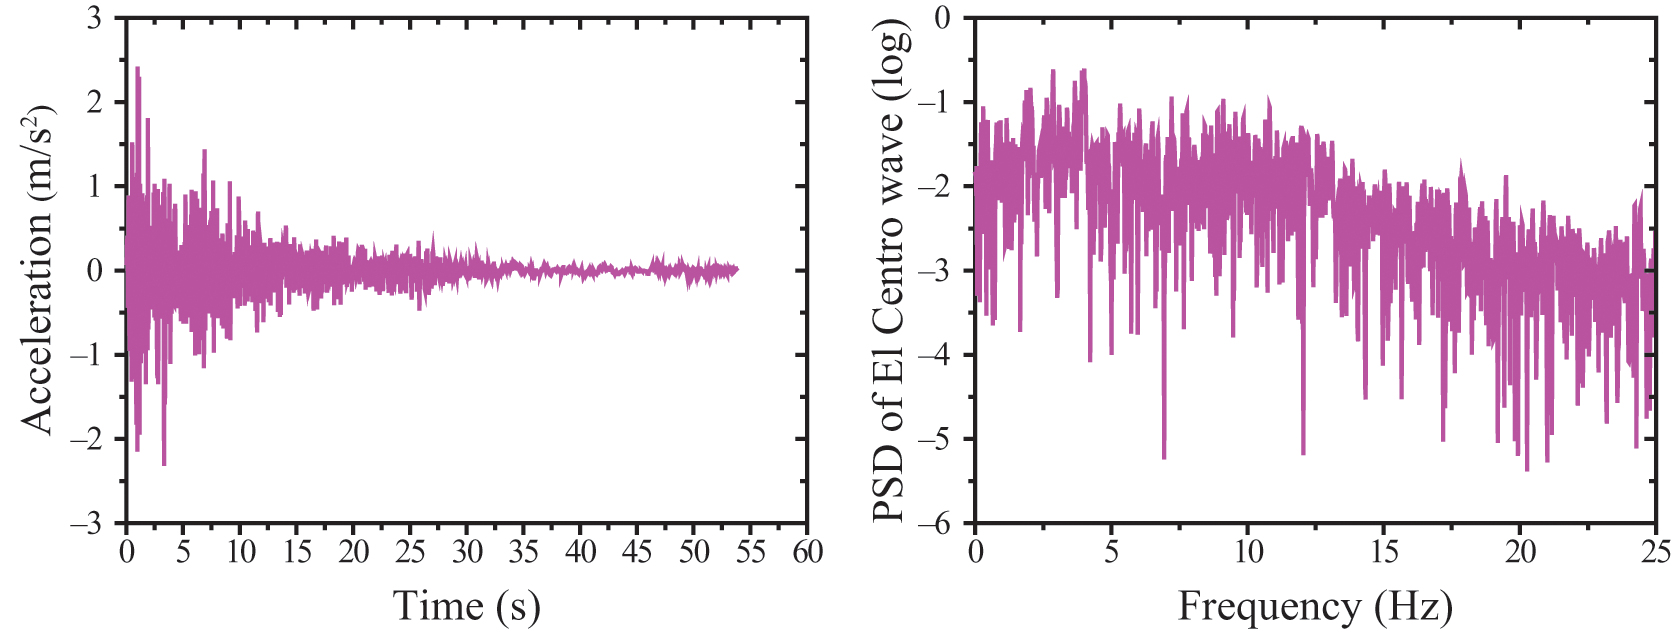
Vertical El Centro wave and its PSD.
Typical PSD of macrostrain time history for the intact beam.
The modal macrostrain of the beam for all damage scenarios can be achieved using Equation (6). Both single damage and double damages are localized from the distributed modal macrostrain distribution (shown in Figure 21). The damage extent can also be quantified by Equation (11) in Table 7.
Damage identification results under excitation of vertical El Centro wave: (a) single damage and (b) double damages.
Vertical Taft Wave
The vertical Taft wave time history and its PSD are shown in Figure 22. The seismic wave is exerted along the height of the beam. The macrostrain time histories from all the sensors can be calculated by Equation (15), and therefore, the PSDs of the macrostrain time histories can be obtained. Figure 23 shows the typical PSD of macrostrain from sensor F5.
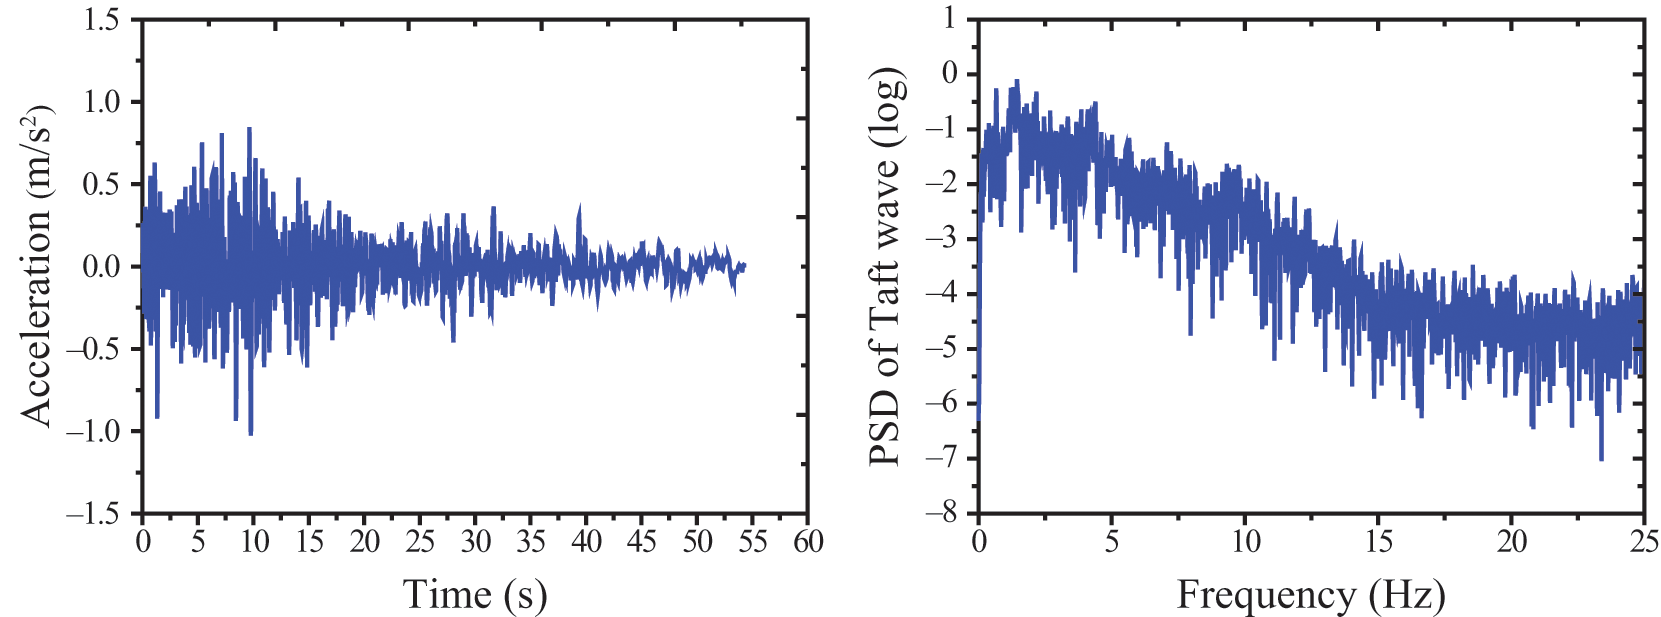
Vertical Taft wave and its PSD.
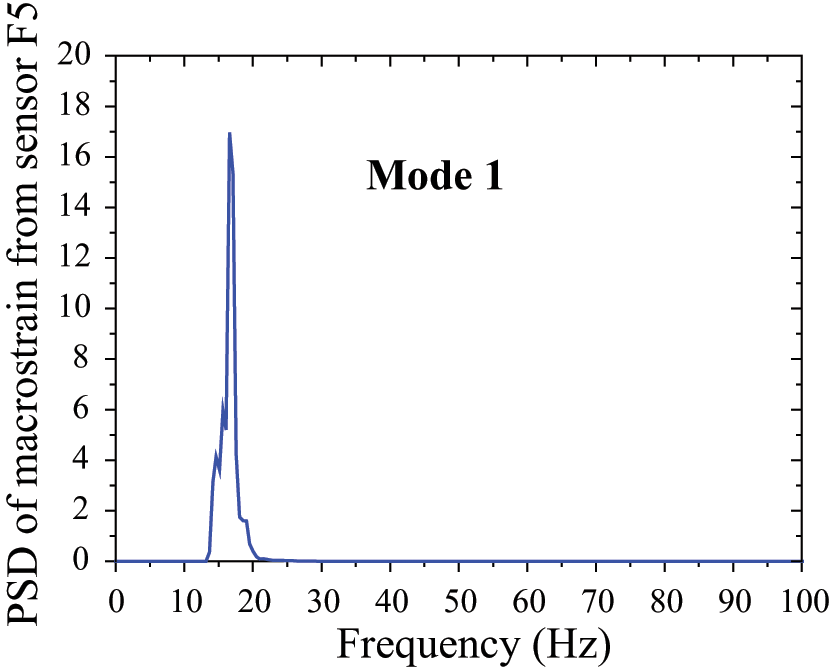
Typical PSD of macrostrain time history for the intact beam.
The modal macrostrain of the beam for all damage scenarios can be achieved using Equation (6). Both single damage and double damages are localized from the distributed modal macrostrain distribution (shown in Figure 24). The damage extent can also be quantified by Equation (11) in Table 7.
Damage identification results under excitation of vertical Taft wave: (a) single damage and (b) double damages.
Moving Load Excitation
Traffic load is the main excitation on the bridge, and moving load is also utilized as the excitation on the beam for damage identification. Concentrated force with the amplitude of 10 kN at the speed of 36 km/h was exerted along the length of the beam. Typical macrostrain time history and its PSD for the intact beam are shown in Figure 25.
Typical macrostrain time history and its PSD for the intact beam.
The modal macrostrain of the beam for all damage scenarios can be achieved using Equation (6). Both single damage and double damages are localized from the distributed modal macrostrain distribution (shown in Figure 26). The damage extent can also be quantified by Equation (11) in Table 7.
Damage identification results under excitation of moving load: (a) single damage and (b) double damages.
From the results analyzed earlier, it can be concluded that PSD-based damage identification method is not only applicable to broadband white noise excitation but also suitable for band-limited white noise, seismic excitation, and moving load. It is worth mentioning that the damage identification strategy is only dependent on the first mode, which is easily excited by typical dynamic load on real bridges. Compared to actual stiffness reduction (shown in Table 6), damage quantification results (shown in Table 7) further verify this method can accurately identify at least 5% damage within the gauge length of the sensor.
Condition Assessment of Wayne Bridge under Ambient Excitation
The Wayne Bridge under investigation, a multigirder steel stringer bridge shown in Figure 27, is located in New Jersey in America, constructed in 1983. The bridge is comprised of four simply supported spans using a standard steel stringer design of eight girders with variable section properties and geometries including straight, partially skewed, and full skewed spans. The selected span (span 2) is partially skewed with the span of 39.64 m.
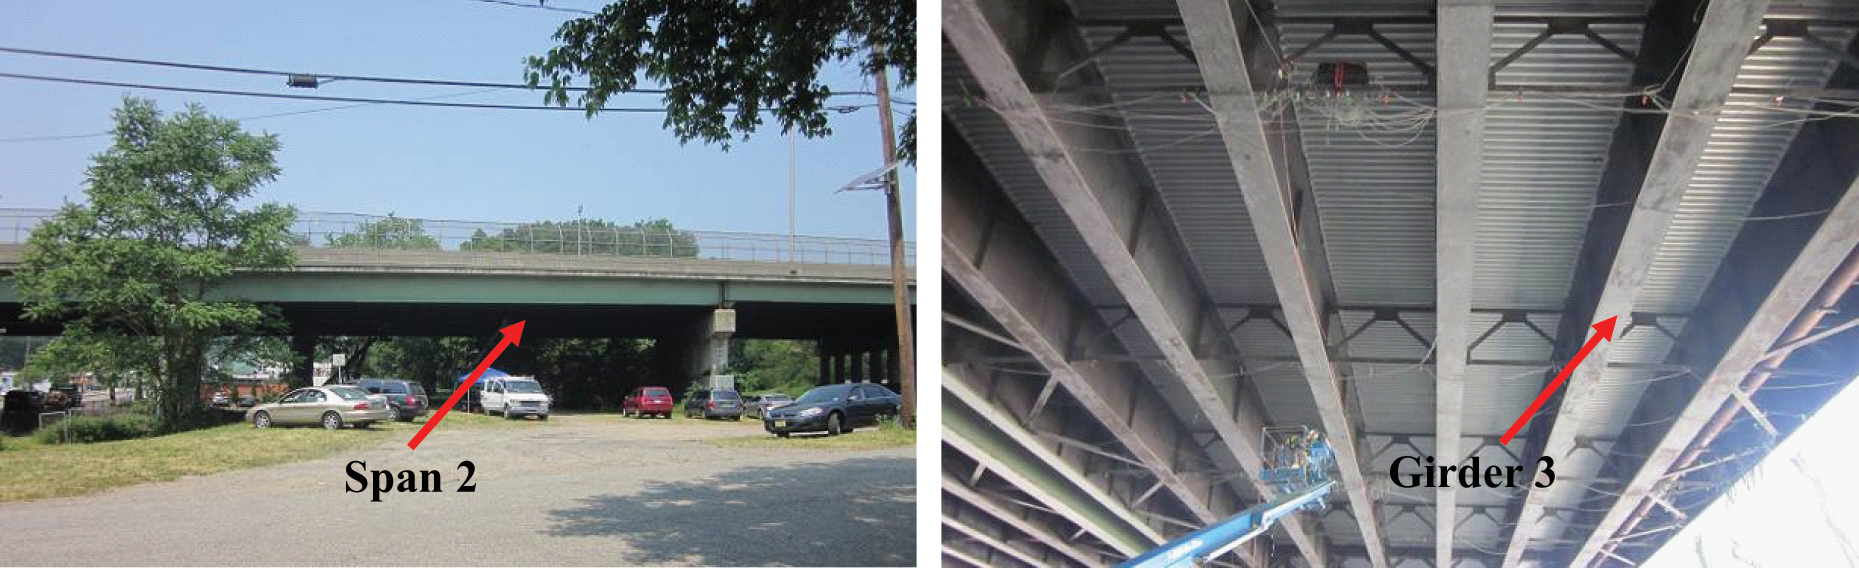
Outline of Wayne Bridge.
Sensor Placement and Testing Methods
The field testing was performed using the output-only method to evaluate the structural condition of the bridge based on distributed long-gauge dynamic macrostrain response. Long-gauge FBG sensor with the gauge length of 1 m is selected in this project for its high precision and dynamic measuring capacity. A total of 17 basalt fiber tube-packaged long-gauge FBG sensors were distributed and arranged on the critical regions of girder 3. All the sensors (namely F1–F17 from right to left) were installed on the lower flange of the girder. Among of them, F1–F4 (F14–F17) connected in series were placed around the quarter span of the girder and F5–F13 were around the middle span. One accelerometer (A1) was also mounted onto the bottom of the bridge for verification purpose. Detailed information is shown in Figure 28. The FBG data were collected at a sampling rate of 500 Hz while the acceleration data were collected at a sampling rate of 512 Hz. The bridge response was monitored using unregulated traffic conditions and environmental excitation. Tests at different time, namely 1st testing, 2nd testing, and 3rd testing, were performed with 25 samples at each test. Every sample is composed of random dynamic macrostrain response lasting about 5 min.
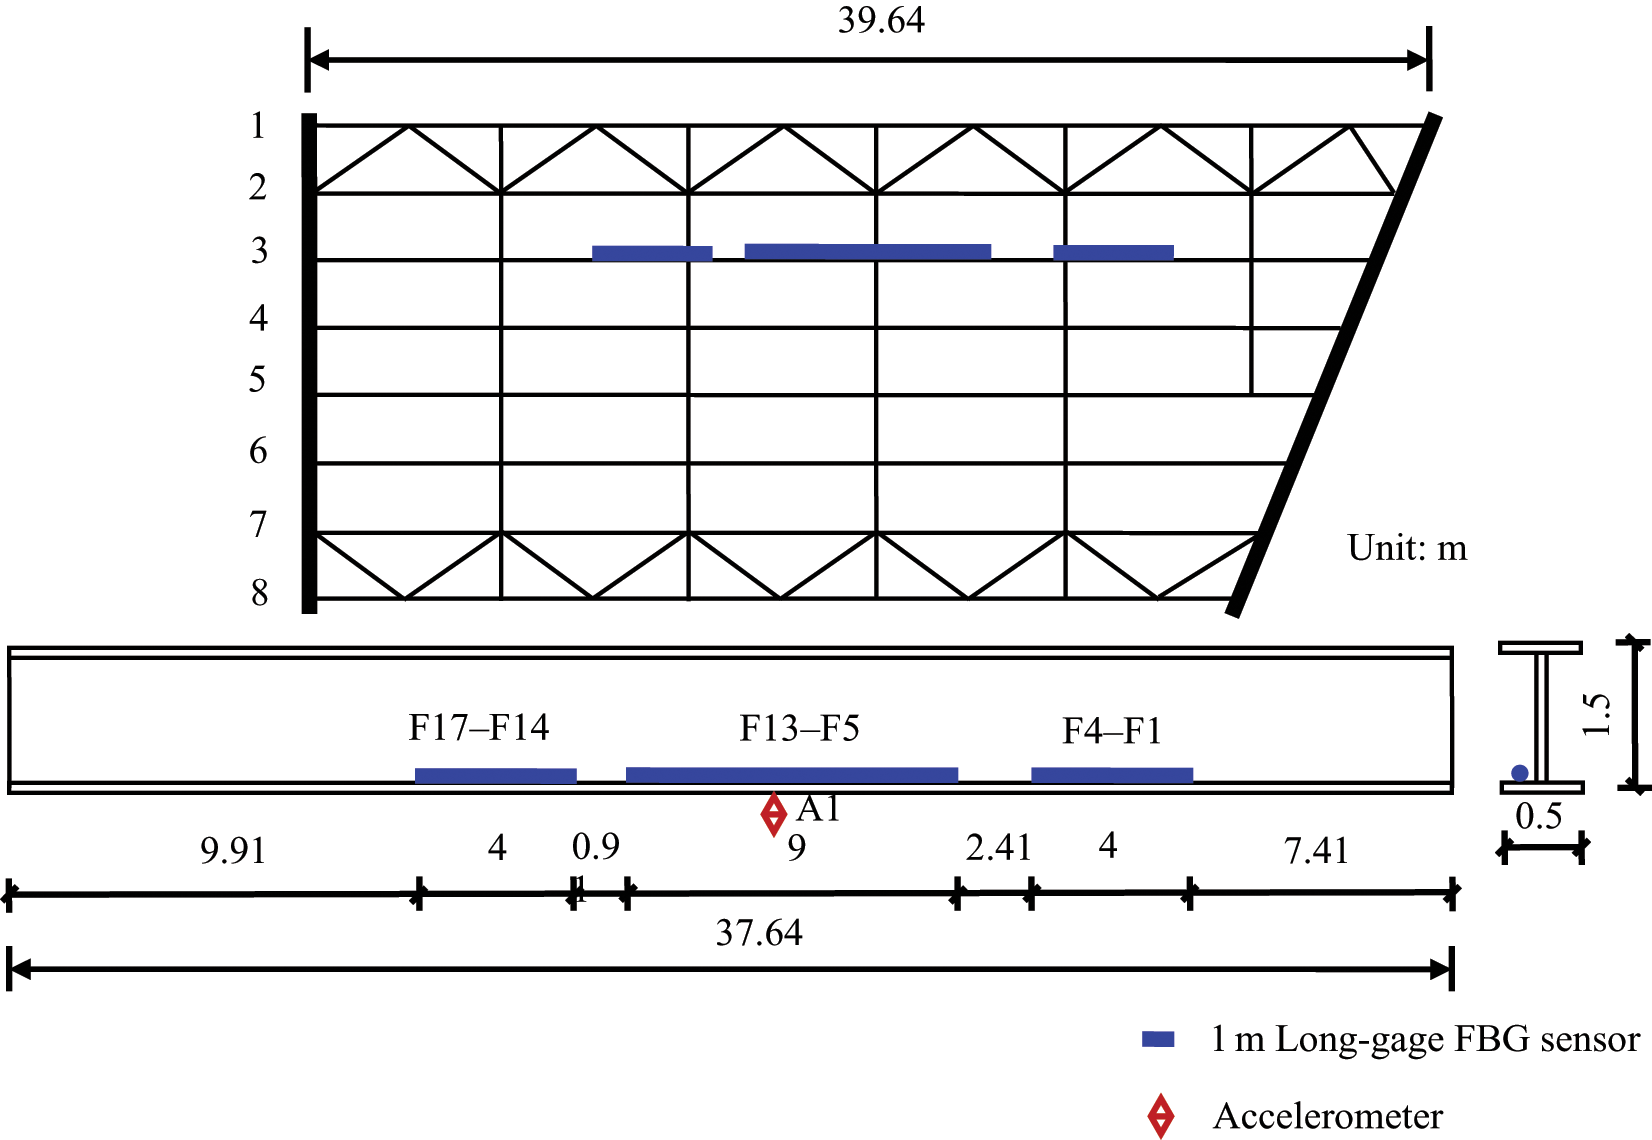
Sensor placement at mid-span of Wayne Bridge.
Testing Results and Discussion
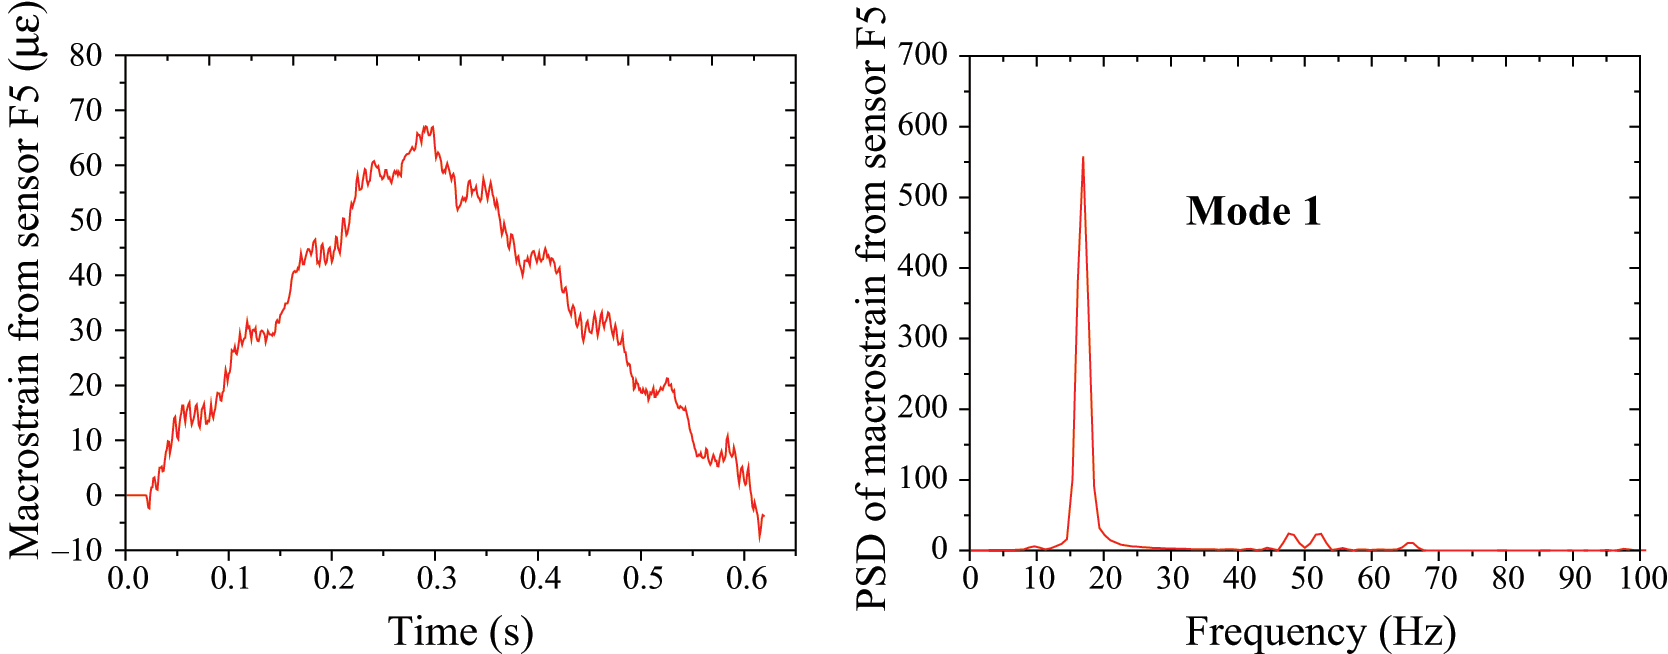
The typical macrostrain time history of Wayne Bridge is depicted in Figure 29. Figure 30(a) and (b) shows the typical PSDs of dynamic macrostrain extracted from macrostrain response and acceleration, respectively. Take the first-order mode of flexural vibration mode for example, the first-order natural frequency ω1 can be identified at 2.83 Hz from PSDs of macrostrain while the PSD of acceleration shows the frequency of 2.81 Hz.
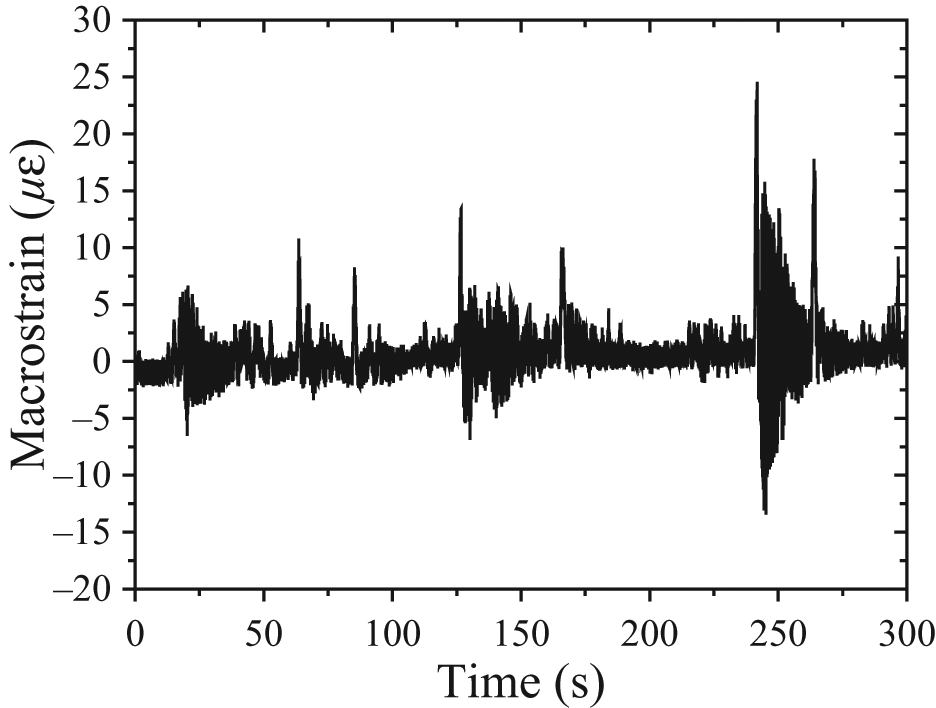
Typical macrostrain time history of Wayne Bridge.
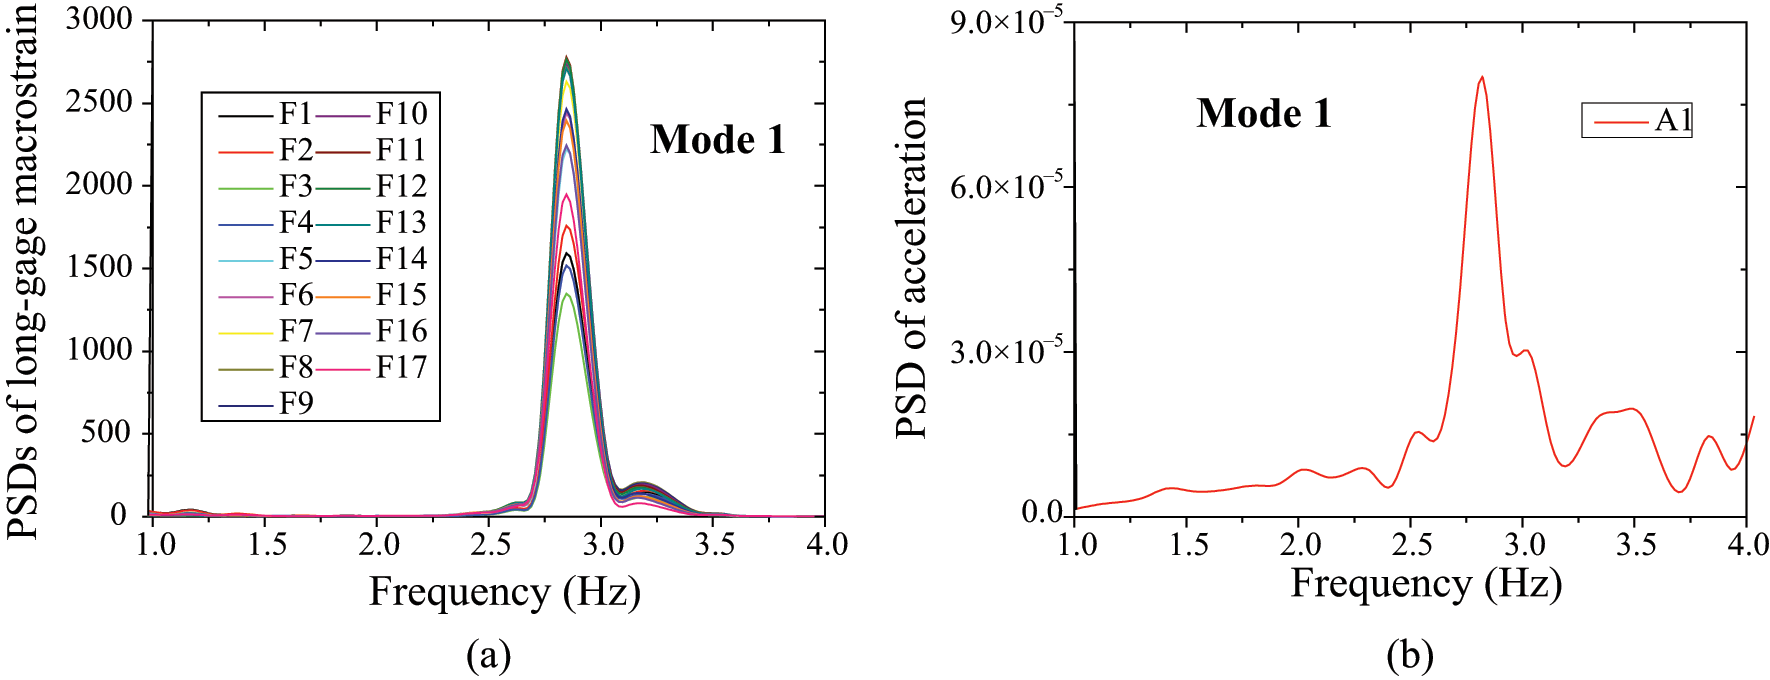
PSDs of macrostrain data and acceleration data: (a) macrostrain data and (b) acceleration data.
F13 sensor was selected in the monitoring as reference sensor. Figure 31 shows the ratios of the PSD magnitude at ω1 of the partial target sensors with respect to the reference sensor. After testing three times, the slopes of fitting line of testing data are basically unchanged, even though the ratio for every single sample may differ slightly from each other due to noise pollution. The PSDs of other FBG macrostrain response have the analogous results. This proves that no damage occurs within the gauge length of the target sensor after the sensors were installed. Continuous or periodic measurement data are required to assess the condition of the bridge.
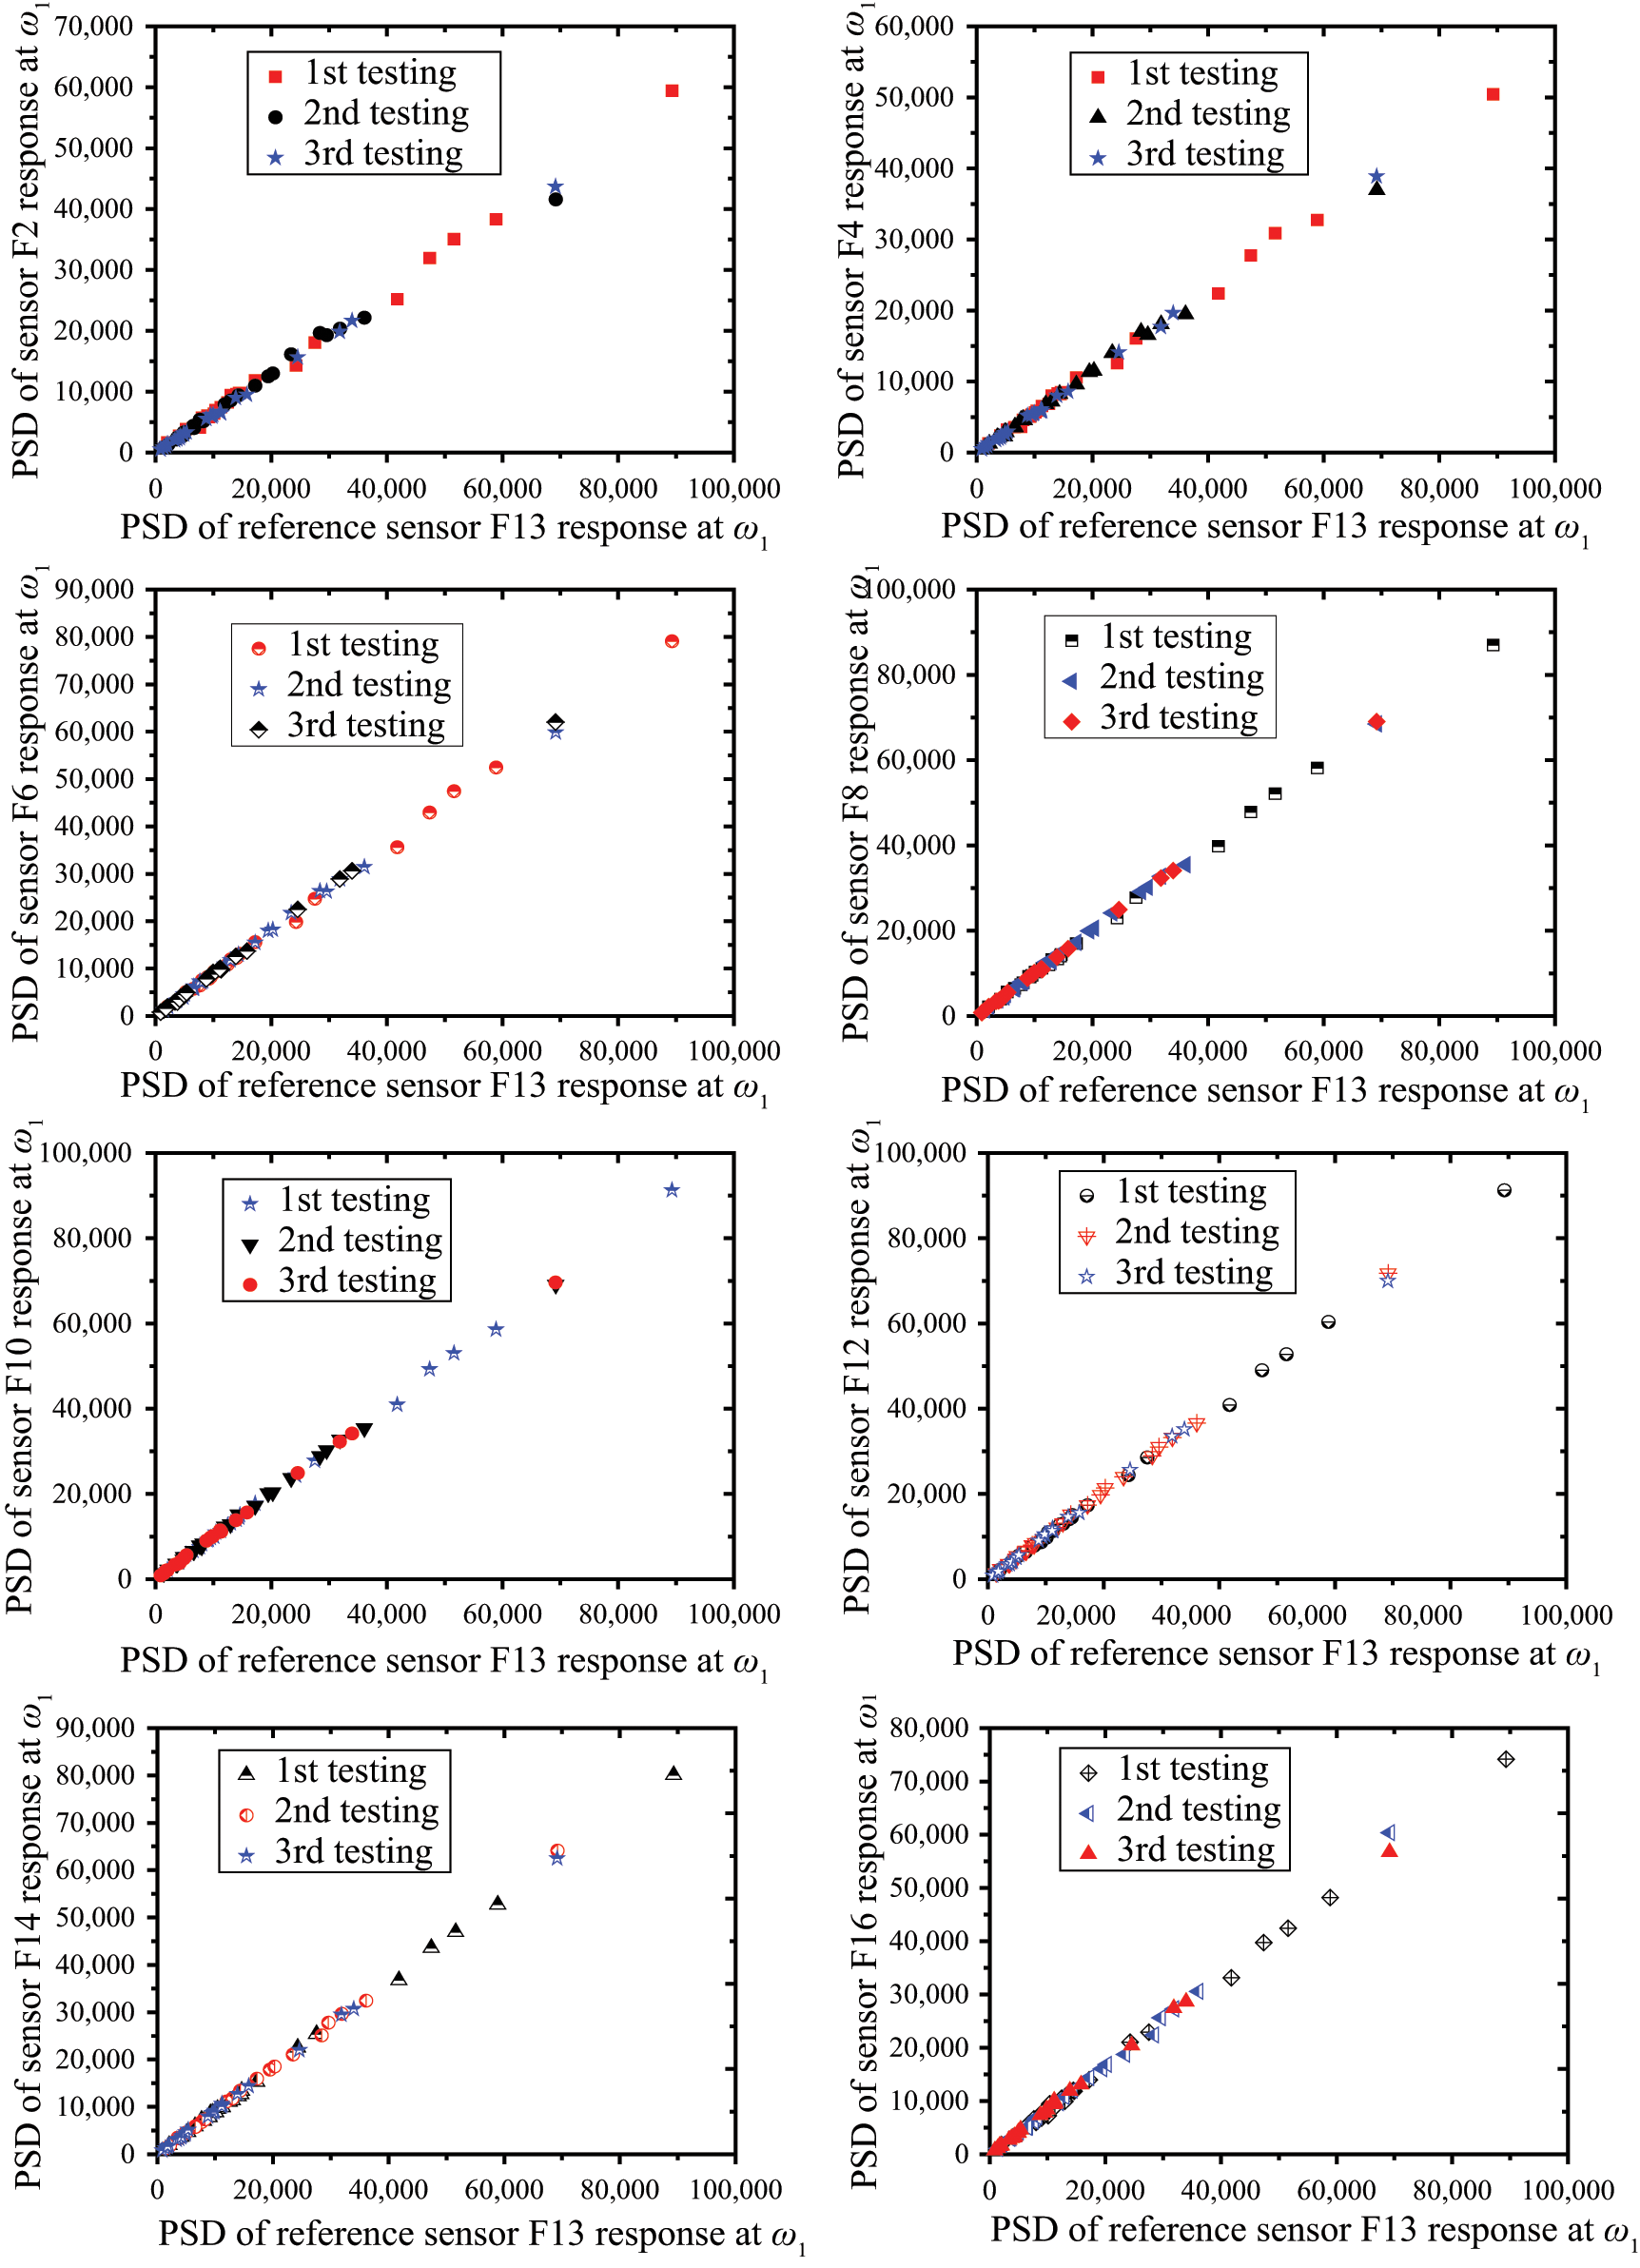
Plots of magnitude of PSDs at ω1 of target sensors against the reference sensor F13.
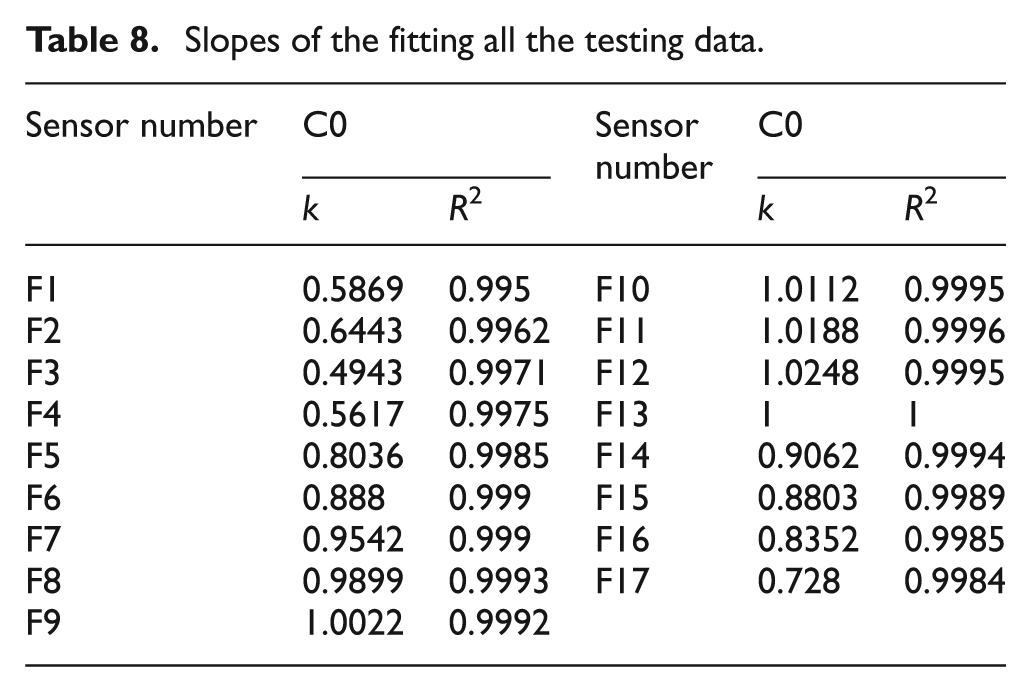
The slopes and correlation coefficients from the fitting line of all the testing data are labeled in Table 8. The perfect linear correlations show that modal macrostrain is uniquely determined by the peak value of the PSD of dynamic macrostrain response. The normalized modal macrostrain along the distance of the girder (shown in Figure 32) can therefore be obtained by substituting all the slopes into Equation (6). It is worth noting that the normalized modal macrostrain of F1 and F2 is greater than that of F3 while the normalized modal macrostrain of F1 and F2 is theoretically less than that of F3. This feature reflects the rigidity within the gauge length of F1, and F2 is smaller than the rigidity within the gauge length of other sensors. The probable explanation for this is that the region covered by F1 and F2 is greatly affected by the skewness of the right support, and the skewness leads to bad shear connection between the steel girder and the concrete deck. If there is a loss of composite action on part of a beam, it would cause loss of local rigidity and therefore cause larger modal macrostrain.
Slopes of the fitting all the testing data.
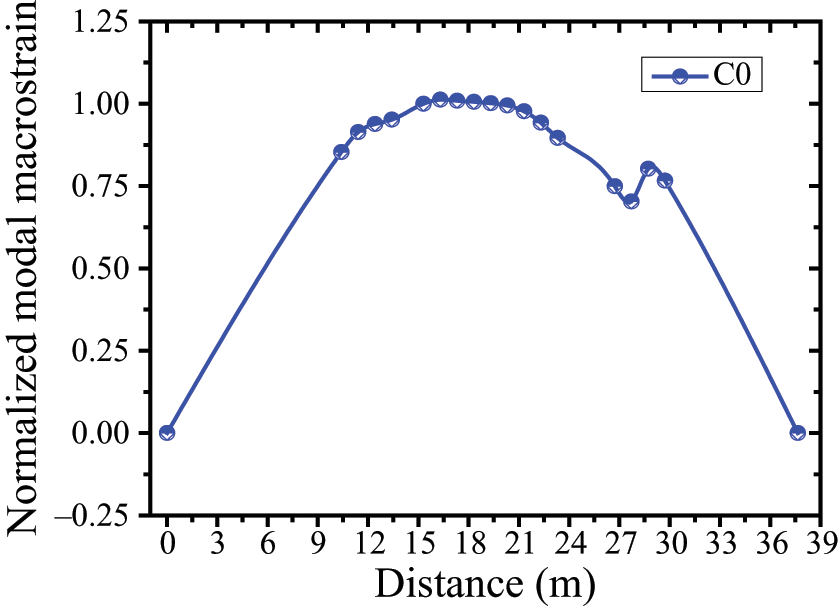
Identified modal macrostrain along the distance of the girder.
Conclusion
In this article, an output-only method has been developed to abstract modal macrostrain and identify damage of structures under ambient excitation. The basic idea is to exploit the peak values of the magnitudes of PSDs of the distributed long-gauge dynamic macrostrain response. Numerical simulation was conducted to verify the feasibility of the proposed method. The influence of typical excitations on real bridges was also investigated to prove the robustness of the method. In addition, the proposed method was applied to the real SHM of a steel stringer bridge in New Jersey using the output-only data. Some important conclusions are summarized as follows:
Both theoretical derivation and numerical simulation reveal that modal macrostrain is uniquely determined by the PSDs of dynamic macrostrain response under ambient excitation. Therefore, the peak values of PSDs of distributed dynamic macrostrain can be used for the damage indicator. Meanwhile, the damage extent has corresponding relationship with the change of normalized peak value at natural frequency.
The maximum error of the identified modal macrostrain relative to that of the modal analysis is 3% in the numerical simulation while the identified natural frequency of the real bridge monitoring is nearly the same as that obtained by traditional accelerometer.
Numerical simulation results show that the PSD-based method can accurately identify the damage, and only the first-order mode is necessary for the method.
The method is not only applicable to broadband white noise excitation but also suitable to band-limited white noise, seismic excitation, and moving load, which are the typical excitations on the real bridges.
The real structure monitoring further verifies that the PSD-based output-only method can be utilized to assess the damage state of real structures under ambient excitation.
Footnotes
This study is supported by grants from the study and application on internet of things technique for safety monitoring and emergency support on urban road and rail traffic structure group (Grant No. 2011BAK02B03), Western Transportation Construction Science and Technology Plan of China (Grant No. 2009318000055) and A Project Funded by the Priority Academic Program Development of Jiangsu Higher Education Institutions (PAPD).