






Abstract
This article proposes a new method for optimal placement of sensors for detecting damages in composite structures. The problem is formulated as a minimax optimization in which the goal is to find the coordinates of a given number of sensors so that the worst (maximum) probability of nondetection of the sensor network is made as good as possible (minimized). It is shown that a minimax approach can more efficiently place the sensors on complex geometries, compared to existing placement methods that consider average probability of detection. The method allows one to account for characteristics of sensors by assuming that the effectiveness of a sensor decreases with the distance from damage via an experimentally determined sensor probability of detection function and sensor noise in sensor network optimization. The formulation also enables to account for nonuniform likelihood of damages on the structure, which often arises due to irregular loading or boundary conditions, using a damage probability density. Numerical examples and an experimental validation study involving a Lamb-wave sensing system are presented to show the effectiveness of the proposed method.
Introduction
Load-carrying composite structures operating under tensile, fatigue, or impact loading or corrosive environments develop damages during service, including matrix cracks, debonding, and delamination. These damages are usually invisible to surface inspection, and they do not immediately result in failure. Before these damages reach critical size, the structure can continue to safely operate. However, it is important to continuously monitor the integrity of the structure in order to detect these damages early and prevent them from exceeding critical size and resulting in catastrophic failure. Commonly used nondestructive evaluation (NDE) techniques, including x-ray and ultrasonics, require significant labor and disassemble/reassemble time of the components for inspection (Diamanti and Soutis, 2010). Structural health monitoring (SHM) system that utilizes a set of built-in, distributed sensor network embedded within composite structures has proven successful as a cost-effective alternative to overcome the shortcomings of NDE. It enables to more accurately detect and locate damages. SHM can result in significant cost reduction (by eliminating unnecessary maintenance) and weight savings (by avoiding over safe designs).
In this article, we focus on sensor placement aspect of health monitoring. While many aspects of SHM, including damage detection and characterization, have been studied extensively by many authors in the SHM literature (see e.g. Worden and Manson, 2007), the sensor placement problem received relatively small attention. Teo et al. (2009) proposed a sensor placement approach using the scattering of stress waves as the damage detection tool and optimizing the average probability of detection (POD) on the structure. Markmiller and Chang (2010) optimized the locations of a set of surface bonded piezoelectric sensors measuring strain during impact using a finite-element analysis (FEA) model and genetic algorithms. Worden and Staszewski (2000) used a neural network to locate and quantify the extent of impacts from signals of a sensor network in order to find the best sensor locations. Guo et al. (2004) used genetic algorithms to search for optimal sensor locations based on modal testing data. Hiramoto et al. (2000) used the explicit solution of the algebraic Riccati equation to solve for the optimal locations of actuators and sensors in a vibration control system.
In this study, the damage detection algorithm is assumed to be given and we focus on the sensor placement aspect. The detection problem has been studied extensively by many authors. Worden and Manson (2007) proposed a neural network and feature selection approach for damage detection from vibration response of aircraft structures. Sohn et al. (2001) considered time series modeling and Mahalanobis distance outlier analysis for damage detection. In our article, we will follow an outlier analysis for damage detection.
Due to the cost of installation of sensing elements and wiring and reduced structural integrity concerns, it is typically not desirable to very densely place a large number of sensors on a structure; therefore, optimal selection of sensor location is an important problem. This article proposes a new minimax approach to find the optimal number and location of sensors in health monitoring of composite structures by minimizing the maximum (worst) probability of nondetection (POND) of a damage/impact anywhere on a two-dimensional plane structure. In structural applications, it is crucial for safety reasons that a damage or impact does not go undetected. In minimax problems, we would like to make the poorest response as good as possible; therefore, it is an appropriate measure for health monitoring. By contrast, in the commonly applied average probability based approaches the overall response is made as good as possible.
The proposed method assumes that the effectiveness of a sensor decreases with the distance from damage. The field of effectiveness of a sensor, referred to as the sensor probability of detection function (SDF), is statistically estimated by fitting an exponential decay function to experimentally observed POD values. The statistical model allows one to account for sensor noise in the optimal solution through the use of confidence intervals of mean response. The formulation also enables to account for nonuniform likelihood of damages on the structure using a damage probability distribution (DPD) function.
Most structural damage detection and location methods in the literature examine the changes in the measured structural vibration response such as the modal frequencies, mode shapes, and stiffness coefficients. The vibration-based damage detection can be either active or passive. The passive methodologies consider only the responses to operational vibrations, while the active algorithms exert an auxiliary excitation by means of an actuator to the system and examine the system response (Doebling et al., 1996). In this article, we will employ an active Lamb-wave–based actuator–sensor system for damage detection. More details on the sensor system used are provided in section “Damage detection with Lamb waves and experiments to quantify SDF and sensor noise.”
Best location of sensors is a well-studied problem in the operations research and optimization literature, as well in application areas including placement of sentries along a border to detect enemy penetration, facility location, and detection of hazardous events (Cavalier et al., 2007). Drezner and Wesolowsky (1997) formulated the problem of locating identical sensors on a unit line and a unit square as an optimization problem, called the minimax problem, in which the objective is to minimize the maximum POND. They considered exponential decay and power decay sensor detection probability functions and proposed a special algorithm for the unit line case that can achieve the necessary condition for optimality. The minimax problem is a difficult nonlinear nonconvex problem even in the case of two sensors. Cavalier et al. (2007) studied the minimax sensor placement on a plane and proposed a heuristic based on Voronoi polygons. It is shown that the proposed heuristic can quickly generate high-quality solutions for networks with large number of sensors.
The remainder of the article is organized as follows. Section “Proposed minimax sensor placement approach” presents the optimal sensor placement methodology. Section “Damage detection with Lamb waves and experiments to quantify SDF and sensor noise” discusses the piezoceramic sensing system used in the article and the experiments conducted to determine sensor characteristics. Section “Examples” illustrates the application of the proposed method with numerical examples. In section “Experimental validation of the approach,” the proposed sensor placement method is illustrated from data obtained from experiments. In the experiments, composite panels were subjected to controlled size of damages, and the damages are detected with sensors. Different sensor placement configurations were compared. Section “Conclusion and future work” gives the concluding remarks.
Proposed minimax sensor placement approach
Suppose that a damage can happen on the structure at location given by a two-dimensional coordinate vector
We will consider the exponential decay function sensor probability function (Drezner and Wesolowsky, 1997)

where
It should be noted that other types of sensor functions may be used depending on the application. For example, a power decay function can be defined as (Cavalier et al., 2007)

where
The proposed methodology assumes that the likelihood that damage occurs at different locations on the structure may be nonuniform. This is incorporated in the formulation using a DPD function,
The minimax criterion will place the sensors so that the maximum POND anywhere on the structure is made as small as possible. Suppose we want to place

Thus, we want to find the set of sensor locations

is made as small as possible. Therefore, the minimax problem is defined as


and the solution of this problem
The DPD function

The effectiveness of the proposed minimax approach will be compared to the existing sensor placement method studied by Markmiller and Chang (2010), which is based on maximizing the average POD by the sensor network. To be equivalent with the proposed method, we will formulate the Markmiller and Chang method as the minimization of the average POND. An advantage of average POND-based methods is that they are simple to compute. However, they have various shortcomings, including not being able to account for complex, nonuniform loading conditions in the optimal solution. The average POND for a sensor network can be defined in the following. Suppose we want to place m sensors attached on the plate and that damage at a location

The indicator variable is defined by specifying in the SDF an appropriate threshold probability

The average POND for all damages on the plate is found by considering a grid of

The placement of the

Damage detection with Lamb waves and experiments to quantify SDF and sensor noise
Due to environmental fluctuations and variations in material properties, the sensor systems have variable performance in detecting defects. One advantage of the proposed minimax approach is the ease with such variations can be taken into account for sensor placement. In this section, we present an experimental study we conducted to quantify the variability in the SDF of a Lamb-wave sensor. In section “Examples,” we will show how to design an optimal sensor network while accounting for sensor noise using the SDF and its variability modeled in this section.
We will use a Lamb-wave sensor system for our experiments (Qing et al., 2006). Lamb-wave propagation-based piezoelectric sensor arrays are becoming more popular in health monitoring of aerospace and civil structures due to their low cost, good performance, and ease of installation (Ihn and Chang, 2004; Kessler et al., 2002). For damage detection, a piezoelectric actuator and a sensor are bonded on surface or embedded between layers of multilayered carbon fiber-reinforced polymer composite laminate. For health monitoring, diagnostic wave forms are generated by the actuator, and the resulting structural response is measured by the sensor. Cracks or defects that exist in the material between the actuator and the sensor are detected based on the difference in the shapes of the transmitted and the received signals. The time of flight of the wave packets from the actuator to the transducer can further be used to locate the damage.
The experiment is conducted on a 10 × 26-in. three-ply composite laminate. We used IM7–GP 12K carbon fibers from Cytec, and the thickness of the three-ply laminates after resin infusion was 0.035 in. Polyester resin and a fiber volume fraction of 40% were used in the infusion process. Two piezoelectric sensors are attached 24 in. apart as shown in Figure 1(a). Both sensors are set to work in a pulse–echo mode; that is, they work as both actuators and sensors. A three-peak, 20-V amplitude and 400-kHz sine wave burst with a Hanning window was used as the actuator signal. The amplitude, frequency, number of cycles of the actuator signal were determined in a preliminary experiment to minimize the amount of dispersion in the actuator signal group velocities. Figure 1(b) shows the actuator wave form used in the tests.
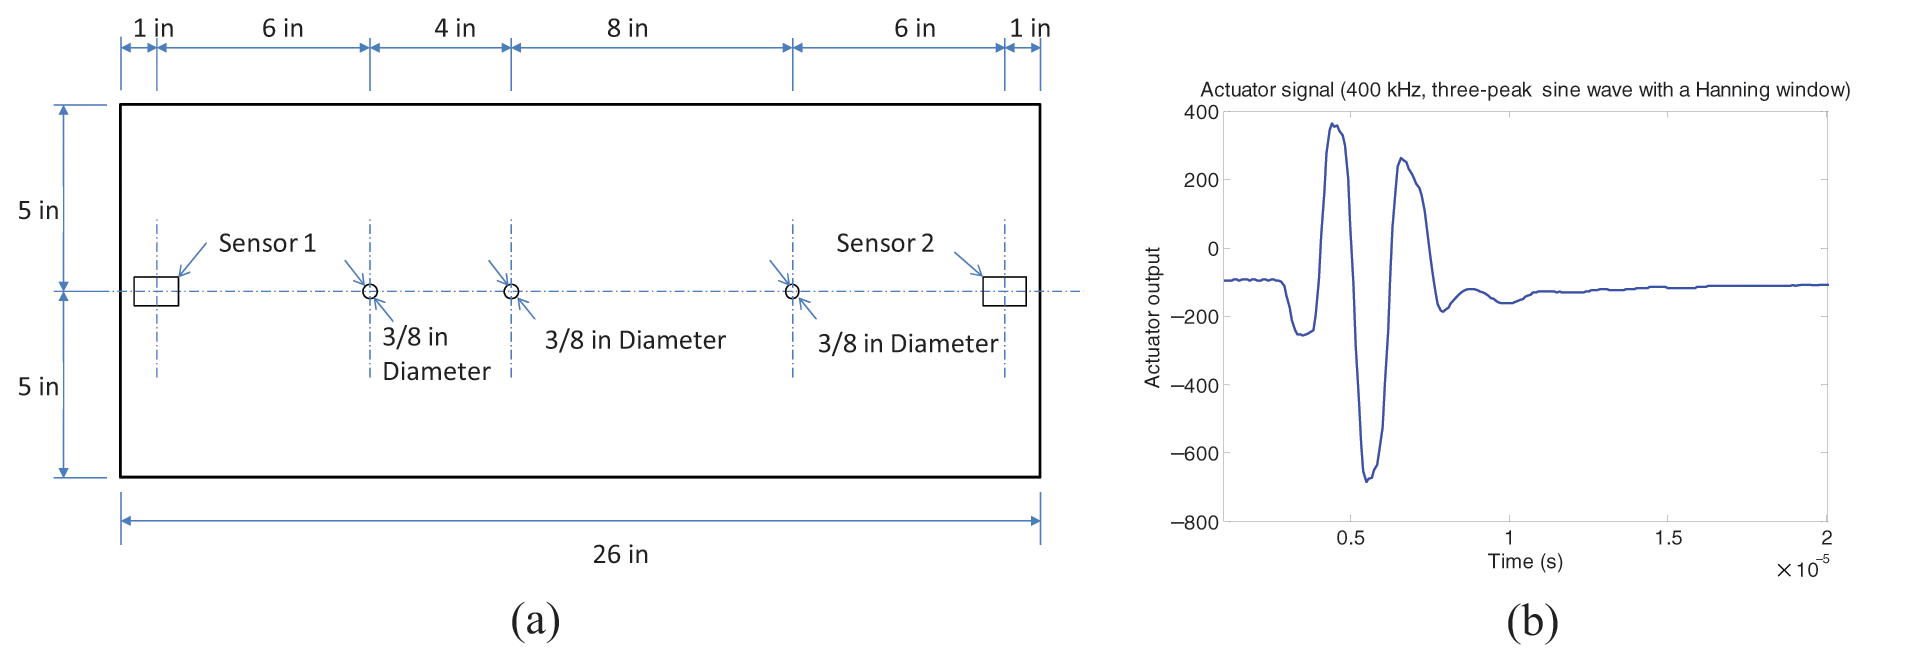
(a) Damage experiment setup: 10 × 26-in. composite laminate, sensors S1 and S2, and the damages generated with 3/8-in. drill bit. (b) Actuator signal for detecting damages: 400 kHz and three-cycle sine wave.
Using the above actuator signal, we conducted a set of damage experiments in which 3/8-in.-diameter holes were created 6, 10, and 18 in. away from the actuator on the left (sensor S1 in Figure 1(a)). Note that when we set the sensor on the right (Sensor2 in Figure 1a) as the actuator, we obtain another set of measurements from the same damages. Therefore, a total of
Damages were created sequentially on the same panel, and a given damage is detected by considering the previous damage as the baseline. In order to minimize the effect of interactions between sequential damages, the order of the damages is randomized. The randomized order of the experiments was 6, 18, and 10 in. Thus, for the damage at 18 in., the damage at 6 in. was the baseline, and for the damage at 10 in., the damage at 18 in. was the baseline.
In each test, the damage is detected by comparing the sensor signal in the damaged state to the sensor signal from the baseline state. Figure 2(a) shows the signals from the baseline and damaged states obtained for the damage at 10 in. It can be seen that the amplitude is attenuated due to the reflection of the wave from the damage. The change in the time domain signal due to the damage is measured as the reduction in the power spectral energy in the frequency domain and is obtained by taking the Fourier transformation

where


(a) Sensor signal in the baseline and damaged cases. Consider the sensor signal for time interval of 20–25 µs. (b) FFT of the signal. FFT plots of baseline and damaged signal. Take the integral between 200 and 600 kHz.
The area under the power spectral density

The range of the integration was set between 200 and 600 kHz since there were no other significant frequency components outside this range.
It is important to point out that even though the excitation frequency is 400 kHz, it is expected that the response of the structure contains frequencies below 400 kHz (because of material damping of the vibrations); however, no frequencies to be present in the response above 400 kHz. In Figure 2(b), the few small frequency peaks seen above 400 kHz are possibly due to the spurious high-frequency components introduced from the leakage effect in the Hanning window process and also because the actual excitation frequency may vary slightly from the setting of 400 kHz.
The DM values computed from the sensor signals of the different damages are shown in Figure 3(a), which shows a reduction with the distance from the actuator, as expected. An exponential SDF (1) was fitted to these observations using least squares. This can be written as a linear regression after a logarithm transformation on the response as

where the new intercept is


Estimation of the SDF. (a) Experimental observations of DM. (b) Least squares model for SDF. Solid line is the mean SDF values and dashed lines are the 95% confidence intervals.
Denote the estimates of the linear model from the above Minitab output as

where
Examples
In this section, we illustrate the application of the proposed method with two numerical examples.
Placement of two sensors on a line
Consider the case of placing two sensors on a one-dimensional line of length 10 in. as shown in Figure 4. This is a simple problem that can be solved with exhaustive search without requiring any special optimization software; however, it will provide intuition for more complex cases. The damage coordinate is
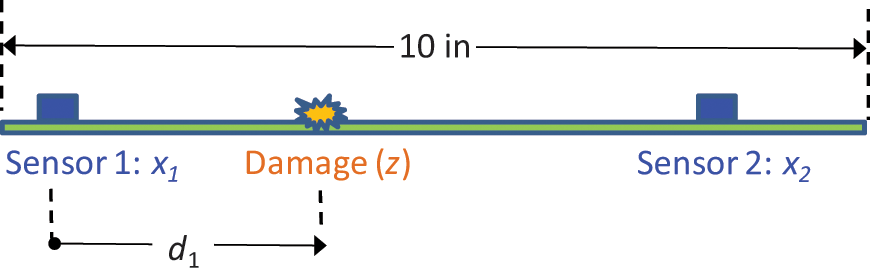
Placement of two sensors on a line.
We will compare the solutions of the proposed minimax POND problem (4) to the average POND problem (8) studied by Markmiller and Chang (2010). We initially consider two arbitrary sensor placement configurations: placement 1 at (3.33, 6.67) and placement 2 at (1.70, 8.30). The first placement has the sensors equally spaced and second one as we will see later is the optimal placement according to the minimax rule. Figure 5(a) and (b) shows the
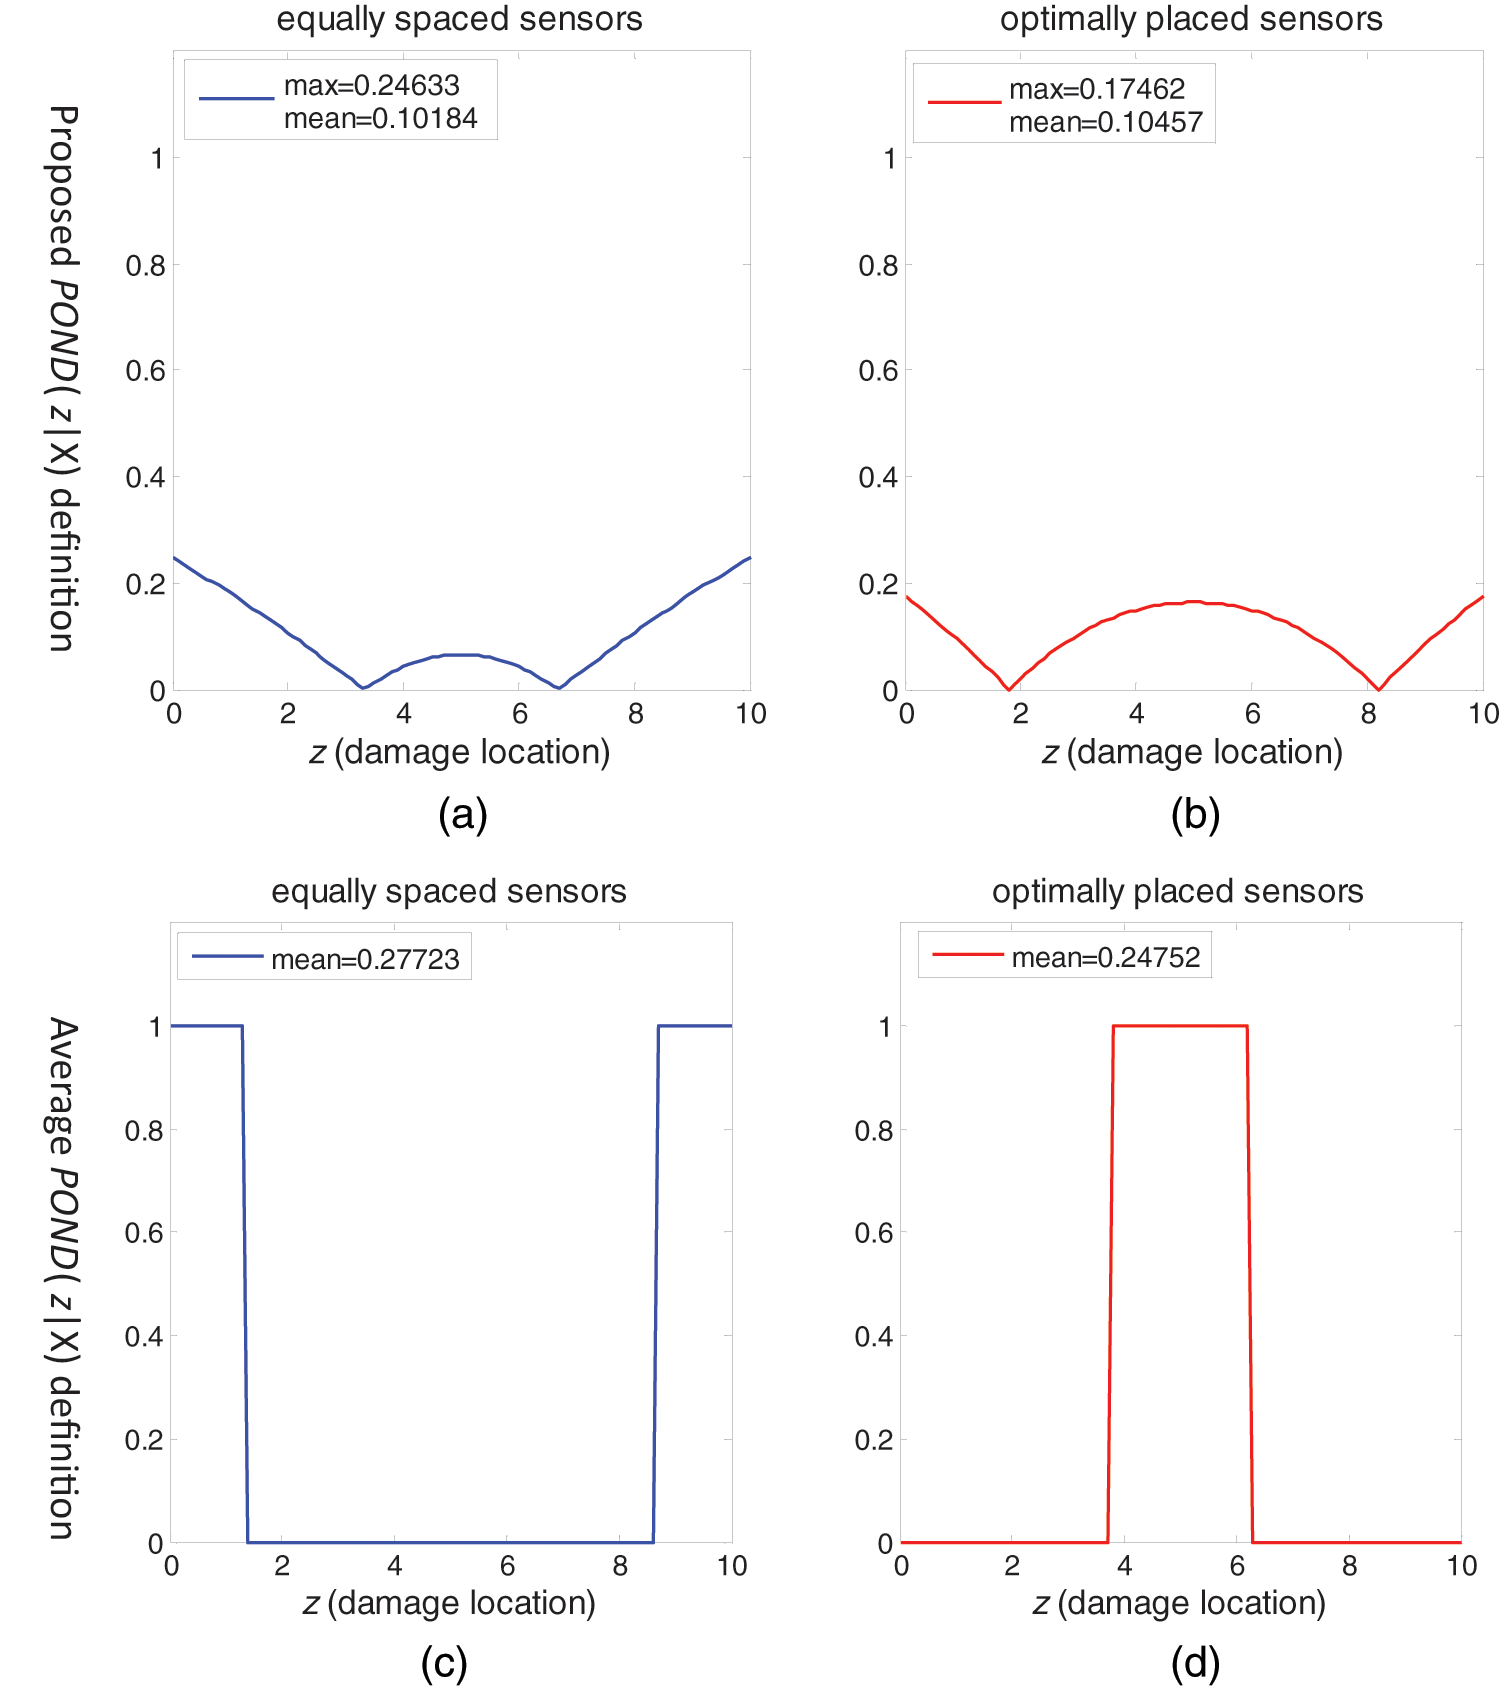
(a and b) Proposed POND definition and (c and d) average POND definition from the literature for two sensors on a line. (a) and (c): equally spaced sensors
We will next illustrate how to find the optimal solution
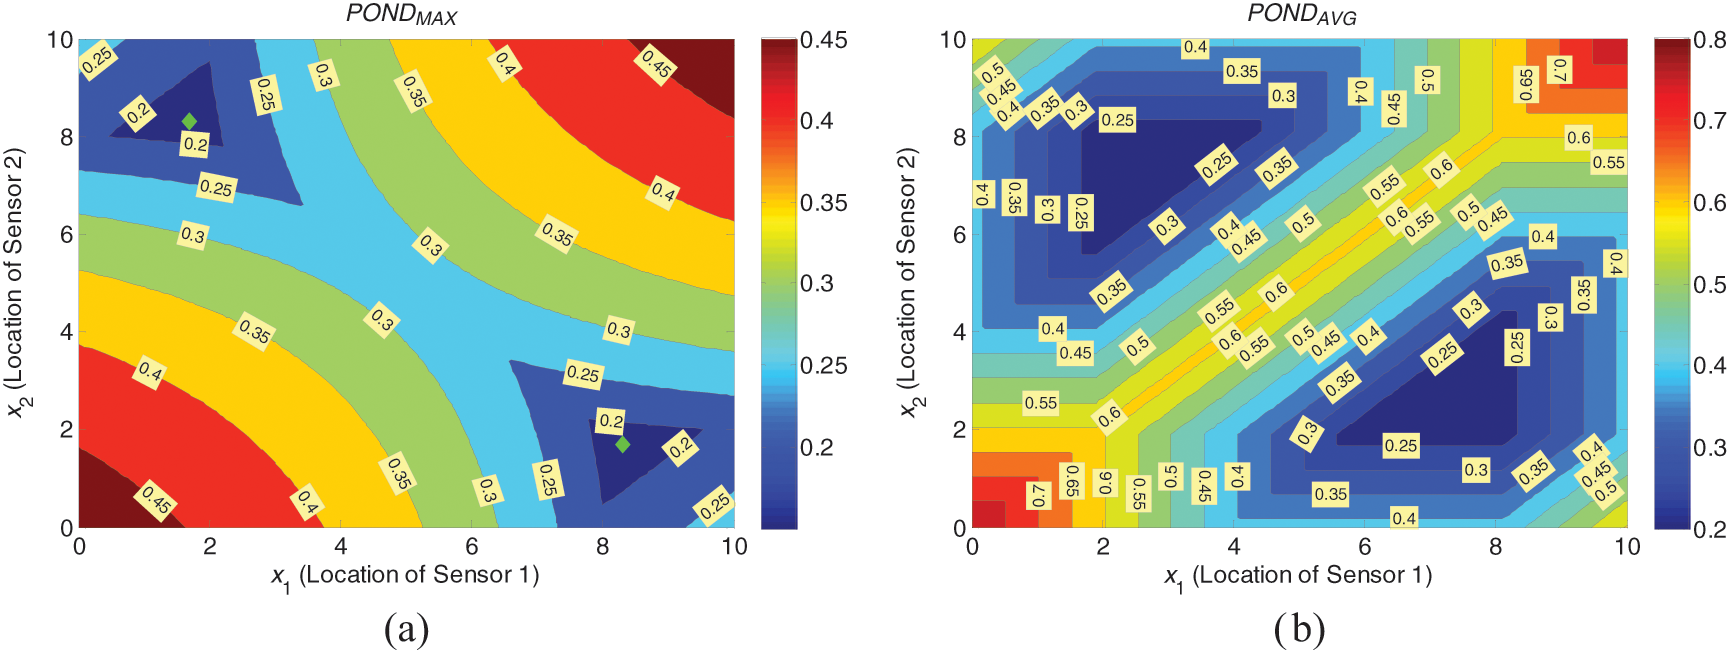
(a) Contour plot of
Placement of m sensors on a panel
The general case of the placement of
Consider a 12 × 12-in. square panel structure and suppose we want to place four sensors on the panel. We consider the two DPDs shown in Figure 7. Figure 7(a) is a uniform DPD that assumes it is equally likely to have damage anywhere on the panel while Figure 7(b) is a nonuniform DPD that assumes that it is more likely to have damages near the left edge (i.e.
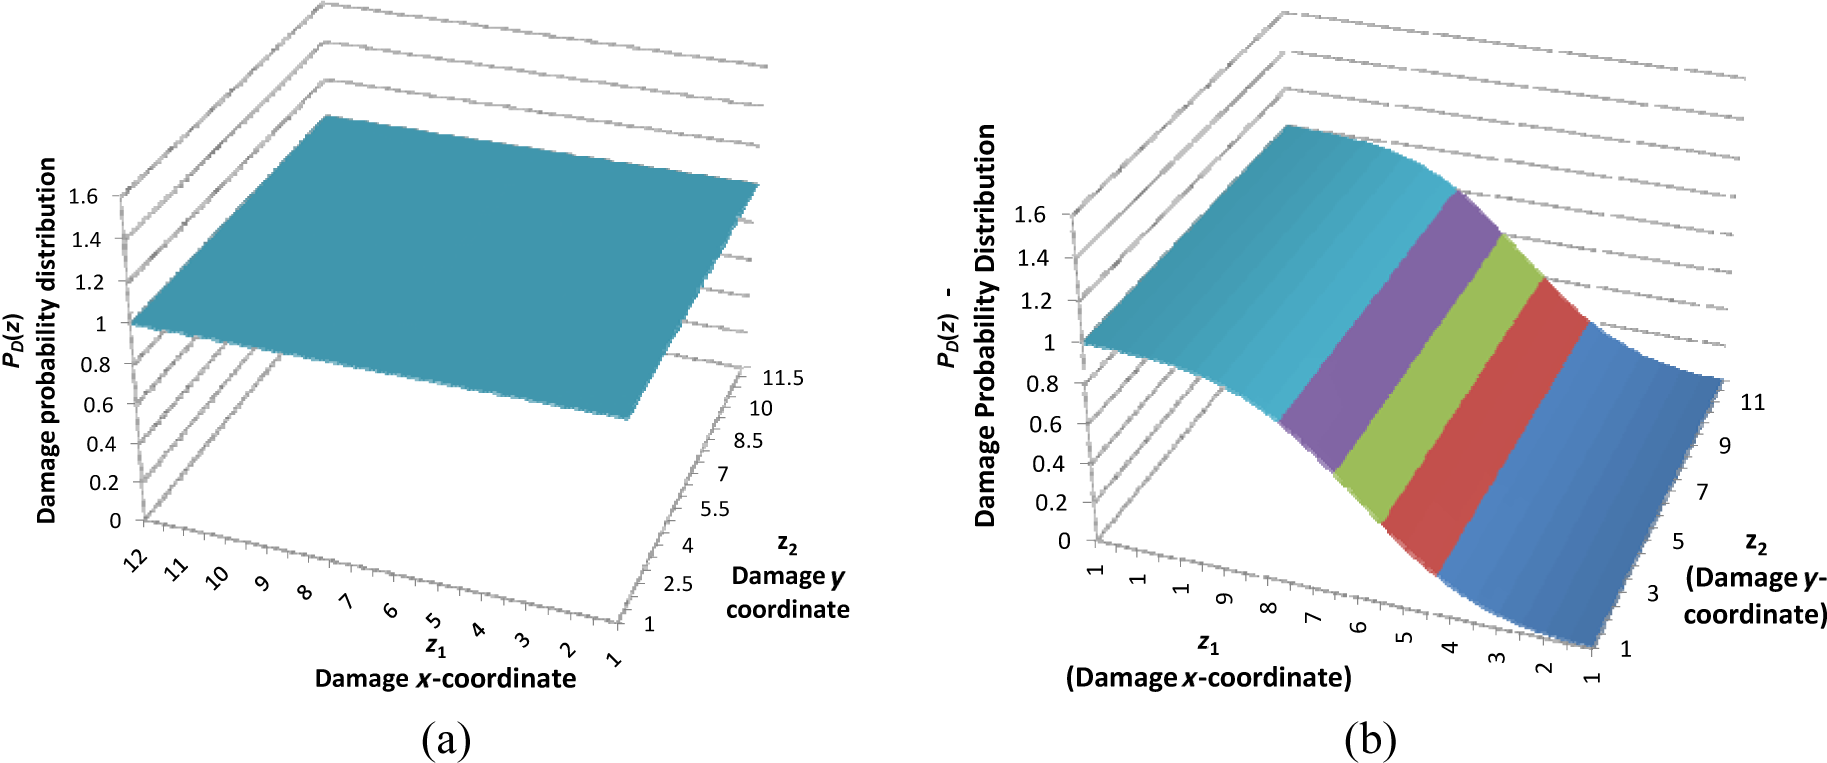
DPDs considered. (a) uniform DPD and (b) nonuniform DPD.
We solve the placement problem with the minimax POND and average POND approaches. The optimum sensor locations obtained for the uniform DPD are shown in Figure 8(a). It can be seen that the minimax POND approach places the sensors closer to the edges of the plate to minimize the worst POND. By contrast, the average POND approach optimizes the average (overall) performance, which results in sensors being placed closer to the center of the plate. Figure 8(b) shows the contour plots of the POND values calculated at a grid of on the plate points (the grid points are shown in Figure 8(a) as “dots”) under the two optimal placements. The worst POND values under the minimax solution is 0.577 (occurs near the center of the plate) and for the average POND solution is 0.645 (near the edges of the plate), indicating a more effective detection coverage throughout the plane by the minimax solution.
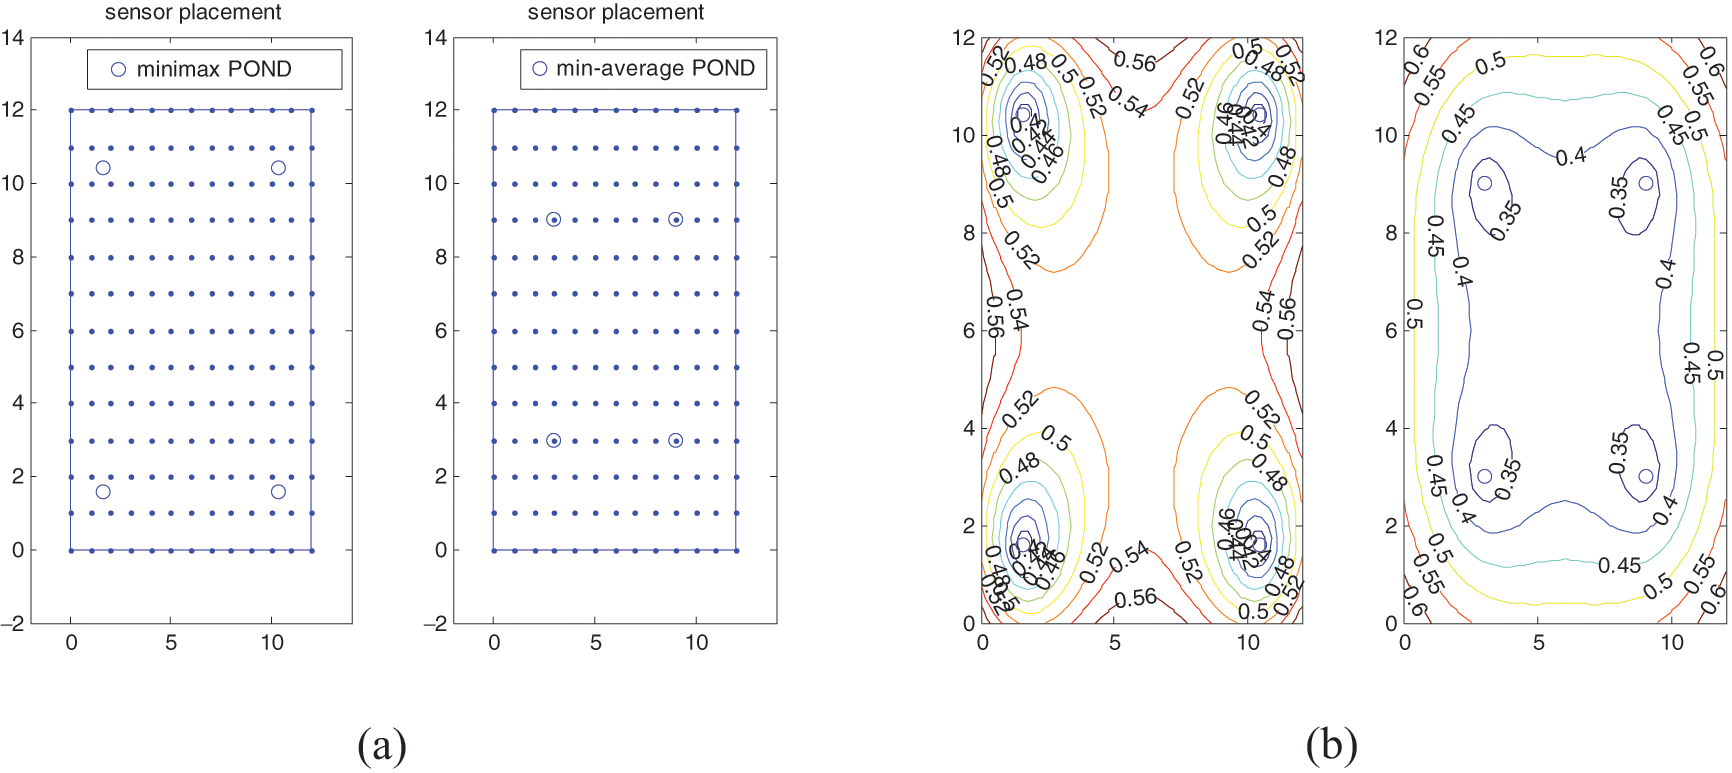
Results for uniform DPD from minimax POND and min-average POND approaches: (a) optimal sensor placements and (b) distribution of POND values with respect to x- and y-coordinates of the plate.
The optimum sensor locations obtained for the nonuniform DPD are shown in Figure 9(a). In this case, the top half of the plate has higher chance of experiencing damages; thus, both solution methods locate more sensors near the top edge of the plate. The minimax POND approach places the sensors approximately on a line because the constant DPD curves form a straight line (see Figure 7(b)); by contrast, the average POD approach places the sensors in a rectangular form because it considers the average probabilities. The POND values calculated at the grid points of the plate under the two optimal placement cases are shown in Figure 9(b). The worst POND values under the minimax and the average POND solutions are 0.355 (occurs near the top edge of the plate where the loading is higher) and 0.555 (near the side edges of the plate), respectively, indicating a more effective coverage by the minimax placement under nonuniform loading.
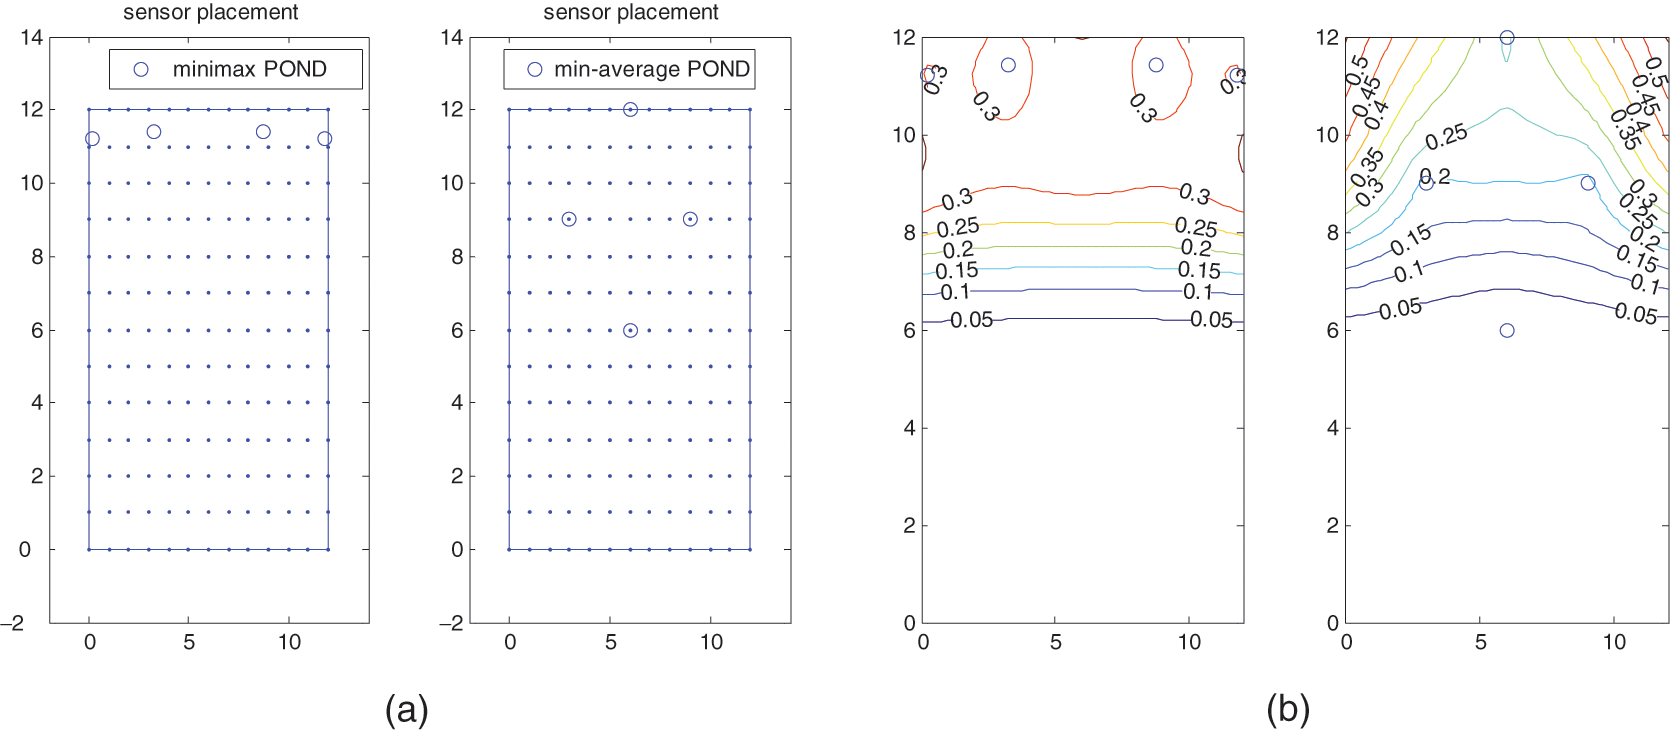
Results with nonuniform from minimax and min-average approaches: (a) optimal sensor placements and (b) distribution of POND values on with respect to x- and y-coordinates of the plate.
The distribution of POND values reported in Figures 8(b) and 9(b) for the uniform and nonuniform DPD cases, respectively, are combined and compared in Figure 10. As it can be seen, minimizing the maximum POND to select the sensor locations achieves a lower maximum (worst) nondetection probability than minimizing the average POND under both the uniform and nonuniform damage probabilities. This is a desirable property of the minimax method and is achieved because the objective in the minimax approach is to find the sensor locations so that the worst performance is made as good as possible. Moreover, as seen in Figure 10, the improvement in the maximum POND using the minimax over the average POND is larger under the nonuniform DPD (from 0.555 to 0.355; a 36.0% reduction) than under the uniform DPD (from 0.645 to 0.577; a 4.4% reduction). Since in nonuniform loading and damage probabilities will be more common in engineering structures, the minimax approach is expected to have more benefits in these cases for damage detection.

Distribution of the POND values and using the proposed minimax and average POND approaches under (a) uniform DPD and (b) nonuniform DPD.
Next consider the design problem for the sensor network in which we would like to find how many sensors we should use and where we should place them so that we can detect at least 75% of the damages on the panel. We want to achieve this by accounting for our uncertainty in estimating the sensor detection function. We assume that Lamb-wave sensors are used and use the SDF and the confidence intervals estimated in section “Damage detection with Lamb waves and experiments to quantify SDF and sensor noise” to account for sensor noise. Consider the uniform DPD case only and assume the sensors are identical. We solve the minimax problem for

Optimal solutions for 4-, 5-, 6-, and 10-sensor networks.
In order to determine the number of sensors, we use simulation to incorporate sensor noise in

(a) Simulated SDF curves using the distributional properties of the regression model fitted in section “Damage detection with Lamb waves and experiments to quantify SDF and sensor noise.” (b) Simulated
Applying a one-sample t-test on these simulated values, we construct a 95% confidence interval on the true

Confidence intervals of the
Experimental validation of the approach
The experimental validation of the proposed sensor placement method was performed on the piezoceramic sensor system. We considered the case of placing four sensors on three-ply, 12 × 12-in. carbon fiber laminates (thickness = 0.035 in.) and compared the effectiveness of two different sensor placement arrangements: (a) an arbitrary layout in which the sensors are placed at the corners of the plate and (b) the optimal placement from the minimax approach.
The two sensor layouts considered are shown in Figure 14(a). Since there are four sensors, there are 12 paths for all pair of sensors: path between sensors 1–2, 2–1, 1–3, 3–1, 1–4, 4–1, 2–3, 3–2, 2–4, 4–2, 3–4, and 4–3. We calculate the DM for each of these paths. A damage is detected to exist if the measured DM is significantly different from a reference state in which there are no damages. We conclude that there is a damage if

where

(a) Optimal and arbitrary sensor layouts and the damage locations. The damage locations are shown as asterisks, the optimal sensor layout is shown as diamonds, and the arbitrary sensor layout is shown with squares. (b and c) The composite panels with sensors installed according to the optimal (b) and arbitrary (c) configurations.
The effectiveness of the two layouts in detecting damages was tested by generating a set of 3/8-in. holes on the two plates at the locations shown in Figure 14(a). The experimental setup for the two sensor layouts is shown in Figure 14(b) and (c). The damages are created in a randomized order (as in the previous example) so that the effect of the interactions between the sequential damages on the damage detection measure is averaged. Similar to section “Damage detection with Lamb waves and experiments to quantify SDF and sensor noise,” the signal obtained for a damage was used as the baseline for the damage generated subsequently.
One requirement of the Lamb-wave sensors is that there should be a straight line between pairs of sensors in order for the structural damages lying on the line joining them can be detected. In order to cover all damages created inside the panel, we included a constraint in the minimax problem so that the sensors are placed on the edges of the plate not the interior of the plate. The optimal sensor layout shown in Figure 14(a) is obtained by solving this constrained optimization.
In comparison to the two sensor case studied in section “Damage detection with Lamb waves and experiments to quantify SDF and sensor noise,” where we had only two sensor paths (S1 S2 and S2 S1) in the four-sensor case, we have 12 paths. The existence of damage on the plate was determined from defining a network DM that combines the DI information from all sensor paths

where
Figure 15(a) compares the

The overall
If we use 3 as the threshold for each
Conclusion and future work
This article presented a new minimax optimal sensor placement approach for composite structures. The effectiveness of the propose method was illustrated by comparing it to existing sensor placement approaches from the literature on two numerical examples and a case study that is based on a real composite panel structure and a Lamb-wave sensor network. It was shown that the proposed method can provide sensor layouts with significantly higher correct damage detection rates than existing average POND-based methods.
The proposed method places a fixed number of sensors on a structure with a specified geometry such that the maximum or worst POND (
Another advantage of the proposed method is the ease with which the loading and boundary conditions can be taken into account in sensor placement. Due to irregular or complex loading or boundary conditions, the likelihood that a damage can occur on the structure may be highly nonuniform. It was illustrated how the POND formulation can be easily adjusted to include a DPD to account for such conditions. It is not clear how to incorporate the DPD in the existing average POD-based methods.
In experiments, we considered a fixed damage size to illustrate the placement methodology. The sensitivity of detection of the sensor network will is expected to reduce with smaller damages. However, since the objective was sensor placement, the improvement of damage detection performance was not considered in this article. Possible extension of the placement methodology would be to incorporate more advanced detection algorithms with the placement optimization approach.
Other areas of future research include developing placement algorithms robust to sensor noise and material property variations and formulating methods to incorporate FEA model results for determining DPD functions based on the boundary and loading conditions.
Footnotes
Acknowledgements
The authors acknowledge the helpful comments from the referees, which helped in improving the article significantly.
This research was supported by National Science Foundation (grant number CMMI-0969413) and Florida State University, High Performance Materials Institute.