
Abstract
In cylindrical structures such as pipelines and pressure vessels, cracks are most likely to occur along the longitudinal (axial) direction, and they can be fatal to the serviceability of the structures. However, the conventional wave propagation–based crack detection techniques are not sensitive to this type of cracks. This article focuses on the identification of axial cracks in cylindrical structures using torsional wave generated by piezoelectric macro-fiber composite. The first-order torsional wave, which is a nondispersive pure shear wave propagating at a fixed wave speed, is utilized in this work because, intuitively, it is more sensitive to axial cracks than the longitudinal waves. The crack position is determined by the time of flight of the wave pack, while the crack propagation is monitored by measuring the variation in the crack-induced disturbances. Numerical simulations have been conducted to investigate the feasibility of the proposed method, and experimental tests on aluminum pipes have been carried out for verification. Macro-fiber composite transducers oriented at 45° against the axis of the specimen were used to generate and receive the torsional waves. The experimental results demonstrated that the crack position can be identified, and its growth can be well monitored with the proposed approach.
Keywords
Introduction
Cylindrical structures are widely used in many fields of oil and gas production and power generation. In such industries, failures of structures usually lead to billions of dollars in losses. Furthermore, irreversible damage is brought to the surrounding environment and the human beings in adjacent areas. According to the statistics of Research and Special Programs Administration in US Department of Transportation, Office of Pipeline Safety (RSPA/OPS), from 1 January 2002 to 31 December 2003, almost half of the pipeline failures happened in the United States came from material defects, corrosions, and manufacturing flaws. Such failures could have been prevented at the incipient stage if the damages were identified, monitored, and repaired as needed.
Even in the structures such as long beams, plates, and gears, axial crack monitoring is essential. When crack is initiated, it can propagate in many directions, including axial direction. In the recent past, there has been an increase in structural health monitoring (SHM) of engineering structures using various piezoelectric methods (Annamdas and Yang, 2012; Giurgiutiu, 2007; Tang et al., 2011; Yang et al., 2009). In addition, SHM of tubular structures has also increased in recent decades. However, the commonly used nondestructive testing (NDT) methods (Kim et al., 2004; Mandayam et al., 1997; Ong et al., 1994) are limited in application to cylindrical structures because of the massive work involved and the unsatisfactory reliability of the results. The accessibility of testing equipments of such methods also limits the SHM of continuous cylindrical structures. For example, in order to locate the existing cracks in pipelines, “smart pig” (Cordell, 1994) has to be pumped through the pipeline, which needs to be shut down temporarily for the inspection.
In order to achieve real-time online monitoring, guided ultrasonic waves which can propagate long distance in the structures with little attenuation are usually used for long-range SHM. Demma et al. (2003) did quantitative research on the reflections of fundamental axisymmetric torsional wave modes obtained from defects of both numerical and experimental studies. Hayashi and Murase (2005) studied the defect imaging technique, which included both axisymmetric and nonaxisymmetric wave modes. Kannan et al. (2007) used magnetostrictive tape transducer to generate guided waves which can cover large area for detecting radial saw cuts and drilled holes. Mu et al. (2007, 2008) used circumferentially distributed phased-array transducers to focus waves at any given distance to achieve focal scan. These works are all based on pulse–echo method. Pulse–echo method is good at locating the position of the defects, but it is not good at quantitatively evaluating and monitoring the severity of the defects. To activate the axisymmetric wave modes, the circumference of the pipe has to be fully covered by transducers. However, the experimental setups are not easy to apply for online monitoring of continuous cylindrical structures, especially when the structures are under extreme conditions (similarly for the submarine or underground pipelines).
The above-mentioned works only considered the detection of circumferential cracks, notches, or drilled holes. However, when cylindrical structures are used as pressure vessels, the inner pressure tends to cause cracking along the axial direction rather than the circumferential direction. This article presents an innovative in situ self-sensing monitoring system for detecting and monitoring axial cracks in cylindrical structures. In this system, macro-fiber composite (MFC) transducers are used as both actuators and sensors. Both pulse–echo method and through-transmission method are used to detect and monitor the position and growth of the crack, respectively. Mode extraction technique is used to extract the target wave mode from the received signals. Root-mean-square deviation (RMSD) crack index is used to monitor the crack growth. The experimental results demonstrated that both the position and growth of the crack can be captured by the proposed SHM system. When multiple transducers and switch box are integrated with computer-aided intelligence, online SHM of continuous cylindrical structures can be achieved.
Theory
Guided waves propagating in structures have been investigated since the late 1800s. Rayleigh (1885) studied the time harmonic wave propagating in half-infinite isotropic solid media. Lamb (1917) divided the guided waves propagating in plate into symmetric and asymmetric modes. Pochhammer (1876) and Chree (1889) derived the frequency equation to describe the wave motion for guided wave propagating in cylindrical rod. Ghosh (1923) investigated the longitudinal vibration of a hollow cylinder. Gazis (1959a, 1959b) formulated a semi-analytical solution of wave propagating through an infinitely long hollow cylinder, whose governing equation is
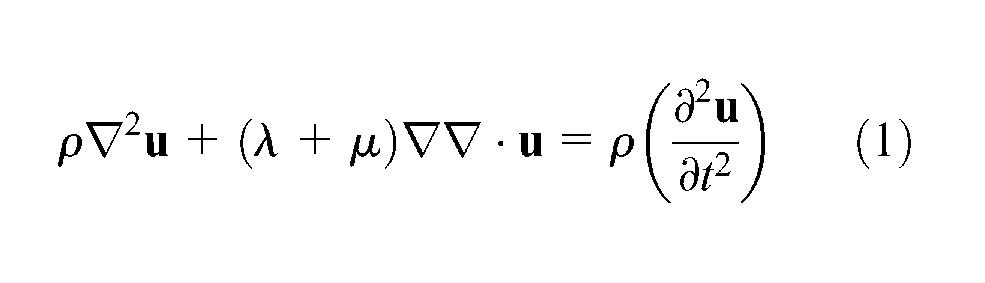
where ρ is the density of the material, λ and µ are the Lamé constants, and
When the pipe radius is more than 10 times the pipe wall thickness, the pipe is considered as a thin-wall structure, where the existed wave motions can be categorized into three groups according to the particle motion directions, as shown in Figure 1, that is, (1) longitudinal wave modes L(0, n) where only longitudinal displacement uz is involved, (2) torsional wave modes T(0, n) where only circumferential displacement uθ is involved, and (3) flexural wave modes F(m, n) where both uz and uθ are involved. The numbers m and n stand for the circumferential order and family order of each wave mode, respectively. In the application of wave propagation method, the output signals are usually a combination of several different wave modes. Hence, group speed is the most commonly used parameter to identify wave modes. The group speed dispersion curves of those wave modes can be calculated from the Pochhammer–Chree frequency equation. Seco and Jiménez (2012) developed a tool box “PCDisp” in MATLAB environment to simulate the wave dispersion and propagation in cylindrical structures. The dispersion curves of group speed for an aluminum T6061 pipe with 102 mm outer diameter and 3 mm wall thickness are calculated using DCDisp and are plotted in Figure 2. Compared to the longitudinal waves and the flexural waves, the first torsional wave mode T(0, 1) is nondispersive, that is, its wave speed will not change when frequency changes, and its waveform is also unchanged during propagation.
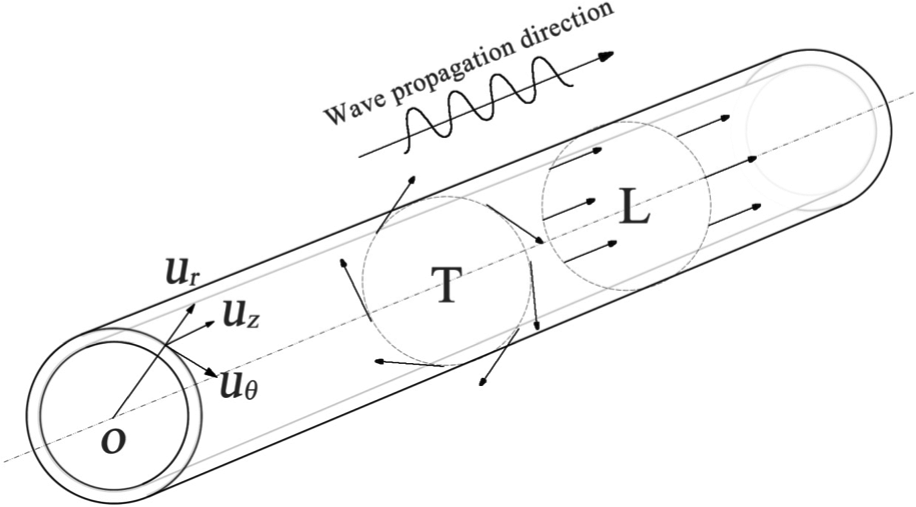
Cylindrical coordinate system for wave propagating in pipe.
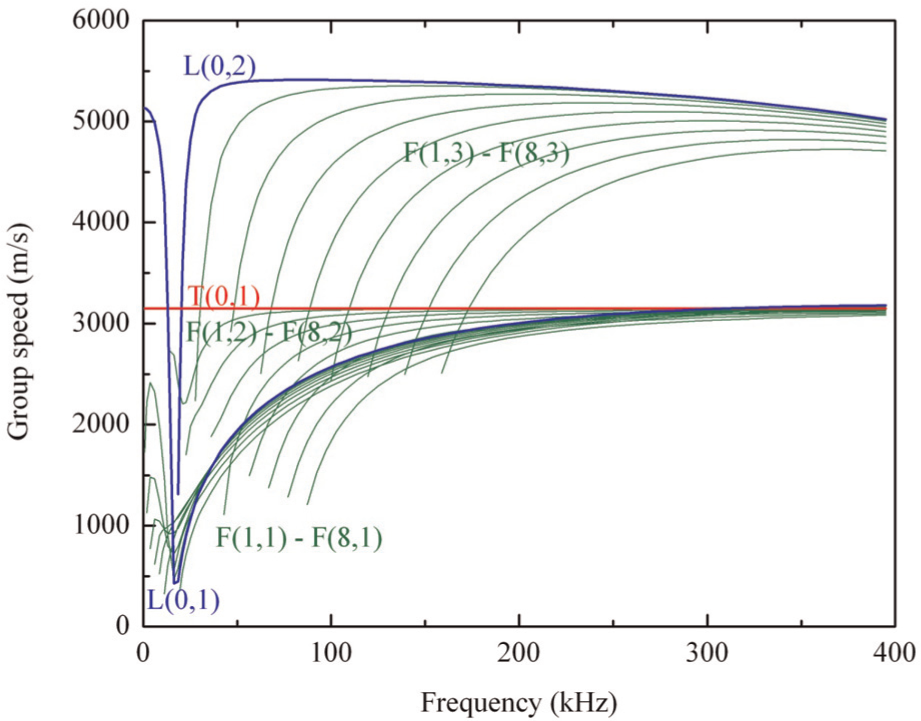
Group speed dispersion curves for an aluminum T6061 pipe with 102 mm outer diameter and 3 mm wall thickness (first 8 order).
The pulse–echo method and the through-transmission method are commonly used techniques in guided-wave SHM. When wave energy is spreading in the structure, the pulse–echo technique focuses on detecting the reflected wave pack from the discontinuity, and the through-transmission technique focuses on detecting the signal changes after the wave packs transmitted through the discontinuity. This research reveals that the former is good at locating the exact position of the discontinuity and the latter is good at returning the quantitative information of the discontinuity.
In the pulse–echo method, the actuators and sensors are located on the same side of the crack. The baseline signature of the undamaged structure is needed to differentiate between the damaged and the undamaged specimens. The position of the crack is calculated based on the time of flight (TOF) of the additional wave pack reflected from the defects. In the through-transmission method, the actuators and sensors are placed on the opposite sides of the crack to measure the disturbances of the wave pack caused by the crack. The information of the damage is analyzed by comparing the baseline signature and the disturbed signatures.
If axial crack exists in the pipe, the orientation of crack is parallel to uz, which coincides with the particle motion direction of the longitudinal wave modes (L). The crack does not significantly disturb the propagation of this longitudinal wave mode. So, the axial crack has only minimal effect on the longitudinal wave pack.
However, the particle motion of the torsional wave uθ is perpendicular to the axial crack orientation, and the crack causes discontinuity on the particle motion of the torsional wave mode. Hence, it causes large disturbance on the torsional wave pack passing by, and the larger reflected wave pack as well as the larger distortion in the forwarded wave pack can be expected as compared with the case of the longitudinal wave mode. Therefore, using torsional wave to detect and monitor axial cracks in the cylindrical structures will be more effective.
Numerical simulation of SHM of axial cracks using torsional wave
The finite element (FE) method, which has been widely used to simulate the interaction between ultrasonic guided waves and host structures (Alleyne et al., 1998; Koshiba et al., 1987; Lowe et al., 1998; Moser et al., 1999), has been used to investigate the feasibility of using torsional wave in the SHM of axial cracks in cylindrical structures. Since only penetration crack is considered in this study, a 2.4 m (length) × 102 mm (diameter) × 3 mm (wall thickness) aluminum pipe is modeled in the FE software ANSYS using SHELL63 element. The growth of penetrated crack at the center of the pipe is simulated via nodal release method, which is commonly used in FE analysis of fracture mechanics (Jih and Sun, 1990). For simplicity, only ring-shaped actuator that fully covers the pipe circumference is considered. This fully covered ring-shaped actuator generates only the axisymmetric wave modes. Placement of the transducers and the wave propagation paths are plotted in Figure 3. Force along the axial direction is uniformly distributed on the pipe circumference to generate the longitudinal wave modes, and torque is applied to generate the torsional wave modes.
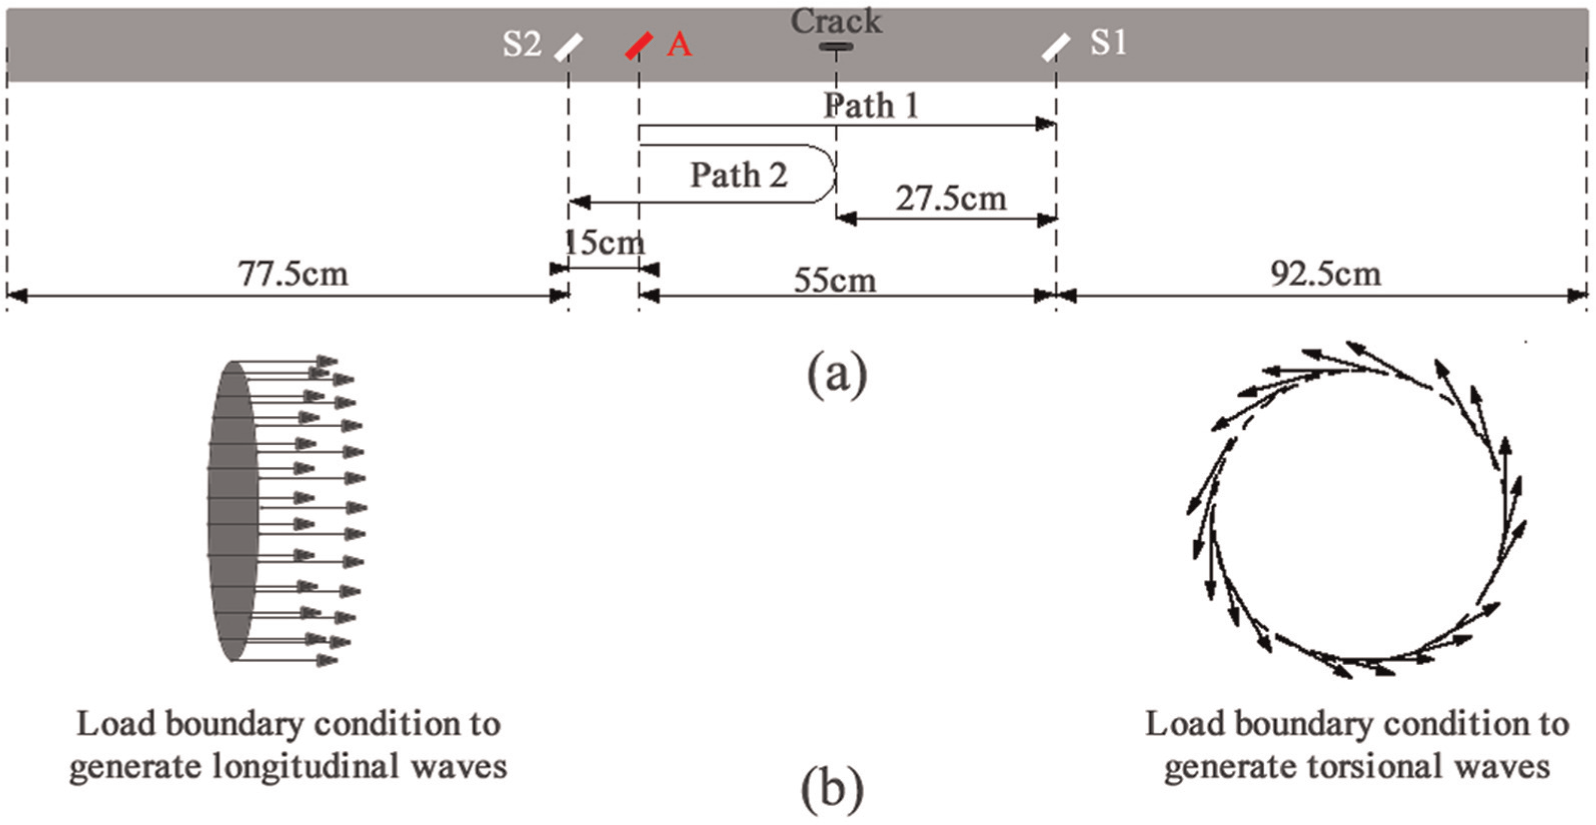
(a) Placement of transducers and (b) loading boundary conditions.
For the purpose of crack growth monitoring, sensor 1 (S1) and wave propagation path 1 are used. Because the actuator (A)-to-S1 distance is fixed, for a fixed actuation frequency, the TOF of a torsional wave pack is also a constant. Since axial crack will disturb the propagation of the torsional wave pack, when the crack size increases, larger disturbances on the torsional wave pack are expected. This can be used as an indicator for crack growth monitoring. For the purpose of crack position identification, sensor 2 (S2) and wave propagation path 2 are used. Additional torsional wave pack reflected from the crack is expected, and the TOF of the additional wave pack is used to locate the crack position. Five-cycle Hanning-windowed sine wave tone burst, which is one of the most commonly used signals in guided-wave testing, is adopted in this study.
Numerical simulation of axial crack growth monitoring
Output from S1 is used to monitor the growth of the axial crack. As mentioned in the previous section, if the axial direction crack exists in the wave propagation path, its disturbance on the torsional wave pack will be greater than that on the longitudinal wave pack. Since the A-to-S1 distance is fixed at 55 cm, the wave speed is obtained from the dispersion curve of group speed in Figure 2, and the TOF of each wave pack can be calculated.
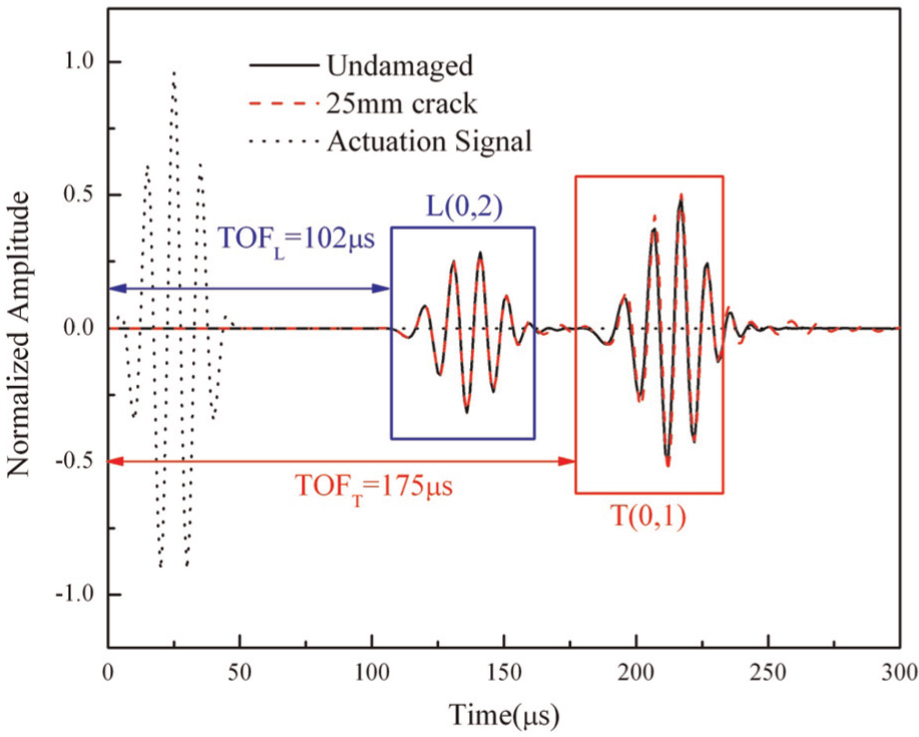
Simulation results of the output of S1 at 100 kHz actuation frequency are plotted in Figure 4. Based on the group speed of L(0, 2) and T(0, 1), which are 5412 and 3149 m/s, respectively, the TOFs of the longitudinal wave pack and the torsional wave pack are calculated to be 101.6 and 174.7 µs, respectively. The TOFs of both wave modes are exactly the same as the numerical results obtained from Figure 4. Comparing the signal of the undamaged specimen with that of the cracked specimen, the differences are difficult to track by naked eyes. Thus, to quantify the crack-caused disturbance on the torsional wave pack, the RMSD method is used to evaluate the differences between the signal of the undamaged and the cracked specimens. The RMSD crack index is calculated as follows
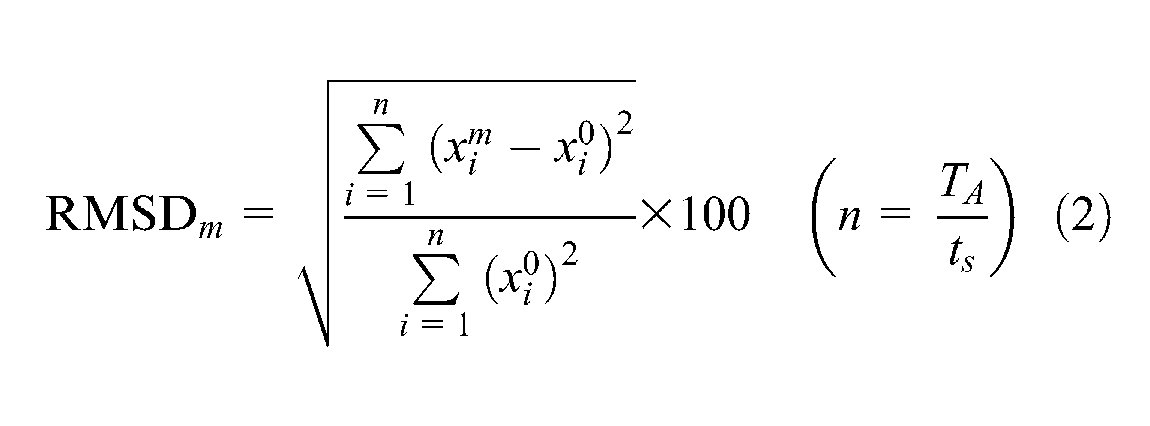
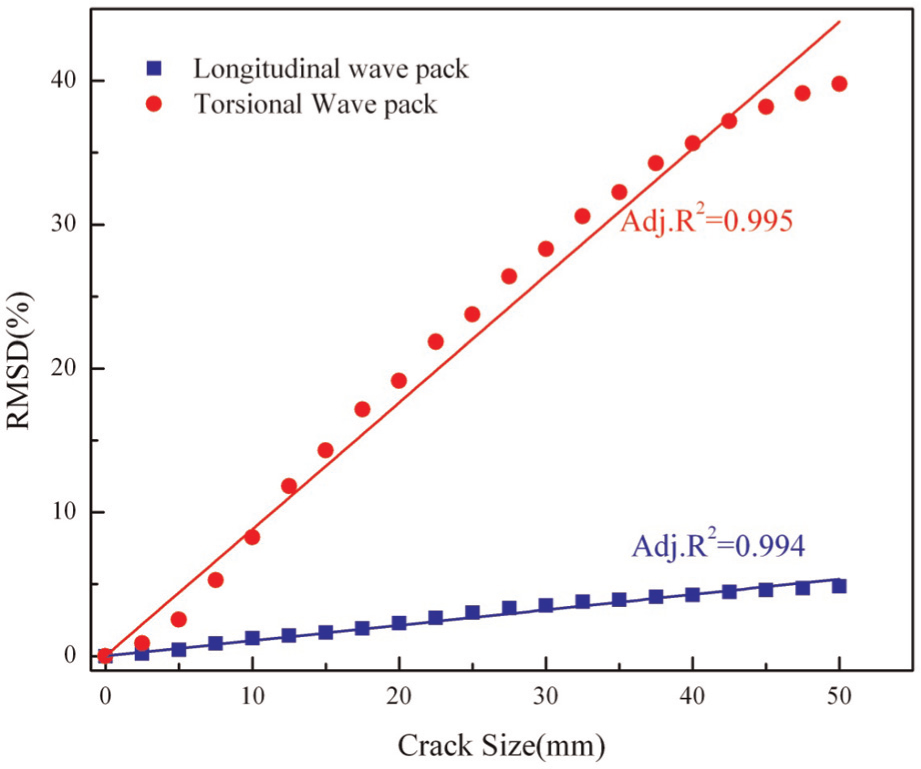
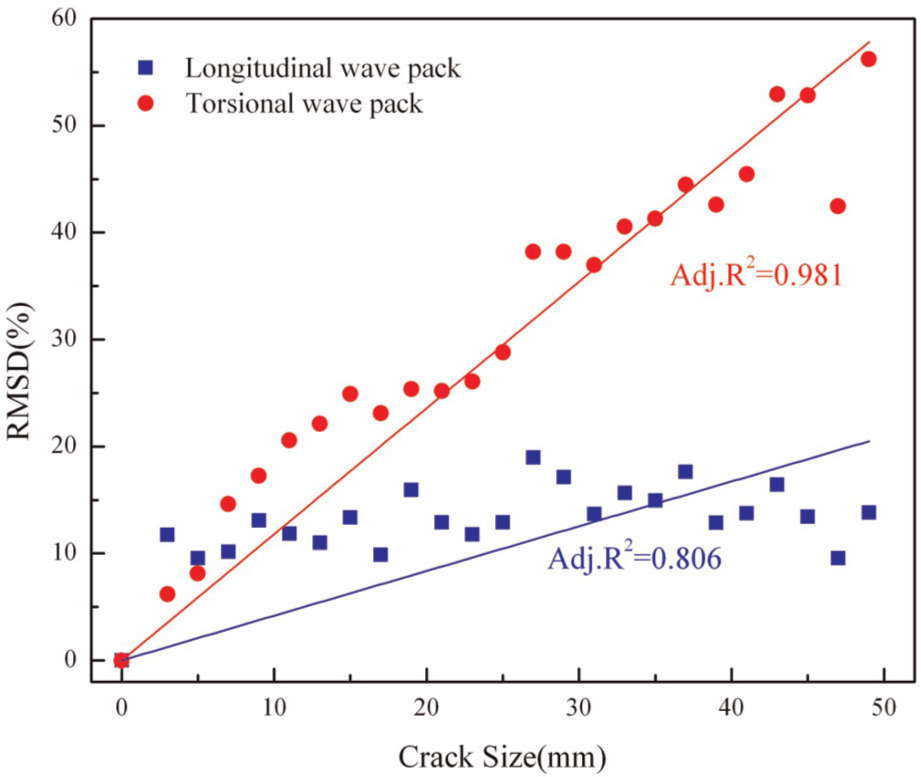
where x0 is the data from the reference or baseline signature and xm is the signals from the mth experiment; n stands for the number of data points, which is equal to the time duration of the actuation signal TA divided by the time interval of sampling ts. Figure 5 compares the RMSD crack indices calculated from the longitudinal wave pack and the torsional wave pack, respectively. Just as expected, the RMSD crack index from the torsional wave pack is more sensitive to the crack growth than the index from the longitudinal wave pack. The linear fit of these RMSD values suggests that the RMSD value varies linearly with the axial crack length. Hence, it can be conveniently used to monitor the growth of the axial crack.
Comparison of normalized numerical simulation results: output of S1 from undamaged and cracked specimens.
RMSD crack indices from output of S1 to monitor the axial direction crack growth (numerical simulation).
Numerical simulation of axial crack position identification
Output from S2 is used to identify the position of the axial crack. Results of the undamaged specimen and the specimen with 25 mm axial direction crack are compared in Figure 6. Besides the noticeable wave pack, which is the wave pack directly from A to S2, two additional wave packs are found, which are the longitudinal wave mode L(0, 2) and the torsional wave mode T(0, 1). Just as expected, the torsional wave pack is more sensitive to the axial crack, and hence, the reflected wave pack is larger. As the A-to-S2 distance is fixed, the TOF of the torsional wave pack can be measured from the graph, and the group speed of torsional wave is obtained from the group speed dispersion curve in Figure 2. The position of the crack is thus located. If the distance from actuator to crack position is denoted by X, it can be calculated by
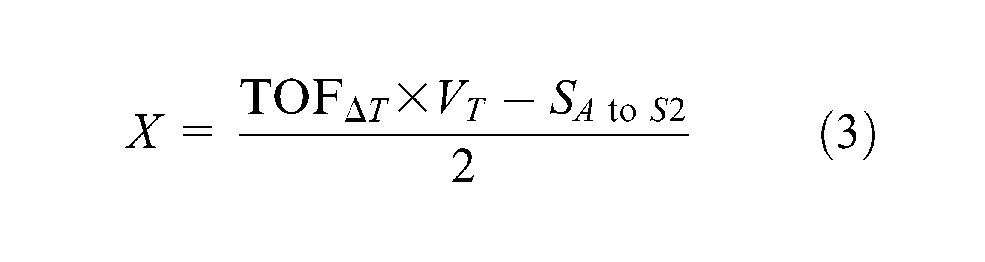
where
Axial crack position identification from the output of S2 (numerical simulation).
Exact axial crack position (calculated from dispersion curve).
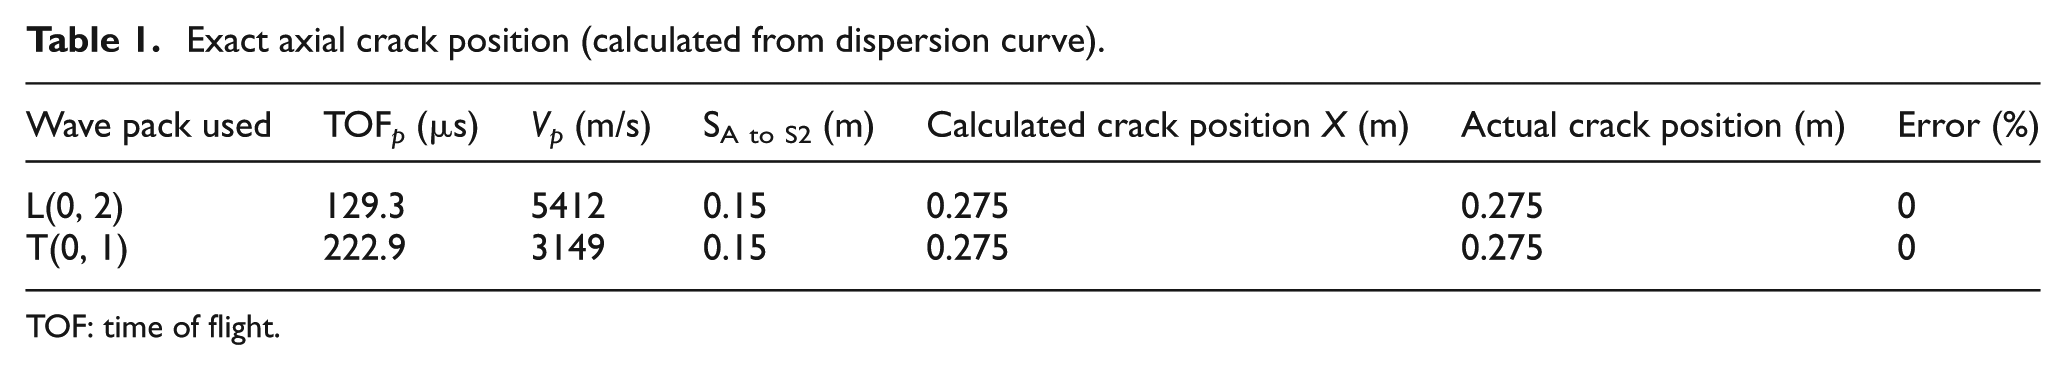
TOF: time of flight.
Numerical simulation axial crack position.
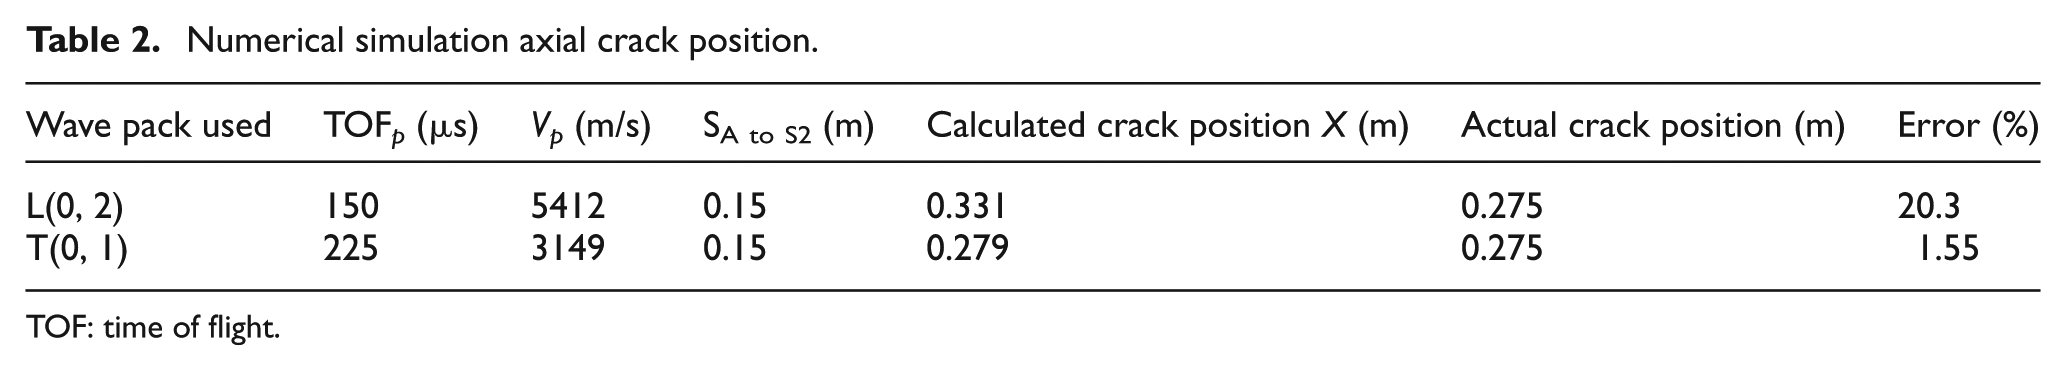
TOF: time of flight.
Experimental study of SHM of axial crack using torsional wave
In the numerical simulation, the specimen is considered to be fully covered by a ring-shaped actuator by which only the axisymmetric wave modes can be activated. Since in the experimental study the MFC patches can only cover part of the circumference, the flexural wave modes are the concomitance of the axisymmetric wave modes.
MFC piezoelectric transducers
MFC transducer is first developed at the NASA Langley Research Center (Wilkie et al., 2002). It consists of active rectangular piezoceramic fibers aligned in a unidirectional manner, with interdigitated electrodes and an adhesive polymer matrix. Due to its manufacturing process and its structure, MFC shows different electromechanical characters along its long and short edges. Compared with a typical through-plane poled piezoceramic actuator device, the maximum free strain performance of MFC is considerably larger and is also more endurable under various electrical and mechanical cyclic loading conditions. Most importantly, MFC is rather soft as compared to the normal lead zirconate titanate (PZT) transducers. It can be bent to match the curvature of a cylindrical shell very well, which is the main reason for its use in this study.
Experimental setup
An aluminum pipe of 2.4 m in length, 102 mm in outer diameter, and 3 mm in wall thickness is used in the experimental study. The aluminum pipe is supported by four stands at the bottom. Three MFC transducers are bonded on the surface of the pipe and oriented at 45° to the axial direction, as shown in Figure 7. The experimental setup consists of a Tabor Electric WW1701 arbitrary function generator, a Trek PZD350A high-power amplifier, a YOKOGAWA DL1740 Oscilloscope, and a National Instruments (NI) integrated digital signal acquisition (DAQ) system. The MFC actuator is driven by amplified 100-V peak-to-peak actuation signals. The sensors are connected to the NI multichannel switching box to receive the signal simultaneously. An additional cable from the function generator is connected to the DAQ device to synchronize the data acquisition process. The synchronizing function in data acquisition is a key feature and is of great importance to reduce the noise level as well as to increase the result accuracy in the process of signal interpretation.
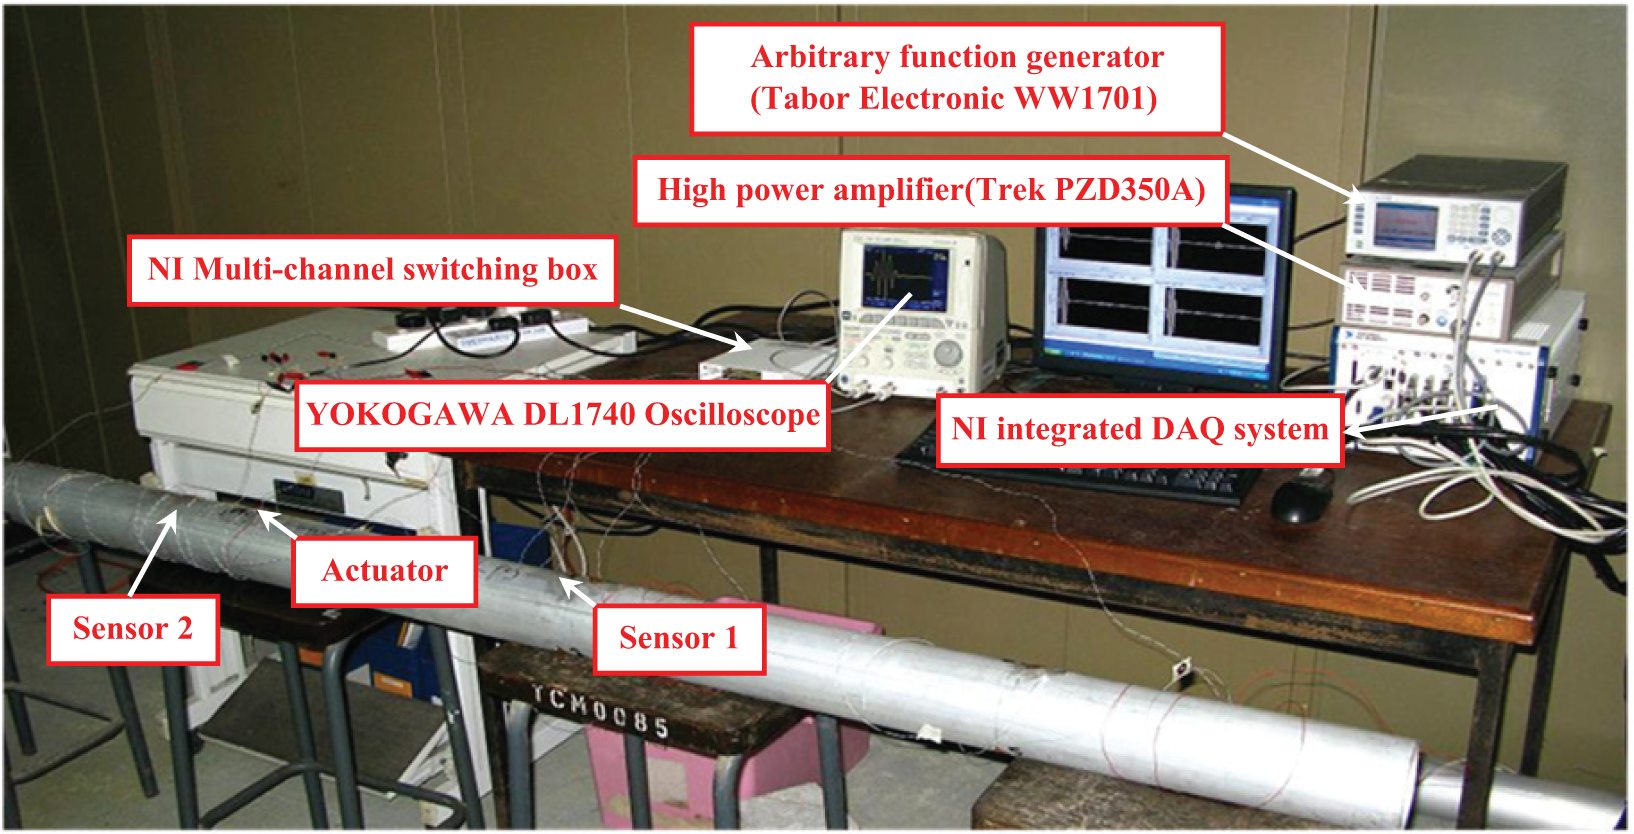
Experimental setup for torsional wave SHM of pipe using MFC transducers.
A penetrated crack is initiated at the center of the pipe with an initial length of 3 mm and a constant width of 3 mm. The crack length is increased at 2 mm increment until it reached 49 mm, which is almost the radius of the pipe. At each crack size, experimental data within target frequency bandwidth (60–200 kHz) are collected. To eliminate the influence of background noise, 16 times cyclic averaging is used. At low actuation frequency, longer A-to-S distance is needed to prevent overlapping of wave packs, whereas at high actuation frequency, the actuating capability of MFC is greatly reduced, which lowers the accuracy of the SHM results. The lower and upper limits of the frequency bandwidth are thus set at 60–200 kHz according to the dimension of the specimen and the actuating capability of MFC, respectively. As the DAQ device does not have any power isolation function, the alternating current (AC) background noise needs to be removed from the original data.
Experiment on axial crack size growth monitoring
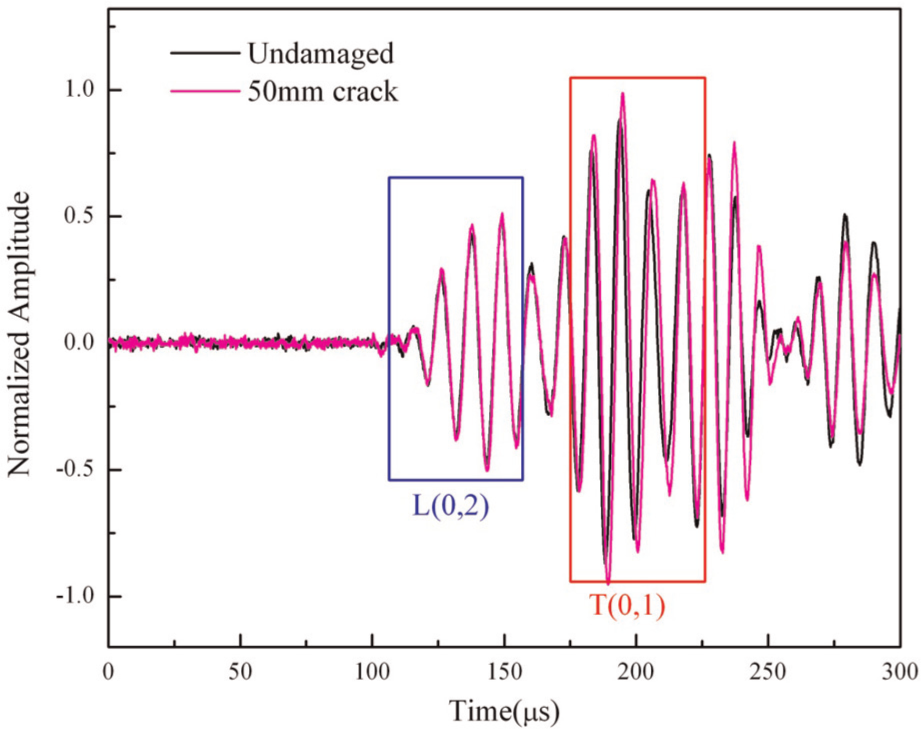
Experimental results of S1 from the undamaged specimen and the specimen with 50 mm crack are compared in Figure 8. Apparently, they are different from the numerical simulation results under the same actuation frequency (as shown in Figure 4) because the experimental results are complex due to the existence of flexural waves, which are too complicated to be separated. However, as the A-to-S1 distance and the group speed of each wave mode are known, the TOF of each wave mode under 100 kHz actuation frequency can be calculated. The torsional wave pack T(0, 1) and longitudinal wave pack L(0, 2) are then identified and marked in Figure 8. Just as expected, the longitudinal wave pack is not sensitive to the axial crack growth. Compared with the torsional wave pack, the differences of longitudinal wave pack between the two signals are relatively small. The experimental RMSD crack indices from the torsional wave and the longitudinal wave are calculated based on equation (2) and are plotted in Figure 9. Compared with the RMSD crack indices from numerical simulation, even though the experimental results are more disordered, they still suggest a linear pattern against crack growth. Figure 9 illustrates again that the torsional wave pack is more sensitive to axial crack growth than the longitudinal wave pack. To reduce scattering of the experimental results, the possible improvements can be given as follows:
Proper selection of baseline signature. All the experimental data are compared with the baseline signature to compute the RMSD crack indices. A good baseline signature from the undamaged specimen is very important to ensure accuracy; hence, multiple baseline signatures are suggested.
Stable experiment environment, setup, and boundary conditions. The data should be collected under similar conditions. Especially when the baseline signature is collected, the following data should be collected under the same environment and boundary condition to limit any uncertainties in the change of signals. In the experiment, the transducers are disconnected and reconnected every time the crack increases, which increased the uncertainty in the change of signal.
Preprocess of signals to remove the background noise. RMSD method highly depends on the quality of signals. The difference between different signals can come from defects, change of boundary conditions, and background noises. When background noise is not fully removed from the signals, it will lead to a higher RMSD value.
Dimension of the crack. In the experiment, an axial direction crack with 3 mm width is adopted, whereas in the numerical simulation, an ideal axial crack with zero width is considered. The circumferential dimension of the crack also contributed to the change of RMSD value.
Dimension of MFC. In the numerical study, a ring-shaped actuator is simulated. The actuation only worked at a single axial position of the pipe. The sensor output is also from this single point. In the experiment, MFC transducer covered certain area to actuate, and the sensor output is also the average result of this area, which increased the difficulty of interpreting the signatures.
Comparison of experimental results: output of S1 from undamaged and cracked specimens.
RMSD crack indices from output of S1 to monitor the axial direction crack growth (experimental results).
Compared with the RMSD crack indices from the torsional wave pack, the RMSD crack indices from the longitudinal wave pack showed a more scattered pattern. This is because the disturbance of axial crack on the longitudinal wave pack is very small, so the RMSD value is easily affected by any noise or change in boundary condition.
Experiment on axial crack position identification
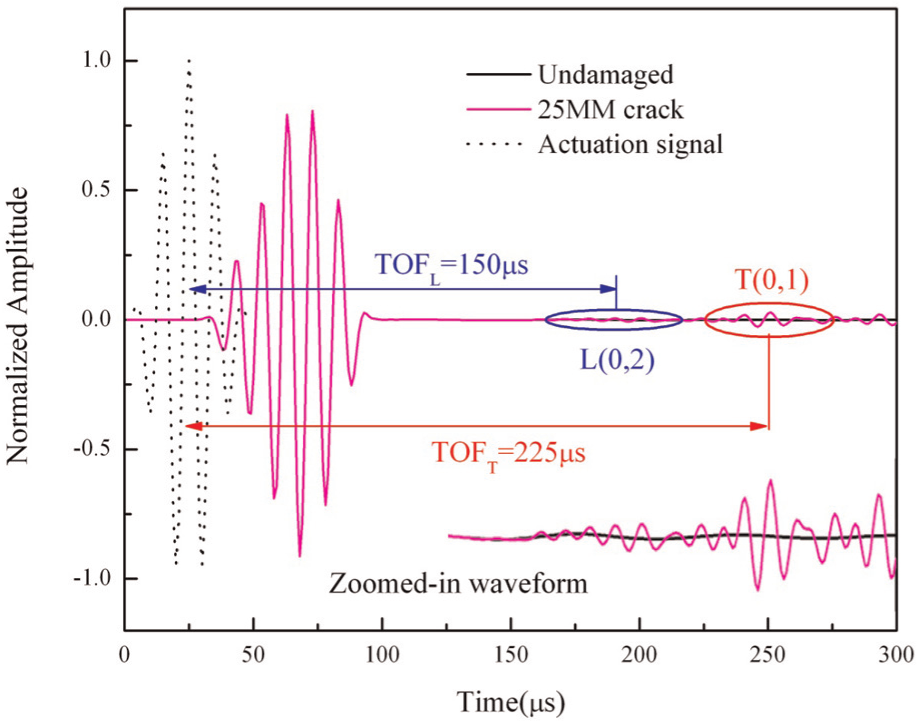
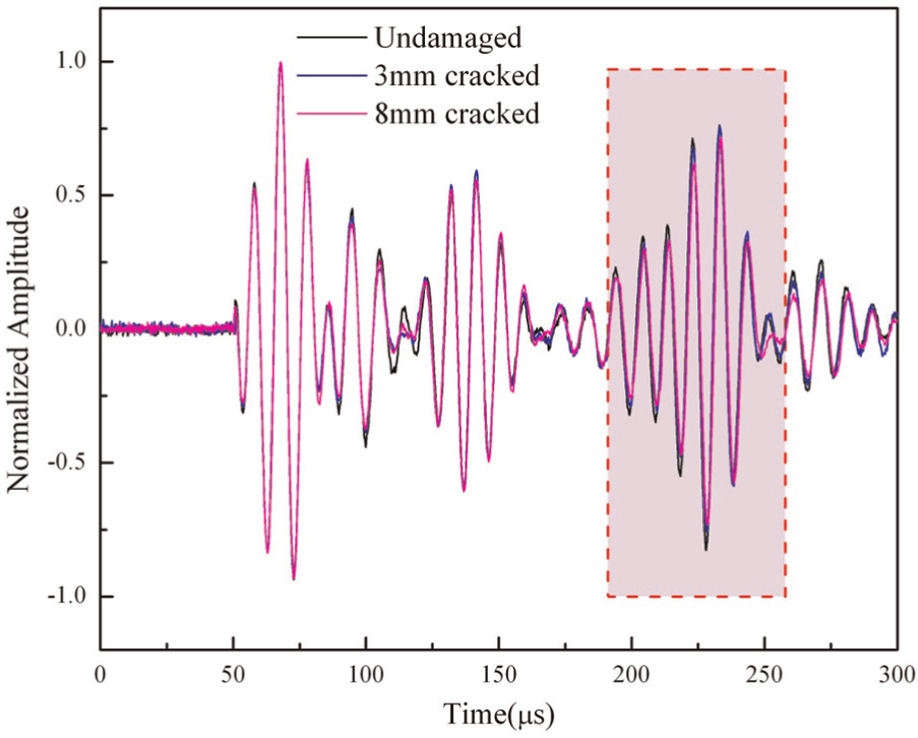
The numerical simulation used a simplified ring-shaped actuator, which can only generate axisymmetric wave modes. However, in the experiment under partial actuation condition, the flexural wave modes are also included in the output signatures. The experimental results of S2 from the undamaged specimen, the specimen with 3 mm crack, and the specimen with 8 mm crack are compared in Figure 10. Unlike the numerical simulation results shown in Figure 6, the experimental output signature of S2 is rather complicated. As shown in Figure 10, the additional signal reflected from the axial crack is buried inside the flexural wave modes following behind (color shaded zone). In order to use equation (3) to calculate the crack position, the additional reflected torsional wave pack needs to be identified before the TOF of the wave pack can be obtained.
Comparison of experimental results: output of S2 from undamaged and cracked specimens.
Mode separation
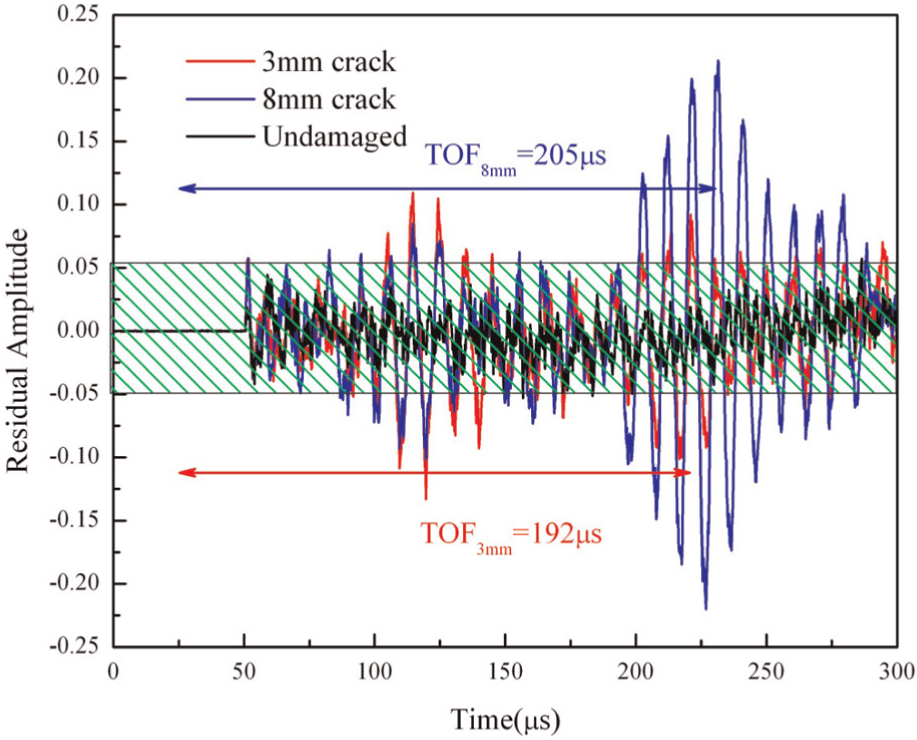
Since there is no crack existing in between the actuator and S2, the direct-passed wave packs measured by S2 will remain unchanged. Considering the existences of AC white noise and background noises, even if the actuations are the same, the direct-passed wave packs still have slight differences in amplitude. Using the signature from the undamaged specimen as reference, the signals from the cracked specimen are subtracted from the baseline signature, and the residual signals are then assumed to be the crack affected signals. Figure 11 compares three residual signals: (1) the “undamaged” signal is the difference of two sets of baseline signature of the undamaged specimen, (2) the “3 mm crack” signal is the residual of subtracting a signal of undamaged specimen from the signal of the specimen with 3 mm crack, and (3) the “8 mm crack” signal is similarly obtained as the “3 mm crack” signal. The “undamaged” signal is then considered as the white noise and the background noise whose amplitude is covered by the shadowed area. The structures are considered undamaged if any wave pack whose peak amplitude is within the noise level. Once crack is initiated, as shown in Figure 11, additional reflected wave pack from the axial crack can be detected. As compared with the “3 mm crack” residual, the “8 mm crack” residual includes a larger torsional wave pack in terms of both amplitude and wave pack width, while the included longitudinal wave pack remains almost the same. This is because when the axial crack size is growing, its axial dimension increases but its circumferential dimension remains constant. Thus, the longitudinal wave pack is less affected than the torsional wave pack.
Comparison of residual signals from undamaged, 3 mm cracked and 8 mm cracked specimen after wave mode extraction.
Crack position identification
After the mode separation process, additional reflected wave pack from the axial crack can be identified in the residual signal graph. The TOF of the additional wave pack is marked in Figure 11. The actual position of the crack is 27.5 cm from the center of the actuator, and the center-to-center (C-to-C) distance of A-to-S2 is 70 cm. Using the 100 kHz group speed of torsional wave from the dispersion curve shown in Figure 2, the exact TOF of torsional wave pack is calculated. Tables 2 and 3 listed the axial crack position calculated from the numerical simulation results and the experiment results, respectively. As compared with the exact axial crack position, numerical simulation with only axisymmetric wave modes gives very precise location of the crack. But when flexural wave modes are included in the experimental results, the accuracy of the results is reduced. The low accuracy of the position identification is also due to the distance of actuator to crack used in equation (3). In the numerical simulation, the transducers have exact axial positions, but in the experiment, the transducers cover certain areas on the axial direction of the pipe, which increases the complexity of the output signals. As shown in Figure 12, taking the transducer’s dimension into consideration, the actuator-to-crack distance is changed from 27.5 to 26 cm. The corrected results, using the new value in equation (3), are also listed in Table 3. Apparently, their accuracy improved greatly. It is also found from Table 3 that as the crack size increases, the accuracy of the crack position identification also increases. This is because when the crack size is small, the wave pack reflected from the crack is also small in amplitude and it is difficult to determine the center of the wave pack, which reduced the accuracy. As the crack size increases, the reflected wave pack amplitude also increases due to the larger disturbance, and the wave pack is thus easier to measure.
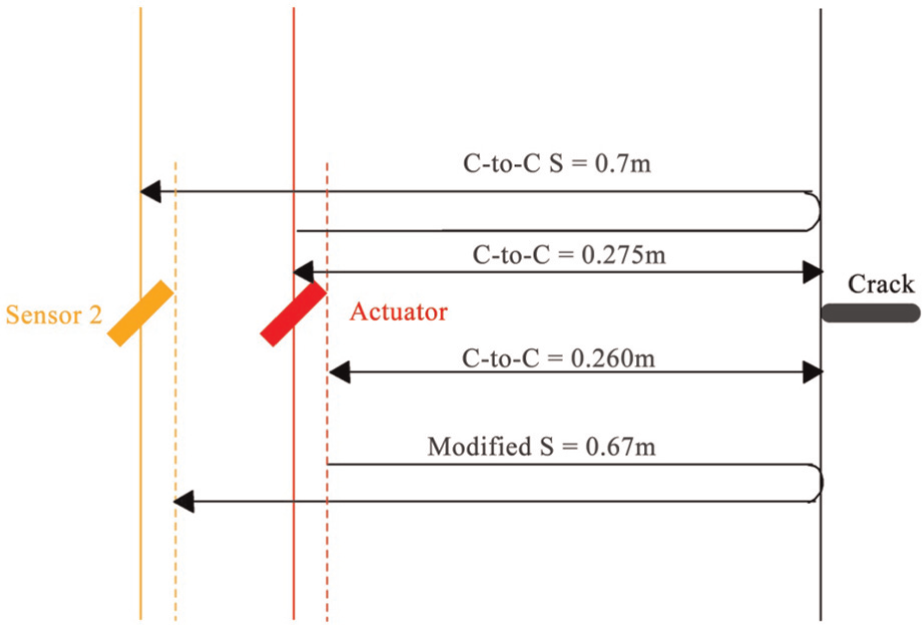
Modified wave propagation path length.
Experimental axial crack position.
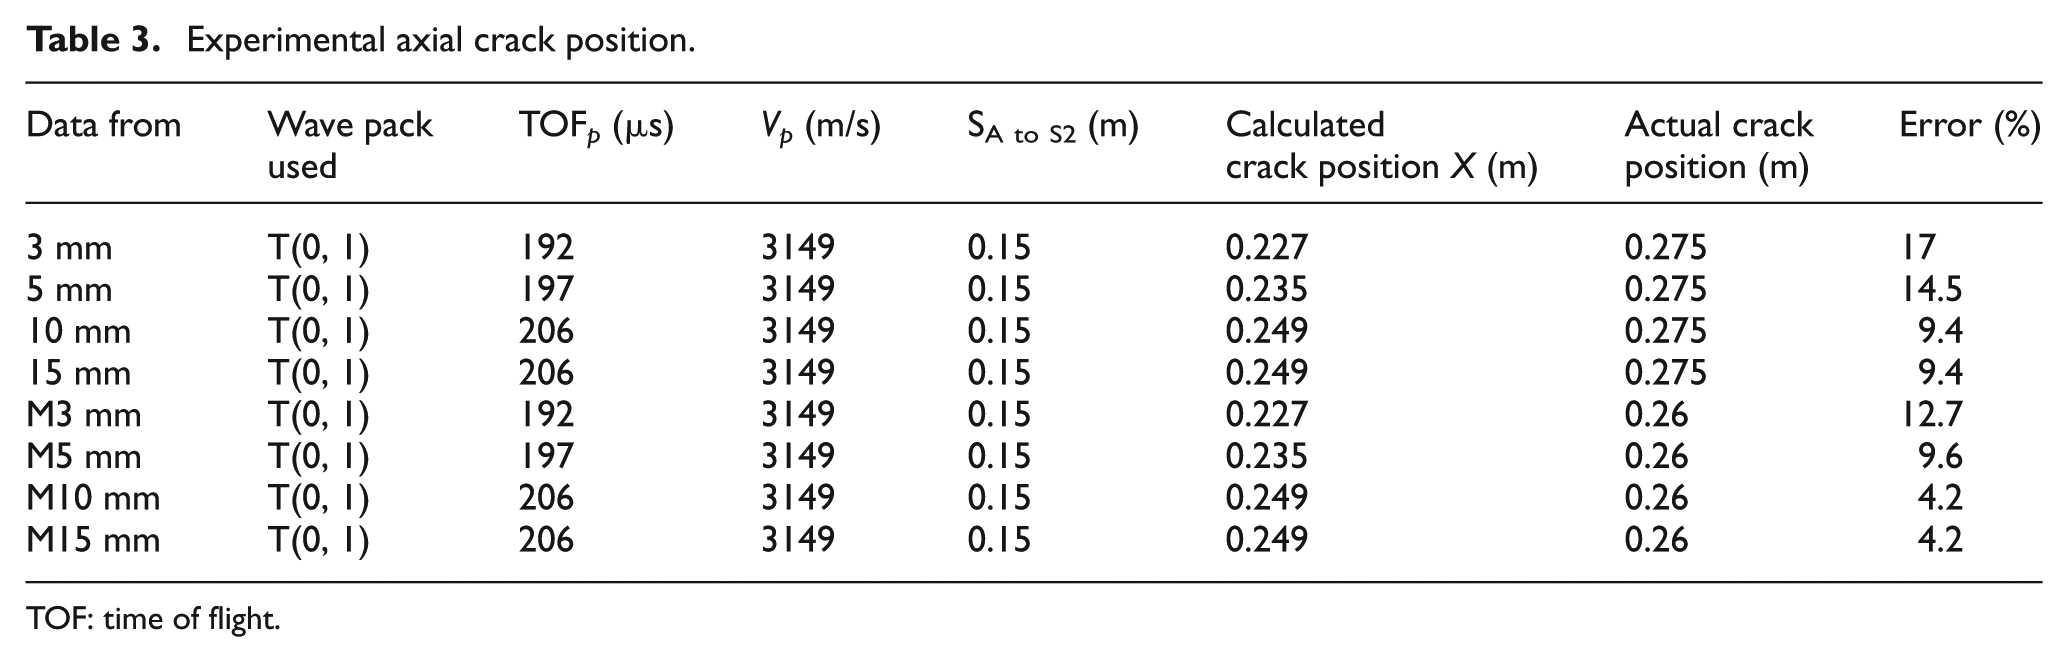
TOF: time of flight.
Conclusion
This article presents a closed-loop self-sensing and monitoring system for axial crack in cylindrical structures. Since the particle motion direction of torsional wave modes is perpendicular to the orientation of axial cracks, torsional wave pack is more sensitive to axial crack. In this system, MFC transducer is oriented at 45° against the axis of the cylinder to generate torsional wave packs. The MFC transducer at the center works as the actuator, whereas the other two MFC transducers work as sensors to detect the axial position of the crack and to monitor the crack size growth, respectively. Five-cycle Hanning-windowed sine wave tone burst is used to activate guided waves in the cylindrical structures. With the help of its concentrated wave pack center, the accuracy of locating the crack position is improved; and with its narrowed bandwidth, the dispersion effect of wave modes is limited. To monitor the crack growth, RMSD method is adopted to correlate the crack growth to the total waveform changes, where a linear pattern between the RMSD index and the crack size is observed. TOF-based method is adopted to find the axial position of the crack in the cylindrical structures. To eliminate the effect of flexural waves, the residual signal whereby the signal of undamaged specimen is subtracted from the signal of cracked specimen is used.
Both numerical simulation and experimental investigation are conducted. The results show that both the axial position and crack size growth of the axial crack can be well located/monitored using this sensing system. In the experimental investigation, the existence of flexural waves, changes of boundary conditions, errors in data processing procedure, and so on contributed to the reduced accuracy of the results as compared with the numerical simulation. Nevertheless, the experimental results still show promise in the SHM of axial crack in cylindrical structures.
For the monitoring of continuous cylindrical structures, an integrated intelligent SHM system can be further developed based on the proposed self-sensing system. To achieve continuous SHM of cylindrical structures, optimized placement of transducers and artificial intelligence to integrate automatic data acquisition with data processing and result analysis are needed and will be our future research topics.
Footnotes
Declaration of conflicting interests
The authors declare that there is no conflict of interest.
Funding
This research received no specific grant from any funding agency in the public, commercial, or not-for-profit sectors.