
Abstract
The design studies of cantilevered piezoelectric vibration energy harvesters have been focused on the optimization of the power output of rectangular cantilevered beam vibration energy harvesters. However, without clarifying the influences of the modal electromechanical coupling and mechanical behaviour clearly, the power outputs cannot be adequately optimized. In this article, a distributed parameter electromechanical model is used to predict the power output with resistive loads, and the parameters are derived using the finite element method. First, a parametric study is presented to investigate the effects of the two factors on the volumetric power of cantilevered vibration energy harvesters. Then, an optimization strategy is implemented to investigate the modal electromechanical coupling coefficient and mass ratio separately using geometric parameter study. Mass ratio represents the influences of modal mechanical behaviour on the power density directly. The findings indicate that the convergent and divergent tapered cantilevered and rectangular cantilevered beam designs with partial coverage of piezoelectric layer are able to generate higher electromechanical coupling coefficient than conventional rectangular cantilevered designs with full coverage. Besides, using convergent tapered cantilevered designs can actually decrease the power density significantly. Both using divergent tapered cantilevered structures and attaching reasonable extra masses with varied locations on vibration energy harvesters can generate larger power density.
Introduction
In recent years, the possibility of developing self-powered, batteryless wireless sensors and sensor nodes for preventive maintenance strategies has made the small-scale ambient energy harvesting to become a gradually focused research field (Cook-Chennault et al., 2008). In particular, as an attractive option and one of the kinetic energy harvesting implementations, a lot of work has been concentrated on developing the vibration energy harvesters (VEHs) using piezoelectric materials in the last decade (Anton and Sodano, 2007; Roundy et al., 2008). Resonance has been considered as an effective method of energy conversion from the mechanical domain to the electrical domain. Cantilevered structures have become widely used, which normally have resonance frequencies in the range of 100 Hz and produce microwatts (µW) to milliwatts (mW) power output, for the sizes of VEH considered with respect to the natural sizes of wireless sensors and sensor nodes.
The study of cantilevered VEHs has been focused on different aspects with the overall goal being to optimize the performance of existing devices. Many investigations are focused on the geometric parameter designs of rectangular cantilevered (RC) VEHs and investigate the power output directly. Richter et al. (2007) developed models of RC VEHs with different lengths and widths in order to explore how the beam dimensions affected the matching resistance and power output. Results in their study have shown that with the same length, the wider RC VEHs can generate more than twice the power output. Zhu et al. (2010) used the commercial finite element analysis (FEA) code ANSYS to explore the influence of dimensions on the current and power output of RC VEHs, including the length, width and thickness of VEHs as well as tip masses. The study suggested that a wider but shorter beam was preferred since it generated larger current and power output. However, the resonance frequencies in their models were varied, and the base acceleration inputs were incorrectly normalized. Both Song et al. (2009) and Patel et al. (2011) have optimized their design of RC VEHs by changing the geometrical parameters and adding large tip masses to achieve a fixed resonance frequency. The former work used a high-performance piezoelectric single crystal to ensure that the system electromechanical coupling is strong and added a bulky tip mass (7.7 times the beam mass). It was a special design and did not explore the reason for the generation of larger power density when compared with previous works. The latter research of Patel et al. mainly investigated the influence of piezoelectric coverage on the power output. The influences of attaching huge tip masses (nearly 15 times the beam mass) on the maximum power output were ignored.
In fact, in the work carried out for this article, it was found that a VEH with reasonable extra masses (2–5 times) or a divergent tapered cantilevered (DTC) structure can significantly affect the modal mechanical behaviour and also increase the mass ratio. Mass ratio is the ratio of the effective mass to the total mass and depends on the modal participation factor. It represents how much mass effectively participates in the motion and affects the forcing function and maximum power density directly. In most existing works, RC VEHs without tip masses have been extensively investigated. Although the geometrical dimensions of the RC VEHs have been changed, the mass ratios did not change, especially when the substrate and piezoelectric layers have equal length. This is because the modal behaviours of the different RC VEHs are similar. Besides, only slightly changing the dimensions of both VEHs and tip masses, in order to tune the resonance frequency, will hardly affect the mass ratio. Therefore, the variation of the normalized maximum power in most existing works was actually due to the electromechanical coupling conditions. In some previous investigations reported in the literature, the predicted power outputs were affected by the simultaneous changes of electromechanical coupling and mechanical behaviour. There was no attempt made to analyse the individual effects of these two factors on the output power. More importantly, system coupling combined the effects of damping and electromechanical coupling coefficient (EMCC) simultaneously, which also has not been stated clearly in many previous design works.
Some investigations improved the performance of VEHs actually via enhancing the EMCC. Erturk et al. (2009) have analysed the strain distribution of RC VEH with and without tip masses and suggested that the electrodes on the piezoelectric layer should be segmented into several parts in order to avoid self-cancellations in higher modes. Roundy et al. (2005) indicated that a convergent tapered cantilevered (CTC) beam can notably increase energy density of VEH compared with the RC beam due to the contributions of the strain distribution. However, despite the fact that this idea has been used in several researches for special designs, how the CTC design improves the power output has not been adequately analysed. In this article, results show that, first, for a VEH with medium to strong electromechanical coupling, using CTC structure actually generates lower power density than RC and DTC VEHs since it has smaller mass ratio; second, using CTC structure only generates higher EMCC when it has large piezoelectric coverage.
Moreover, Friswell and Adhikari (2010) developed RC VEHs covered with different shapes of piezoelectric layer on the substrate layer. They found that RC VEHs with half coverage of piezoelectric layer generate 2 times power output than full coverage. Bourisli and Al-Ajmi (2010) found that the optimized EMCC of RC VEH in the fundamental mode is achieved with 50%–60% piezoelectric coverage but that it also depends on the thickness ratio of the piezoelectric layer to the substrate layer. Patel et al. (2011) also found that RC VEHs with 60% coverage generate higher power output than full coverage. However, instead of discussing EMCC, Patel et al. showed how the piezoelectric coverage affects the modal backward coupling term and incorrectly concluded that the EMCC did not affect the maximum power. In fact, the variation of power output in their results corresponded to EMCC directly since the system is designed to have weak to medium coupling. In this article, the variations of EMCC with the geometrical dimensions of VEHs are investigated using RC, DTC and CTC structures. Also, how EMCC affects the maximum power is carefully investigated.
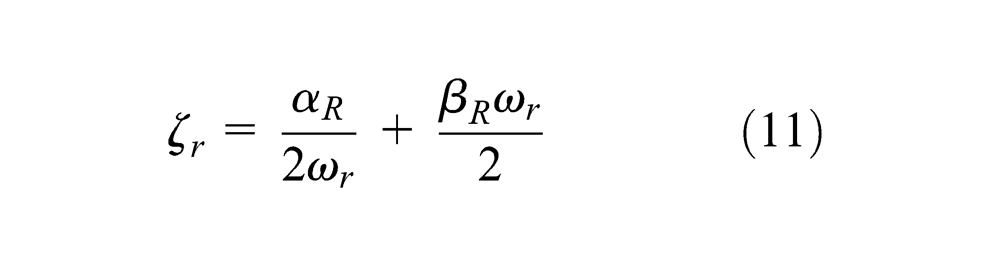
Generally, the existing designs and geometric studies of cantilevered VEHs are based on specified parameters and running the mathematical analyses to optimize the power output directly. Without clarifying the effects of the electromechanical coupling and mechanical behaviour carefully, the results could be easily confused when compared with others’ results and may not be acceptable when the configurations are different. This article attempts to clarify how these two factors affect the maximum power. A design strategy is developed and suggests that EMCC and mass ratio should be investigated separately in order to optimize the performance of VEHs. In this article, the power outputs are on resistive loads. A Rayleigh damping system has been used and the electrical losses are ignored. Section ‘Vibration energy harvesting model’ of this article is on the presentation of distributed parameter and FEA models; section ‘Performance determination and optimization strategy’ is on the performance determination and design strategy; section ‘Modal electromechanical coupling optimization’ is on the optimization of the EMCC of RC, CTC and DTC VEHs; section ‘Modal mechanical behaviour optimization’ is on the optimization of mass ratio of RC, CTC and DTC VEHs and RC VEHs with extra masses; a summary of the technical findings is presented in section ‘Conclusion’ at the end of this article.
Vibration energy harvesting model
Erturk and Inman (2008a) established a fully coupled distributed parameter electromechanical model (DPM) based on the Euler–Bernoulli beam assumptions and predicted the power output with resistive loads. The analytical model was successfully validated experimentally by themselves and other researchers. However, the analytical model is only valid for the uniform RC VEHs. To overcome the limitations, the well-established approximate engineering solution and the finite element method (FEM) using commercial FEA software packages, such as ABAQUS and ANSYS, have been widely used. The FEM has been theoretically and experimentally validated in the existing works (Patel et al., 2011; Trindade and Benjeddou, 2009; Wu et al., 2012; Yang and Tang, 2009; Zhang, 2010), and it is able to deal with complicated models and derive data conveniently, and it is normally used to perform design studies.
Analytical model
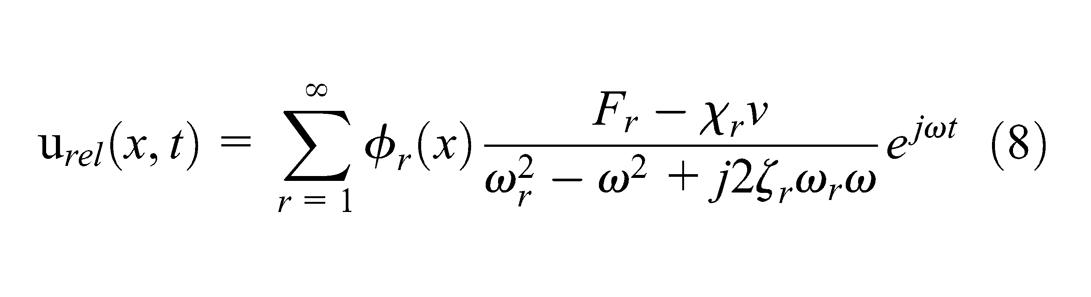
The vibration response can be represented using modal analysis technique, and the absolute transverse displacement relative to the moving base of the beam
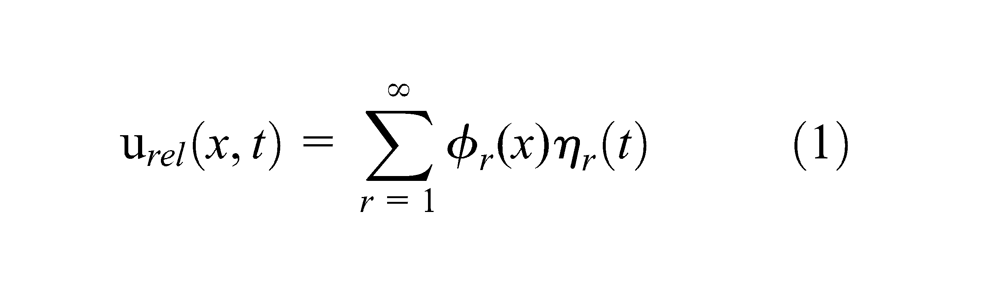
where
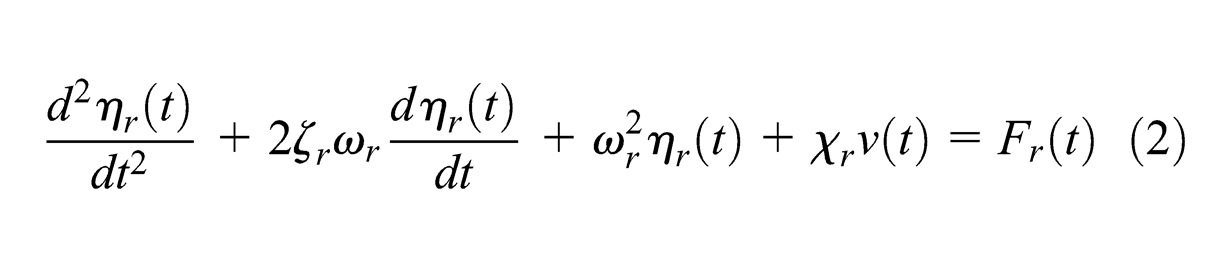
where
where
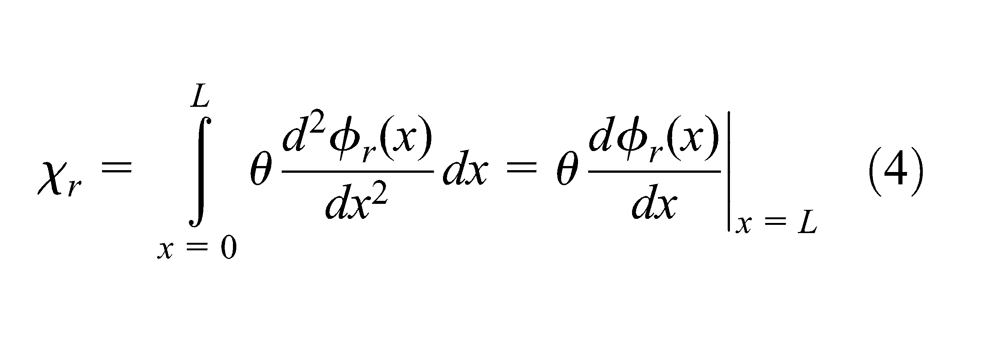
where
Coupling term
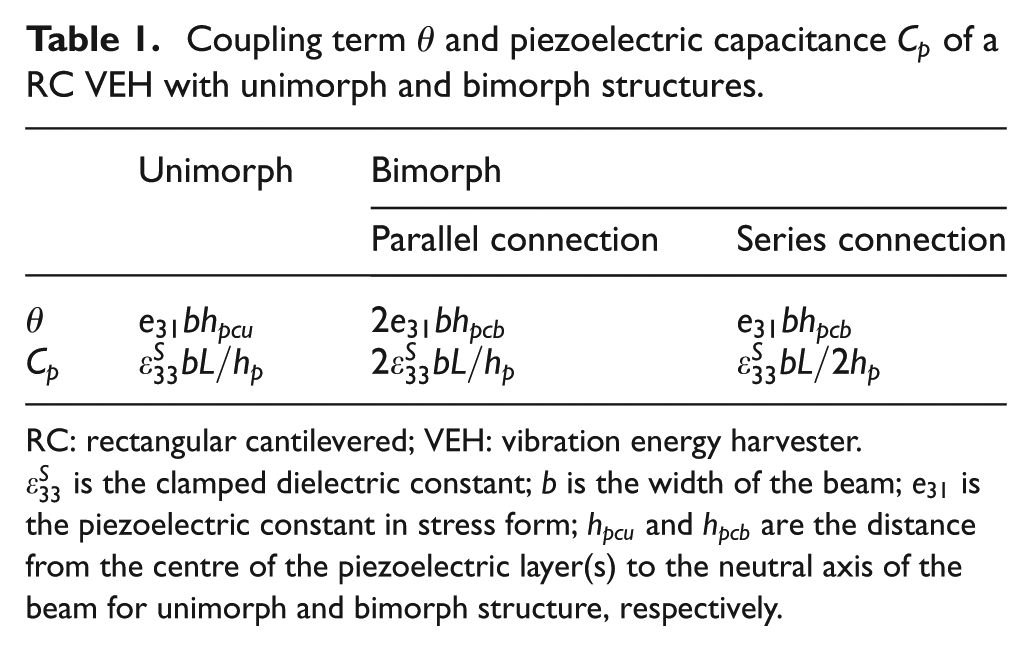
RC: rectangular cantilevered; VEH: vibration energy harvester.
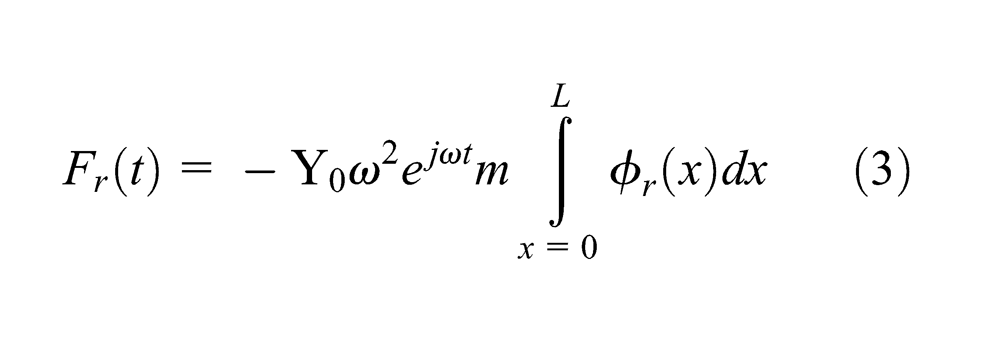
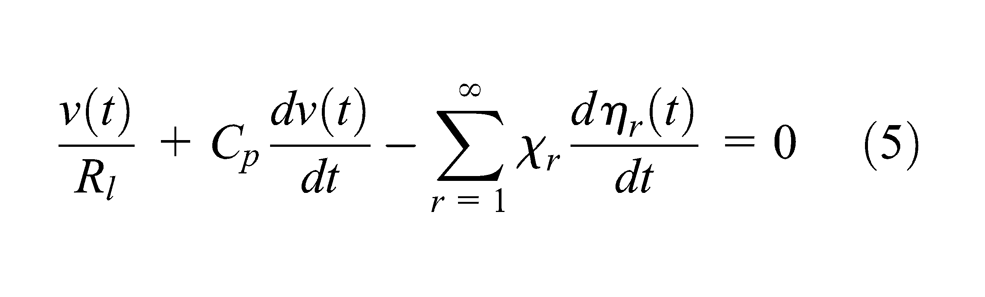
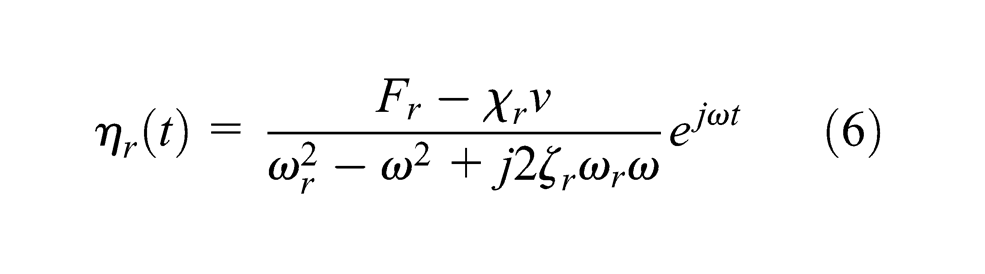
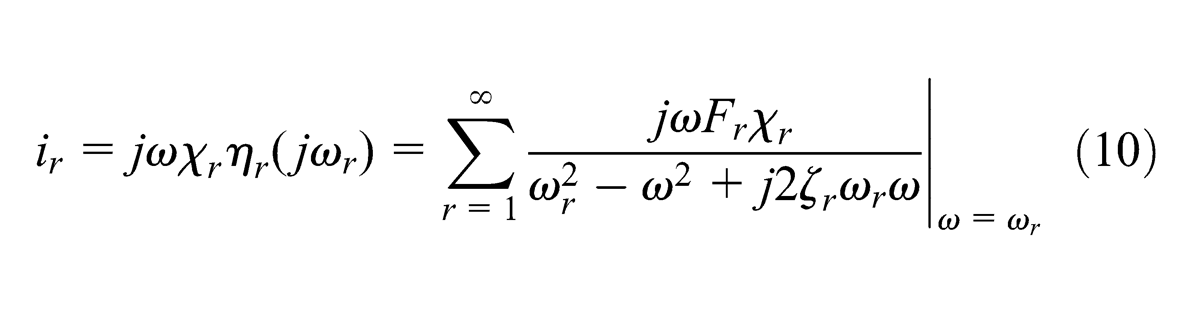
When a harmonic base acceleration
The voltage across
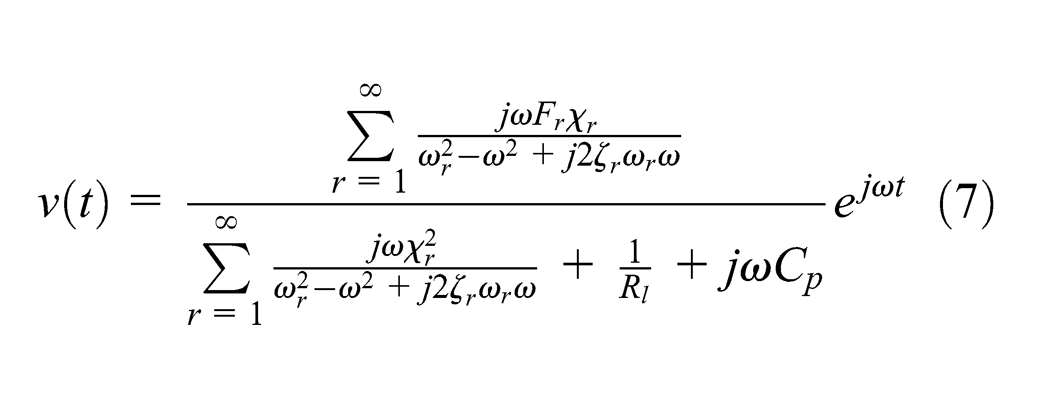
Hence, solving equation (7) in the frequency domain gives the complex power simply as
Finite element model
When the VEH model is not uniform, the derivations of the eigenfunction
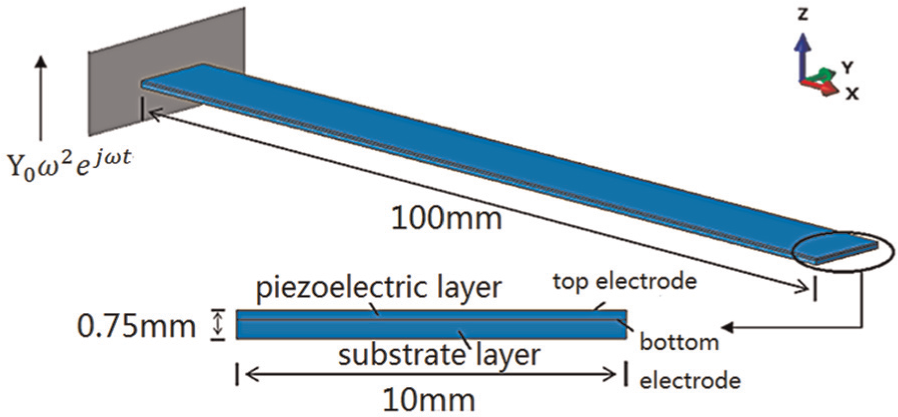
Unimorph rectangular cantilevered beam model A.
Properties of the unimorph rectangular cantilever model A.
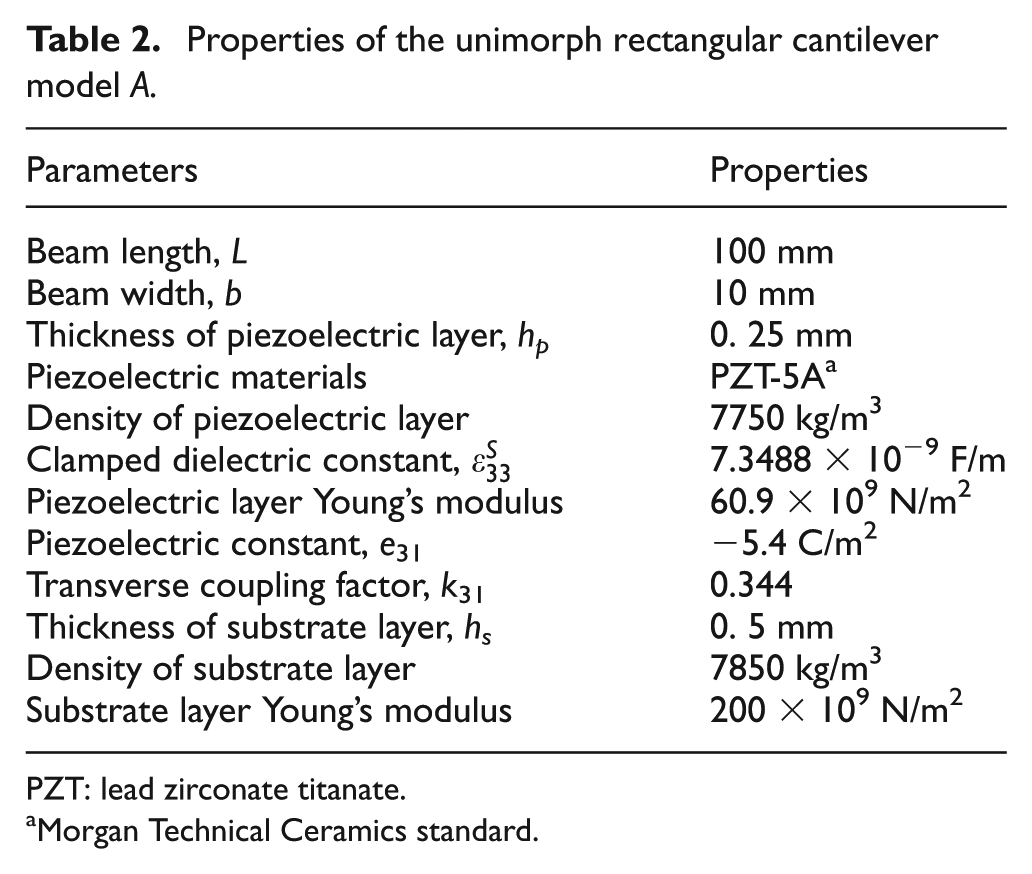
PZT: lead zirconate titanate.
Morgan Technical Ceramics standard.
Using the idea of equivalent circuit model (Yang and Tang, 2009), by letting the applied voltage go to 0 for the short-circuit condition (
where
Then, the modal coupling term
where
Performance determination and optimization strategy
Performance determination
In section ‘Vibration energy harvesting model’, a DPM has been presented. The voltage and power output with different resistive loads can be generated using equation (7). However, the performance of a VEH cannot be clearly determined unless a specified model has been defined. Generally speaking, maximizing the VEH’s power output is the primary objective of design. Guyomar et al. (2009) introduced a criterion to evaluate the maximum average power output of VEH with resistive load (for standard rectifier interface; no electrical losses with rectifier; optimal load is matched)
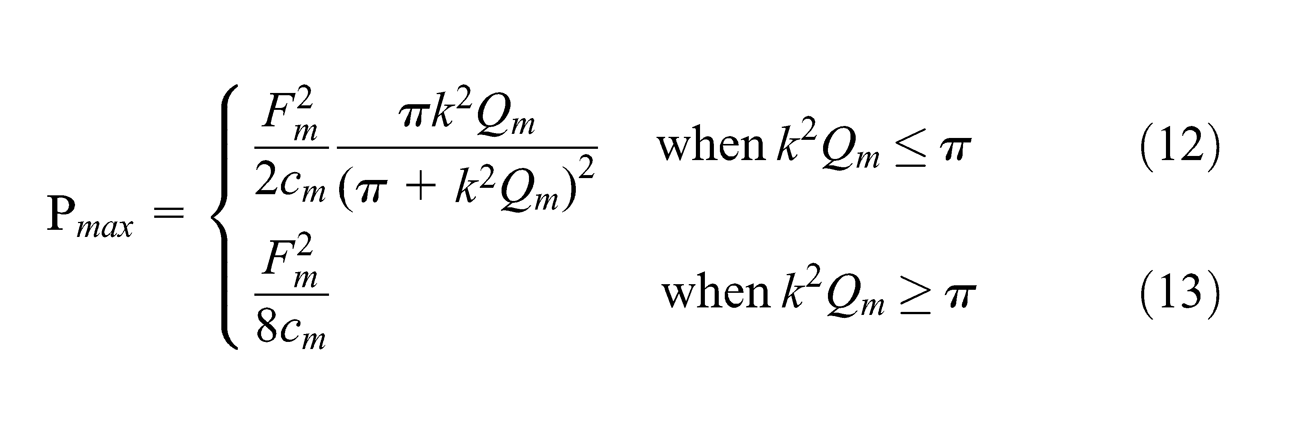
where k is the EMCC;
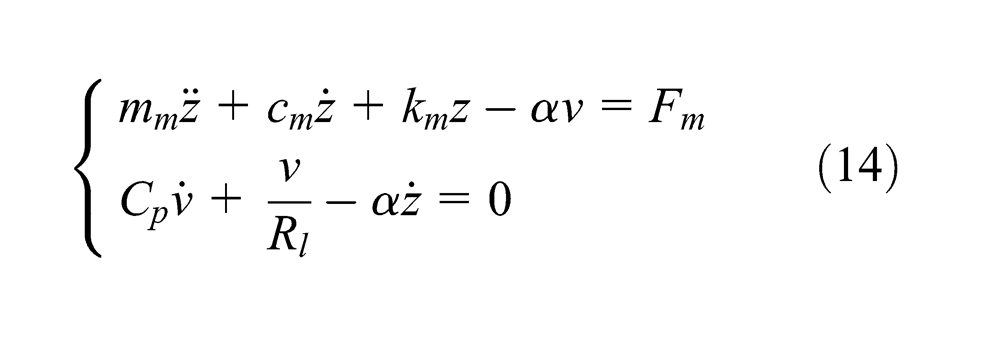
In fact, equations (12) and (13) are based on the assumption of lumped single-degree-of-freedom (SDOF) system and determined by equation (14). Erturk and Inman (2007, 2008b, 2011) discussed the mechanical behaviour and compared the lumped SDOF model with the Euler–Bernoulli beam model and introduced the correction factor of the SDOF model. They found a very good agreement of the relative motion transmissibility (uncoupled) predicted using the Euler–Bernoulli beam model and lumped SDOF model with the correction factor in a wide-frequency band around the resonance. For the fundamental mode in transverse vibration of any RC beam without tip mass,
The corrected lumped forcing function is
and the EMCC and lumped parameters are
and the corrected complex voltage on the resistor is
where z is the relative displacement related to the base motion y;
where me is called the effective mass, which represents the mass participating in the forcing function and motion, and the sum of the effective masses for all modes is the total mass M of the model (SIMULIA Corp, 2010)
It should be noted that the generalized modal mass
where ρ is the mass density (kg/m3) and Nr denotes the mass ratio for the rth mode. The mass ratio N is the percentage ratio of the effective mass to the total mass, which depends on the modal participation factor and represents how much mass of each mode effectively participates in the overall motion and the contribution of each mode to the maximum power output. Apparently, the mass ratio of each mode is always smaller than 1 (N≤1). Table 3 gives the mass ratio of the first four modes of the transverse vibration of RC model A. Obviously, the first mode with the largest N is able to generate greater power than other (higher) modes.
Mass ratio N in the first four transverse vibration modes of RC model A.
RC: rectangular cantilevered.
Parametric studies of mass ratio, EMCC and damping
In the first case, the frequency response functions (FRFs) of MSAPD (input normalized power density) around the fundamental mode of transverse vibration determined by DPM (solid curve ‘D’) are compared with the results determined by the lumped SDOF model with correction factor (dotted curve ‘S’) in Figure 2. Figure 2(b) is the MSAPD FRFs of unimorph RC VEH model A (f1 = 46.83 Hz,
FRFs of the MSAPD with different resistive loads: (a) A with weak coupling; (b) model A and (c) A with strong coupling.
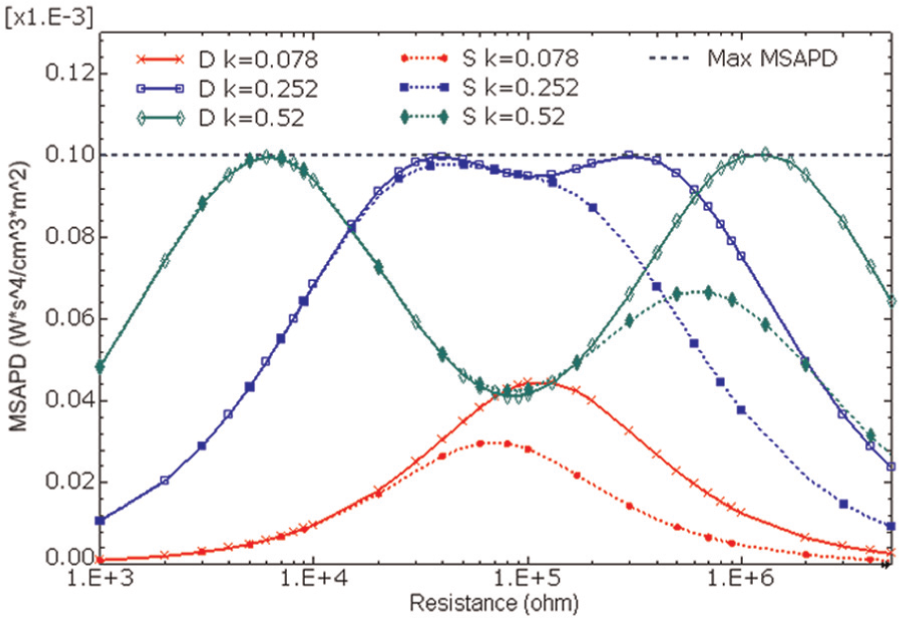
Optimal MSAPD versus resistance using DPM and corrected SDOF with different EMCCs.
In the second case, a parametric study is developed in Figure 4 to present the effects of different mass ratios N on the modal mechanical behaviour and MSAPD FRFs with different coupling conditions. In this case, the forcing function is adjusted based on the parameter of model A (in Figure 4(e)) to ensure the changed mass ratio has been correctly represented in DPM. The results show that, first, increasing the mass ratio can always increase the power density linearly with different coupling conditions and different resistive loads. Second, changing the mass ratio will not affect the system impedance and matched resistive load. Besides, the maximum MSAPD can be determined directly using mass ratio by equation (20). It means using mass ratio can directly represent the influence of modal mechanical behaviour to the maximum power density. It is evident that a weak coupling system in Figure 4(c) (k2Qm = 0.3, N = 80%) can generate a much closer MSAPD in comparison with a strong coupling system in Figure 4(g) (k2Qm = 6, N = 45%). However, the latter one has a wider frequency band due to the stronger electromechanical coupling.
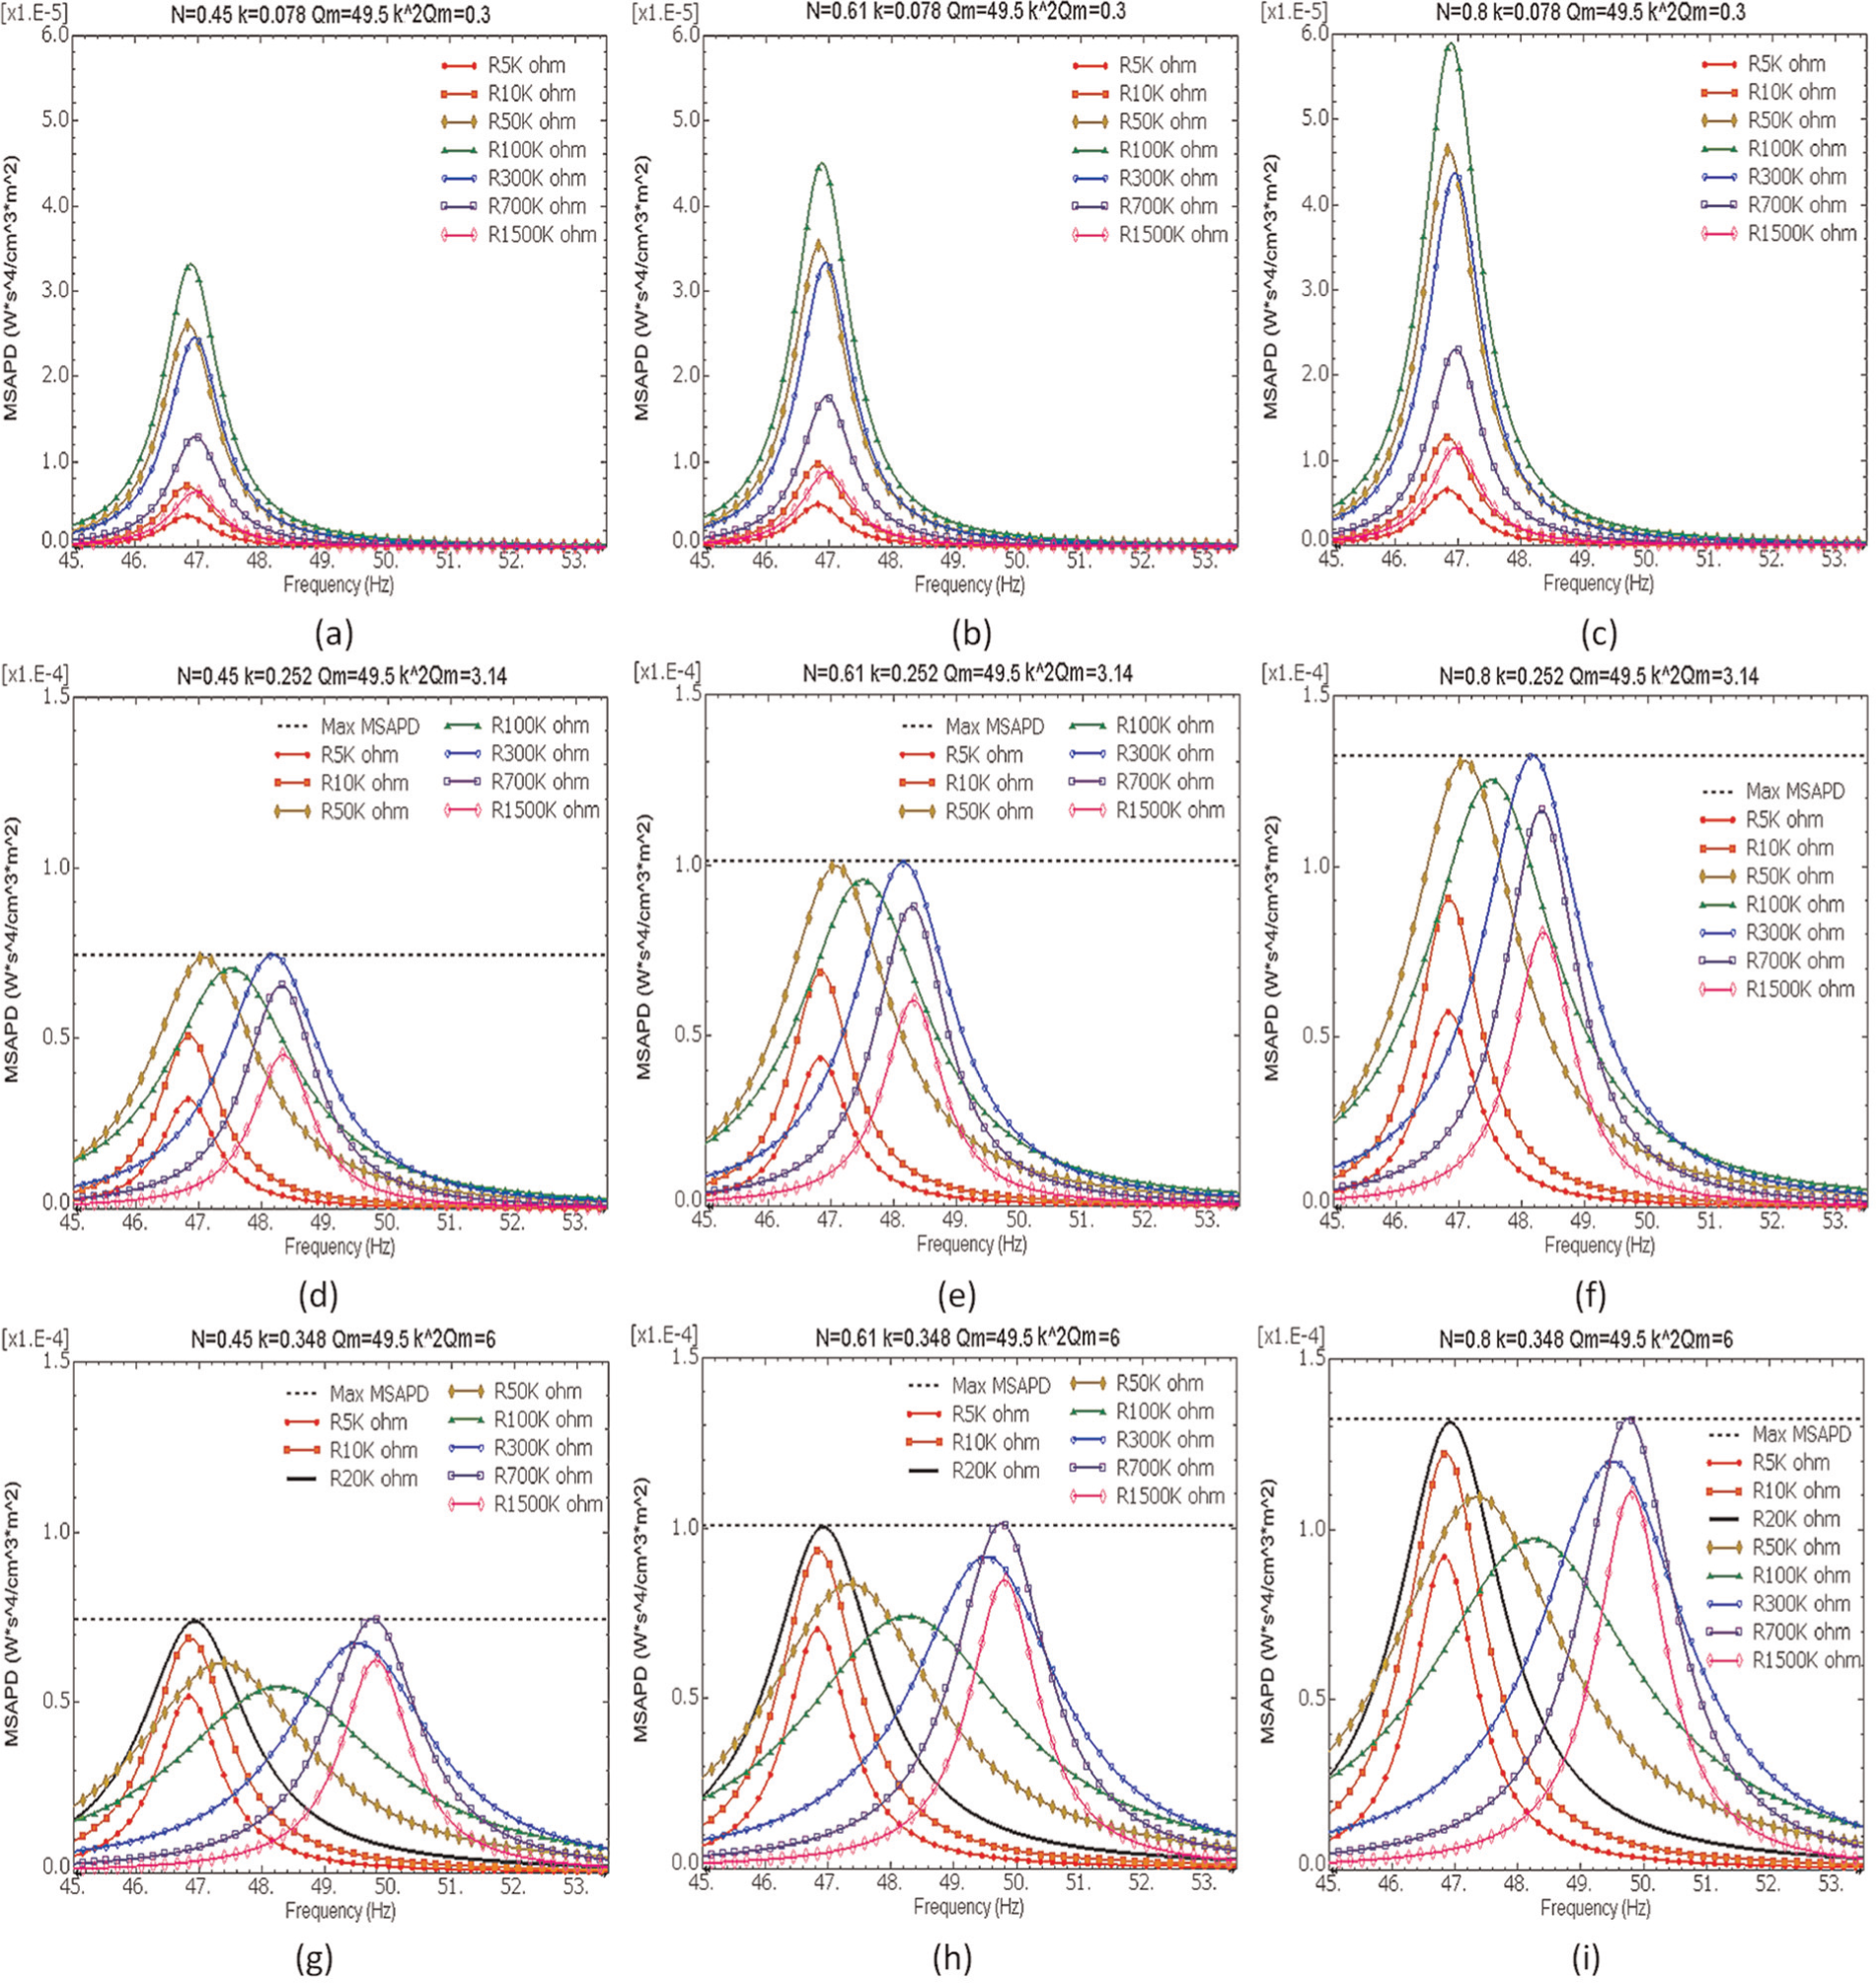
Effects of different mass ratios N to the modal mechanical behaviour and MSAPD FRFs with different coupling conditions: (a, d and g) N = 45%; (b, e and h) N = 61.2% and (c, f and i) N = 80%.
In the third case, the effects of different EMCCs to system electromechanical coupling and MSAPD FRFs are shown in Figure 5. Including the result given in Figures 2(c) and 4(b), (e) and (h), when Qm = 49.5 and N = 61.2%, the values of k2Qm are increased from 0.1, 0.3, 1, 2, 3.14, 6, 10 to 13.38. The results show that, first, the EMCC will not affect the maximum MSAPD when the k2Qm is adequately large. In fact, when k2Qm = 2 (see Figure 5(c)), the maximum MSAPD is already reached by connecting a 100 kΩ resistor, and when k2Qm is decreased to 1 (see Figure 5(b)), the reachable peak of MSAPD is only slightly decreased. Second, when k2Qm becomes much smaller than 1, the power density is significantly decreased. Moreover, the impedance of system and the optimal resistance have been changed with different values of k2Qm. When k2Qm is smaller than 2, the system with an external load around 100 kΩ resistance can attain the highest power density, and it has a resonance frequency, which is always close to the short-circuit resonance frequency. When k2Qm is increased, the maximum power density is manifested by two separate peaks, which occur at two separate frequencies. The lower frequency is obtained when an external load around 10 kΩ resistance is connected. The higher frequency is achieved by connecting an external load of higher 700 kΩ resistance. The higher frequency is close to the open-circuit resonance frequency. A larger k2Qm can generate a larger frequency shift, which is due to the increase of EMCC. When EMCC becomes too large, the system with an external load of 100 kΩ resistance has a much broader peak that lies between the two extreme peaks, but its MSAPD is also significantly decreased. However, with the same k2Qm, the value of EMCC and damping ratio could be different.
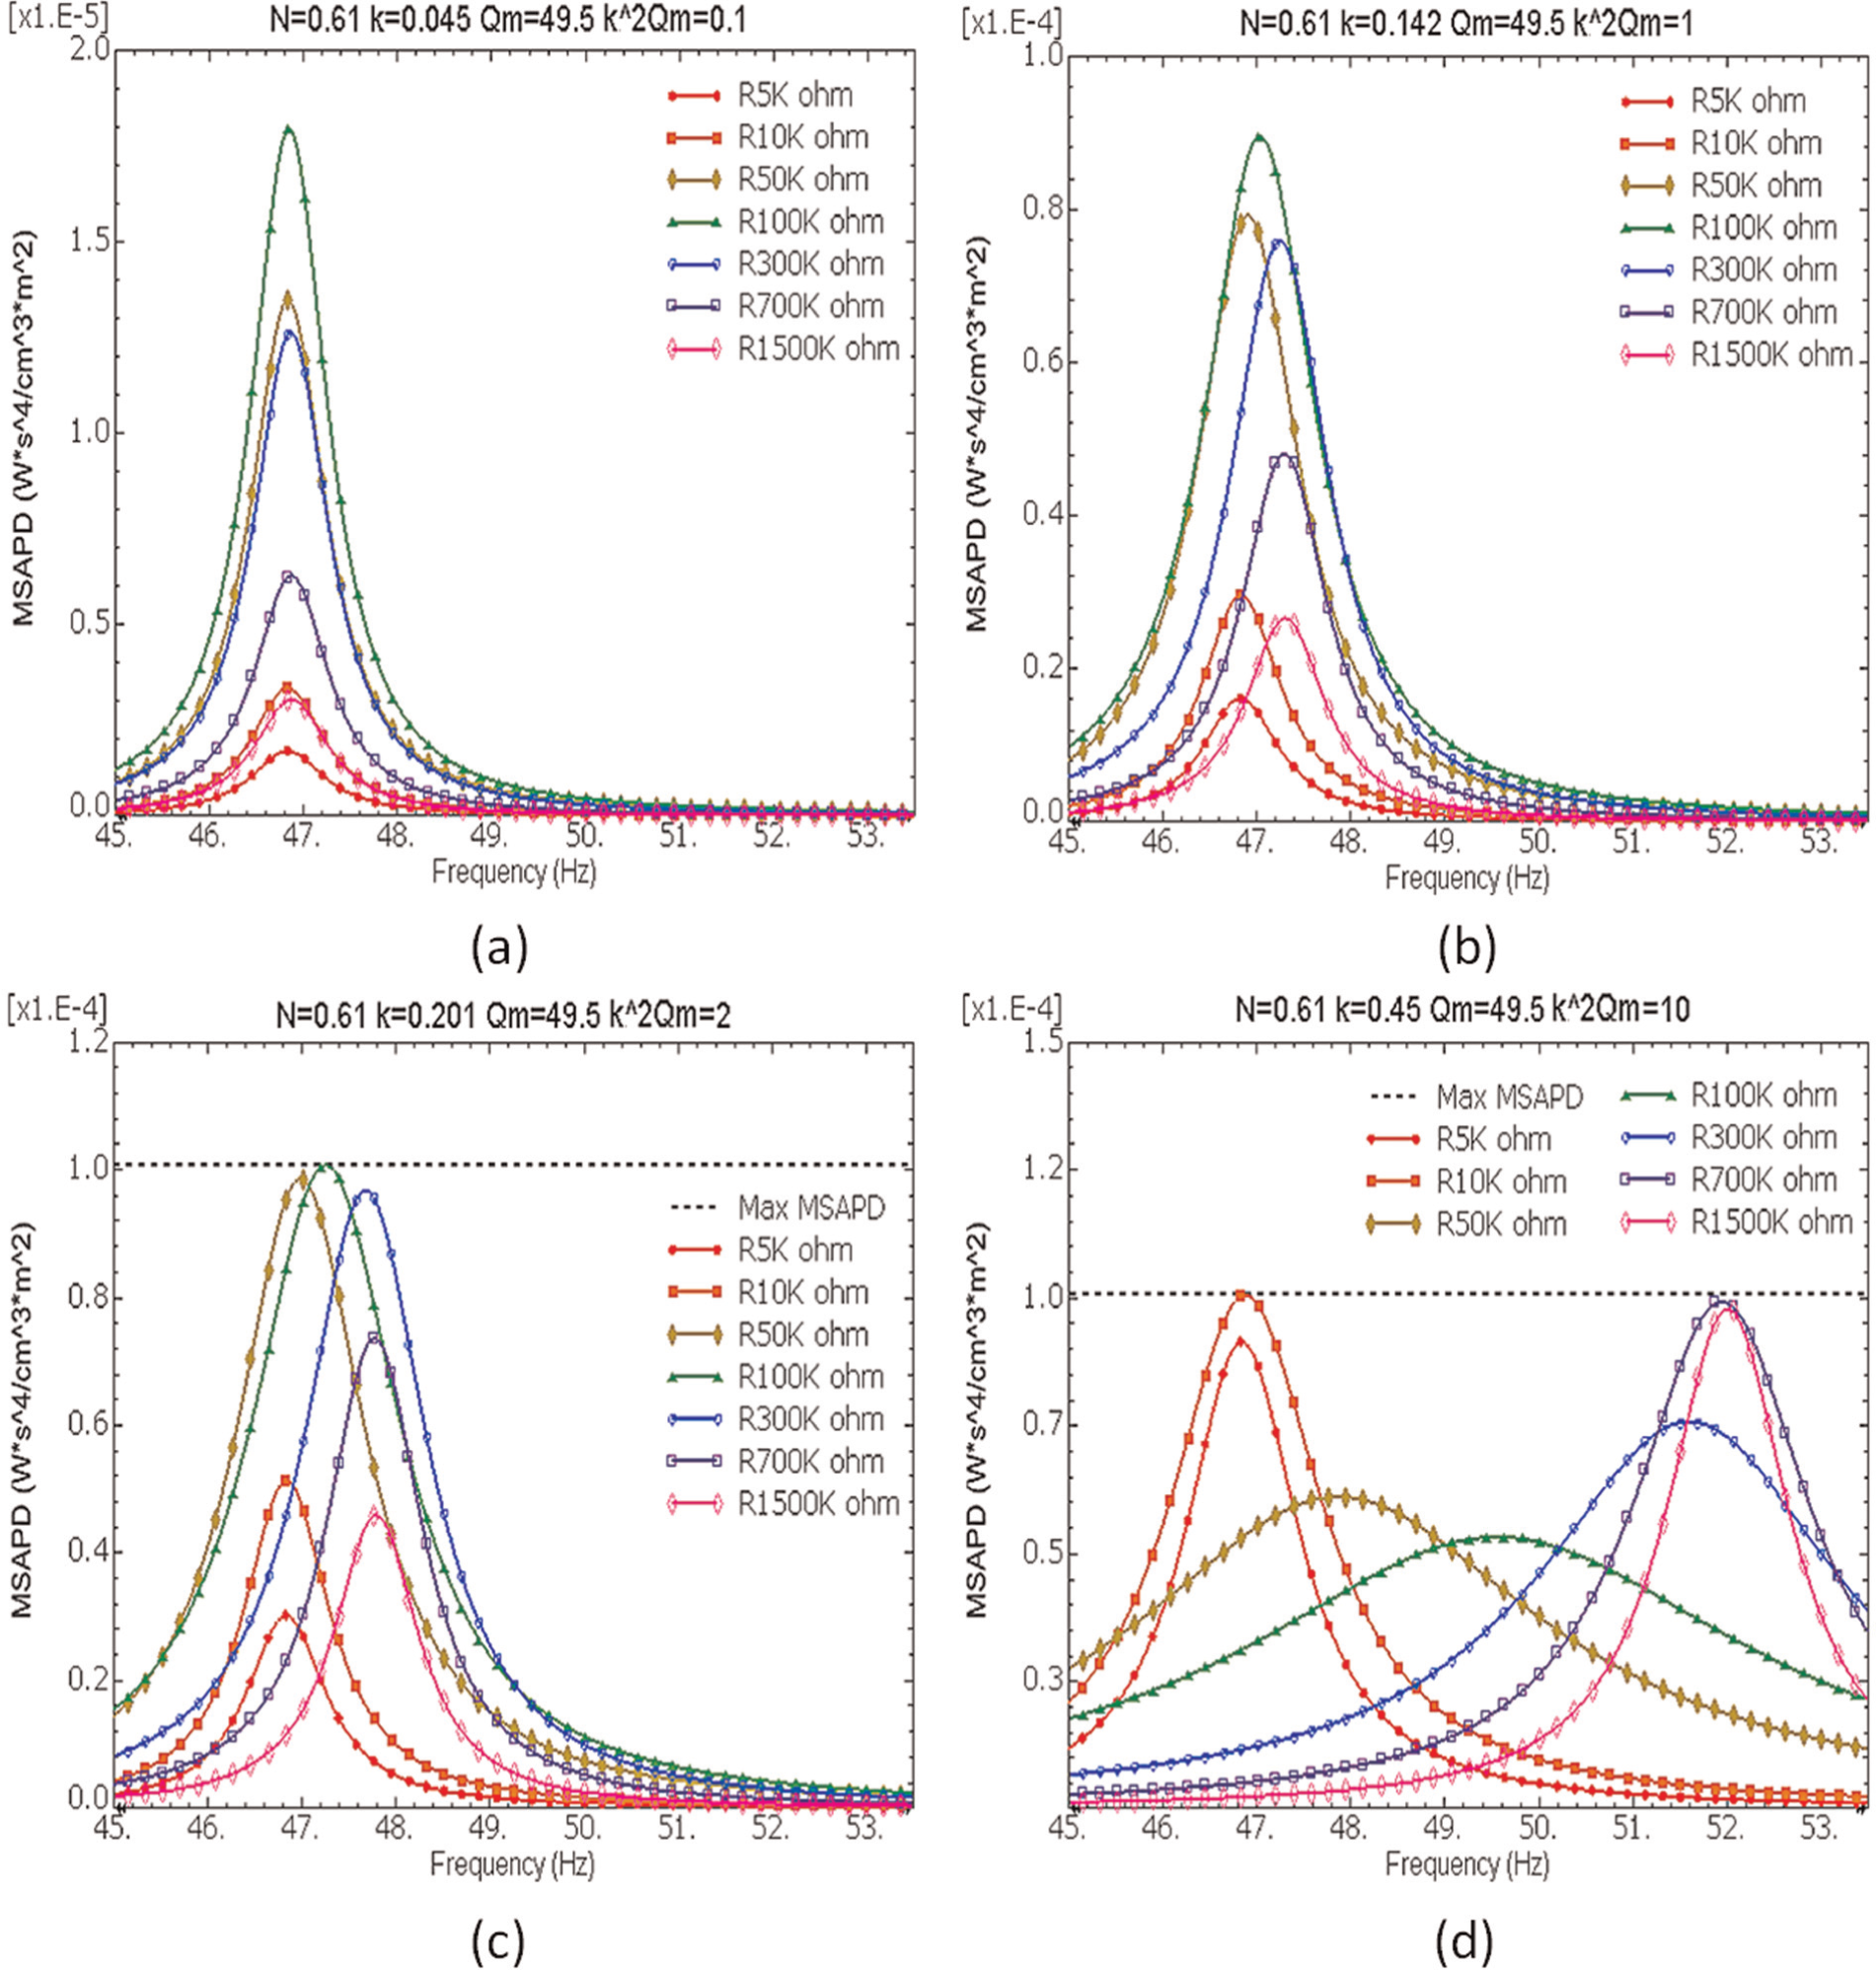
Effects of different EMCCs to electromechanical coupling and MSAPD FRFs: (a) k = 0.045, k2Qm = 0.1; (b) k = 0.142, k2Qm = 1; (c) k = 0.201, k2Qm = 2 and (d) k = 0.45, k2Qm = 10.
Figures 4 and 5 show the range of the MSAPD FRFs for different resistances, mass ratios and EMCC. Figure 6 shows the maximum MSAPD as function of k2Qm for different mass ratios. The points located on the curves in Figure 6 are the maximum MSAPD of the curves in Figures 4 and 5 (except for Figure 5(d)). The results show that mass ratio linearly affects the maximum power density for different values of k2Qm. EMCC only affects the maximum MSAPD when the value of k2Qm is smaller than 2. When k2Qm > 2, the maximum MSAPD becomes purely mechanical, and it is simply determined by the mass ratio. When 1 < k2Qm < 2, the decrease of the k2Qm slightly reduces the maximum MSAPD. When k2Qm < 1, the maximum MSAPD can be significantly decreased.
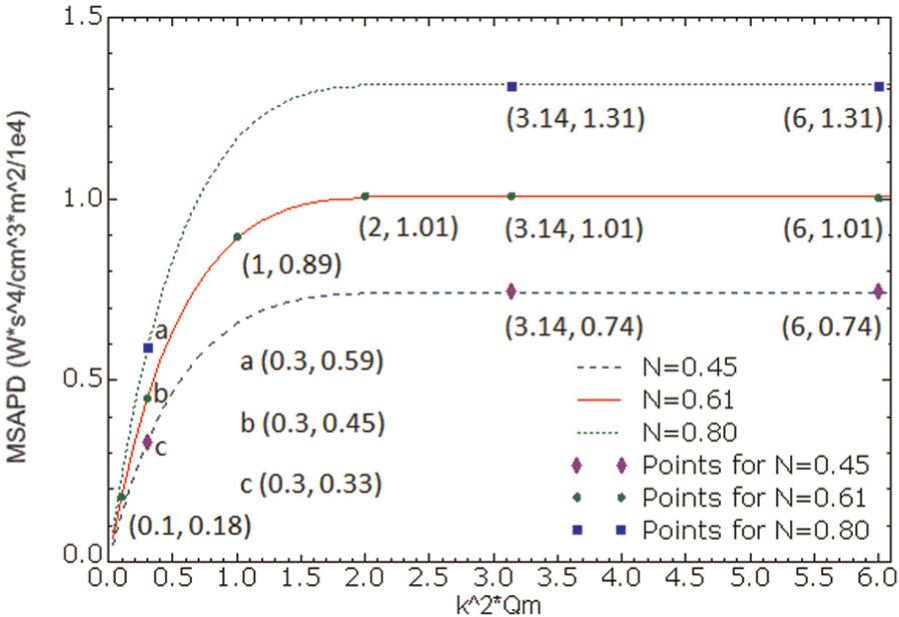
Maximum MSAPD as function of k2Qm with different mass ratios N.
The fourth case is to determine the influence of damping ratio on the electromechanical coupling and MSAPD directly. Figure 7 shows the predicted MSAPD for this case. The cases presented in Figures 5(b) and 7(a) have the same values of k2Qm = 1 but the value of Qm for Figure 5(b) (Qm = 49.5) is thrice that of Figure 7(a) (Qm = 15.8). The corresponding values of MSAPD for the same resistance of 100 kW, for example, are about 9e−5 and 2.9e−5 for Figures 5(b) and 7(a), respectively. That is, the MSAPD value for Figure 5(b) is thrice that of Figure 7(a). Similarly, Figures 5(c) and 7(b) have the same value of k2Qm = 2, and for R = 100 kW, they have Qm and MSAPD values of 49.5 and 10e−5, respectively, for Figure 5(c) and 31.6 and 6.5e−5, respectively, for Figure 7(b), which gives the same ratio of about 1.5. Also, Figures 4(h) and 7(c) have the same value of k2Qm = 6, and for R = 20 kW, they have Qm and MSAPD values of 49.5 and 1e−4, respectively, for Figure 4(h) and 94.5 and 1.93e−4, respectively, for Figure 7(c), which gives the same ratio of about 0.52. In fact, when the MSAPD is not optimized with smaller or larger resistance, the values of Qm and MSAPD still give the same ratio compared between each pair of figures. Thus, it can be inferred, first, that for the same value of k2Qm, the damping ratio affects the power density linearly. Second, with a specified resonance frequency, only the combined effects of EMCC and damping affect the optimal load. Moreover, since the EMCC is constant in Figure 7, the frequency shifts from the lower frequency to the higher frequency with different k2Qm are quite similar. Obviously, a model with a lighter damping is able to generate sharper peaks and higher MSAPD than the one with a heavier damping. But this is at the expense of a reduced frequency bandwidth.
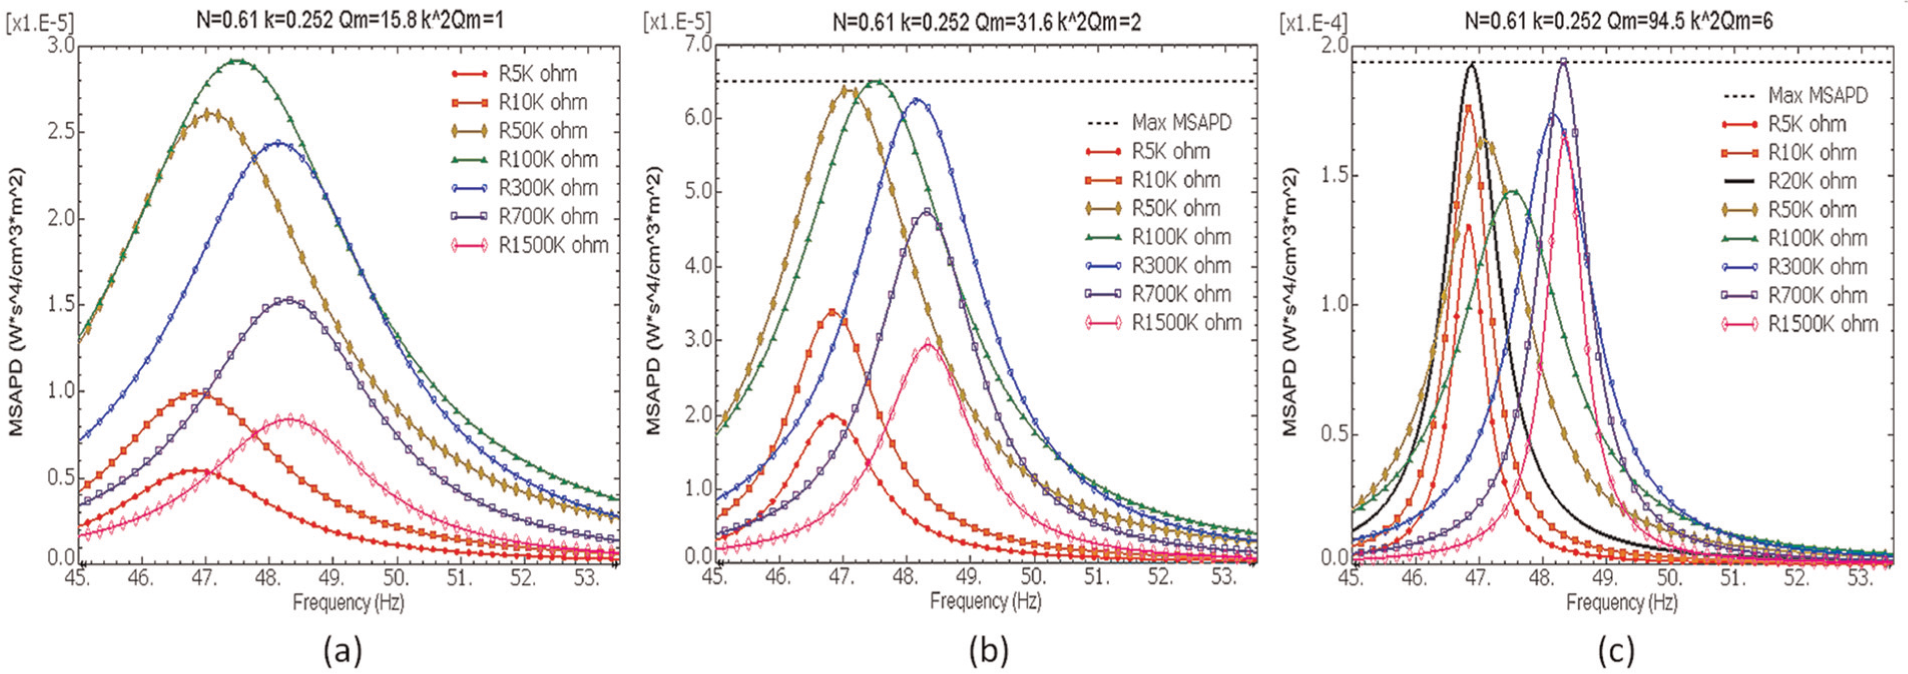
Effects of different damping ratios to the electromechanical coupling and MSAPD FRFs: (a) Qm = 15.8, ζ = 0.0316; (b) Qm = 31.6, ζ = 0.0158 and (c) Qm = 94.5, ζ = 0.0053.
Optimization strategy
From the expressions and case studies given in sections ‘Performance determination’ and ‘Parametric studies of mass ratio, EMCC and damping’, with a normalized acceleration input, there are four factors directly affecting the performance of VEHs: mass ratio, EMCC, damping ratio and resonance frequency. The system modal electromechanical coupling depends on the interaction between the EMCC and damping ratio. The effect of modal mechanical behaviour on power density is represented by mass ratio, which indicates how much mass effectively participates in the motion of the particular mode and affects the power density linearly. In fact, when the damping ratio and resonance frequencies are fixed, the mass ratio and EMCC are the two modal factors for the optimization of a VEH. Therefore, the optimization strategy in this article is implemented by two approaches: investigate and optimize the EMCC and mass ratio separately with geometric parameter study. On the one hand, if the EMCC is adequately large and system coupling is certainly strong, the reachable power can be optimized and it will be purely mechanical. On the other hand, for a certain k2Qm, the model with a larger mass ratio N can always generate higher power density.
Damping not only significantly affects the maximum power output but also affects the electromechanical coupling. A system with a large EMCC but high damping will let the system coupling become weak. However, damping is already simplified on simulation stage and should not be used to optimize the performance since the mechanism of damping in real applications is not quite clear and hard to control precisely. Besides, the effects from electrical losses, like dielectric losses and losses on electrical components, should also be considered in real applications. Therefore, the investigations of matching resistance to specified models could be meaningless at the design stage, since the electromechanical coupling of the system combines the effects of damping and EMCC simultaneously. Furthermore, a VEH with a very small damping could be useless, because while it generates high peak power at resonance, it has a narrow band of power output. Thus, the power drops off significantly when the system is running off the resonance frequency.
Therefore, to optimize the power output without clarifying the system modal coupling situation and mechanical behaviour first could make the whole analysis to become inadequate or even useless. However, existing studies of cantilevered VEHs widely ignore this. The improvement or variation to the power output in one study compared with other studies can be easily confused since the influences to the performance of VEHs from these two factors are mixed. Especially, if the investigation of power output did not remove the effect of the resonance frequency or even incorrectly normalized the input, the results will be misleading. For example, instead of dividing the power by the square base acceleration, Zhu et al. (2010) incorrectly normalized the power by dividing it by the base acceleration. Finally, it should be noted that equations (12) and (13) are only valid for the resonance situation with the assumption that optimal loads are always matched. For real applications, the VEHs could easily operate off the resonance and finding a matching load is necessary. Besides, equation (12) did not consider the back coupling effects. Therefore, DPM should always be used to derive the power output FRFs of VEHs, as it will yield correct predictions at resonance as well as off-resonance conditions.
Modal electromechanical coupling optimization
RC beams
Figure 8 shows the variations of the EMCC in the first three modes as a function of the length/width ratio of RC unimorph beams. In this case, the thicknesses of substrate and piezoelectric layers are 0.5 and 0.25 mm, respectively. The widths and lengths are altered simultaneously to keep the volume the same as model A. The first natural frequencies of VEHs are from 11.65 to 299.5 Hz and they are from 72.99 to 1857.8 Hz for the second mode. It has been found that the first mode has the highest EMCC, and the magnitude of EMCC is much lower in the second and third modes. In fact, the vibration mode shapes of higher modes change the strain distributions along the length of the beam and cause the electric displacement D along the thickness to be partly reversed, and then the total charge is decreased due to self-cancellation. Besides, the shorter beam with smaller length/width ratio has the stronger coupling. The EMCC can be increased by more than 10% when the length/width ratio is less than 2. When the length/width ratio is too small, the model is more like a plate instead of a cantilevered beam. The results show that when lead zirconate titanate (PZT)-5A (k31 = 0.344) is used with a typical damping ratio (0.01–0.03) in the first mode, the system can have medium to strong coupling.
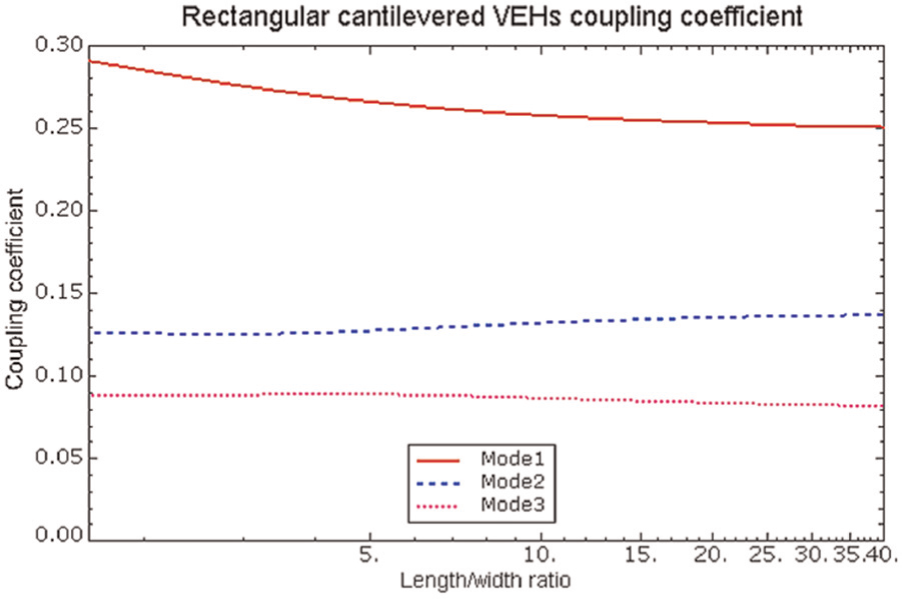
EMCC in the first three modes.
Tapered cantilevered beams
In addition to the RC beams, Roundy et al. (2005) indicated that a tapered cantilevered (TC) beam with a larger clamped end and smaller free tip produces a higher strain distribution in the first mode, which is able to increase the power output significantly. Table 4 describes the EMCC of some typical TC models modified from model A in the first and second modes, and Figure 9 shows EMCC of TC models as a function of different width ratios (W2/W1). The ratio of the free tip to the clamped end is from 0.05 to 9. This results in CTC beams with wider clamped end but narrow free end, and DTC beams with narrower clamped end but wide free tip models, as shown in Figure 10. It is evident that the DTC model has the lower natural frequency and vice versa. For the smallest width ratio of 0.05 in CTC (similar to triangular beam), it has been found that the EMCC is enhanced in the first mode from 0.252 to 0.296 but it is also weakened by almost the same amount in the second mode. On the contrary, the EMCC of DTC with width ratio of 4 in the first mode is decreased from 0.252 to 0.192 but it is increased from 0.132 to 0.178 in the second mode.
EMCC of the TC VEHs modified from model A in the first two modes.
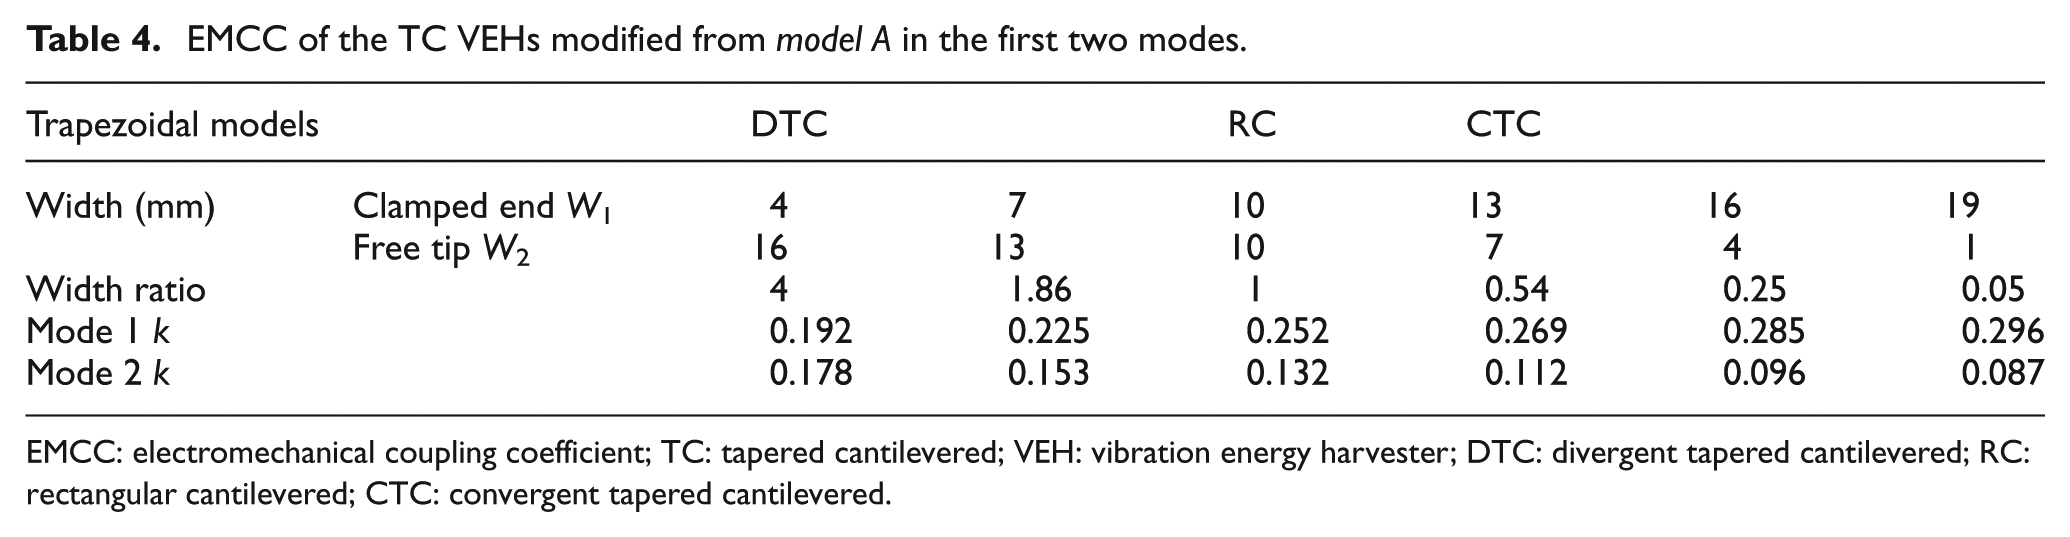
EMCC: electromechanical coupling coefficient; TC: tapered cantilevered; VEH: vibration energy harvester; DTC: divergent tapered cantilevered; RC: rectangular cantilevered; CTC: convergent tapered cantilevered.
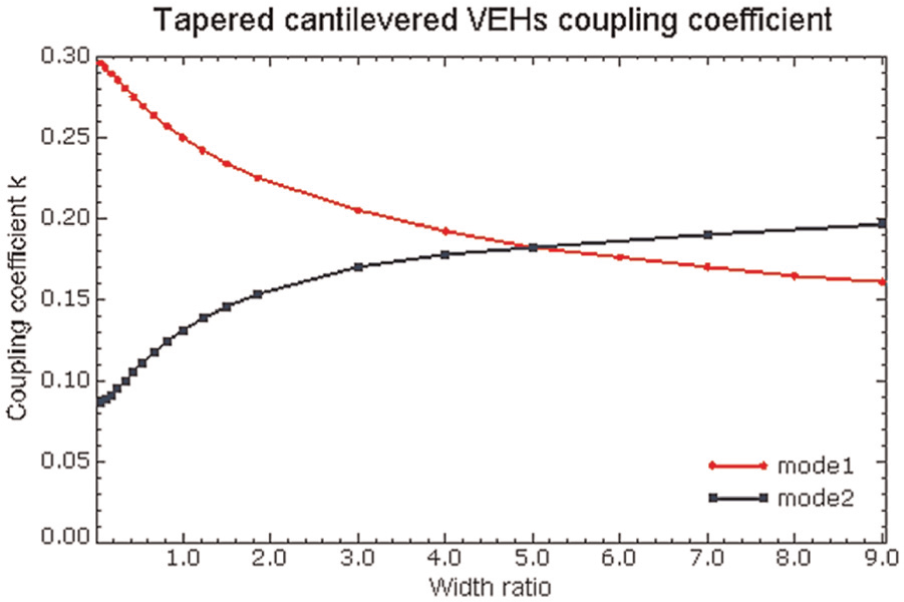
EMCC of the TC VEHs with different width ratios.
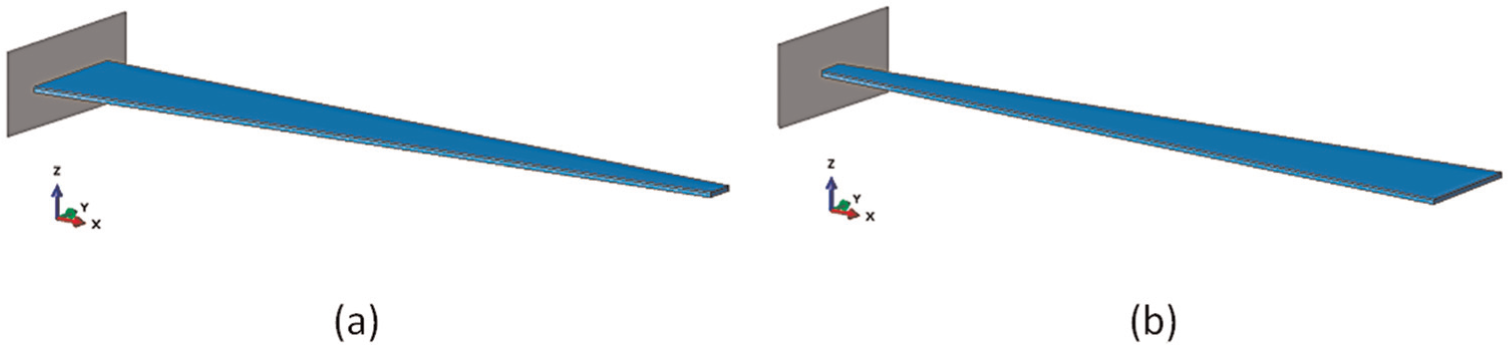
Views of the tapered beams modified from model A: (a) convergent (CTC) and (b) divergent (DTC).
Unimorph and bimorph with varying piezoelectric coverage
Due to the high cost of piezoelectric materials, usually the substrate layer of a VEH is not fully covered by the piezoelectric materials, especially for the larger VEHs with lower resonance frequencies designed for environmental vibrations. Besides, there is another widely used method to enhance the coupling by attaching two piezoelectric layers on both the top and bottom of the substrate layer, which is called the bimorph structure. Three models have been investigated, namely, RC (model A), DTC (width ratio of 4) and CTC (width ratio of 0.25) with both unimorph and bimorph structures and different coverages in order to study the effects of coverage on the EMCC. The results are shown in Figure 11. The coverage is defined as the percentage of the surface area of the piezoelectric layer to the surface area of the substrate from the clamped end to the free tip. The results of RC model in Figure 11(a) show that the bimorph structures can generate reasonable enhancement of EMCC in most conditions, which is a maximum of 20% of the EMCC of the unimorph models. With the 50%–70% coverage, both unimorph and bimorph models have the highest EMCC in the first mode, whereas they have the lowest EMCC in the second mode due to the adverse strain distributions which cause the strongest cancellations. The higher EMCC in the second mode occurs within the 20%–30% coverage, while an acceptable k is still produced in the first mode. For instance, the k in the first and second modes for the bimorph model with 30% coverage are 0.294 and 0.234, respectively. Apparently, using small coverage is able to avoid self-cancellation in the second mode, and it also saves the piezoelectric materials. The model with 100% coverage has the weaker coupling compared with the 60% coverage in the first mode. This is because when the coverage is increased and the area close to the free tip is covered, the significant drop of strain distribution near the free tip causes the increase of the total charge to be relatively less than the increase of the capacitance Cp.
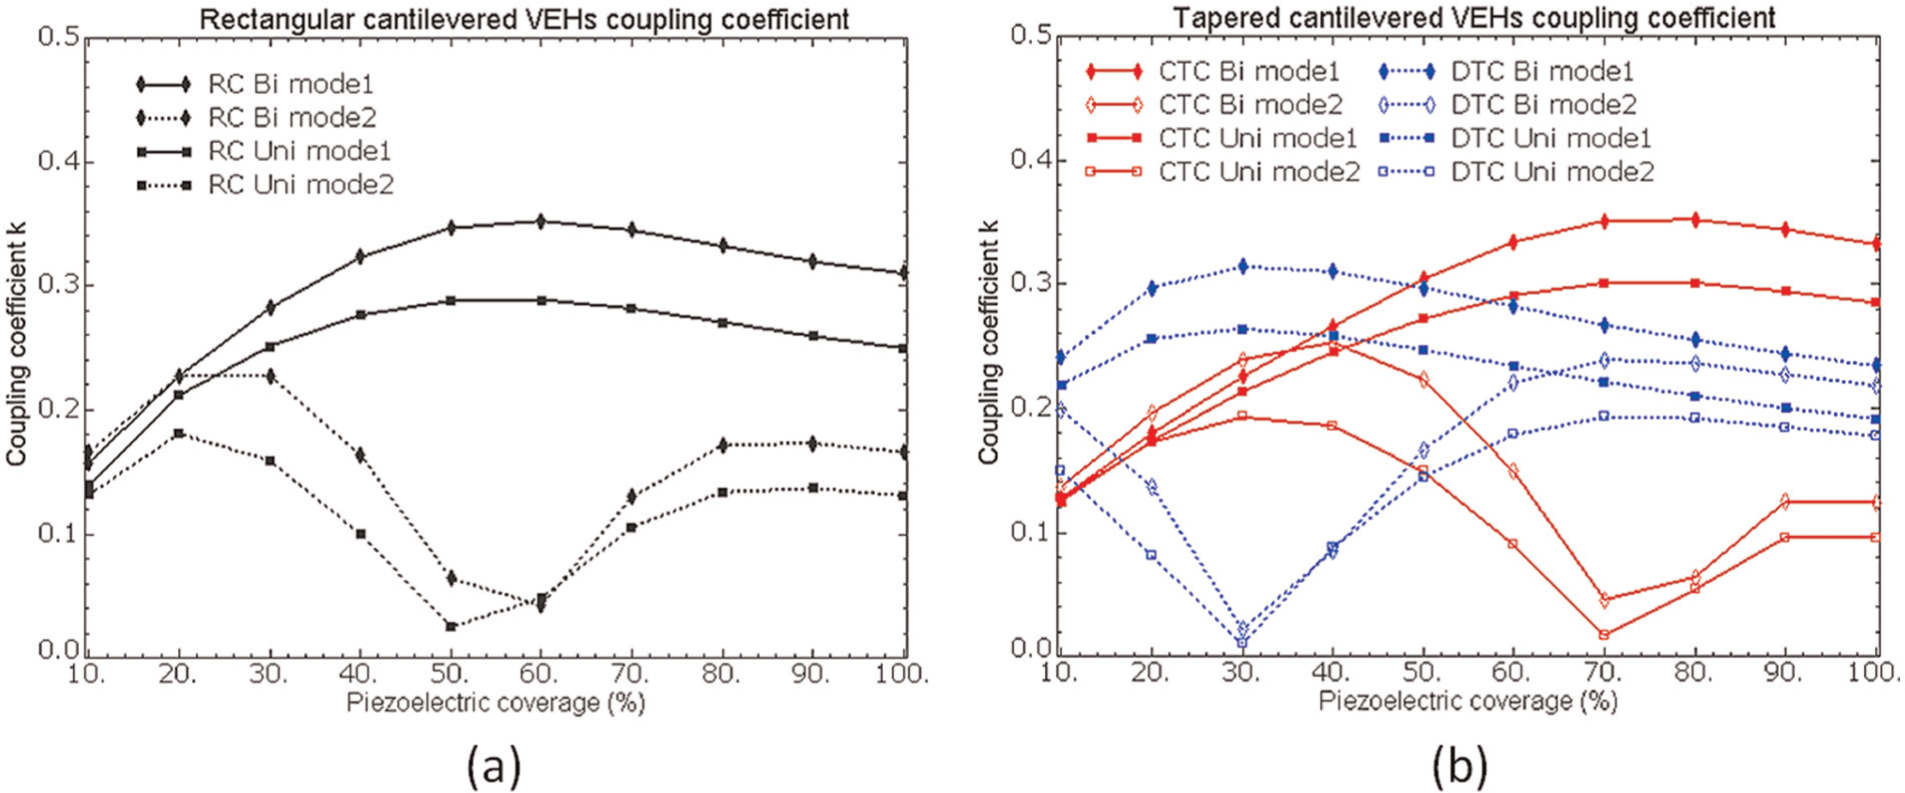
EMCC of cantilevered VEHs in modes 1 and 2 with bimorph and unimorph structures and three width ratio of 0.25 (CTC), 1 (RC) and 4 (DTC) from 10% to 100% piezoelectric coverage: (a) RC, (b) DTC and CTC.
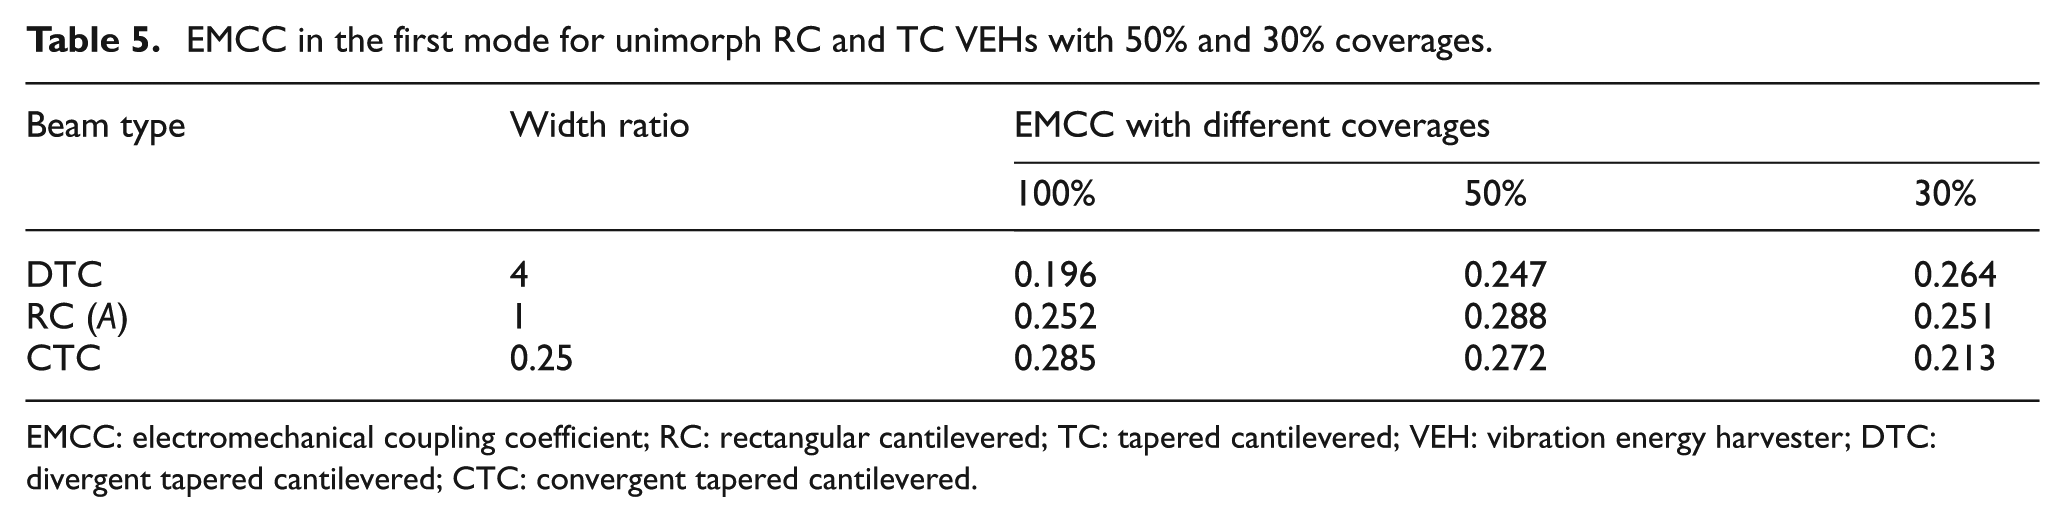
In fact, the CTC structure enhanced the EMCC in the first mode due to the covered area close to the clamped end being larger than the free tip. Similarly, if the piezoelectric coverage of the DTC model is reduced from the free tip, k is increased much more than the increase obtained in the k for a RC model of the same coverage. The results in Table 5 show that the DTC VEH with 30% and 50% piezoelectric coverage and width ratio of 4 is able to produce a much larger k than 100% coverage, and it is even larger than the RC with 100% coverage. However, the CTC with 30% and 50% piezoelectric coverage and width ratio of 0.25 generates a lower k than 100% coverage. Figure 11(b) shows the variations of k of the DTC and CTC VEHs in the first two modes. By comparing with Figure 11(a), it is evident that the highest k of the DTC VEH is the lowest value of k of the three VEHs. However, the DTC VEH requires much smaller coverage to generate its optimized coupling coefficient, which is around 30% for the width ratio of 4 and which will require less piezoelectric materials than RC and CTC models. Generally, the fully covered model does not have the best performance and the piezoelectric materials should cover the area with large strain and the coverage should be limited. This helps to optimize the system coupling.
EMCC in the first mode for unimorph RC and TC VEHs with 50% and 30% coverages.
EMCC: electromechanical coupling coefficient; RC: rectangular cantilevered; TC: tapered cantilevered; VEH: vibration energy harvester; DTC: divergent tapered cantilevered; CTC: convergent tapered cantilevered.
Similar work can be found in Patel et al. (2011), which showed the influence of coverage on the back coupling term in unimorph RC VEHs. First, the back coupling term given in their electrical governing equation is not the same as the forward coupling term given in their motion governing equation. In fact, it is allowed to use one equivalent modal coupling term to represent these two different terms (Erturk and Inman, 2011). Second, the EMCC is actually the product of the two coupling terms. In Patel et al.’s article, the back coupling term was only increased rapidly and maximized with a very small coverage and decreased continuously to the full coverage. However, the power output was optimized at 50%–60% coverage (system coupling was designed to be weak to medium in their designs). Therefore, they incorrectly concluded that the variation of coverage to EMCC is not corresponding to the maximum power.
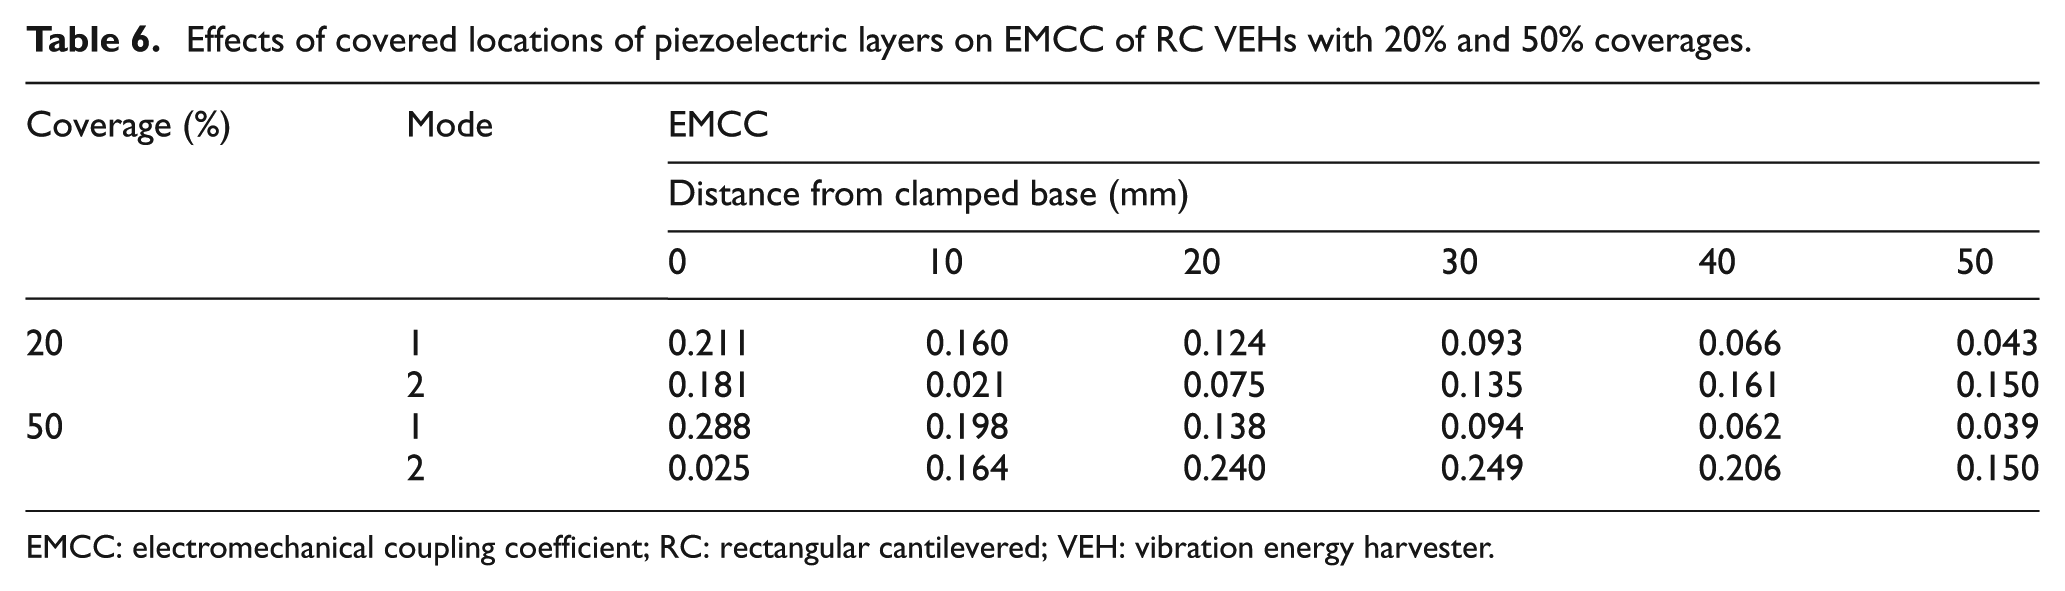
In fact, the covered location of the piezoelectric layer can be different with the same coverage. Table 6 shows the effects of different covered locations on the EMCC of RC VEHs with 20% and 50% coverage. The piezoelectric material location is moved from the clamped base to the free tip. When the piezoelectric material location from the base is more than 20 mm, the EMCC can be optimized in mode 2 because the self-cancellation effect, due to the location of the strain node to the base, is eliminated. However, the EMCC of mode 1 is significantly decreased when the piezoelectric material is not fixed to the base.
Effects of covered locations of piezoelectric layers on EMCC of RC VEHs with 20% and 50% coverages.
EMCC: electromechanical coupling coefficient; RC: rectangular cantilevered; VEH: vibration energy harvester.
Some existing works have focused on enhancing the EMCC using segmentation, which is achieved by separating the piezoelectric layer into two or multiple parts from different strain nodes due to the mode shapes. The segments can be in series or parallel connection with the load to avoid self-cancellation in higher modes. However, the self-cancellation still reappears in mode 1 unless multiple sets of rectifiers are used, which will generate much higher electrical losses in real applications. Furthermore, the findings in section ‘Modal mechanical behaviour optimization’ indicate that the fundamental mode generates the largest mass ratio, which produces the highest power density. Then, for the optimal designs of cantilevered VEHs, using segmentation to enhance the EMCC in higher modes is not effective.
Effect of thickness ratio
In the previous cases, the thicknesses of the piezoelectric and substrate layers are 0.25 and 0.5 mm, respectively. In this section, the thickness of model A is changed in order to determine the effects of thickness ratio on EMCC. Table 7 shows that when the total thickness is changed from 0.3 to 1.5 mm and the thickness ratio of piezoelectric to substrate layer is 0.5, the EMCC is basically constant. Figure 12 shows the variations of the EMCC in the first mode with different coverage and thickness ratios. It shows that the EMCC will be generally strong when the thickness ratio is from 0.4 to 0.9. The model with a smaller coverage is more suitable for the smaller thickness ratio. For example, the EMCC will be maximized when the thickness ratio is 0.4 with 10% coverage, and it increases to 0.9 with 100% coverage. Moreover, the decreases of the EMCC by changing the thickness ratio with 100% coverage are less than the smaller coverage models, especially when the thickness ratio becomes large. Therefore, for a partly covered VEH, no matter what kinds of materials are used, the thickness of piezoelectric and substrate layers should be carefully chosen to optimize the EMCC.
EMCC of unimorph RC VEHs with different total thicknesses and thickness ratios of 0.5.
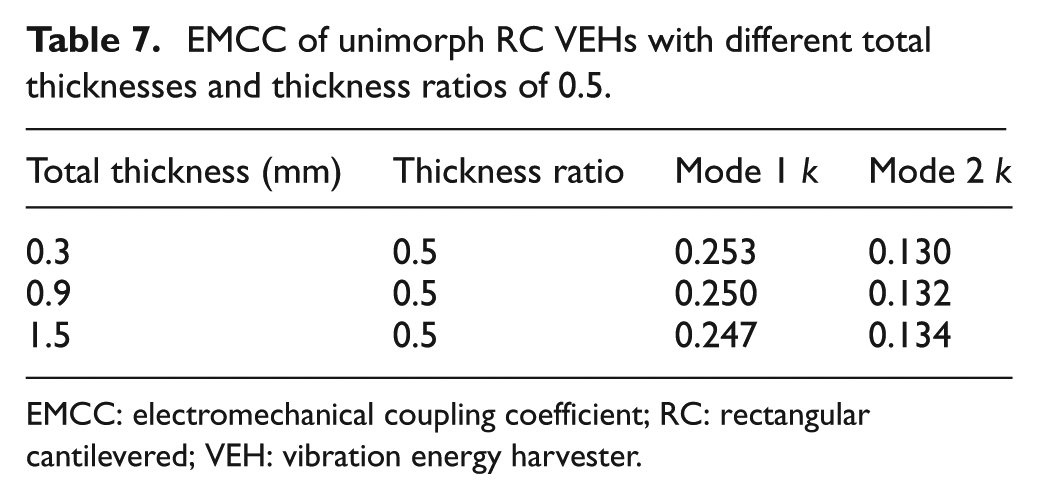
EMCC: electromechanical coupling coefficient; RC: rectangular cantilevered; VEH: vibration energy harvester.
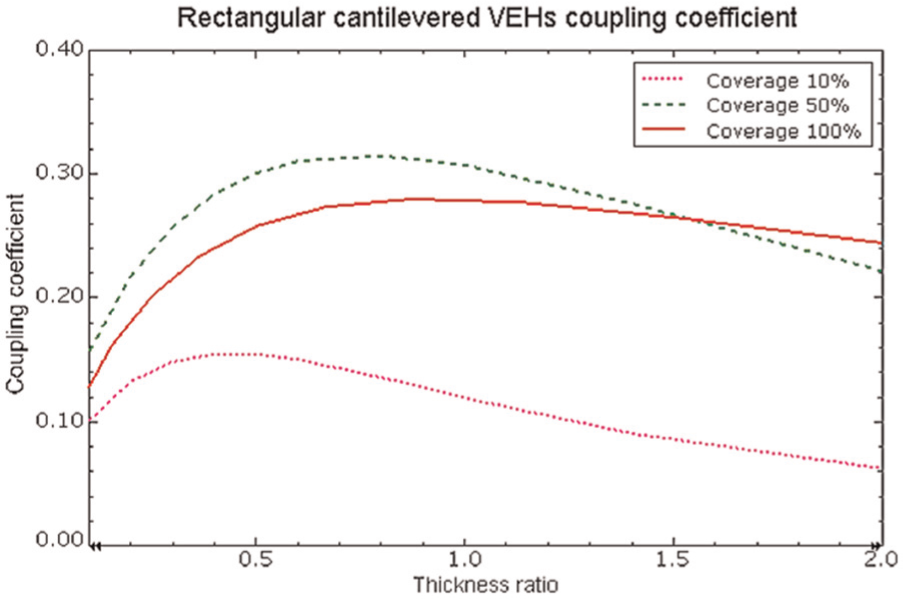
EMCC with different coverage and thickness ratios in the first mode.
Modal mechanical behaviour optimization
RC beams
Table 8 presents the mass ratio N of the first two modes of some typical RC models modified from model A by changing the length and width. It shows that the mass ratios of RC beams are constant in each mode and it is frequency independent. For a specified frequency, a RC VEH that operates in the first mode can generate more than 3 times and nearly 10 times maximum MSAPD than the one that operates in the second and third modes, respectively. Another RC case has been developed to find out whether using frequency control technique but totally different dimensions affects the mass ratio. The results in Table 9 show that the mass ratios of the first mode are still nearly identical.
Mass ratio N of the typical rectangular cantilevered VEHs of constant volume in the first three modes.
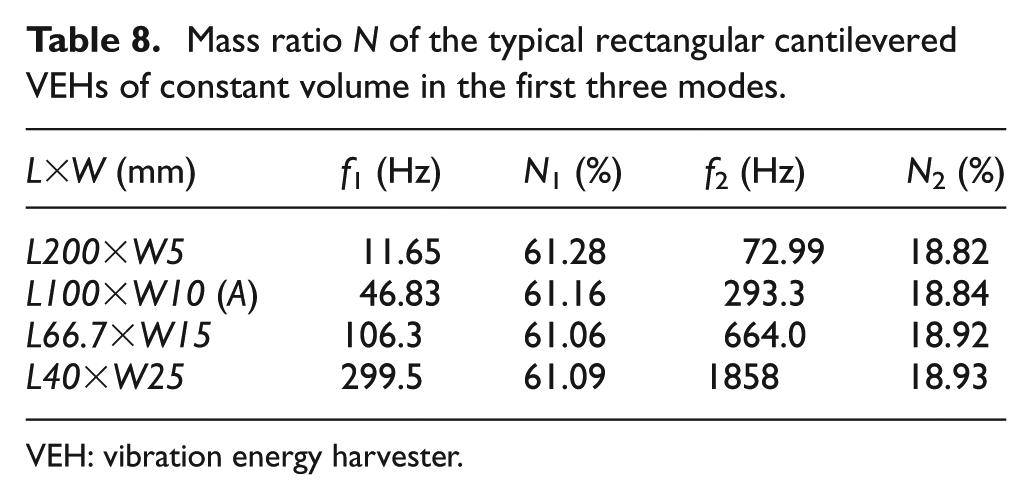
VEH: vibration energy harvester.
Mass ratio N of the RC VEHs with different volumes and constant natural frequency in the first mode.
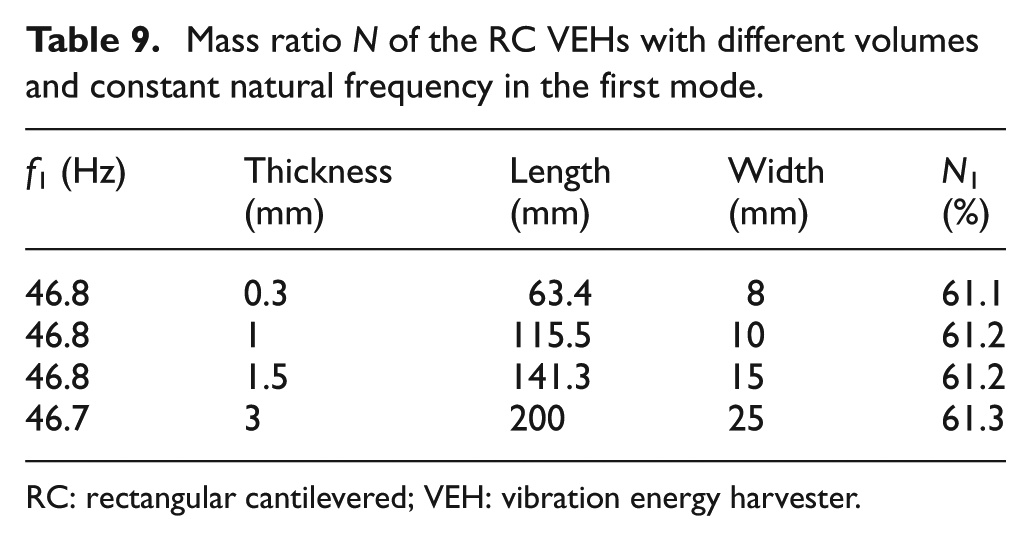
RC: rectangular cantilevered; VEH: vibration energy harvester.
Therefore, since the vibration mode shapes and mass distributions to the modal participation factors of different RC beams in each mode are nearly identical, it results in constant mass ratios of the RC beams. As section ‘Performance determination and optimization strategy’ shows that the mass ratio determines the maximum power density, analyses of RC VEHs without tip masses in existing works by changing the geometric parameters are not able to determine the influence of the mechanical behaviour, and the optimized power is only affected by variation of EMCC and electromechanical coupling.
TC beams
Some typical mass ratios N of the TC VEHs modified from RC model A in the first three modes are given in Table 10. The results show that the mass ratio of CTC with width ratio of 0.05 (similar to a triangular beam) in the first mode is reduced from 61.2% to 46.2%. For the DTC with width ratio of 4, the mass ratio is increased from 61.2% to 74.7%. Table 11 shows the mass ratios of different DTC models with the same width ratio of 4. It is evident that the mass ratios are nearly the same when the width ratio of TC is fixed. Figure 13 shows the general relationship between the width ratio and mass ratio of TC models for the first mode. Figure 14 shows that although the DTC has more possibility to generate the larger maximum MSAPD due to the higher mass ratio, its lower EMCC (see Figure 9) may eventually reduce the magnitude of the reachable peak of MSAPD when the system coupling becomes weak. In Figure 14, the reachable MSAPD is derived by DPM and the maximum MSAPD is obtained by assuming the MSAPD is always maximized. Besides, when the frequency is lower, the larger damping ratio also affects the system electromechanical coupling and causes the decreases of reachable MSAPD in both RC and TC VEHs. However, a DTC with small piezoelectric coverage can effectively increase the EMCC and generate higher power density. For a system that does not have a weak coupling, the CTC will generate lower power density than RC and DTC since the lower mass ratio and the increased EMCC of CTC will only affect the maximum power slightly.
Typical mass ratio N of the TC VEHs modified from A in the first two modes.
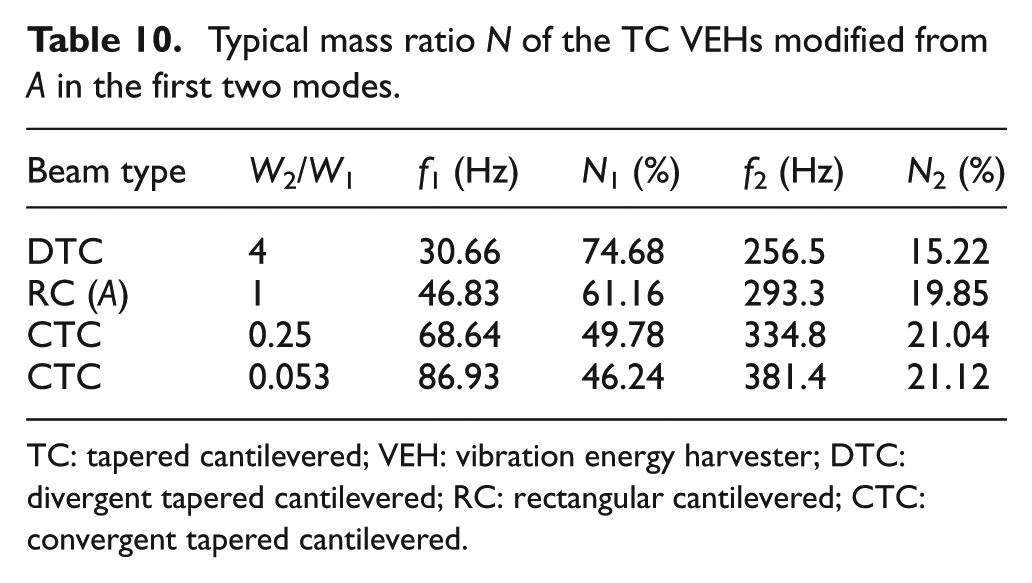
TC: tapered cantilevered; VEH: vibration energy harvester; DTC: divergent tapered cantilevered; RC: rectangular cantilevered; CTC: convergent tapered cantilevered.
Mass ratio N of the TC VEHs with different volumes and same width ratio in the first mode.
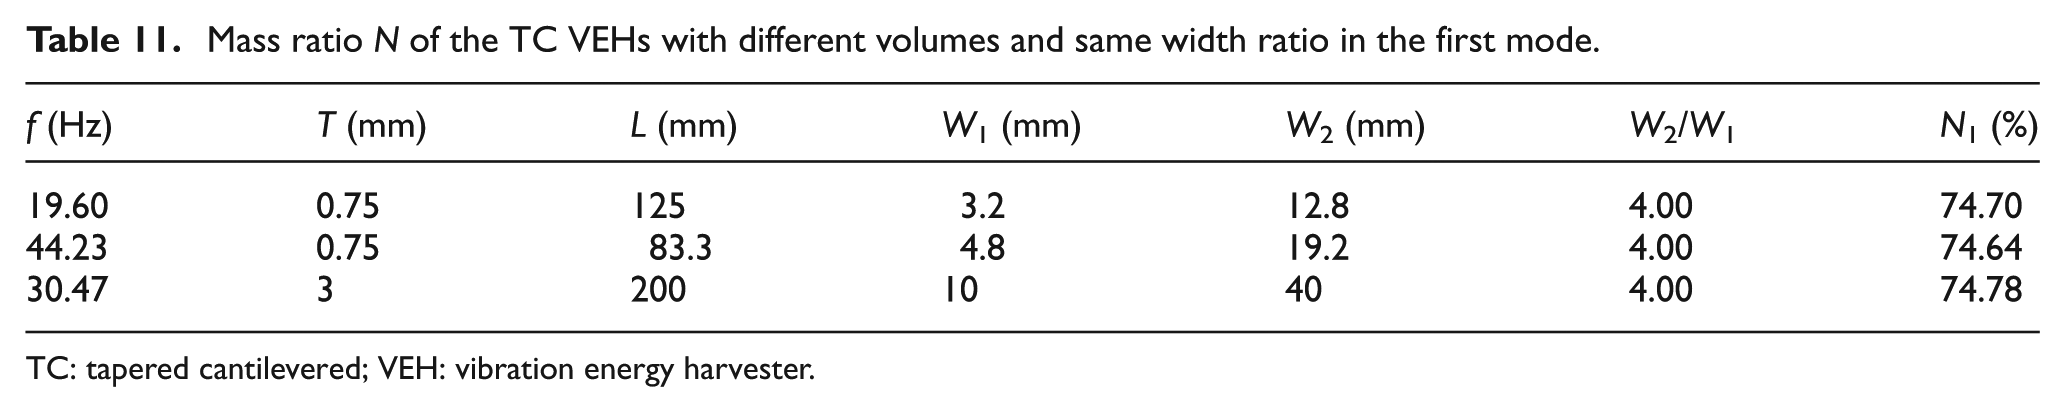
TC: tapered cantilevered; VEH: vibration energy harvester.
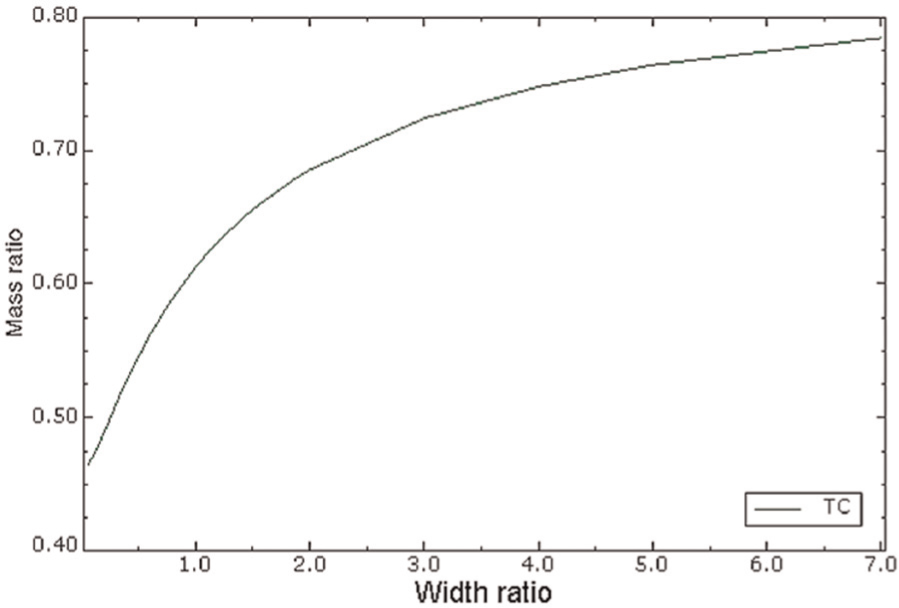
Relationship between the width ratio and mass ratio of TC models in the first mode.
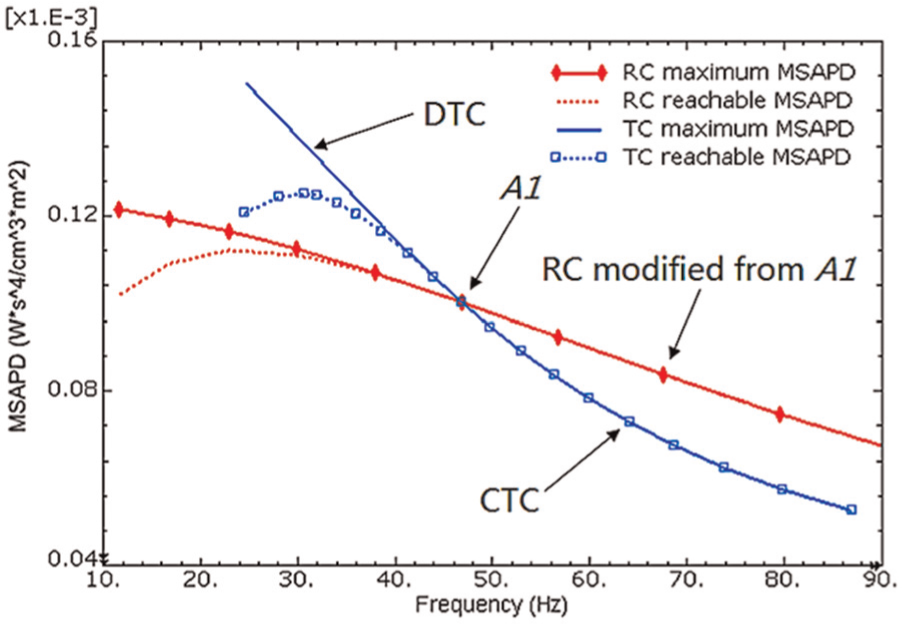
Comparison of the maximum and reachable MSAPD of the unimorph RC and TC VEHs modified from A with 100% coverage and thickness ratio of 0.5 (the MSAPD only represents the highest power density of the models at their short-circuit resonance frequency).
RC beam with tip masses
Normally, an additional mass will be attached to the VEH to tune the resonance frequency. The extra mass not only increases the volume, but also modifies the mode shape, mass distribution and strain distribution, which eventually affects the VEH performance. Three RC models have been chosen to attach different cubic masses (the same materials as the substrate) to their free tips. The three RC models are based on model A; they are named by their length (L) and width (W) as follows: L100×W10 (A), L66.7×W15 and L40×W25. The dimensions of the cubic tip masses are from 0.5 to 2.5 cm, and the volumes of tip masses are from 0.125 to 15.625 cm3. Then, the tip mass weight is from 0.98 to 122.7 g and the ratio of the tip mass/beam mass is from 0.17 to 20.9. Moreover, point masses located right on the free tip have been defined in the models using the same magnitudes from 0.98 to 122.7 g for comparisons. Figure 15 shows the L66.7×W15 beam with 26.5 g tip mass (the dimension is 1.5 cm), while Figure 16 shows the tuned frequencies and modal participation factors of the three beams with different ratios of tip mass/beam mass. Figure 17 shows the variations of the mass ratio with ratio of tip mass/beam mass and frequencies. The results in these figures demonstrate that the tip masses effectively enhance the mass ratio in the first mode compared with the RC model without a tip mass.
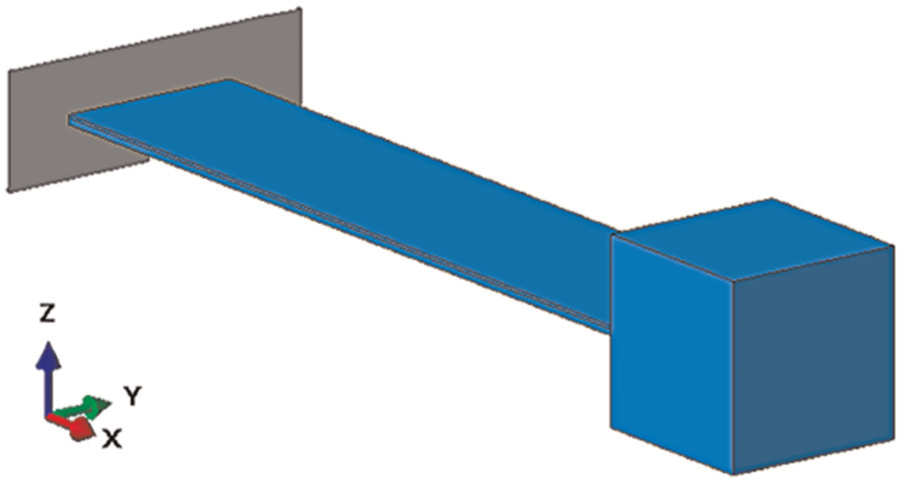
View of the L66.7×W15 beam with 26.5 g tip mass.
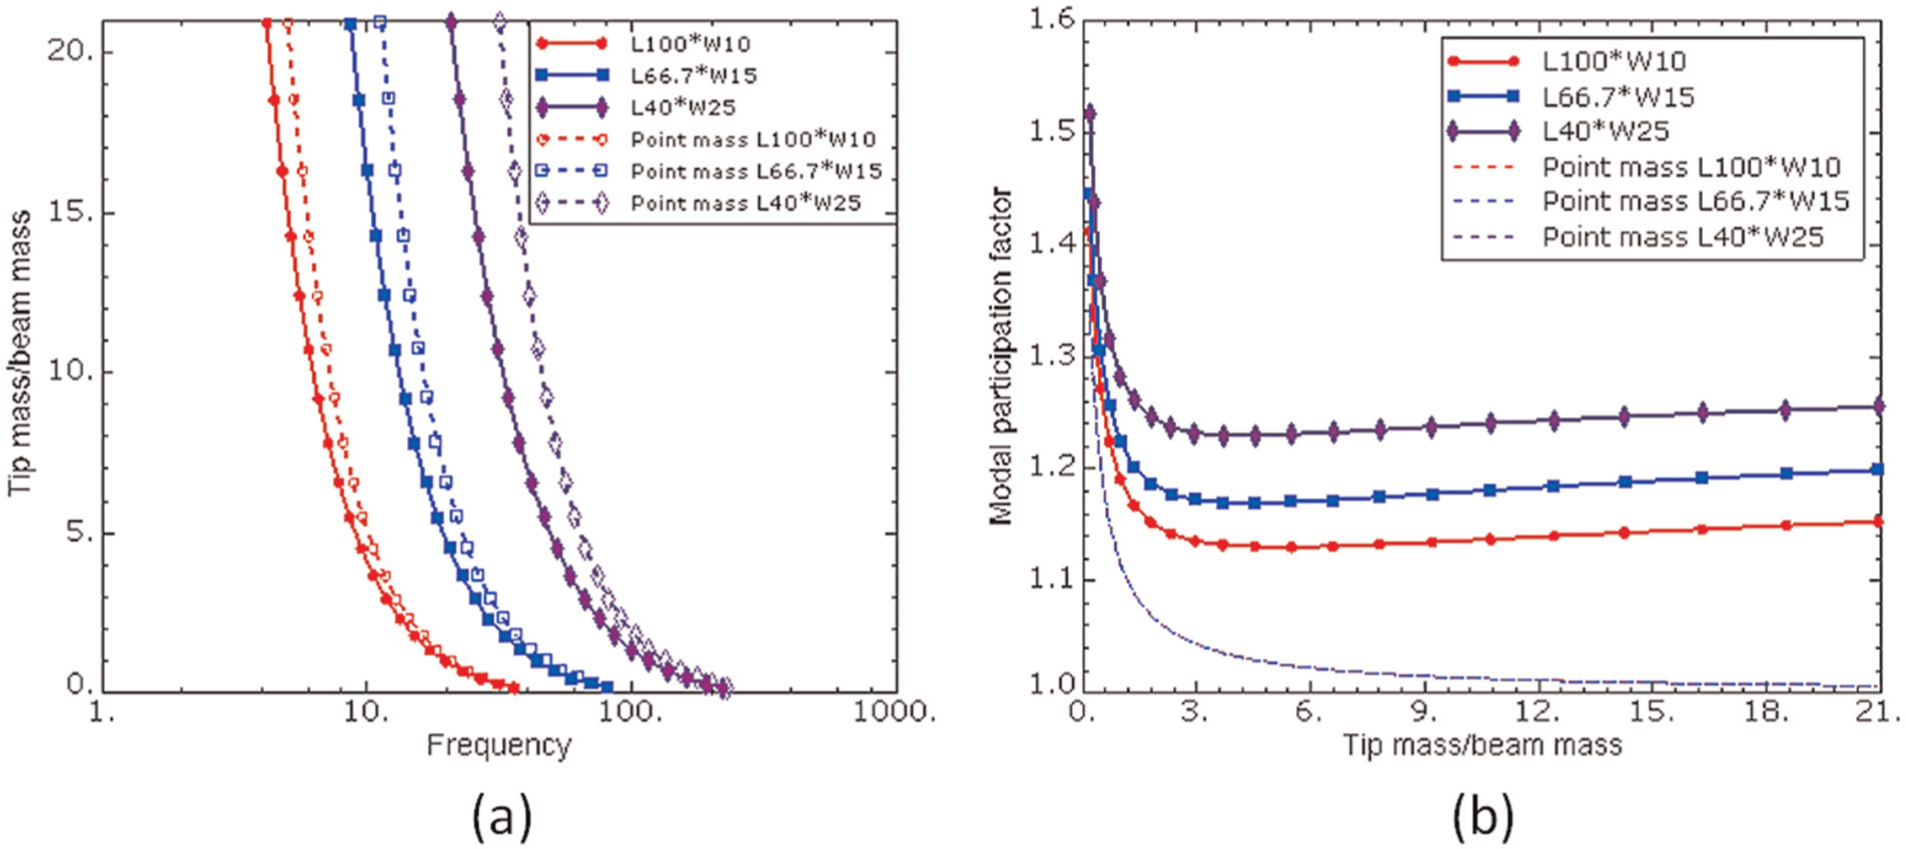
(a) Tuned frequencies and (b) modal participation factors with ratio of tip mass/beam mass in the first mode.
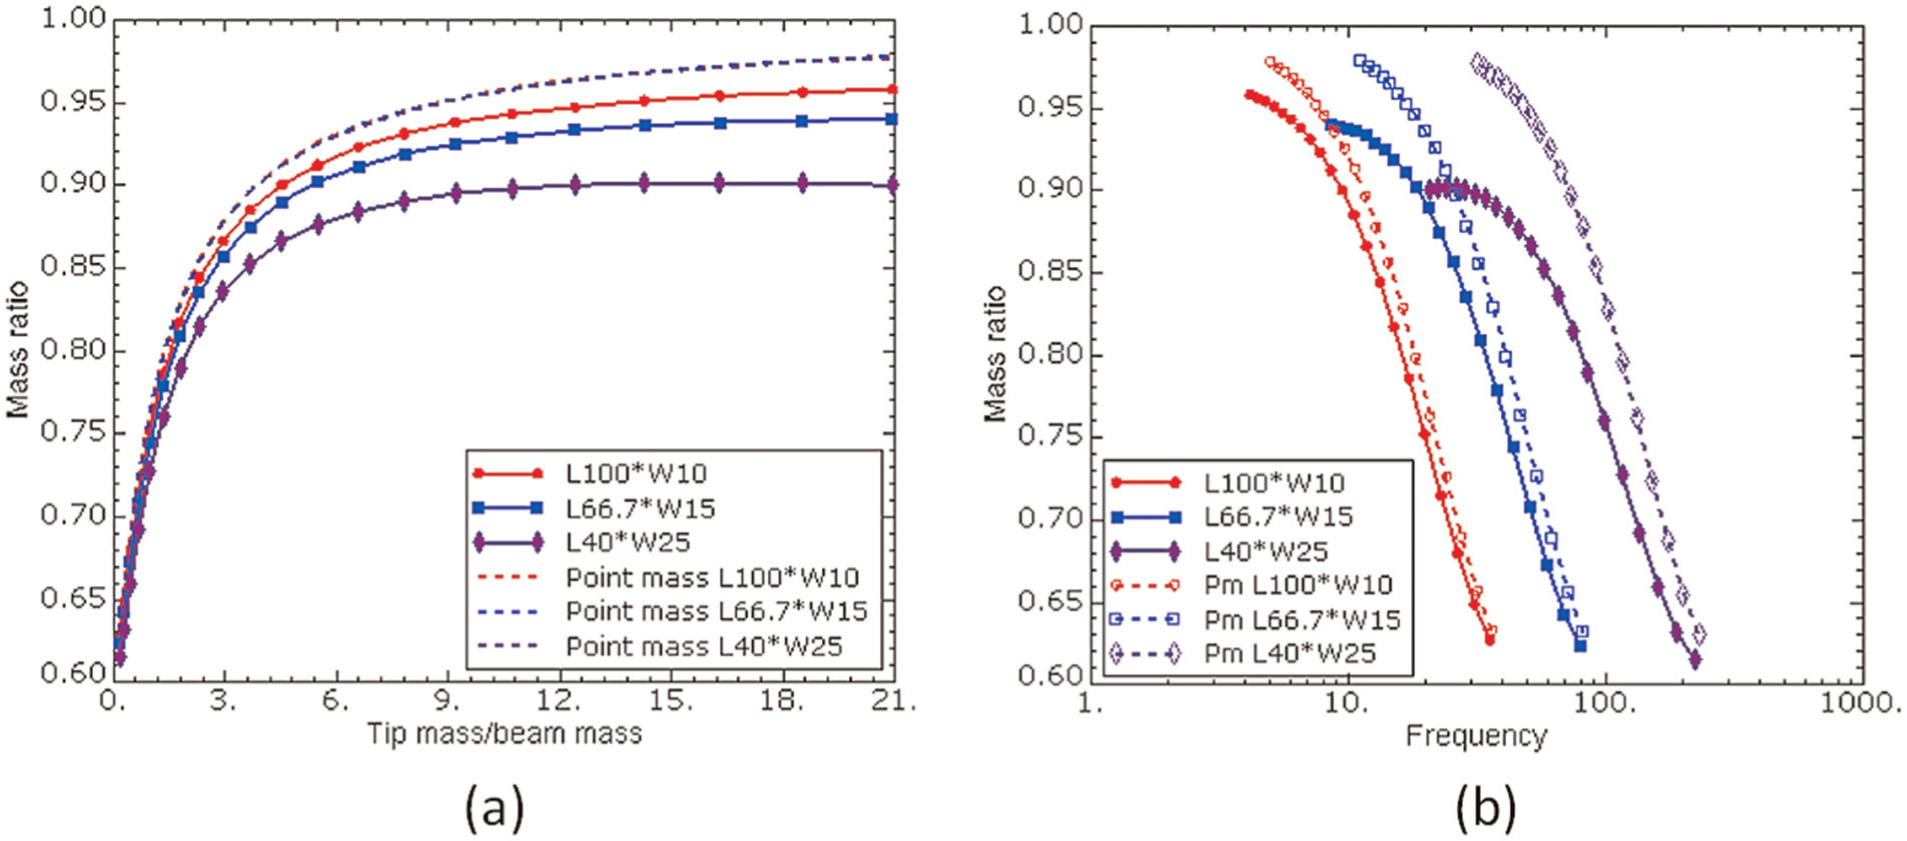
Mass ratio with different tip masses in the first mode: (a) ratio of tip mass/beam mass and (b) mass ratio of FRFs.
Figure 16(a) shows that when the ratio of tip mass/beam mass is same, using cubic tip masses generated lower frequencies than using point masses. Generally, when the tip mass/beam mass ratio increases from 0 to 3, Figure 17(a) shows that the mass ratio increases rapidly, while Figure 16(b) shows that the modal participation factor decreases rapidly. When the ratio of tip mass/beam mass is larger than 5, the mass ratios are slightly increased and the modal participation factors of beam models with cubic tip masses are also slightly increased. However, the modal participation factors of beam models with point masses decrease to 1 asymptotically. Similar results of using point mass can be found in Erturk and Inman (2008b). This is because of the differences in the offset distances between the tip of the beams and the centre of mass of the tip masses and the increase in mass moments of inertia of the tip masses. These factors generate adverse effects compared with the responses of the beam models with point masses located right at the centre of the free tip. If the point mass becomes infinitely large, the model is similar to a mass–spring model and
Attached masses with varying locations
In real applications, the masses are not always attached right at the tip. It is well known that a mass located at the free tip generates the lowest frequency, and then by relocating the mass position from the tip to the clamped end, the tuned frequency is increased due to the decrease of the effective length of the beam. There is a need to find out the differences in the mass ratio when using lighter tip masses and a heavier mass with altered locations. The L66.7×W15 RC model with tip masses up to 62.8 g (dimension of 2 cm) can tune the natural frequency from its original value of 106.3–12.68 Hz in the first mode. The mass positions are defined as the percentage of the length from the clamped end to the attached mass (effective length) over the total length of the beam. Thus, the mass position of the tip mass is 100%. In this case, three cubic tip masses of the magnitudes of 7.85, 26.5 and 62.8 g are considered. Each mass has been split into two equal parts, and they are symmetrically attached on the L66.7×W15 RC VEH. Figure 18 illustrates VEHs with two equal masses of total magnitude of 26.5 g attached and located at 90% and 50% mass positions. Moreover, the point masses that have the same magnitudes as the bulky masses and different locations are also used in this case. Figure 19 shows the variations of the mass ratios and resonance frequencies with mass position for the L66.7×W15 beam. Three point masses and three bulky masses are used at the tip of the beam, and their positions are changed from 10% to 100%. When the mass positions are varied from 50% to 100%, this figure shows that the masses can generate acceptable mass ratios. When the mass position is close to the clamped area, the mass ratio is reduced rapidly. Besides, the resonance frequencies of the beam models with bulky masses can become even larger than the original natural frequency of the beam without mass. This is similar to the CTC models with wider clamped ends. Moreover, using lighter masses like 7.85 and 26.5 g at 60%–70% mass positions can even generate more mass ratio in the first mode than simply attaching them to the free tip. This result can be observed with both bulk and point masses. It is evident that for specified frequencies, using heavier masses with different mass positions generates more power density than using smaller tip masses. In real applications, a VEH with a pre-designed tip mass can operate off the desired resonance frequency. This will lead to a significant decrease in the power output due to the offset of the resonance frequency. Therefore, slight adjustments of the mass position to tune the frequency are convenient and necessary.
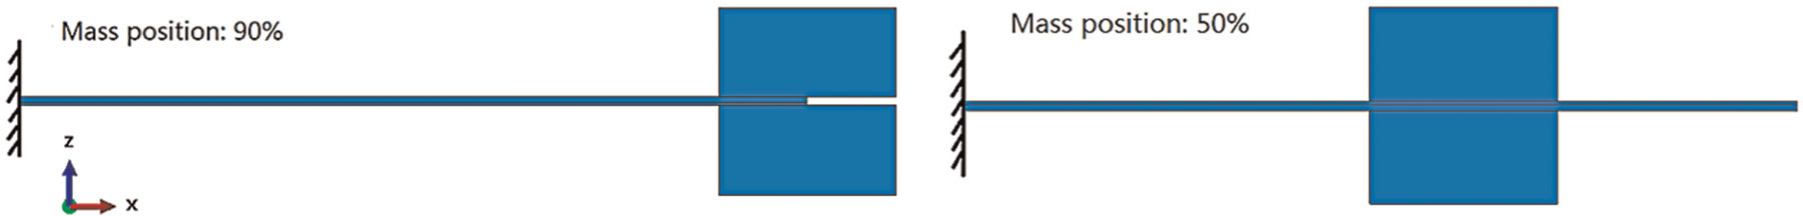
Views of L66.7×W15 with 26.5 g mass and 90% and 50% mass positions.
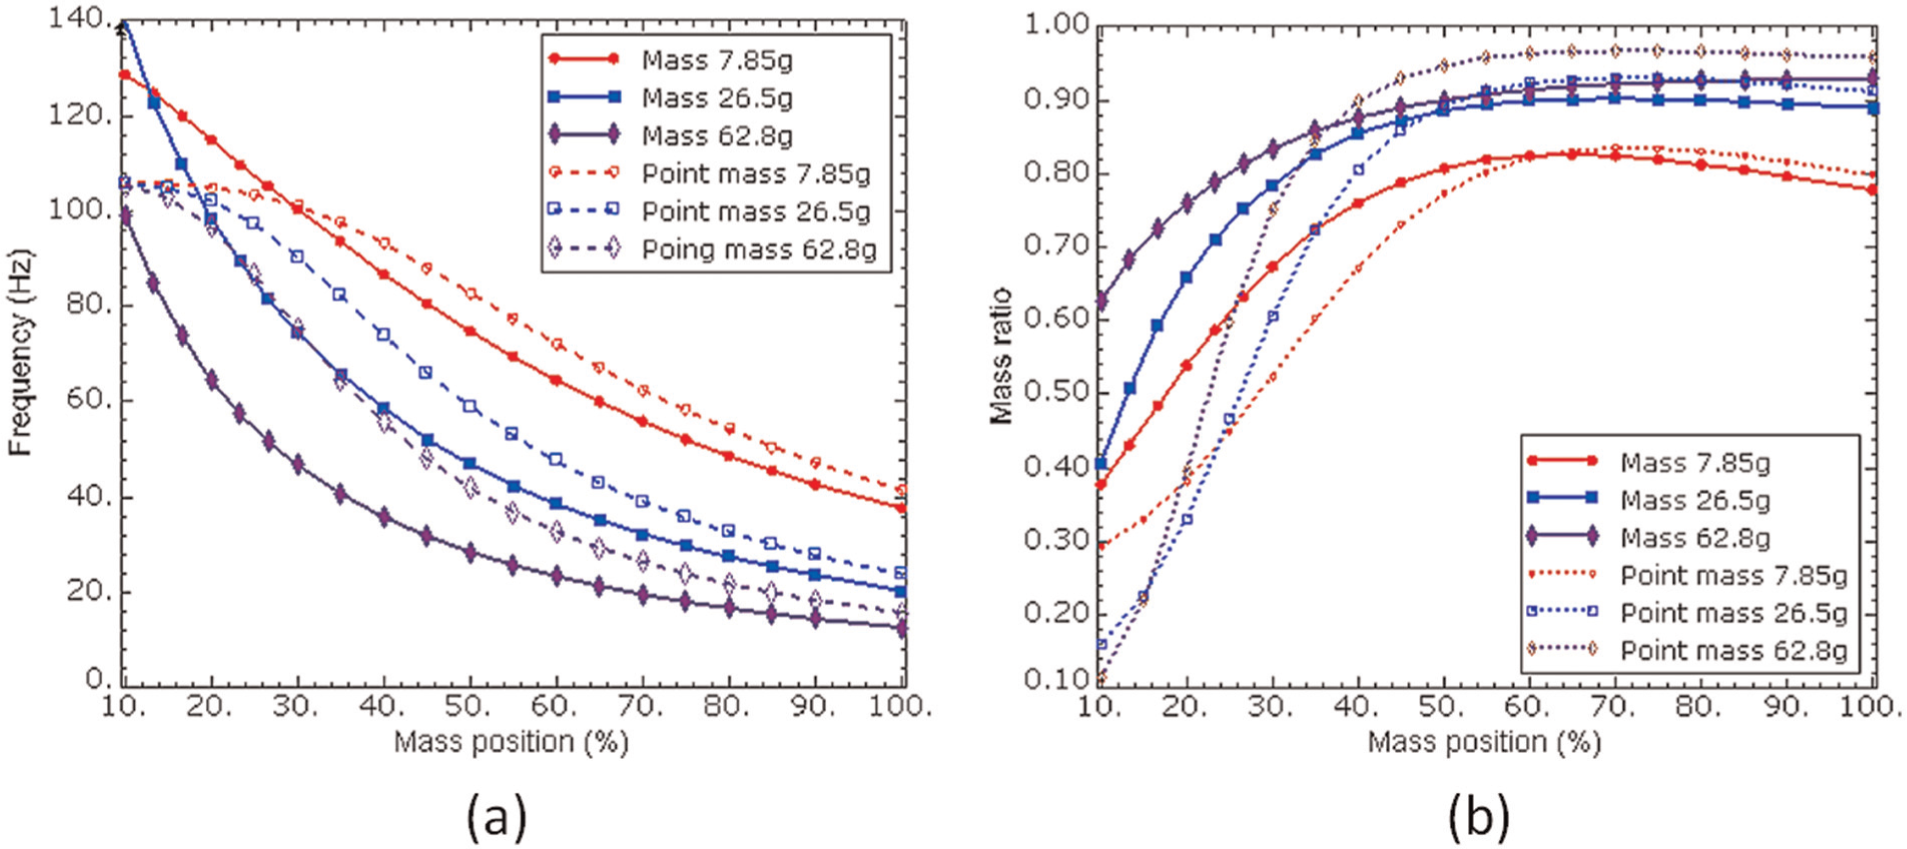
Modal properties of L66.7×W15 with three different masses and altered mass positions: (a) resonant frequencies and (b) mass ratio.
Effect of extra mass on EMCC
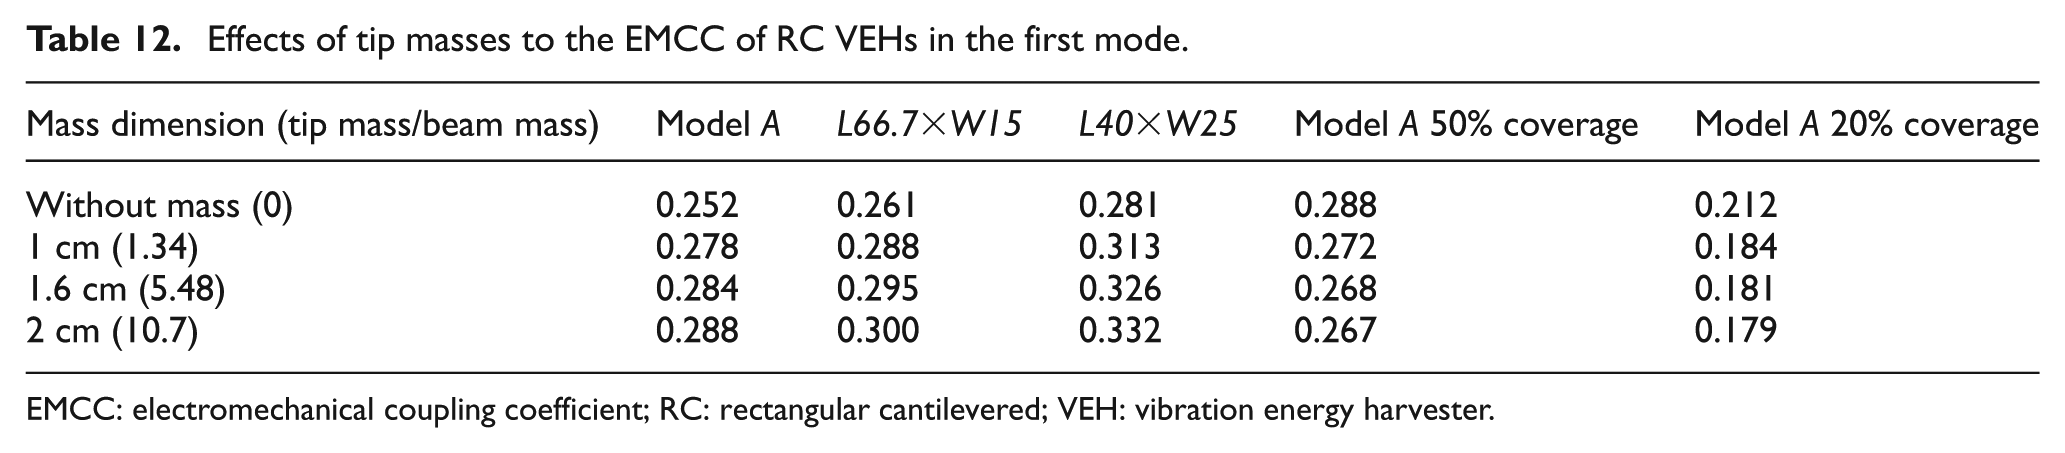
In fact, adding extra masses not only changes the mass ratio but also changes the EMCC. Erturk et al. (2009) stated that the tip masses will change the strain distributions of RC VEHs. The boundary condition is changed from clamped-free to clamped–clamped once the tip mass becomes infinitely large. In addition, the changed strain distribution for beams with tip mass also affects the EMCC. Table 12 briefly shows the effects of tip masses on the EMCC of RC VEHs with full coverage and partial coverage in the first mode. For the full coverage models, the increase in EMCC of the wider model L40×W25 is greater than for the narrower models. Besides, adding a small tip mass can effectively increase the EMCC, and then using even larger tip masses only generates a small increase of EMCC. For the model A with partial coverages, the EMCC is decreased. Moreover, the decreases of EMCC for beams with 20% coverage are more than the decreases of EMCC for beams with 50% coverage.
Effects of tip masses to the EMCC of RC VEHs in the first mode.
EMCC: electromechanical coupling coefficient; RC: rectangular cantilevered; VEH: vibration energy harvester.
Table 13 shows the effects of moving 7.85 g mass to different positions on the EMCC of model A with different coverages. This table shows that moving the mass from the tip to the centre of the beam, in the full coverage model, causes the EMCC to decrease. When the model has partial coverage, moving the mass will actually decrease the effective length of the beam, and the effective coverage and EMCC are increased. In particular, the EMCC of the model with small coverage can be significantly increased.
Effects of moving 7.85 g mass to different positions on the EMCC of model A in the first mode.

EMCC: electromechanical coupling coefficient.
Conclusion
This article has presented a systematic parametric analysis of the modal electromechanical coupling and mechanical behaviour of the cantilevered VEHs. The system modal electromechanical coupling combines the effects from EMCC and damping ratio simultaneously. The influences of modal mechanical behaviour to the volumetric power can be represented by the mass ratio, which represents how much mass effectively participates in the motion and affects the forcing function directly. Also, a design strategy is presented to optimize the EMCC and mass ratio separately.
Because of the self-cancellations in the higher modes, the EMCC of the RC models in the first mode is nearly 2 and 3 times larger than in the second and third modes, respectively. A wider and shorter RC VEH can generate 10% more EMCC than the longer and narrower RC VEHs. Also, the partly covered substrate and bimorph structure are able to enhance the EMCC from 10% to 20% and reduce the quantity of piezoelectric materials required as well. Especially, the DTC VEHs are able to generate acceptable EMCC with much smaller coverage than RC and CTC VEHs. However, the thickness ratio of piezoelectric and substrate layer should be analysed carefully to optimize the EMCC when using different materials. Moreover, using tip masses can increase the EMCC of the VEHs with full coverage by more than 10%. For the VEHs with limited coverage, moving masses from the tip to the centre of the beam is able to decrease the effective length of the beam and increase the EMCC by more than 25%.
For a certain modal coupling condition, optimizing the mass ratio and using large density materials are able to enhance the power density effectively. For the RC models without tip mass, the mass ratio in each mode is constant, and in the first mode, it is nearly 3 times and 10 times larger than in the second and third modes, respectively. This implies that the VEH operating in the first mode has the highest performance. Moreover, the VEHs with extra masses can increase mass ratio and power density by more than 40%. Using DTC structure can increase the mass ratio of 20%. However, using CTC structure will decrease the mass ratio by more than 20%.
Footnotes
Declaration of conflicting interests
The authors declared no potential conflicts of interest with respect to the research, authorship, and/or publication of this article.
Funding
This research received no specific grant from any funding agency in the public, commercial or not-for-profit sectors.