
Abstract
This article presents a performance optimization approach to incipient crack detection in a wind turbine rotor blade that underwent fatigue loading to failure. The objective of this article is to determine an optimal demarcation date, which is required to properly normalize active-sensing data collected and processed using disparate methods for the purpose of damage detection performance comparison. We propose that maximizing average damage detection performance with respect to a demarcation date would provide both an estimate of the true incipient damage onset date and the proper normalization enabling comparison of detection performance among the otherwise disparate data sets. This work focuses on the use of ultrasonic guided waves to detect incipient damage prior to the surfacing of a visible, catastrophic crack. The blade was instrumented with piezoelectric transducers, which were used in a pitch-catch mode over a range of excitation frequencies. With respect to specific excitation frequencies and transmission paths, higher excitation frequencies provided consistent detection results for paths along the rotor blade’s carbon fiber spar cap, but performance fell off with increasing excitation frequency for paths not along the spar cap. Lower excitation frequencies provided consistent detection performance among all sensor paths.
Keywords
Introduction
In order for wind energy to provide a larger portion of the global energy supply, the area subtended by the rotor blades, which is proportional to individual unit power production, must continue to grow. Achieving these larger areas requires the use of ever longer rotor blades, which are inevitably more slender and flexible than their predecessors. As such, fatigue damage caused by dynamic loading, particularly in the case of turbulent flow excitation (Linn and Koo, 2012) in densely packed wind farms, is of great concern. The current state of the art in wind turbine rotor blade health management requires physical inspection by an expert in climbing gear. This process is time-consuming, expensive, and error prone. Recently, researchers have been developing smart rotor blades (White et al., 2009), in which manufacturing defects and operational damage could be detected automatically. Such a system in operation would permit wind turbine controllers to make decisions to extend turbine life, such as parking a turbine with a rotor blade exhibiting incipient damage until a repair could be scheduled.
A variety of data acquisition and analysis methods have been applied to the problem of structural health monitoring (SHM) of wind turbine rotor blades, and the CX-100 rotor blade (Berry, 2007) has been a specimen of particular popularity. The CX-100 is a 9-m wind turbine rotor blade constructed of fiberglass over a balsa wood frame, with carbon fiber spar caps. Although the CX-100 is only approximately one-fourth the length of a modern utility-scale rotor blade, it has similar construction characteristics and in research environments has become a common surrogate for the larger rotor blades. Rumsey et al. (2008) deployed a variety of sensing systems in a CX-100 fatigue test, including acoustic emission sensors, impedance-based methods, inertial sensing systems, and photoelastic panels. White et al. (2009, 2010, 2011) have applied various methods involving inertial measurements to estimate input loads and damage accumulation in the CX-100. Park et al. (2010) demonstrated an ultrasonic guided wave (UGW) system for detection of simulation on a CX-100 rotor blade section. The CX-100 has also been widely used as a platform to detect the presence and effect of manufacturing defects in wind turbine rotor blades. LeBlanc et al. (2011) applied digital image correlation (DIC) methods to assess the effect of intentionally manufactured defects in a CX-100 during a full-scale dynamic fatigue test. Manohar et al. (2012) applied a variety of thermographic techniques to detect the presence of intentionally manufactured defects in a CX-100 rotor blade.
Taylor et al. (2013) deployed a variety of active-sensing systems and methods on the CX-100 blade considered in this work in order to compare crack detection performance among disparate data acquisition approaches and signal processing methods. In the course of that work, it became clear that a fair performance comparison would require either independent knowledge of the onset of incipient damage or a means of estimating the onset. Because the onset of incipient damage occurred roughly 3 weeks prior to the catastrophic failure, the problem became that of simultaneously estimating the start of the incipient damage state and assessing the relative performance of the systems used to make that estimation. The previous work (Taylor et al., 2013) provided a comparative assessment of the detection performance, while this work provides a detailed presentation of the optimization approach developed to determine the onset of the incipient damage state. This onset date is the demarcation date required to enable detection performance comparison among the disparate data sets.
Experiment and approach
Overview
A 9-m CX-100 wind turbine rotor blade manufactured to standard specifications was subject to fatigue loading until failure in a controlled laboratory environment. The rotor blade was mounted on a 7-ton steel frame designed to approximate a fixed-free condition. Loads were introduced to the blade using a hydraulic excitation system. The goal of this experiment was to enable the performance comparison in incipient crack detection among a variety of active-sensing approaches to SHM, including various data acquisition and signal processing techniques. The rotor blade was instrumented with several sensor arrays consisting of D-0.500-0.020-851 lead zirconate titanate (PZT) patches. A diagram of the sensor array layout on the CX-100 rotor blade’s transitional root area on the low-pressure (LP) side is shown in Figure 1. The actuator patch location is labeled “A,” a collocated sensing transducer is counted as the “zeroth” transducer, and the remaining five transducers are numbered according to their respective transmission paths.
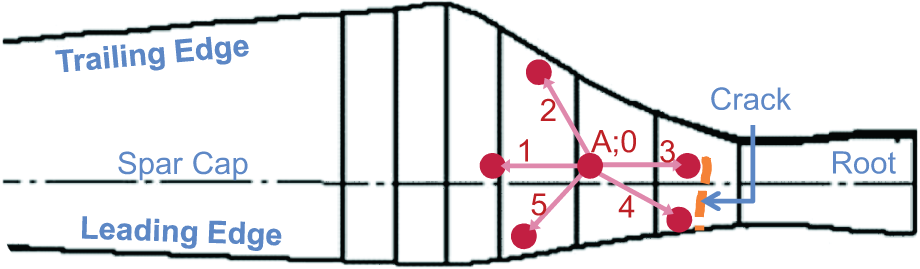
CX-100 LP side with major features, sensor array path numbers, and crack location.
The fatigue test was conducted in the fall of 2011 (Farinholt et al., 2012; Taylor et al., 2012). In the course of the fatigue test, the rotor blade was excited intermittently for ∼8.5 million cycles from 11 August 2011 through 16 November 2011, following the 8 November 2011 surfacing of a clearly visible through-thickness fatigue crack on the rotor blade’s LP side toward its leading edge in the transitional root area. The fatigue crack, which developed over the course of approximately 3 weeks, surfaced along a circumferential line near sensors 3 and 4, about 60 cm from the blade’s root. The state of the rotor blade as the crack was developing is referred to in this article as the incipient damage state, while the state following the crack’s surfacing is referred to as the catastrophic damage state.
Signals and features
In UGW applications of SHM, a narrowband wave packet is used to excite the structure, and the structure’s response to that excitation is measured at remote locations (pitch-catch) or by the actuator itself (pulse-echo). Changes in wave attenuation, reflection, or flight time can often be used to detect and locate damage. An example of a baseline waveform plotted along with an incipient damage state is shown in Figure 2. Various signal processing methods have been proposed to enhance the interpretation of the measured UGW signals to detect and locate structural damage. Several of these methods are well summarized by Raghavan and Cesnik (2007). In this work, underlying structural changes were identified by observing changes in a normalized residual energy (NRE) test statistic detailed by Kay (1998), given here as
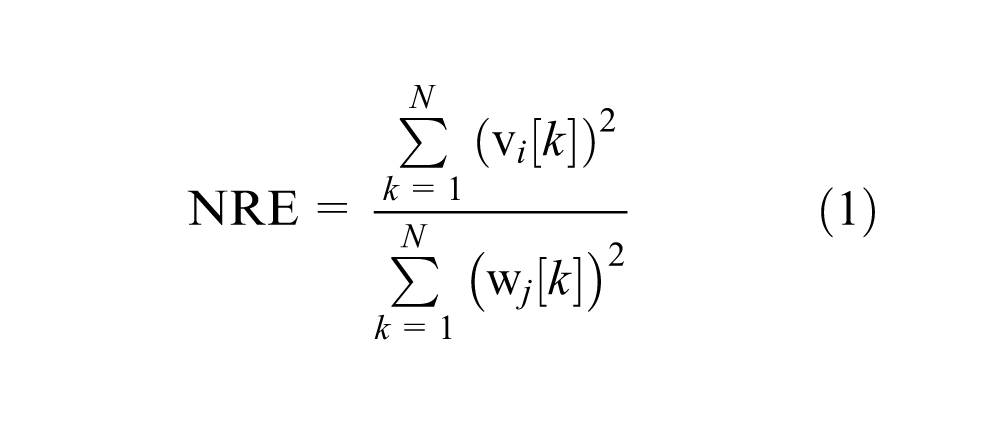
where k is the signal index,
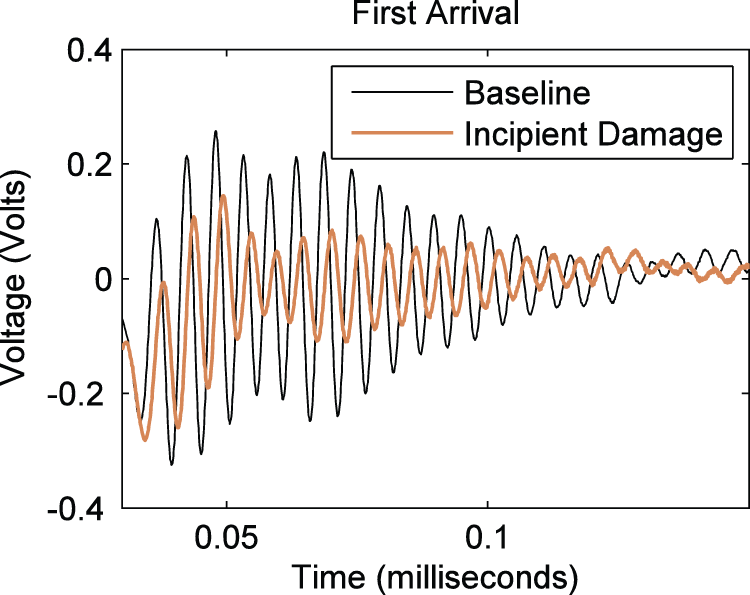
Sample UGW signals for UGW NRE data for path 2 on LP side at 50 kHz.
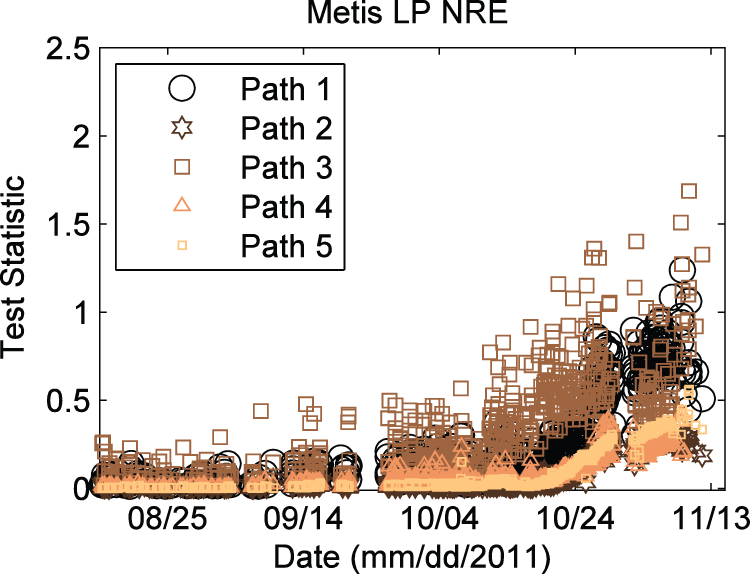
NRE features plotted versus test date for UGW NRE data for path 2 on LP side at 50 kHz.
ROC curves
In detection theory (Kay, 1998), a fundamental class of problems is one in which a signal may or may not be present in noise, and a hypothesis test is applied to determine the presence or absence of the signal. A test statistic derived from a measured signal, often a scalar, is formulated such that a positive detection results when the test statistic exceeds a given threshold, disproving the null hypothesis that the signal is absent. If the probability distribution of the test statistic is known, the performance of the detector can be evaluated analytically by computing, over a range of threshold values, the probability that the test statistic will exceed the threshold when the signal is present (a true positive) and when the signal is not present (a false positive). The true-positive rate is plotted versus the false-positive rate to generate a ROC curve. The area under the curve (AUC) is an indicator of a given detector’s performance, where a value of 1 would be perfect detection, while a value of 0.5 would be equivalent to a random guess. If the distribution of the test statistic is not known, ROC curves can still be produced in a data-driven manner using experimental results. As long as the truth of the signal’s presence or absence is known, the true-positive rate and the false-positive rate can be computed for each case (signal present or absent) over the range of threshold values (“decision boundaries”) as the ratio of the number of tests for which the test statistic exceeds the threshold to the total number of tests in each respective case. The approach utilized in this work is to produce a scalar, energy-based test statistic for each data set, from which data-driven ROC curves are generated in order to evaluate the performance of each sensor path and excitation frequency.
Demarcation date motivation
In order to generate ROC curves using empirical data, the truth of the underlying state of the system (e.g. a signal’s presence or absence) must be known. The overarching aim of this work was to determine from the experimental data both when the incipient damage appeared and the relative detection performance of the various approaches. The method proposed is to estimate the damage state of the structure by finding the definition of the system state that maximizes the average detection performance over all available data. In many detection or classification applications, this problem would be intractable because of the large number of possible definitions of the system state; however, because the data in this case are perfectly separable in time (i.e. the rotor blade progressed monotonically from a healthy state to a damaged state), the number of possible classification assignments is reduced to a number of demarcation dates no greater than the total number of measurements. Because the classification problem proposed is binary, one of these demarcation dates necessarily provides the true classification assignment. Then, the true demarcation date is estimated as that which maximizes ROC performance, defined as the AUC for the associated ROC curve.
Figure 4 shows a histogram for the 50-kHz UGW NRE test statistic for transmission path 2 on the rotor blade’s LP side using data from the entire fatigue test. The distribution is obviously bimodal, with one portion concentrated closer to 0, around 0.01, and another portion spread among larger values near 0.25. If a demarcation date of 8 October 2011 was assumed, then by assigning each value of the test statistic to the “healthy” or “damaged” case based on the test date, two distributions can be produced. Histograms of these distributions are shown in Figure 5. The two histograms in Figure 5 have been normalized such that their area is unity, so the histograms represent discrete probability distribution functions (PDFs). The corresponding ROC curve for the assumed 8 October 2011 demarcation date is shown in Figure 6, and its AUC is 0.8091. By assuming a different demarcation date, the reassignment of test statistics to the healthy and damaged cases will result in different histograms and corresponding ROC performance. The discrete PDFs resulting from a demarcation date selection of 21 October 2011 are shown in Figure 7. The corresponding ROC curve, which is shown in Figure 8, exhibits greater detection performance with an AUC of 0.9808.
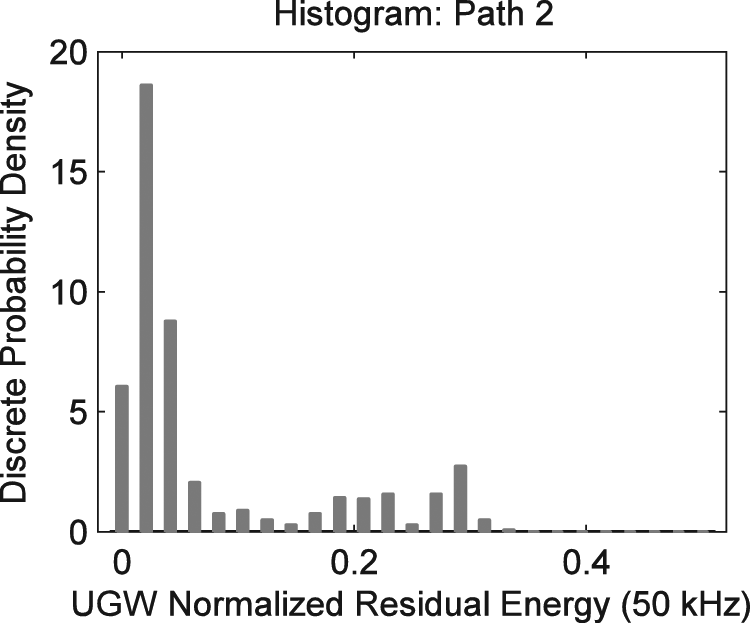
Histogram: 50-kHz UGW NRE data for LP path 2 with demarcation date prior to test start.
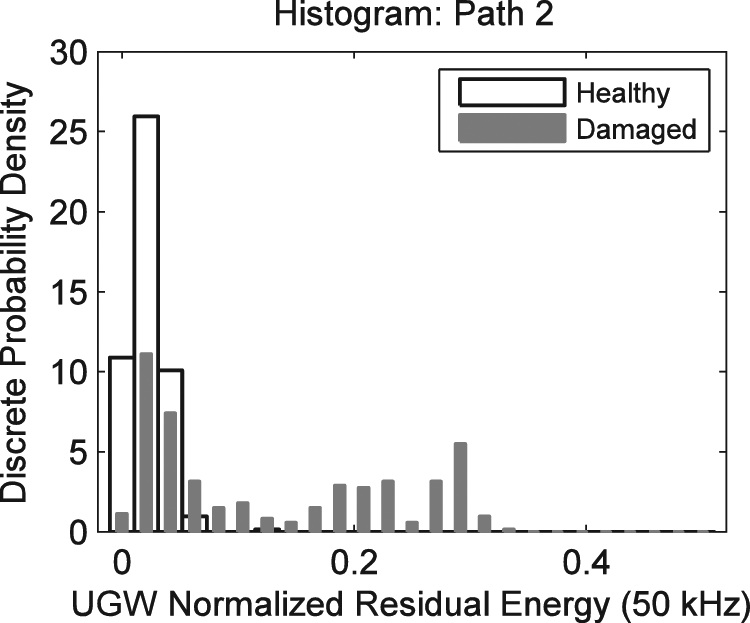
Histograms: 50-kHz UGW NRE data for LP path 2 with demarcation date 8 October 2011.
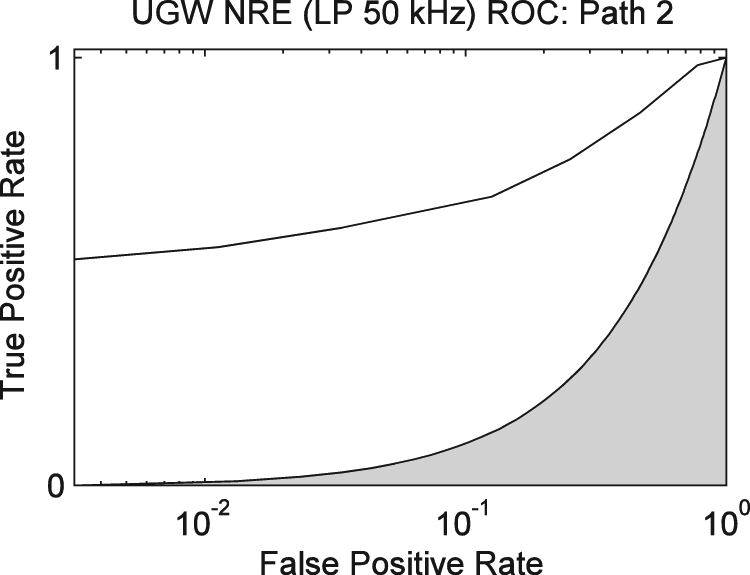
ROC curve: 50-kHz UGW NRE data for LP path 2 with demarcation date 8 October 2011.
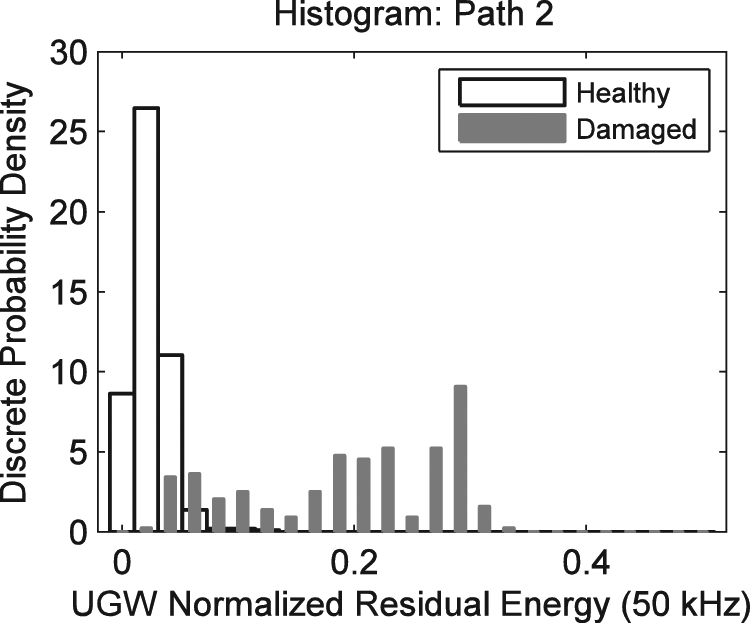
Histograms: 50-kHz UGW NRE data for LP path 2 with demarcation date 21 October 2011.
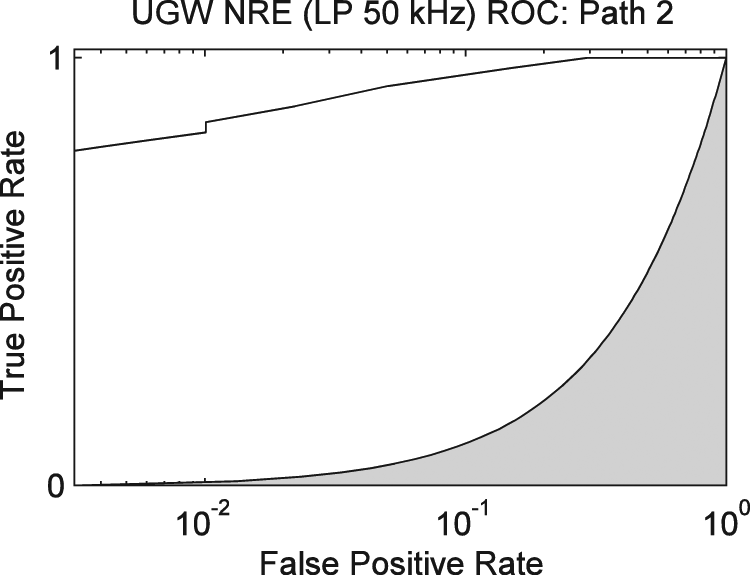
ROC curve: 50 kHz UGW NRE data for LP path 2 with demarcation date 21 October 2011.
Experimental results
Demarcation date selection
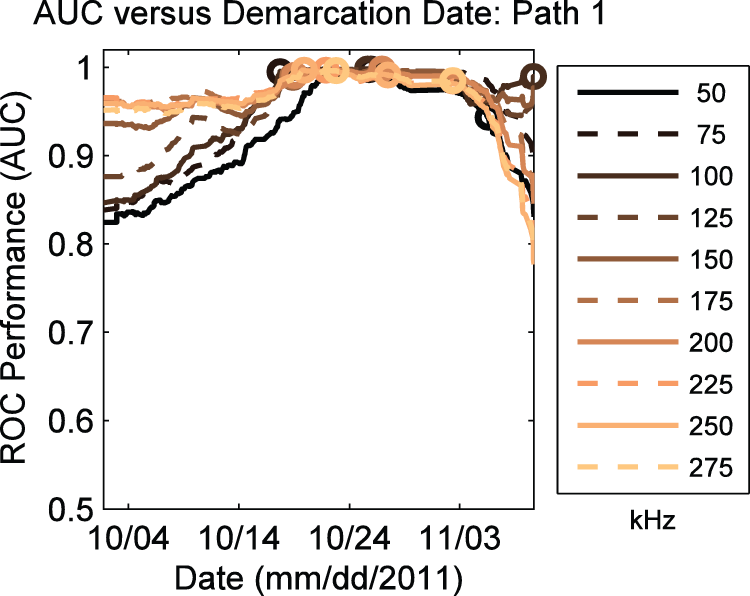
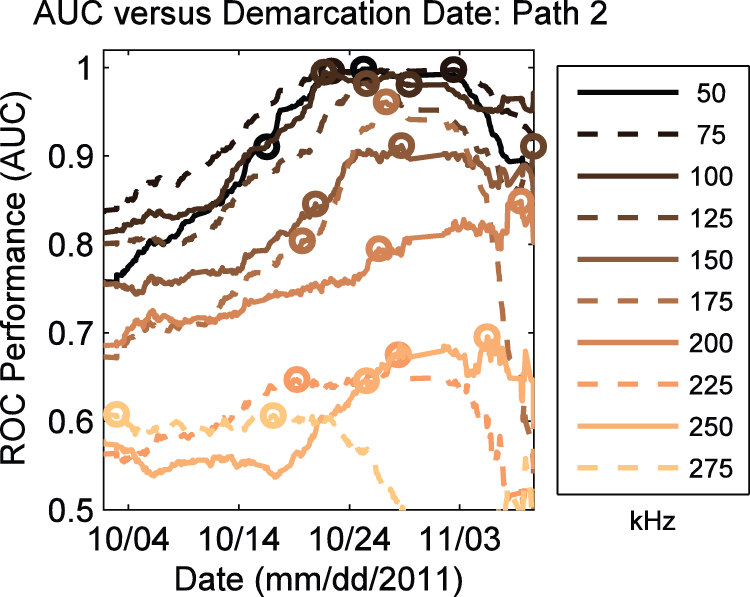
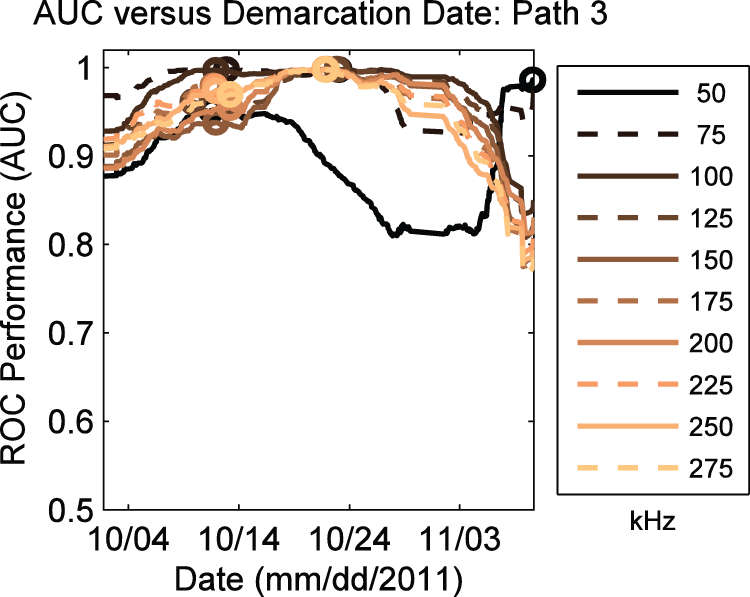
In the manner described above, each possible demarcation date was taken in turn to generate the ROC data for all sensor paths and transmission frequencies. The associated AUC values were recorded and plotted versus assumed demarcation date; these plots will be referred to as performance curves. Figures 9 to 13 show plots of AUC values versus demarcation date for each excitation frequency, separated by transmission path. For each performance curve generated, two local maxima (peaks) are marked with circles of the same color as the curve for a given frequency. Two peaks were marked in each case in order to capture both the transition from the healthy state to the incipient damage state and the transition from the incipient damage state to the catastrophic damage state.
Performance versus demarcation date for path 1 at various frequencies.
Performance versus demarcation date for path 2 at various frequencies.
Performance versus demarcation date for path 3 at various frequencies.
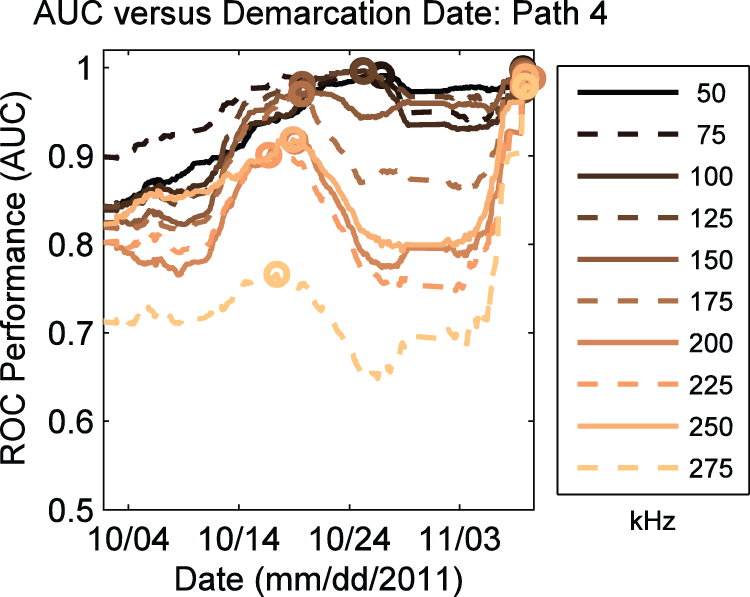
Performance versus demarcation date for path 4 at various frequencies.
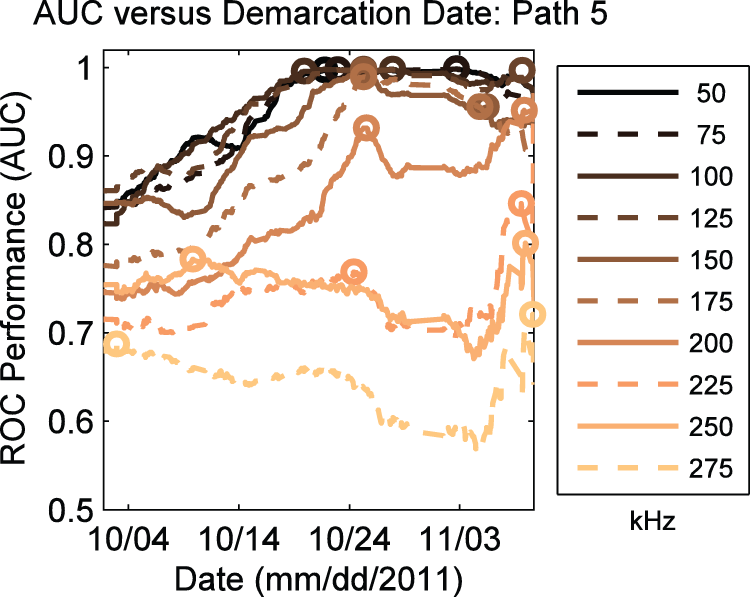
Performance versus demarcation date for path 5 at various frequencies.
The performance curves for path 1 are shown in Figure 9. The relatively flat performance curves for all frequencies are indicative of a steady change in the test statistic over a long period of the test. This behavior suggests the use of a sensor pair along the spar cap as a gauge of damage progression. The performance curves for path 2 are shown in Figure 10. The performance drops off steadily with increasing frequency, an indication of significant signal attenuation for path 2. The peak location corresponding to the incipient damage case generally increases in time with increasing frequency, indicating that for reduced signal-to-noise levels, the damage had to be more severe in order to be detected. The performance curves for path 3 are shown in Figure 11. With the exception of the 50-kHz transmission path, the results are similar to those for path 1. However, note also that for 75 and 100 kHz, the flat portion of the performance curves begins earlier and extends later than those for path 1, indicating an improved potential to utilize path 3 as an indicator of damage progression. This improvement is likely attributable to path 3’s proximity to the crack itself (see Figure 1). The performance curves for path 4 are shown in Figure 12. Path 4 was quite near the crack, but it did not lie along the carbon fiber spar cap. The sharp peaks present in path 4’s performance curves are a result of its proximity to the crack, while its clear indication of a second peak at 8 November 2011 (when the fatigue crack surfaced), which was not present for path 3, arises from the material difference between the two paths. The fiberglass material appears to enable detection of the second structural state transition, while the carbon fiber does not. Furthermore, as the excitation frequency increased, the incipient crack was detectable earlier with path 4 than for most path/frequency pairs. The performance curves for path 5 are shown in Figure 13. Path 5 displayed similarly degrading performance with increasing frequency as path 2, with the peak shifting slightly forward in time until after 200 kHz. At higher frequencies, the only notable peaks occur in November, indicative of the transition to the catastrophic damage state.
These results indicate that there are specific strengths and weaknesses for given paths and excitation frequencies, but a comparison of their performance must be made using a consistent definition of incipient damage, which in this case is defined in terms of the demarcation date used to generate the ROC curves for performance comparison. To that end, a histogram of the maximum AUC values from the 50 path/frequency pairs was computed, and this histogram is shown in Figure 14. The histogram shows a clearly bimodal distribution, with one peak near 21 October 2011 and another near 8 November 2011. Choosing the date as 21 October 2011 would correspond to assessing performance in incipient crack detection, while choosing the date as 8 November 2011 would correspond to assessing performance in catastrophic crack detection. These dates are consistent with other assessments of the incipient damage date, including time-domain (Choi et al., 2012) and novelty detection (Dervilis et al., 2012) methods.
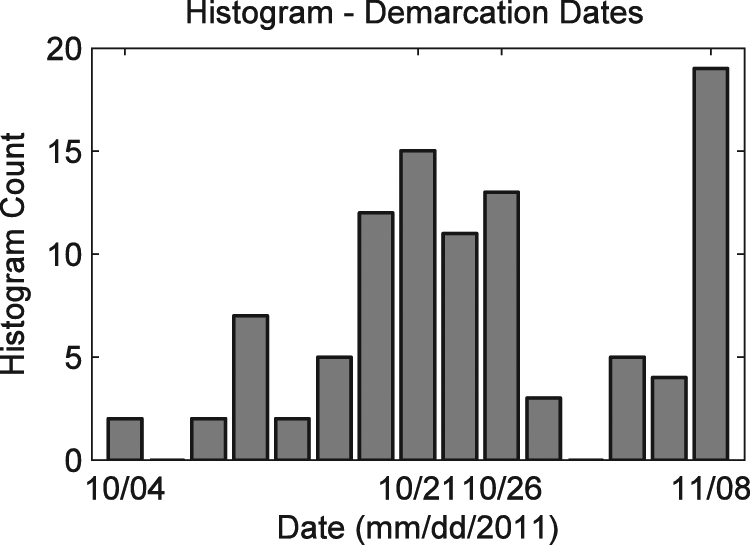
Histogram of most likely demarcation dates.
Fatigue crack detection performance
For the demarcation date of 21 October 2011, ROC curves are presented for each transmission path at excitation frequencies of 50, 150, and 250 kHz. The ROC curves for the 50-kHz UGW data are plotted in Figure 15. These lower frequency data provided good overall classification performance with no apparent dependence on proximity to the fatigue crack or path location with respect to the carbon fiber spar cap. Curiously, path 5, which was far from the crack and did not lie along the spar cap, had the greatest performance. The ROC curves for the 150-kHz UGW data are plotted in Figure 16. At this medium-range frequency, transmission paths 1 and 3 displayed the better performance, while path 2 was the poorest. The ROC curves for the 250-kHz UGW data are plotted in Figure 17. At this higher frequency, only the paths situated along the spar cap exhibited acceptable performance, while the other three paths had AUC values below 0.9. The carbon fiber spar cap acted as a wave guide for the higher frequency excitation, enabling the communication of changes in the underlying structure along its length without respect to the specific location of the fatigue crack.
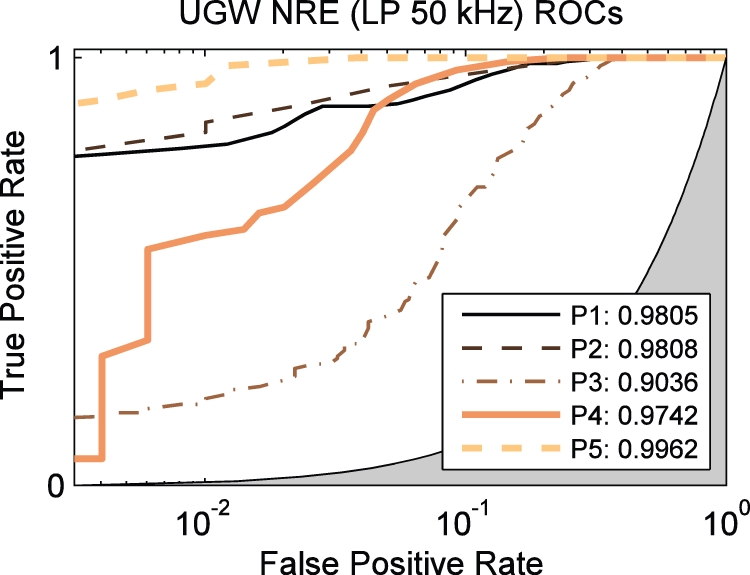
ROC curves for NRE test statistic with 50-kHz UGW NRE data on LP side.
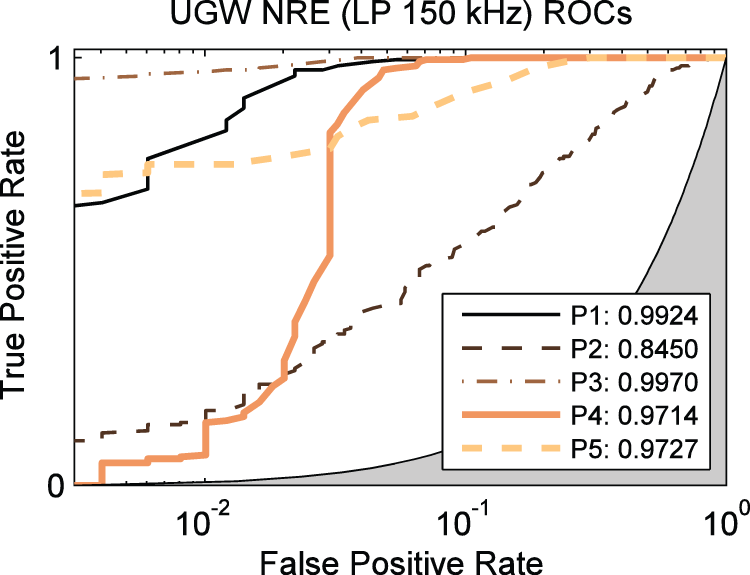
ROC curves for NRE test statistic with 150 kHz UGW NRE data on LP side.
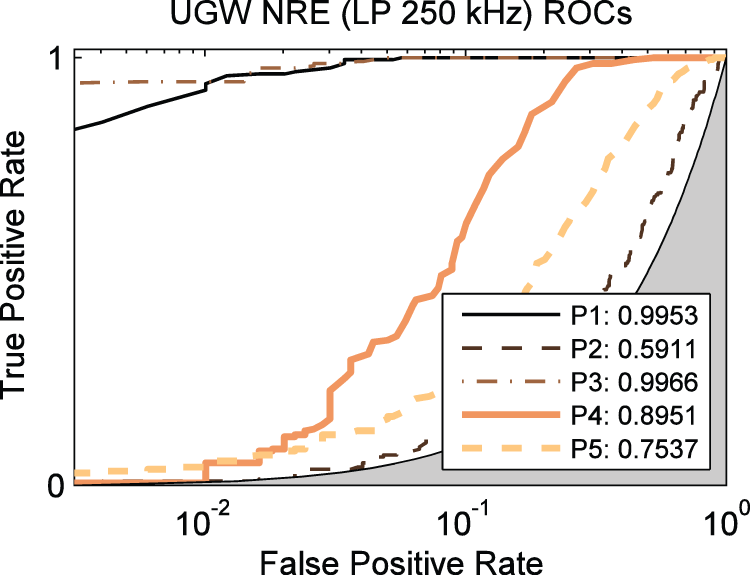
ROC curves for NRE test statistic with 250-kHz UGW NRE data on LP side.
Discussion
In this work, we have applied a maximum ROC performance approach to determine in an a posteriori manner the most likely demarcation date at which incipient fatigue damage in a CX-100 wind turbine rotor blade became detectable. The data considered were UGW signals over a set of interrogation paths and a broad range of excitation frequencies collected through the course of a full-scale CX-100 fatigue test. Although the individual paths and excitation frequency combinations exhibited varying maximally performing demarcation dates, the distribution of these dates was bimodal, having a strong central tendency at 21 October 2011, which was taken to be the most likely incipient damage date, and a second, sharp peak at 8 November 2011, which was the date on which the catastrophic fatigue crack surfaced, having propagated completely through the thickness of the CX-100’s fiberglass structure. This demarcation date was applied to assess the detection performance for various transmission paths and excitation frequency pairs and was also utilized to assess detection performance among other, disparate data sets collected during the same experiment (Taylor et al., 2013). The performance assessment presented in this article revealed that low-frequency UGW excitation was sensitive to structural changes, but insensitive to transmission path location. High-frequency UGW excitation suffered from signal attenuation in the fiberglass material, but was sensitive to structural changes for paths that lay along the carbon fiber spar cap, which acted as a wave guide.
Footnotes
Acknowledgements
The authors would like to acknowledge Scott Hughes and Mike Desmond from the National Renewable Energy Laboratory and Mark Rumsey and Jon White from Sandia National Laboratory for their support and guidance in this research effort.
Declaration of conflicting interests
The authors declare that there is no conflict of interest.
Funding
This work was funded by the United States Department of Energy through the Laboratory Directed Research and Development program at Los Alamos National Laboratory. In addition, we performed this study under a research grant (No. UG110097JD) supported by the Agency for Defense Development of the Korean government. This work was also supported by Leading Foreign Research Institute Recruitment Program (2011-0030065) of the National Research Foundation (NRF) of Korea, funded by the Ministry of Education, Science and Technology.