
Abstract
Interdigitated electrode configurations produce nonuniform electric field and stress in the vicinity of the electrodes, creating a volume where the material is not uniformly polarized. This results in enhanced hysteresis in interdigitated electrode configurations relative to the hysteresis in the bulk material. The dielectric loss in a macro-fiber composite with interdigitated electrodes was characterized and is compared to the dielectric loss of the same material under a uniform field. The dielectric loss in the interdigitated electrode arrangement was found to be significantly larger and had a strong dependence on electric field amplitude. The dielectric loss is expressed in terms of an effective loss tangent (tan δ) and a more general damping model. A mechanism that contributes to the hysteresis is that the local stress in the ferroelectric material beneath the interdigitated electrodes induces ferroelastic polarization reorientation during each electric field cycle. The interactions between polarization gradients and residual stress are assessed using a finite element model with a micromechanical-based constitutive law.
Keywords
Introduction
Interdigitated electrodes (IDEs) on piezoelectric materials produce in-plane anisotropy in the piezoelectric and optical properties, with an effective d33 between the electrodes and d31 parallel to the electrodes. They are used in microelectromechanical system (MEMS) devices (Seon-Bae et al., 2013), energy harvesting (Sodano et al., 2005; Song et al., 2010), piezoelectric vibration sensing (Sodano et al., 2004), and damping (Hom and Shankar, 1995), as well as in piezoelectric strain rosettes to locate wave sources or damage (Kawiecki and Jesse, 2002; Matt and Di Scalea, 2007; Salamone et al., 2010; Zhao et al., 2011). IDEs were used by Cutchen (1980) for fast acting flash goggles. Hagood et al. (1993) investigated IDEs on piezoceramic wafers as a way to improve transverse actuation. Bent et al. (1995) coupled IDEs to piezoelectric fiber composites. These composites were composed of round extruded piezoelectric fibers embedded in a soft epoxy matrix sandwiched between two layers of IDEs. Although the fiber design in the polymer matrix made the composite more flexible and robust than previous wafer designs, the performance was limited due to insufficient contact between the electrodes and the fibers. Similarly, electric potential in the fibers was limited due to the higher permittivity of the fiber than the matrix (Gaudenzi, 1997). Wilkie et al. (2000) developed macro-fiber composites (MFCs). In some ways similar to the design of Bent et al., MFCs were constructed using IDEs on rectangular fibers instead of cylindrical fibers. A d33-mode MFC with IDEs is shown schematically in Figure 1. It consists of alternating positive and negative electrodes that pole and actuate the piezoelectric material along its length. This IDE pattern utilizes the d33 piezoelectric coefficient, providing greater electromechanical coupling and strain output than actuators that utilize the d31 piezoelectric coefficient.
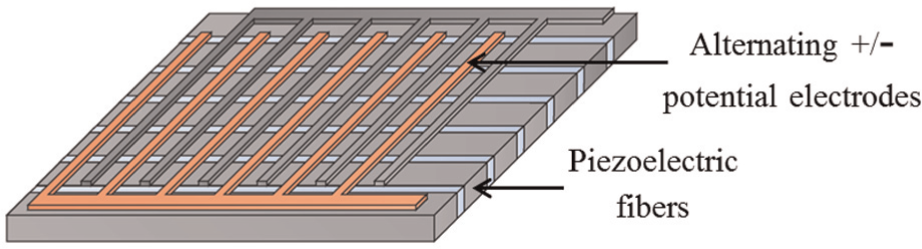
Schematic of d33-mode IDEs on an MFC.
The d33-mode IDE pattern results in field gradients within the fibers. Although the field is uniform along the fibers away from the electrodes, a field gradient exists in the vicinity of the electrodes. This field gradient creates a polarization gradient during the poling process (Beckert and Kreher, 2003; Bowen et al., 2006). Compatibility requirements result in the development of stress in the material beneath the electrodes. The stress state changes when a voltage is applied to the electrodes. This drives ferroelastic domain wall motion. Domain wall motion contributes to material losses and damping (Härdtl, 1982; Jaffe et al., 1971).
Dielectric loss in ferroelectric materials is largely the result of domain wall motion (Härdtl, 1982; Jaffe et al., 1971). The mechanical and dielectric energy density that is lost to dissipation in ferroelectric materials under cyclic loading appears as the open area within the stress–strain (σ-ε) and the electric displacement–electric field (D-E) curves. This is a measure of the net external work per unit volume done during the mechanical and electrical loading cycles (De Silva, 2000; Gallagher et al., 2013) that is dissipated to the surroundings (Uchino et al., 2006; Uchino and Hirose, 2001). Dielectric loss is commonly expressed as tan δ, where δ is the phase lag between the applied electric field, E, and the resulting electric displacement, D (Uchino et al., 2006; Uchino and Hirose, 2001). This is an effective measure of the loss under small-amplitude sinusoidal loading, either mechanical or electrical (Uchino and Hirose, 2001). The mechanical and electrical loss tangents have been found to be proportional to each other (Härdtl, 1982).
This work examines dielectric loss and damping as a function of electric field amplitude in an MFC with IDEs. A range of electric field amplitudes was applied, and the resulting dielectric losses were determined from the area within the unipolar D-E hysteresis loops. The contribution of the IDE configuration to the dielectric loss was experimentally determined through a comparison to the dielectric loss in a uniformly polarized plate of the same ferroelectric material. The polarization gradient and residual stress within the MFC were examined with a micromechanical computational model.
Experimental approach
Specimen preparation and orientation
Experiments were performed on commercial M-8528-P1 MFCs from Smart Material Inc. The MFC consisted of longitudinal polycrystalline PZT-5A fibers. The fibers ran between two transverse sets of 170 alternating positive and ground electrodes capable of producing d33-mode strain along the fibers. The overall dimensions for the lead zirconium titanate (PZT) used in the MFC were 85 × 28 × 0.15 mm3. This volume accounted for the overall volume spanned by the PZT fibers, including the epoxy-filled spaces between adjacent fibers. The electrode spacing was 0.5 mm and the electrode width was 0.125 mm. A polycrystalline PZT-5A plate with dimensions of 80 × 29 × 0.27 mm3 was used as a reference configuration. The opposite large planar faces were electroded and leads were attached.
Experimental arrangement
Small-field experimental arrangement
An Agilent 4284A Precision LCR meter was used to measure tan δ and capacitance of the MFC and plate specimens at a voltage of 1 V. Frequency was swept from 20 Hz to 1 MHz.
Large-field experimental arrangement
Each specimen was subjected to eight successive unipolar sinusoidal electric field cycles at a frequency of 1 Hz. This was repeated at amplitudes from 0.5 to 4.5 MV/m in increments of 0.5 MV/m. A 10-kV voltage amplifier was used to apply the input voltage (Vin). Electric field was calculated as the applied voltage divided by the electrode spacing. A modified Sawyer-Tower circuit was used to measure the electric displacement. In this circuit, the external capacitor was several orders of magnitude larger than the capacitance of the specimen. When voltage was applied to the specimen in series with the external capacitor, the capacitance difference resulted in a small voltage drop across the external capacitor. An electrometer was used to read the voltage across this capacitor (Vout) to avoid any draining of charge during the measurement. Electric displacement was calculated by dividing the charge by the electrode area. This was done by multiplying the output voltage (read by the electrometer) by the capacitance of the external capacitor and dividing by the electrode area. The experimental arrangement of the MFC is shown in Figure 2. A similar experimental arrangement was used for the plate. Three MFCs were tested for verification of the results. The D-E hysteresis and resulting tan δ and damping factor had similar behavior for the three MFC specimens.
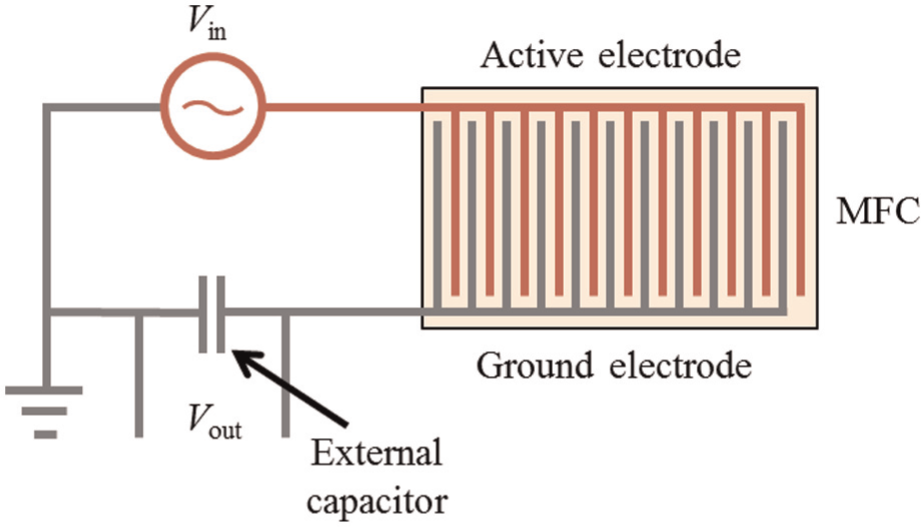
Experimental arrangement used to apply electric field and measure electric displacement of the MFCs. A similar arrangement was used for the plate.
Experimental results
Small-field experimental results
The results from the LCR tests for tan δ and capacitance are shown in Figures 3 and 4, respectively. Figures 3 and 4 show the results up to 220 kHz. A large spike in tan δ and discontinuity in capacitance occurred between 10 and 20 kHz for both the MFC and the plate. Tan δ for the MFC, as shown in Figure 3(a), was found to be between 0.02 and 0.04 for frequencies below 10 kHz. A large spike in tan δ to above 0.32 occurred at 20 kHz. Similarly, as shown in Figure 3(b), tan δ for the plate was found to be 0.01 below 2 kHz and continuously increased above 2 kHz. A large spike in tan δ to about 0.85 occurred at 20 kHz. The 20-kHz frequency corresponds to the fundamental mode planar resonance of the MFC. Capacitance of the MFC, shown in Figure 4(a), was found to decrease linearly from 5.75 to 5.25 nF with frequency for frequencies below 10 kHz. The MFC underwent an abrupt discontinuity in capacitance between 10 and 20 kHz, followed by a decrease to about 4.5 nF above 20 kHz. Capacitance of the plate, shown in Figure 4(b), was around 160 nF below 10 Hz. Discontinuity was found between 10 and 20 kHz followed by sporadic behavior at frequencies above 20 kHz. Similar to the MFC, the planar mode resonance of the 80-mm plate was just under 20 kHz.
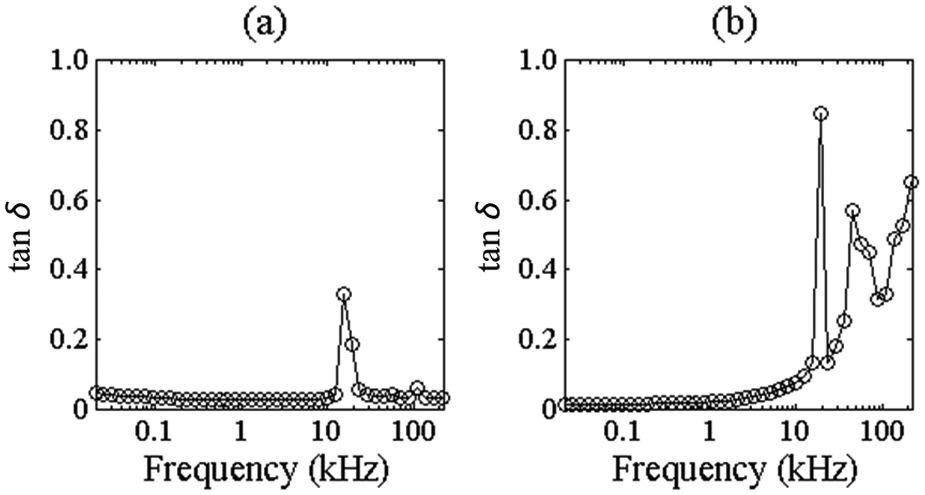
Tan δ for the (a) MFC and (b) plate, measured with an LCR meter frequency sweep from 20 Hz to 1 MHz at 1 V. Results from 20 Hz to 220 kHz are shown.
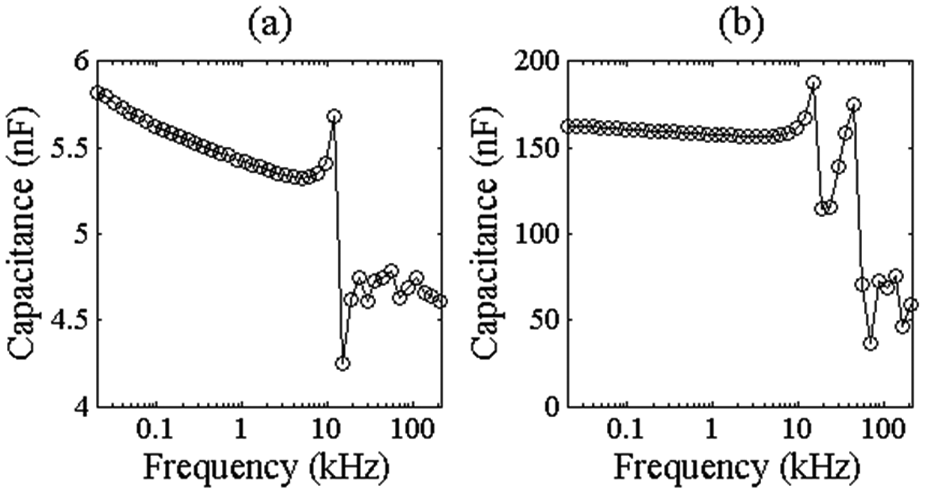
Capacitance for the (a) MFC and (b) plate, measured with an LCR meter frequency sweep from 20 Hz to 1 MHz at 1 V. Results from 20 Hz to 220 kHz are shown. Note the difference in the capacitance scale between (a) and (b).
Large-field experimental results
Unipolar electric field cycles were run at amplitudes from 0.5 to 4.5 MV/m in increments of 0.5 MV/m while monitoring the electric displacement. The unipolar D-E hysteresis loops for the MFC and plate are shown in Figure 5(a) and (b), respectively, in increments of 1 MV/m. Additional cycles have been omitted for clarity. The first cycle is not a closed loop and exhibits excess hysteresis. Over time there is some depolarization due to the logarithmic aging effect in ferroelectric materials (Jonker, 1972). The first large-field cycle re-poles the material. This effect is not as pronounced in the plate. The MFC experienced significantly greater hysteresis in the D-E loops than the plate for all electric field amplitudes. Both the MFC and the plate experienced the least hysteresis at an electric field amplitude of 0.5 MV/m. Similar relative polarization changes occurred in the closed cycles for the MFC and the plate. Saturation in the electric displacement response began to occur at higher electric field levels. All three MFCs experienced similar hysteresis and relative polarization changes.
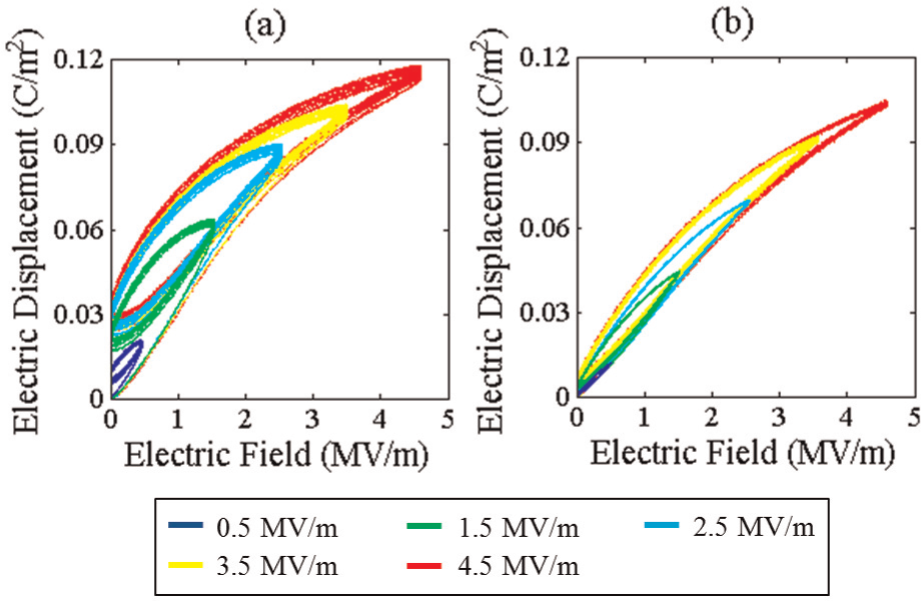
Unipolar D-E hysteresis loops for the (a) MFC and (b) plate at electric field amplitudes from 0.5 to 4.5 MV/m, in increments of 1 MV/m. All eight loading cycles are shown.
Finite element approach
Linear finite element model
The micromechanical finite element approach developed by Chen and Lynch (1999), outlined below, was extended to three-dimensional (3D) elements. The linear portion of the finite element regime is solved by equating the variation in the electric Gibbs energy density function of the system to the virtual work of the external loads (equation (1))
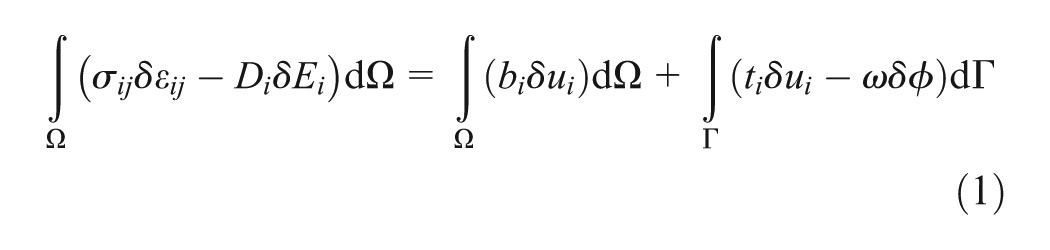
where σij is the Cauchy stress tensor, εij is the infinitesimal strain, Di is the electric displacement, Ei is the electric field, bi are the body forces, ui are the displacements, ti are the surface tractions, ω are the free surface charge densities,
and
are used in this formulation. Here,
Using the symmetry of the constitutive tensors and noting that the virtual displacements and potentials are arbitrary, that the electric field is the negative gradient of a scalar potential
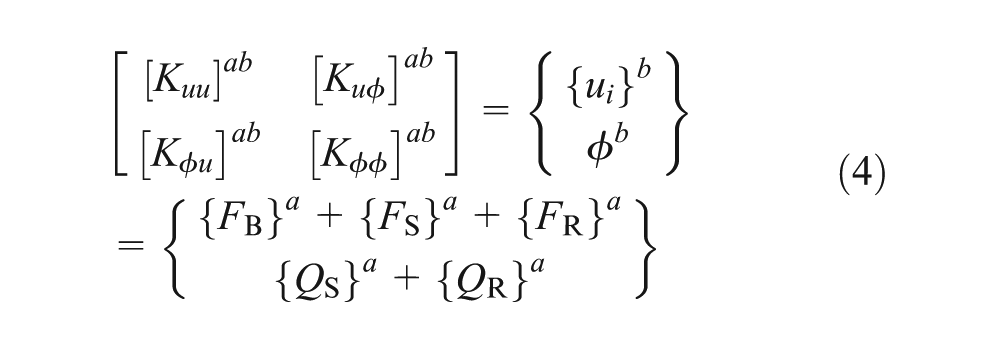
In equation (4),
Definitions of the elastic, piezoelectric, and dielectric stiffness matrices; the body, surface, and remnant force vectors; and the surface and remnant charges in equation (4).
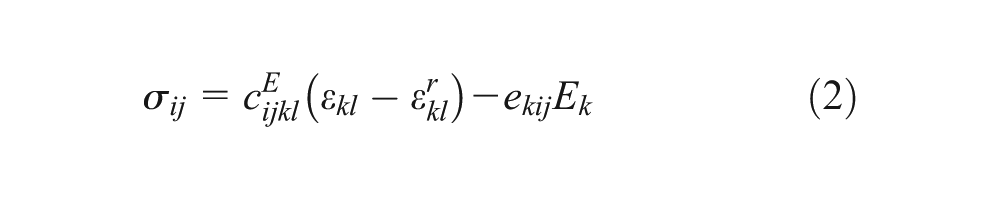
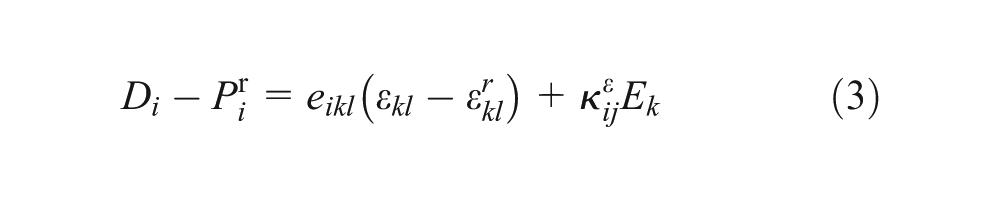
Material model
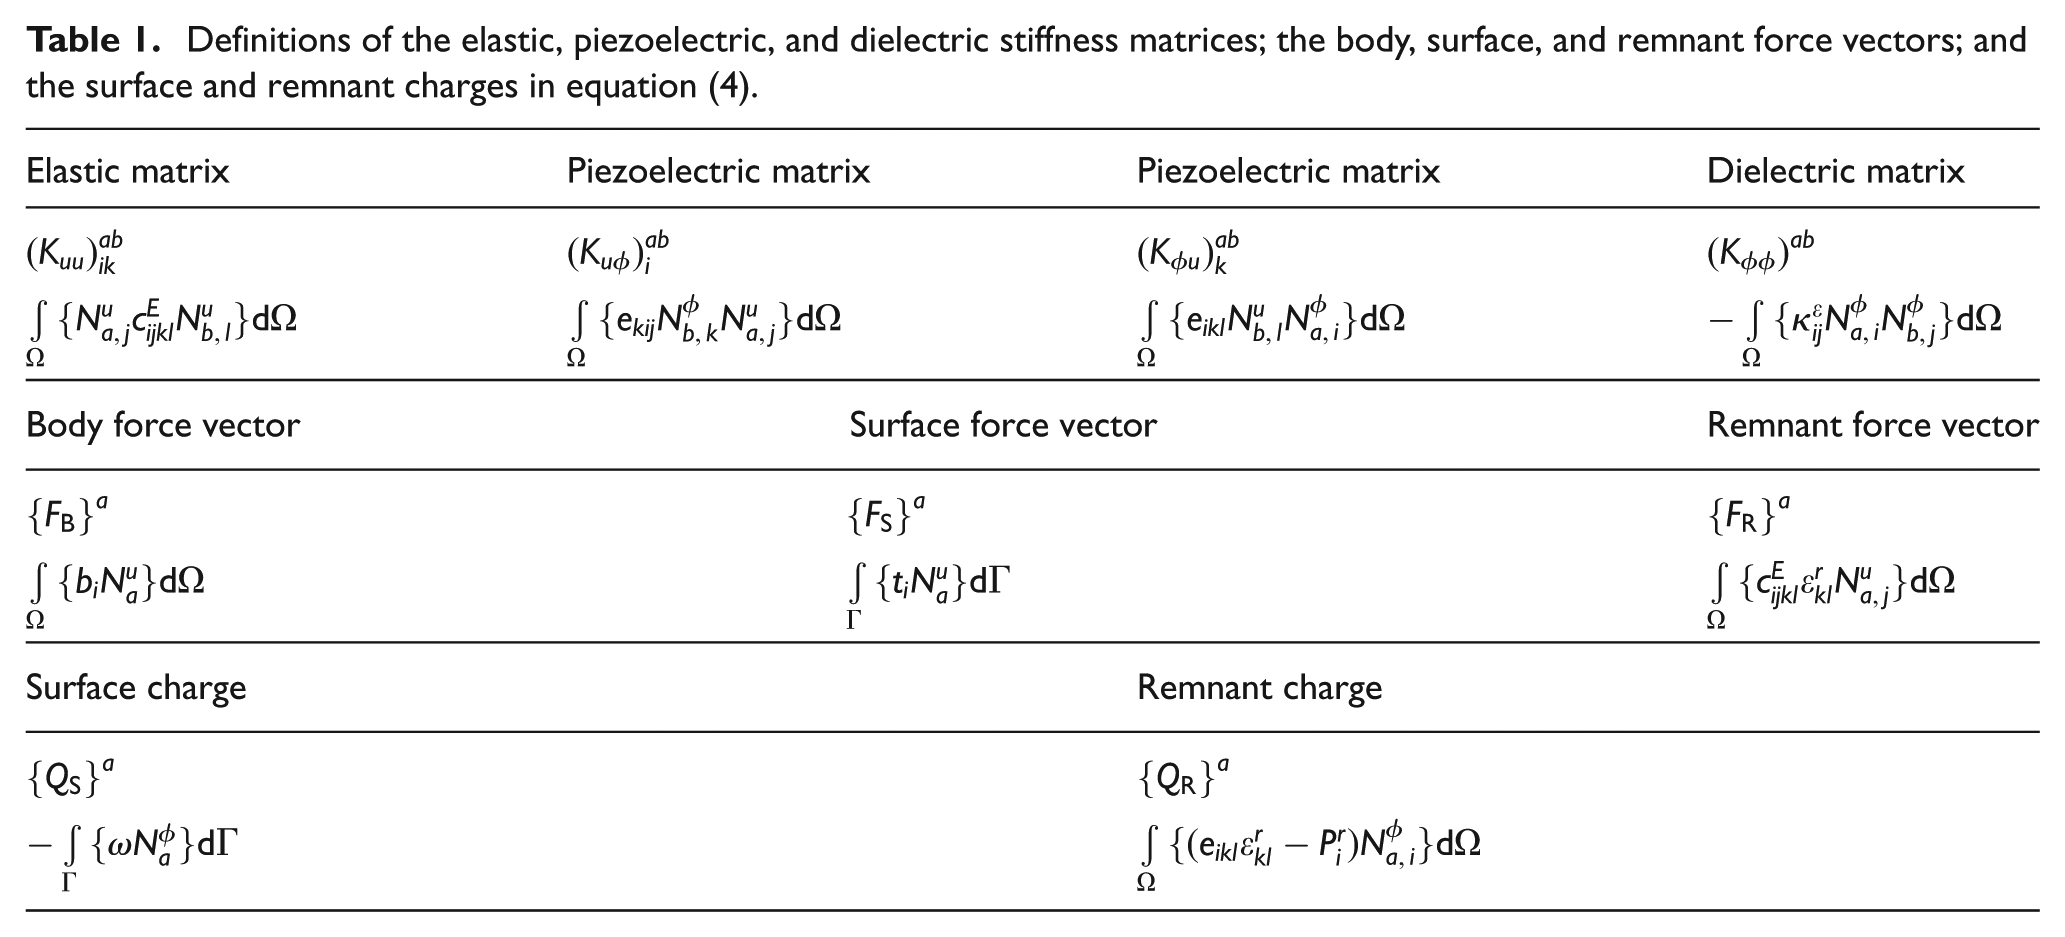
The material model uses the approach of Hwang et al. (1995), modified by Chen and Lynch (1999). A set of randomly oriented single-crystal grains is organized at each Gauss point. For each grain coordinate system, a work energy criterion governs the switching of the polarization through six tetragonal variants. The linear finite element routine is called while stepping through various loading conditions. The switching criterion expressed in equation (5)
is called during each loading step. In equation (5), Δ represents a change in polarization and strain from one state to another and Wαβ is the work required to change the polarization from state α to state β. The energy barrier is defined by equation (6)

where E0 is the coercive field and D0 is the remnant polarization of the material. When the material switches, the constitutive tensors, remnant polarization, and remnant strain are updated by volume averaging the associated tensors of the grains on each Gauss point. The linear finite element routine then continues stepping the loading conditions.
Geometry and boundary conditions
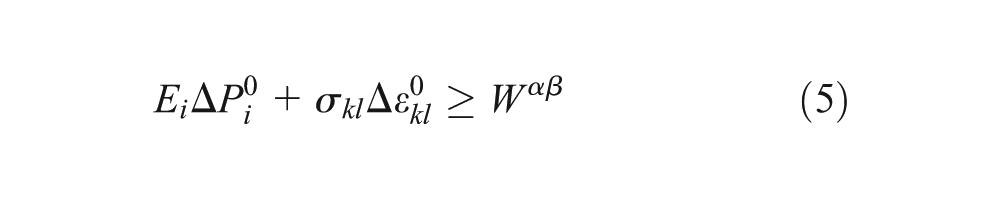
IDEs on a rectangular ferroelectric fiber were modeled as shown schematically in Figure 6. The model consisted of four separate electrode sections, two on the top of the fiber and two on the bottom. By symmetry, only one-eighth of the fiber needed to be meshed. In Figure 6, the meshed region is highlighted with a different color from the rest of the fiber sections. The fiber section was modeled using the dimensions of the experimentally tested MFC where L2 = 0.125 mm, D = 0.25 mm, H = 0.15 mm, and L = 0.5 mm. The meshed fiber section with these dimensions is shown in Figure 7. The mesh uses element size biasing near the edge of the electrode to account for the effects of large-field gradients in this region. A convergence study was performed on this mesh to balance solution times with accuracy of the solution.
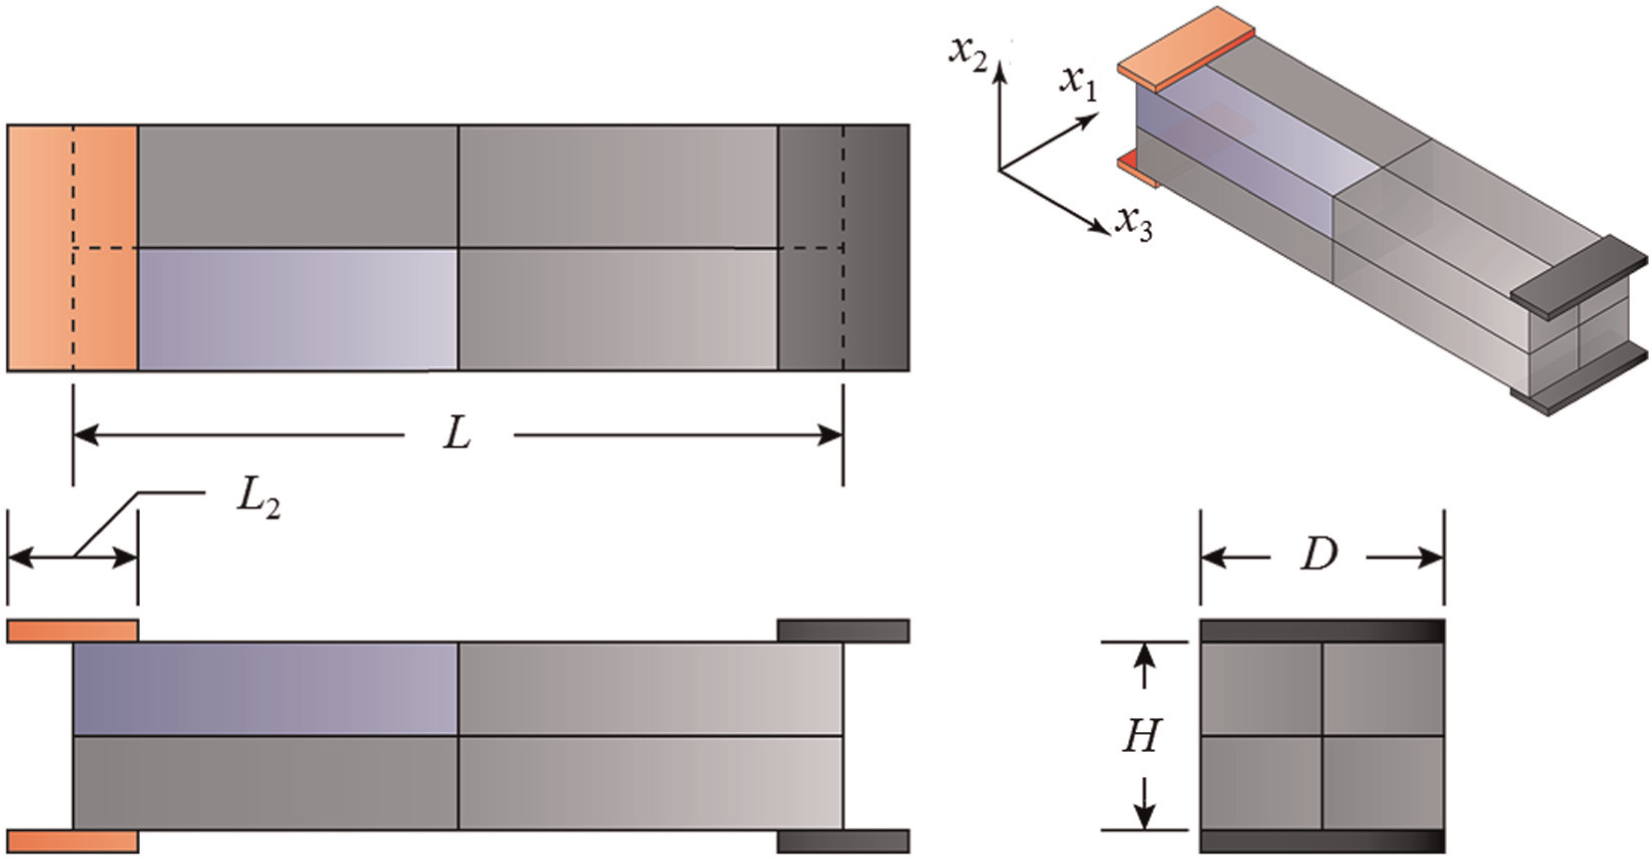
IDEs on the modeled rectangular ferroelectric fiber. By symmetry, only one-eighth of the fiber needed to be meshed. The meshed region is highlighted.
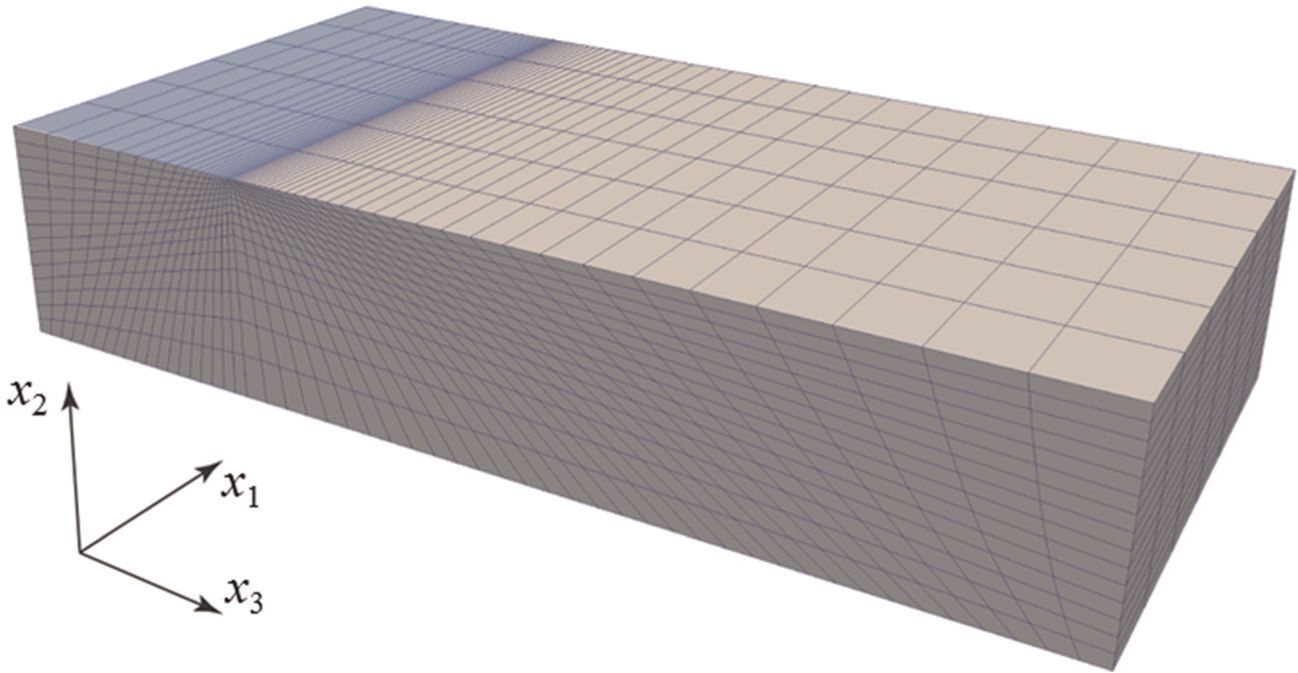
Meshed fiber used for the finite element model. The electrode is located on the top left highlighted surface. The mesh uses element size biasing near the edge of the electrode to account for the effects of large-field gradients.
Boundary conditions were applied to the fiber section in Figure 7. The electrode was modeled at the highlighted region. Potential
The material properties of PZT-5A were chosen to match the experimental MFC. The material response was compared to that of a linear actuator of the same composition. The micromechanical model was used to determine the underlying behavior inherent in the geometry of IDEs. The finite element model was not used to simulate cyclic hysteresis loops for the MFCs.
Analysis and discussion
Large-field dielectric losses
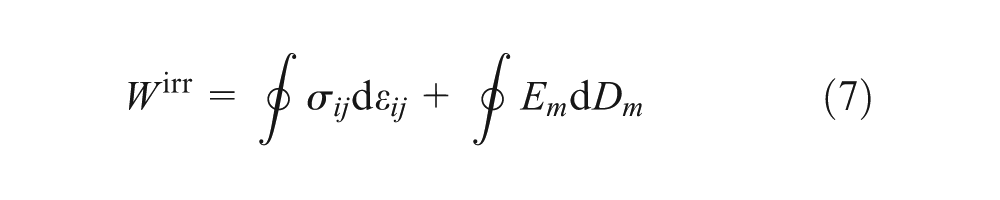
The large-field dielectric loss (Le) and effective loss tangent were calculated using a work energy approach that matches the area within a minor hysteresis loop to an equivalent ellipse (Gallagher et al., 2013). When the loading is cyclic and the initial state is the same as the final state, the irreversible work done in a cycle, Wirr, is given by equation (7)
At zero stress, the irreversible work is attributed to the electrical losses of the D-E cycle and is equal to the area within the D-E hysteresis loop (equation (8))

where the measured loss was determined by a numerical integration of the data shown in Figure 5.
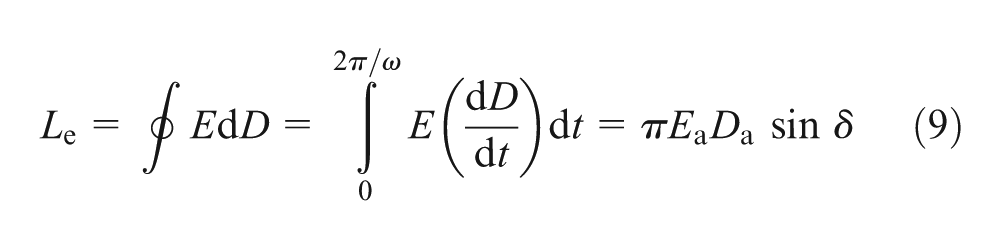
Loss at small fields under sinusoidal loading is typically expressed using a phase lag model where E and D are offset by a phase angle δ. E is expressed as Ea cos(ωt) and D is expressed as Da cos(ωt −δ). Ea and Da are the amplitudes of the electric field and electric displacement, respectively, and ω is the angular frequency. These equations represent the hysteresis in the D-E loop as an ellipse with a slope. Substitution of these expressions into equation (8) models the dielectric loss to an ellipse of equivalent area, expressed by equation (9)
An effective tan δ was thus calculated using equation (10)

Figure 8 shows the resulting tan δ values for each electric field loading amplitude. Each value is the average determined from cycles 3 through 8. As seen in Figure 8, the dielectric loss is a function of amplitude, and the dielectric loss in the MFC with IDEs is substantially larger than the dielectric loss in the plate. Differences in tan δ among the three MFCs were negligible.
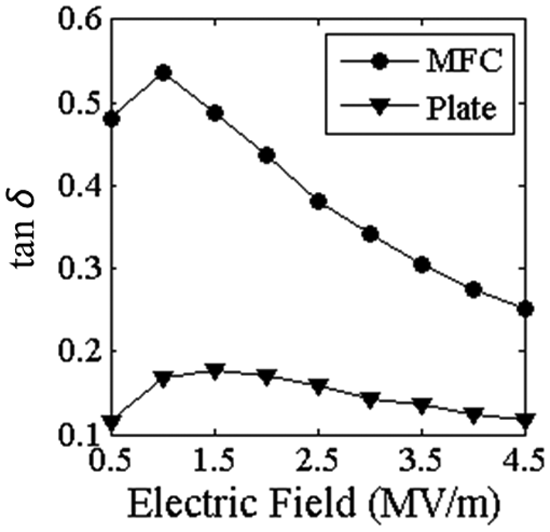
Large-field effective tan δ versus electric field amplitude. Both the MFC and plate follow a similar profile with a large initial increase in tan δ, followed by a near-linear decrease as electric field amplitude is increased. Tan δ was found to be roughly three times larger for the MFC than the plate.
Damping factor
Ji et al. (2013) expressed the damping capacity of a material under cyclic loading as the ratio of the loss energy to the maximum available energy. This method equates the maximum available energy to the rectangular area formed by the start of the cycle and the point corresponding to the maximum loading amplitude. This relation is expressed in equation (11) for electrical work
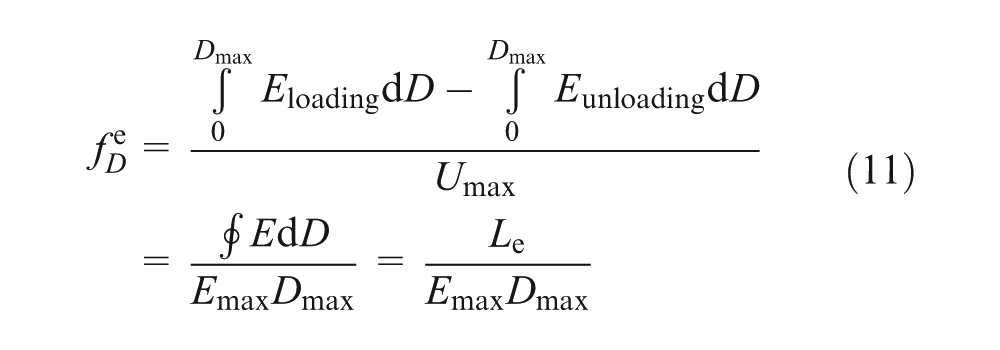
and is shown in Figure 9.
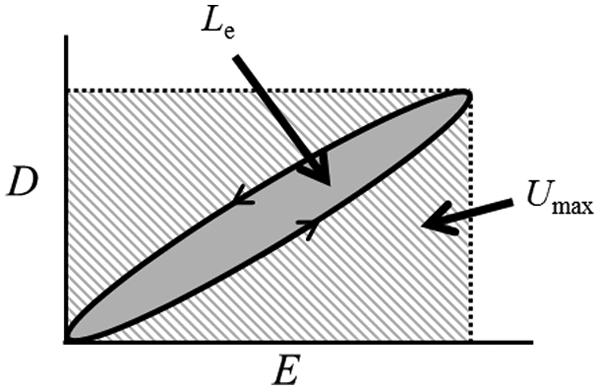
Dielectric damping coefficient was calculated as the ratio between the energy lost in a loading cycle (Le) to the maximum available energy (Umax).
Figure 10 shows the damping factor for each electric field loading amplitude as calculated with equation (11). Each value is the average determined from cycles 3 through 8. The behavior of the damping factor correlates with the behavior of tan δ. The damping factor is a function of amplitude. The MFC with IDEs has a substantially greater damping capacity than the plate. Differences in the damping factor among the three MFCs were negligible.
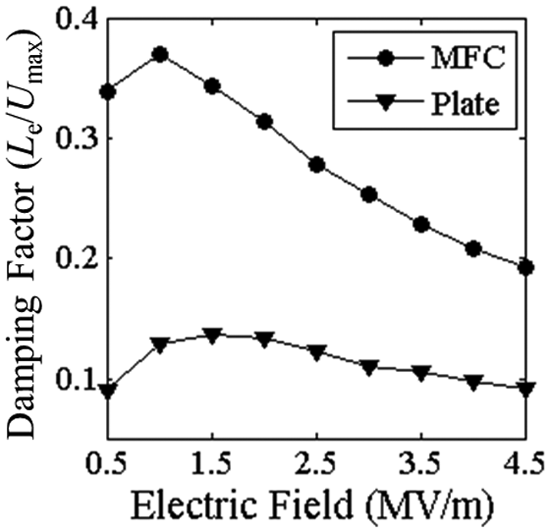
Large-field damping factor versus electric field amplitude. The damping capacity of the MFC was found to be roughly three times larger than the damping capacity of the plate.
Finite element analysis and discussion
The analysis presented in this section addresses the dielectric losses and increased damping of the MFC based on the micromechanical finite element model. Interactions between the ferroelectric portions of the fibers directly underneath the electrodes and the bare ferroelectric portions of the fiber were investigated. The MFC was initially poled along the fiber length, whereas the plate was initially poled through the thickness. The MFC experienced more hysteresis in the electric displacement response than the plate; therefore, there were greater dielectric losses and increased damping for the MFC. The finite element model was used to determine the multiaxial polarization reorientation behavior of the ferroelectric fiber in the MFC. The results indicate that polarization gradients drive ferroelastic domain wall motion within the fibers of the MFC during loading.
Figures 11 to 13 show the finite element results. The electrode is on the top left surface. In Figure 11, the longitudinal (horizontal) electric field away from the electrodes results in uniform polarization along the fiber axis. In this region, the fiber extends along its length and shrinks in the vertical direction. The horizontal uniform field between alternating electrodes causes lateral extension along the fiber axis corresponding to d33 and transverse contraction corresponding to d31. The longitudinal component of electric field is 0 beneath the electrodes, and the material in this region does not change shape. This shape mismatch results in stress. Larger stress occurs where the transition in polarization is more abrupt. The field concentration at the edges of the electrodes corresponds to a very large strain mismatch, while diffuse regions have a lower strain mismatch. The strain mismatch–induced stress distribution in the material after poling is shown in Figure 12. The largest stress occurs where the field gradient is greatest (beneath the electrode). The uniform field region away from the electrode experiences no polarization-induced stress. The stress state changes under application of electric field. When a large field is applied, the strain mismatch between the region under the electrode and the region away from the electrode increases. This results in ferroelastic-assisted polarization changes in the regions near the electrode. When the field is removed, the shape mismatch is reduced. This induces reverse ferroelastic polarization changes.
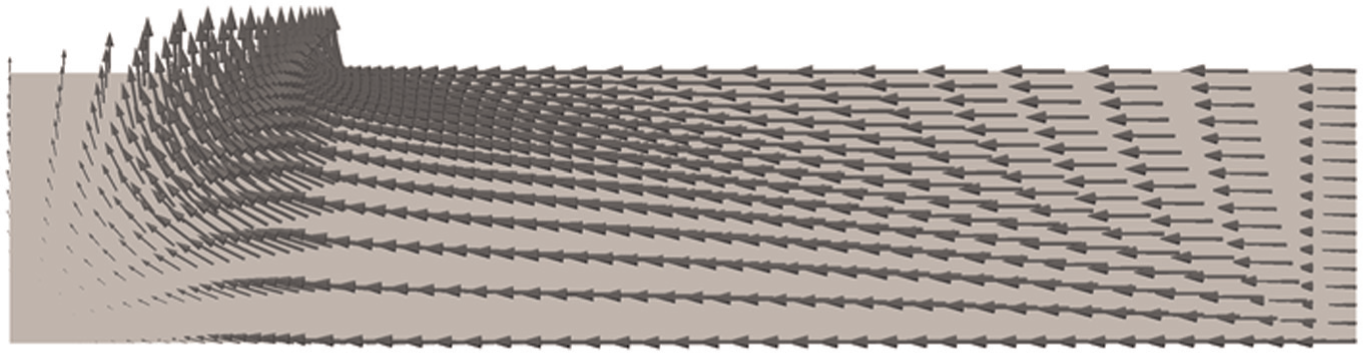
Polarization state at maximum applied voltage. The arrows are scaled with the polarization magnitude, where the maximum polarization was 0.31 C/m2. The electrode edge is on the top left face.
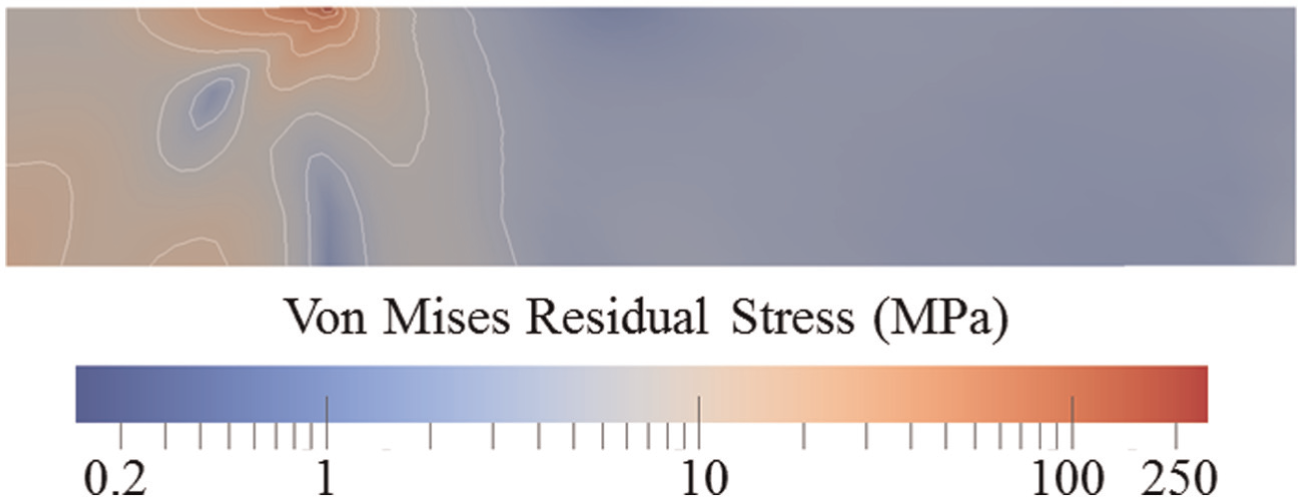
Model of the residual stress state when the voltage is removed from the fiber after poling. The electrode is located on the top left face.

Difference in the remnant polarization when the voltage is removed from the fiber and the remnant polarization of maximum applied voltage. The arrows are scaled with remnant polarization magnitude such that the maximum scale is 0.03 C/m2. The electrode edge is on the top left face.
The ferroelastic-induced polarization changes can be seen in Figure 13. Figure 13 shows the difference in remnant polarization states between the fully applied voltage and when the voltage is removed. When the voltage is applied, the ferroelastic switching causes more remnant polarization to be pulled upward toward the electrode. Upon release, the remnant polarization states return as reflected in Figure 13. The result is the experimentally observed increased hysteresis in the MFC over that of the uniformly poled plate of the same material.
Concluding remarks
This study experimentally characterized the dielectric loss and damping behavior of ferroelectrics with IDEs. Differences in dielectric loss and damping between a commercial d33-mode MFC and an electroded plate, both PZT-5A, were analyzed. The large-field effective dielectric loss was experimentally measured using a technique that matches the area within the unipolar electric displacement–electric field hysteresis loop to an equivalent area ellipse-shaped hysteresis loop. Tan δ for the MFC was found to be approximately three times larger than that of the plate. Similarly, the MFC had two to three times the damping capacity of the plate. PZT-5A has approximately a 2:1 ratio of d33:d31. This means that the d33 MFC design has increased energy absorption capabilities without a compromise in actuation capabilities. The MFC geometry was analyzed using a nonlinear and hysteretic finite element model that captures the full poling behavior of ferroelectric ceramics. Polarization and strain mismatches between the region around the electrodes and the region away from the electrodes were found to drive domain wall motion during electrical loading of the MFC.
Footnotes
Declaration of conflicting interests
The results are those of the authors and do not represent the opinions or conclusions of NASA LaRC.
Funding
This research received financial support from the NASA LaRC under grant NNX13AC96A.