
Abstract
Wavy behaviours of hysteresis energy variation in nanoscale bulk of thermomechanical austenitic NiTi shape memory alloy are reported in ultimate nanoindentation loading cycles. One sharp and two spherical tips were used while two loading–unloading rates were applied. For comparison, another austenitic copper-based shape memory alloy, CuAlNi shape memory alloy, and a metal with no phase transition, elastoplastic Cu, were investigated. In shape memory alloys, the hysteresis energy variation ultimately undergoes a linear decrease with internal wavy fluctuations and no stabilisation was observed. The internal energy fluctuation in these alloys was found dissimilar depending on the loading–unloading rate and the indentation tip geometry. In contrast, there was an absence of both overall and internal variations in hysteresis energy for Cu after the second loading cycle. The underlying physics of these variations is discussed and found to be attributed to both the created dislocations and ratcheting thermal–mechanical behaviour of the phase-transformed volume in shape memory alloys.
Introduction
A large number of industries, including biomedical, construction, aviation and manufacturing, have benefited from thermomechanical shape memory alloys (SMAs) in macroscale using the unique shape memory properties of these smart alloys (Hartl et al., 2010; Hung Hung et al., 2013). Researches on these advanced alloys have therefore been devoted mainly to macroscale studies (Grandi et al., 2012; Morin et al., 2011). In real and critical working conditions, for example, under repetitive nanoscale loadings, the behaviour and the role of the governing parameters may differ in small scale (Amini et al., 2012b, 2013b, 2013c; Cheng et al., 2011). Recent technologies have provided us with opportunities to fundamentally investigate the behaviour of these alloys under extremely small-scale loadings (Amini et al., 2011a, 2012a, 2013a; Zhang et al., 2007). One topic that has not been comprehensively investigated is the performance of these alloys under cyclic nanoscale deformation in the compression mode (Amini and Cheng, 2013; Amini et al., 2011b; Fei et al., 2012). In this article, we report a new observation of wavy fluctuation of hysteresis energy in the range of picoJoules (pJ) in the ultimate nanoindentation loading cycles. This energy variation in NiTi SMA is compared with a copper-based SMA and Cu by using different loading rate set-ups and indenter tips and the underlying physics is further elaborated.
The findings pave the way for a new approach towards the ultimate response of cyclic loading in SMAs with solid-state phase transition. This answers the need for a closer look into the nanoscale cyclic trends of advanced alloys both theoretically and experimentally, as it has been so far covered under the general title of stabilisation (Amini et al., 2013b). In practice, the results have a potential to be exploited in dynamic SMA nanoactuators and nanodampers which are frequently under various loads (Amini et al., 2012a, 2013b; Fei et al., 2012; Zhang et al., 2007).
Materials and methods
A single-crystal CuAlNi ingot was prepared using the Bridgeman method. A number of specimens were cut from the ingot along the longitudinal direction using a wire-cutting electrical discharge machine. The specimens were heat treated at 1073 K for 1200 s and immediately dipped in oil with a temperature of 393 K followed by gradually cooling at room temperature. The polycrystalline NiTi SMA sheets were provided by Memory Appl. Inc.
The thermal analysis obtained from a differential scanning calorimeter (DSC; TA-Q1000) determined the phase transition temperatures of the SMAs using a thermal ramp of 5°C/min. Austenite finish temperatures were characterised as 0°C for CuAlNi SMA and 28°C for NiTi SMA as shown in Figure 1(a) and (b), respectively. To ensure the SMAs were in the full austenite phase state, the alloys were kept in a chamber at 100°C for 2 h before performing the nanoindentation tests at room temperature. This set-up maintains the condition for fully austenite to fully martensite phase transition during the cyclic nanoindentation loading–unloading (Ng and Sun, 2006). The nominal alloy composition was measured by high-resolution X-ray diffraction spectroscopy (XRD; PW1825) as 56.4%-Ni and 43.6%-Ti (wt%) for cubic NiTi SMA (JSPDF#03-065-5537). The reader may refer to the following references for further information about the texture of this alloy (Amini and Cheng, 2013; Amini et al., 2013b). The results of the element analysis were Cu-13.19%–Al-4.43%–Ni-balance% for CuAlNi SMA using an X-ray fluorescence spectrometer (XRF; JEOL JSX-3201Z). XRD and XRF use X-ray to specify the compositions and, therefore, are comparable with a similar range of errors. Tensile tests were conducted on dog bone–shaped sheets using a standard testing machine (MTS Alliance RT/10) at isothermal strain rates of 7E−4 s−1 for CuAlNi SMA and 5E−5 s−1 for NiTi SMA. The isothermal rates were selected in order to avoid the thermal/hardening effect. Compared to CuAlNi SMA, NiTi SMA has a larger hysteresis zone (larger amount of released latent heat); thus, to remain in the isothermal condition, a lower range of loading rate (10−5 s−1) was selected for NiTi SMA compared to 10−4 s−1 for CuAlNi SMA. After performing the tensile tests at 30°C, 35°C, 40°C and 45°C, the Clausius–Clapeyron coefficient was measured as 2.3 MPa/°C for CuAlNi SMA. This coefficient was measured as 5.88 MPa/°C for NiTi SMA as a result of the tensile tests at elevated temperatures of 30°C, 35°C, 40°C, 45°C and 50°C. The grain sizes were in the range of 50–100 nm for NiTi SMA and a single crystal for CuAlNi SMA as observed by transmission electron microscopy (TEM; 200 kV JEM-2100F). Samples were grinded and polished using a series of silicon carbide and diamond papers until the average surface roughness was less than 6 nm as measured by a three-dimensional (3D) surface profiler machine (SPM; NT3300). The nanoindentation tests were conducted on the polished samples using an in situ nanoindenter (Hysitron TI 900). Before carrying out the tests, the instrument was carefully calibrated using a standard procedure. A maximum load of 10,000 μN was applied in all tests controlled by an ultra-fine piezoelectric beam in the nanoindenter. Two spherical diamond tips with radii of 3.61 and 5.23 μm (shown as μmR) and a standard Berkovich tip with a large included angle of 142.3° were used to minimise the effect of friction. Simple loading and unloading schemes were applied to the samples at two loading/unloading rates of 2000 and 10,000 μN s−1, respectively.
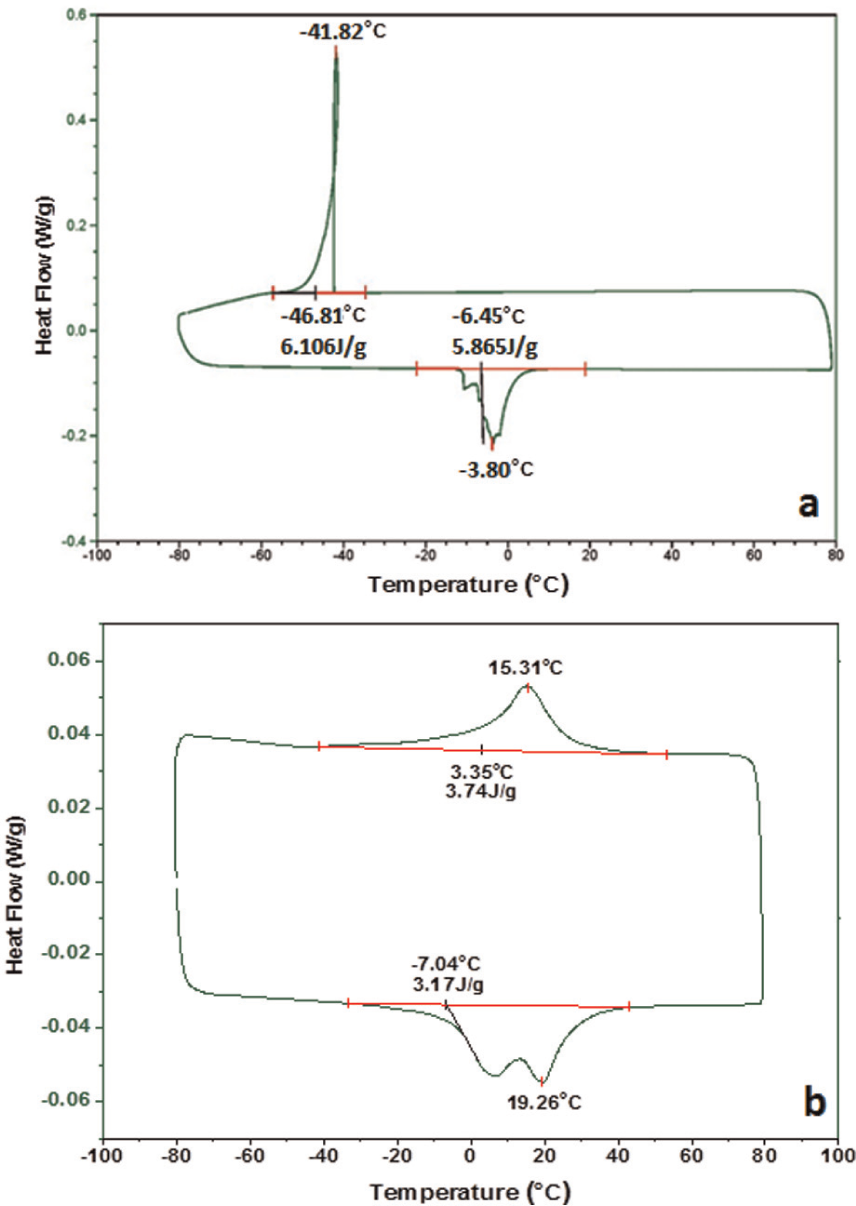
DSC curves for (a) CuAlNi SMA and (b) NiTi SMA. Both alloys are in the austenitic state at the testing temperature (23°C).
Results and discussion
Thermomechanical phase transition and nanoindentation trends
The DSC curves of NiTi and CuAlNi SMAs confirm that both alloys are in the austenite phase at room temperature (23°C), as shown in Figure 1 during the heating stage from −80°C to 80°C with a negative value of heat flow. Figure 2 presents the tensile curves of NiTi SMA at 23°C and 50°C and CuAlNi SMA at 23°C. Increasing the temperature by 27°C leads to a rise of 170 MPa in the forward phase transition stress of NiTi SMA, from 316 to 486 MPa. As the Clausius–Clapeyron coefficient of NiTi SMA was found to be higher than the coefficient of CuAlNi SMA (5.88 > 2.3 MPa/°C), the thermal rise of the forward phase transition stress for NiTi SMA is more than double the increase in stress for CuAlNi SMA. This observation along with the results shown in Figure 1 (the measured heat capacity 3.17 J g−1 for NiTi SMA and 5.865 J g−1 for CuAlNi SMA, which indicate that less heat is required to increase the temperature of the bulk in NiTi SMA) are both indications that the temperature change has a more significant effect on the thermomechanical behaviour of NiTi SMA compared with that of CuAlNi SMA.
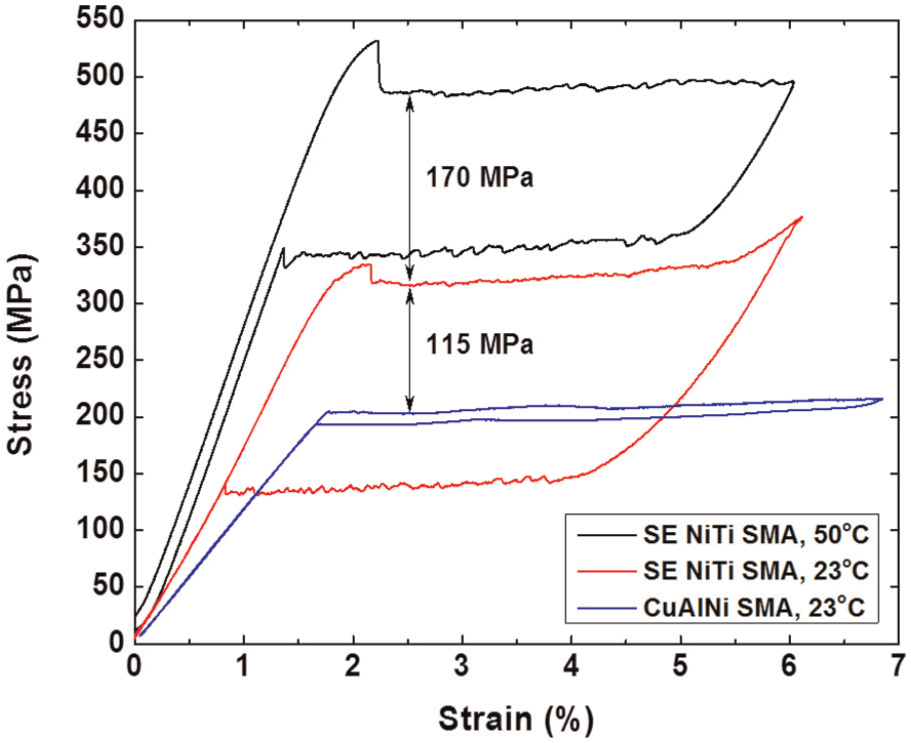
Tensile curves for NiTi SMA at 23°C and 50°C and that for CuAlNi SMA at 23°C. The forward phase transition stress of NiTi SMA is higher than that of CuAlNi SMA by ∼115 MPa and rises by ∼170 MPa when the temperature increases by 27°C.
According to Figure 2, the reverse phase transition stress is elevated by ∼200 MPa, from 139 to 341 MPa following a temperature increase in 27°C. This change is significant and higher than the thermal variation in the forward phase transition stress by about 170 MPa. This proves that the temperature has a more significant influence on SMAs during the unloading stage (Amini et al., 2013b). The underlying physics of this phenomenon will be discussed in the following sections. Moreover, the forward phase transition stress of NiTi SMA (as seen in Figure 2) is much higher than that of CuAlNi SMA by 115 MPa. Unlike NiTi SMA, the forward phase transition stress and reverse phase transition stress for CuAlNi SMA are seen to have a close magnitude. This reveals that a lower amount of latent heat is released in CuAlNi SMA during a similar loading–unloading round compared with the NiTi alloy.
The nanoindentation results for NiTi SMA using 3.61 μmR, 5.23 μmR and Berkovich tips; CuAlNi SMA using a Berkovich tip and Cu using a 3.61 μmR tip are presented in Figure 3 where the loading–unloading rate was kept constant at 2000 μN s−1.
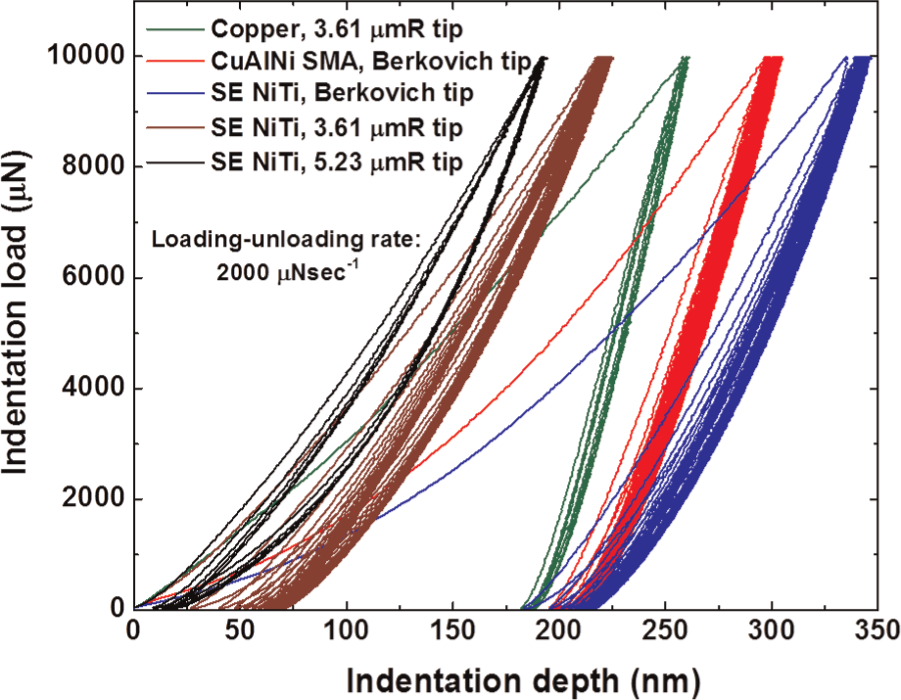
Cyclic nanoindentation curves using a 2000 μN s−1 loading–unloading rate for: Cu using a 3.61 μmR tip; copper-based SMA using a Berkovich tip and NiTi SMA using Berkovich, 3.61 μmR and 5.23 μmR tips.
It can be clearly seen that the unloading slope of the latter three indentations differs significantly. In these cases, the unloading slope for CuAlNi SMA under the sharp nanoindentation is higher than that of NiTi SMA. The unloading slope is particularly important as the calculation of one of the most important material properties, that is hardness, is determined on the basis of this slope which is related to the elastoplastic deformation (Oliver and Pharr, 1992). Furthermore, in the first cycle for SMAs, the loading slope decreases for NiTi using 5.23 and 3.61 μmR tips, CuAlNi using a Berkovich tip and NiTi also using a Berkovich tip. They all have increasing trends for maximum indentation and residual depths. Nevertheless, CuAlNi and NiTi SMAs with different hysteresis stresses have shown a similar residual depth of ∼214 nm in the sharp nanoindentation close to the residual impression of Cu in the spherical nanoindentation. Here, the hysteresis stress refers to the difference between the forward and reverse phase transition stresses in Figure 2. Moreover, the variation in maximum indentation depth for SMAs in Figure 3 was found to be relatively lower than that of their residual depths, especially during the cyclic spherical nanoindentation.
Hysteresis energy variation
Figure 4 shows the achieved hysteresis energy calculated by using a simple integration method. There is a nonlinear decreasing trend for all materials and tips which terminates with a linear trend towards the end of the cyclic process.
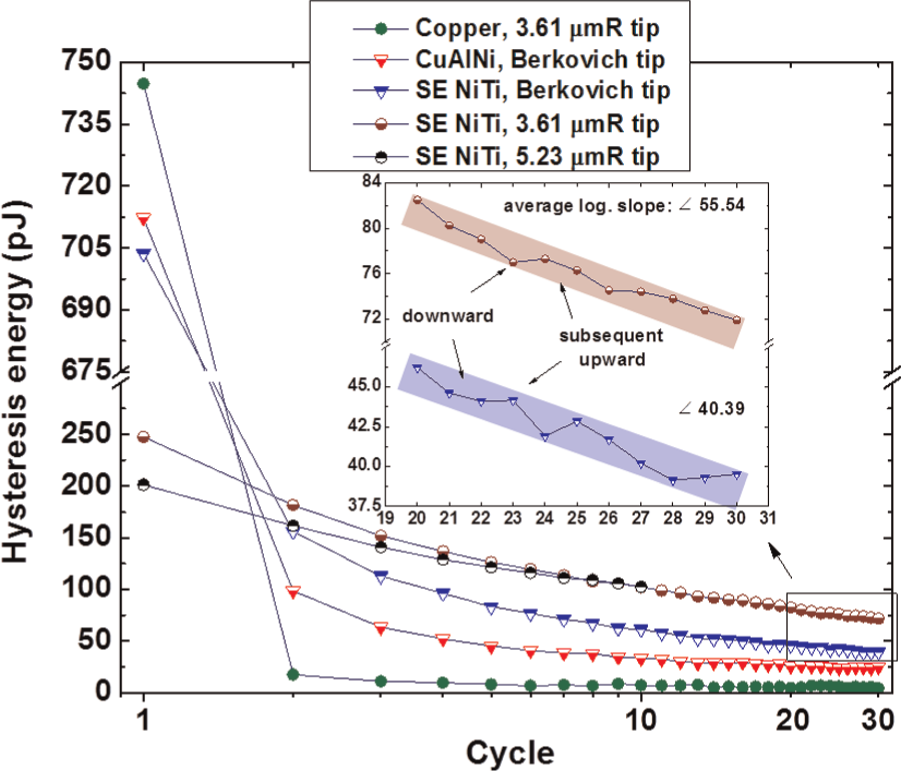
Hysteresis energy change per cycle of nanoindentation curves in Figure 3 for copper using a 3.61 μmR tip; copper-based SMA using a Berkovich tip and NiTi SMA using Berkovich, 3.61 and 5.23 μmR tips. Dissimilar decreasing and internal wavy trends are observed during the cycles.
Compared with the sharp cyclic indentation, the nonlinearity was found to be significantly less in the case of spherical cyclic indentation on NiTi SMA. In the first cycle, Cu using a 3.61 μmR tip; CuAlNi SMA using a Berkovich tip and NiTi SMA using Berkovich, 3.61 μmR and 5.23 μmR tips have the highest to lowest hysteresis energy. From the second cycle towards the 30th cycle, this trend changes from the highest to lowest for NiTi SMA using 3.61 μmR and Berkovich tips, CuAlNi SMA using a Berkovich tip and Cu using a 3.61 μmR tip. The hysteresis variation for NiTi SMA using a 5.23 μmR tip approaches that of the 3.61 μmR tip during the first few cycles. For the range of 20–30 cycles, the average logarithmic (log.) slope varies significantly for SMAs by 10.72 pJ/cycle for CuAlNi SMA using a Berkovich tip and 40.39 and 55.54 pJ/cycle for NiTi SMA using Berkovich and 3.61 μmR tips (inset Figure 4). This proves that towards the end of the cyclic process the hysteresis energy of SMAs is not depleted, rather it ultimately adopts a decreasing trend with different slopes, depending on the shape memory property and the indentation tip radius. In contrast, the hysteresis energy variation for Cu remains almost unchanged after the second cycle with a slope of 3.02 pJ/cycle for the 20–30 cycle range. Figure 4 shows that along with the overall decreasing trend specified by the above slopes, the hysteresis energy for NiTi SMA exhibits an internal wavy behaviour. The magnitude of this subsequent upward–downward variation is relatively higher in value for spherical indentation. Nevertheless, more variations, for example, more minima of energy with sharper changes, were observed for the sharp cyclic indentation on NiTi SMA.
Figure 5 depicts the results obtained from two cyclic indentation tests on NiTi SMA using Berkovich and 3.61 μmR tips. The maximum indentation load is similar to that shown in Figure 3 (10,000 μN), but the loading–unloading rate is five times higher (10,000 μN s−1). Similar to those shown in Figure 3, the variation in residual indentation depth using the spherical tip is higher than the changes in its maximum depth and the residual depth from the sharp indentation. The instant unloading slope is slightly higher than that of the spherical indentation. This discrepancy is much larger in the loading stage.
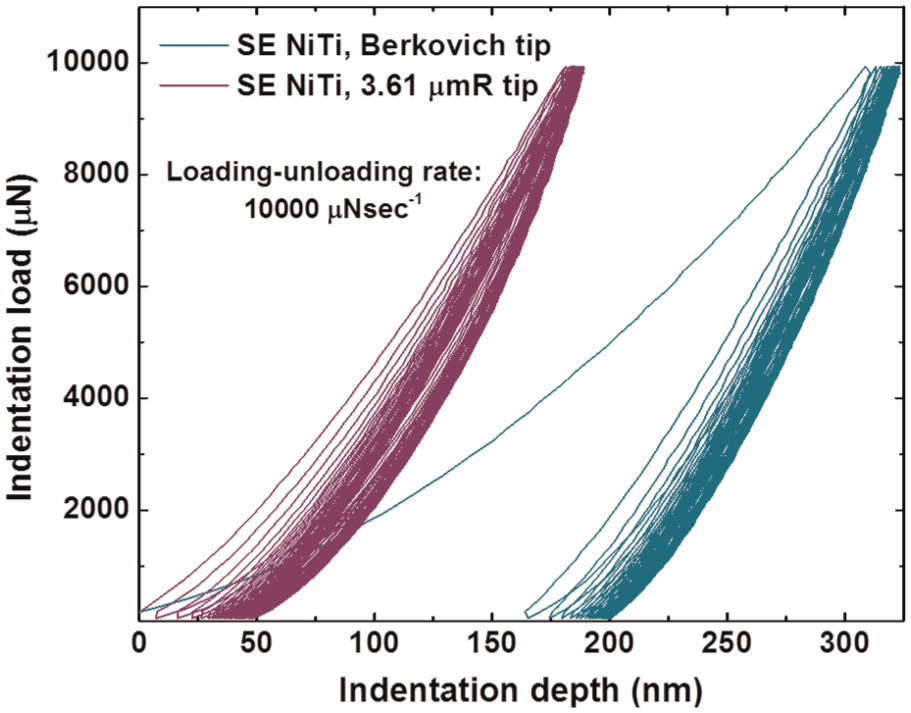
Cyclic nanoindentation curves using a 10,000 μN s−1 loading–unloading rate for NiTi SMA using Berkovich and 3.61 μmR tips.
Figure 6 illustrates the dissipated energy change for the cyclic indentation curves in Figure 5. For comparison, the corresponding hysteresis energy data for similar tips in Figure 4 at a set-up rate of 2000 μN s−1 are also reported in grey colour in Figure 6. Similar to Figure 4, the hysteresis energy in the sharp indentation drops suddenly after the first cycle until the energy settles at a significantly lower magnitude in the second cycle compared with the one from the spherical indentation. For the 20–30 cycle range, the hysteresis energy is not stable, rather it experiences an internal wavy fluctuation and follows an overall linear trend with a higher slope of 49.26 pJ/cycle for the spherical cyclic indentation compared with a magnitude of 26.39 pJ/cycle for the sharp indentation as presented in Figure 6. Referring to Figure 4 for NiTi SMA under a 3.61 μmR tip and 2000 μN s−1, the hysteresis energy in the 20th cycle and 30th cycle for spherical cyclic indentation are 82.5 and 71.8 pJ, respectively. In Figure 6, for NiTi SMA under a 3.61 μmR tip and 10,000 μN s−1, these values are much higher, attaining 100.5 pJ for the 20th cycle and 90.8 pJ for the 30th cycle. For the sharp cyclic indentation on NiTi SMA, at a lower rate they are 46.2 and 39.6 pJ, and at a higher rate they are 50.07 and 45.6 pJ for the 20th and 30th cycles, respectively. In short, the hysteresis energy of spherical indentation shows a larger value in the first cycle of the lower rate set-up, while for the sharp indentation the energy values of the lower rate are slightly higher than those of the higher rate set-up during the first 10 cycles. The hysteresis energies of two rate set-ups coincide in the 2nd and 10th cycles for spherical and sharp indentations, respectively. Afterwards, the dissipated energy of lower rate indentations continues with their lower magnitudes until the end of the 30th cycle for both tips. This phenomenon is more pronounced in spherical cyclic indentation.
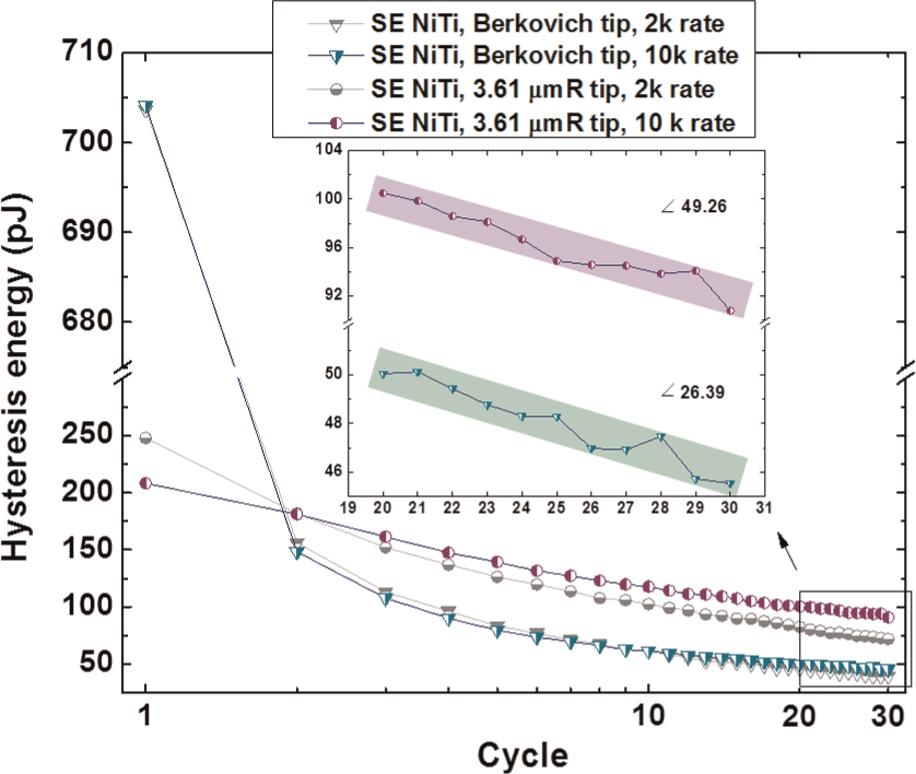
Hysteresis energy change per cycle of nanoindentation curves in Figure 5 for NiTi SMA using Berkovich and 3.61 μmR tips.
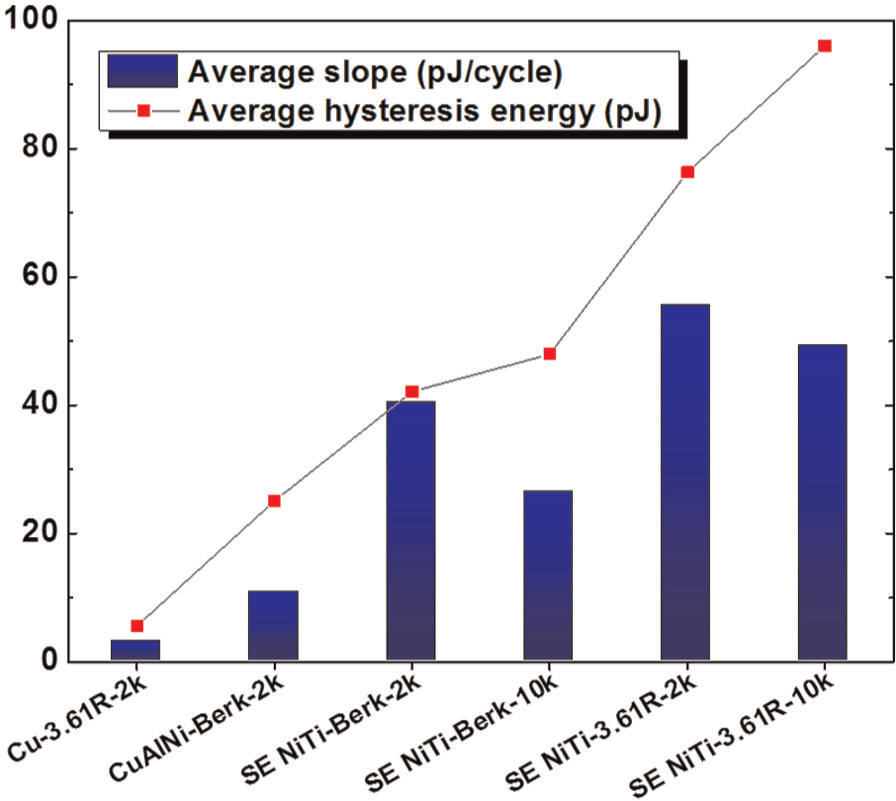
Figure 7 illustrates the average values of hysteresis energy and the average logarithmic slopes of their energy variation in Figures 4 and 6 for the cyclic range of 20–30 cycles. In general terms, as the average hysteresis energy increases so does the average slope. The smallest values for the average parameters belong to pure Cu and CuAlNi SMA, while the NiTi SMA using a 3.61 μmR tip gives the highest values. Furthermore, the average hysteresis energy of the sharp indentation possesses lower values compared with the energy for spherical indentations. It is also observed that the slope drops upon using a Berkovich tip for NiTi SMA. A drop in the average slope occurs when the loading–unloading rate is higher (10,000 μN s−1) although the average hysteresis energy remains high. For NiTi SMA, a higher rate in a cyclic indentation results in a higher hysteresis energy towards the end of the cyclic process in both spherical and sharp indentations. The logarithmic average slope shows that the hysteresis energy decreases faster in the case of spherical cyclic indentation. In summary, the rate set-up has a more significant influence on the spherical cyclic indentation than the sharp cyclic indentation.
Ultimate variations in hysteresis energy in SMAs
In order to explain the rationale for ultimate energy fluctuations, it should be noted that the SMAs were initially in the austenite phase and the martensite phase was induced by the applied compressive stress with the release of latent heat (see Figure 1). In a repetitive indentation process, the amount of released and conducted latent heat as well as the evolution of dislocation play important roles during the loading stage, while in the unloading stage a single cooling phenomenon governs the process during the reverse phase transition as the interface retreats (Amini et al., 2011a, 2013b). The amount of produced dislocation volume in the loading stage disturbs the conduction, the interface propagation and its retreatment. In contrast, the phase transition phenomenon reduces the probability of the dislocation evolution which is explained by the low amount of plastic deformation (Amini and Cheng, 2013). This is due to the nature of pseudoelastic phase transition which relaxes the stress at highly stressed spots. In the first cycle, the order of the hysteresis energy in Figure 4 relates mostly to the volume of plastic deformation originating from the dislocation evolution and it is higher when using a sharper tip or a tip with a smaller radius. The highest hysteresis area belongs to Cu which does not have a phase transition. The higher hysteresis energy of CuAlNi SMA is due to the higher dislocation volume as the effect of phase transition is lower compared with that of NiTi SMA observed in Figure 2.
From the second cycle, the dislocation evolution approaches quickly towards a saturation state. Therefore, the hysteresis energy suddenly drops and the hysteresis energy stabilises at higher levels for SMAs and spherical tips, and lower levels for sharp tips and Cu. This is particularly true for Cu with a deformation governed mostly by the dislocation evolution as the elastic energy is very small. This observation and its underlying physics also apply for NiTi SMA, which are shown in Figure 6 where the Berkovich tip creates a large dislocation volume during the initial cycles. This rationale is confirmed in Figure 4 as the hysteresis energy of the larger radius tip approaches the energy of the smaller tip due to the saturation in dislocations after the 10th cycle. Compared with the sudden saturation energy state of Cu after the first cycle, the saturation for NiTi SMA is postponed to the 10th cycle due to the presence of a phase transition volume. The continually decreasing trend of the hysteresis energy in the insets of Figures 4 and 6 confirms that the physics of the hysteresis change is no longer related to dislocation evolution solely. In fact, the stress relaxation in the indented bulk is achieved when the dislocation volume is created in the presence of solid-state phase transition. The phase transformed volume at the frontier ends and surrounding of each dislocation lessens both the stress concentration and the sudden evolution of dislocation volume. This fact postpones the saturation of dislocation volume and, therefore, delays the energy saturation. This is also evidenced by the decreasing order of slopes 55.54-NiTi/3.61 μmR, 40.39-NiTi/Berkovich and 10.72-CuAlNi/Berkovich compared with the gentle slope of 3.02-Cu/3.61 μmR. After the 10th cycle, while the energy of Cu is almost unchanged, the order of hysteresis energy in Figure 4 is mainly set by the thermomechanical phase transformed volume. Additionally, the internal variation in the hysteresis energy for SMAs is mainly controlled by the balance between resultant latent heat release and its transfer as it levels the phase transition stress shown in Figure 2.
During a cyclic process with a rate-dependent loading set-up (Amini et al., 2012a), as latent heat is released, the temperature of the bulk and the forward phase transition level increases. This reduces the amount of the phase transition volume and explains the overall declining trend of hysteresis energy in Figures 4 and 6. On the other hand, a higher rate set-up means less time for self-cooling of the bulk which is the sole controlling parameter in the unloading process. This increases the dissipated energy and verifies the higher value of hysteresis energy for the 10,000 μN s−1 set-up compared to the lower hysteresis energy for the 2000 μN s−1 set-up according to Figure 7. It is worth mentioning that during the loading stage with a higher rate set-up, the output latent heat energy from the transformed bulk might be lower due to the shorter heat conduction time. However, the contribution of loading rate in hysteresis energy change is weaker. This is because unlike the unloading stage both heating and cooling phenomena co-exist in the loading stage (Amini et al., 2013b). In Figure 6, a similar order of hysteresis energy, presented in Figure 4, is found for two rate set-ups during the sharp indentation; however, a large volume of dislocations created in the bulk weakens the effects of rate and heat exchange difference. Furthermore, it has been shown recently that larger volumes of dislocation are produced at higher loading rates (Ryu et al., 2013) which can be even larger by using a sharp tip. As a result of the above phenomena, the hysteresis energy between two rate set-ups experiences a larger difference for spherical indentation compared with a lower difference for sharp indentation as shown in Figure 7. The 2000 μN s−1 set-up has a higher hysteresis energy than the 10,000 μN s−1 set-up in both sharp and spherical indentations. Disturbing the phase transition propagation in the alloy’s crystals by higher volume dislocations in sharp indentation results in a lower magnitude of the average hysteresis energy in Figure 7 for the sharp indentation. This fact further explains the observed lower average energy variation (slope) in sharp indentation compared with the spherical indentation which is mainly involved in pure phase transitions with less dislocation evolution (Amini and Cheng, 2013).
Through increasing the temperature of the bulk and the resultant elevated phase transition stress, the induced stress by the constant indentation load (10,000 μN) failed to create a similar amount of phase-transformed volume in the bulk in the following cycle(s). This resulted in a drop in the amount of phase transformed volume and subsequent decrease in the temperature which provided a reachable phase transition stress for the subsequent loading. As a result, a balance between the increase (or decrease) at the phase transition stress level during the cyclic loadings created internal energy fluctuations with local minima (or maxima) of dissipated energy shown in Figures 4 and 6, respectively. The sharper fluctuations from the sharp indentation originated from the presence of a larger volume of dislocations and a smoother energy variation for the spherical indentation is rooted in a smooth propagation of interface in the bulk with a lower dislocation volume.
Thermomechanical SMAs with a simple mechanism have been introduced as one of the best candidates for energy storage systems and implants. Among other benefits, the above results can systematically determine the behaviour of these advanced materials at extremely small scale, useful for new-generation batteries and nano-bio-technology.
Conclusion
In this study, hysteresis variation during the sharp and spherical cyclic nanoindentations on two SMAs and one traditional material with no phase transition was studied. The decline in hysteresis energy in spherical cyclic indentation was almost linear; however, the sharp cyclic indentation showed a nonlinear decline. The trends for both tips ended in a linear decrease with subsequent internal fluctuations. The created dislocations during the first indentation disturbed the phase transition resulting in less ratcheting hysteresis energy for the sharp tip compared with that of the spherical tip. Less self-cooling of an indented bulk during the unloading stage for the higher rate set-up of cyclic indentation brought the dissipated energy to a higher level compared with the lower rate set-up. The loading with a higher rate increased the hysteresis energy but decreased its rate change. As the plastic and dislocation volumes are higher in the sharp indentation disturbing the phase transformation and latent heat conduction, the rate set-up did not show any significant effect. The balance between the latent heat release and the influence of the increase in local temperature on the phase transition stress forms the wavy internal fluctuation of hysteresis energy towards the end of the cycles.
The presented results can benefit both materialists and nanotechnologists. A fundamental approach towards the nano- and pico-scale variation in hysteresis energy can push the boundary of the science of modern SMAs and, on the other hand, a ready-to-go knowledge and application can be obtained for the behaviour and design of heavy-duty sensors, actuators, dampers and anti-wear surfaces, made of thermomechanical SMAs, under repetitive nanoscale compressive loadings.
Footnotes
Acknowledgements
The authors would like to thank Associate Professor Mohammad Elahinia from the University of Toledo for his comments on this article, and Dr. Richard Wuhrer from UWS-AMCF for his great discussion on the XRD results. The authors are also very grateful for the kind support received from Dr. Richard Treloar.
Declaration of Conflicting Interests
The author(s) declared no potential conflicts of interest with respect to the research, authorship and/or publication of this article.
Funding
The author(s) disclosed receipt of the following financial support for the research, authorship, and/or publication of this article: The South University of Science and Technology of China is greatly acknowledged for providing a partial financial support for this study.