
Abstract
This work focuses on structural health monitoring aspects of composite adhesively bonded repairs, evaluating their performance with guided ultrasonic waves. These repairs have shown remarkable potential in addressing repairability demands in new composite aircraft. More specifically, the behavior of a scarf repair under axial tensile loading was monitored with guided ultrasonic waves. The signal post-processing techniques focused on the extraction of the appropriate features, on the application of the pattern recognition and dimension reduction algorithms and on their subsequent correlation with the damage. A principal component analysis was employed that operated as a benchmark for the proposal of a more advanced data reduction method, the nonlinear principal component analysis. Appropriate damage indices were extracted and the results were correlated with images taken through a digital image correlation technique. The correlation of the extracted features with the early stage damage was performed and conclusions about the recovered strength through the scarf repair were deduced. The study focused on the selection of appropriate signal features and on their subsequent investigation through an outlier analysis. The limits of the applied outlier analysis were interpreted through principal component analysis and optimized through the concept of principal curves as derived through the nonlinear principal component analysis.
Keywords
Introduction
The concept of adhesively bonded patch repairs was introduced to the aerospace industry in order to deal with the issue of ageing aerostructures and the repair demands in new age aircraft made of advanced polymer-based composite materials (Avram, 2001). The repair and maintenance requirements for ageing metallic aircraft increase as damage is mainly caused due to fatigue and corrosion. In addition the new composite aircraft (Airbus 380, Boeing 787) aim to create a whole new era where the maximized stiffness-to-weight ratio and the fuel efficiency are the key requirements. Composite structures can develop damage mainly due to low velocity impact. In this case, damage can remain invisible and undetected, while its propagation can be catastrophic under certain loading conditions (Baker et al., 2003).
There are a variety of adhesively bonded repairs that are available depending on the severity of the damage. However, the most widely used types of repairs are the external patch scarf repairs and external patch repairs which can be considered as a temporary (emergency) repair until a permanent one can be carried out, and requires the prior removal of the damage. Scarf patch repair technology is preferable when severe damage needs to be repaired and when the key requirements are the maintenance of the surface smoothness and of the aerodynamic properties of the repaired structure. In the work of Soutis and Hu (1997) it is stated that scarf repairs are also preferred when the component that has to be repaired is relatively thick, since a scarf does not add an excessive out-of-mold line thickness, as external patches do, and it also offers higher peel and shear strengths. Furthermore, scarf repairs are more flexible when different shapes have to be considered in order to match the geometry that has to be repaired. Caminero et al. (2013) performed a full structural analysis of external and scarf repairs, through on-line monitoring with digital image correlation (DIC), guided waves and finite element analysis which highlighted the potential of the application for repair and early damage detection. Problems such as the debonding of the patch under loading or the propagation of the damage under the patch have been previously investigated by other researchers (Hosseini-Toudeshky and Mohammadi, 2009; Umamaheswar and Singh, 1999).
The concept of adhesively bonded repairs has been proposed and tested for its structural and design advantages by many researchers before. However, very little effort has been made towards the investigation of the damage prognostic potential that would emerge from a structural health monitoring (SHM) strategy. This would potentially enable the development of an approach that will accurately detect the onset and propagation of damage in complex systems such as the tested system.
In situ monitoring
It is expected that the design of an in situ monitoring system of the repaired region will help towards the certification of the technique by the Civil Aviation Authorities (Baker et al., 2003). Recent interest has been focused on the continuous life cycle health monitoring of the repaired site which will ensure the reliability of the repair and will avoid any unexpected failure (Koh et al., 1999). The key point that makes such health monitoring systems necessary is the increase in portability which will eliminate any restrictions like the removal of certain parts for analysis or the downtime of the aircraft. Baker highlighted the importance of a smart patch to perform on-line SHM which will be necessary to get industrial approval for the wide application of patches as a repair method (Baker, 1999).
SHM has shown considerable progress over the years with promising applications in the aerospace, marine, automotive and civil industries. SHM is referred to as the process of implementing a damage identification strategy to aerospace, civil and mechanical infrastructure (Farrar and Worden, 2007). More generally, SHM systems have the ability to monitor the tested structures in a continuous and in situ mode, to detect and interpret adverse changes and attribute those changes to critical damage. A robust SHM system can provide life-cycle health monitoring in order to avoid extended periods of inspections, reduce maintenance costs and avoid unexpected catastrophic failures. There are many categories in SHM testing which can be implemented on-line, among which perhaps the most common are vibration-based and wave propagation methods. This work focuses on the latter and more specifically on guided ultrasonic waves. More detailed reviews can be found in the literature (Adams, 2007; Staszewski et al., 2004) and more recently (Giurgiutiu and Soutis, 2012).
Built-in structural diagnosis is a concept which has emerged relatively lately within the scope of SHM and which is one of the most promising approaches related to patch repair monitoring. SMART layers consist of a network of built-in sensors which can be inserted in the critical plies of the patch. These sensors can be piezoelectric sensor arrays, strain gages or optic fibers. Jones and Galea (2002) demonstrated the effectiveness of an optical fiber sensor array in monitoring crack growth and delamination under a bonded repair. In recent work by Soutis and Ihn (2009) two SMART layers with an embedded network of piezoelectric actuators/sensors were inserted into a boron/epoxy laminated patch at different ply locations to successfully monitor crack growth via Lamb wave excitation. A similar experimental set-up for SMART layer implementation in a composite repaired configuration which has been efficiently used for cure monitoring, bond evaluation and damage under fatigue detection is illustrated in Figure 1 (Qing et al., 2006).
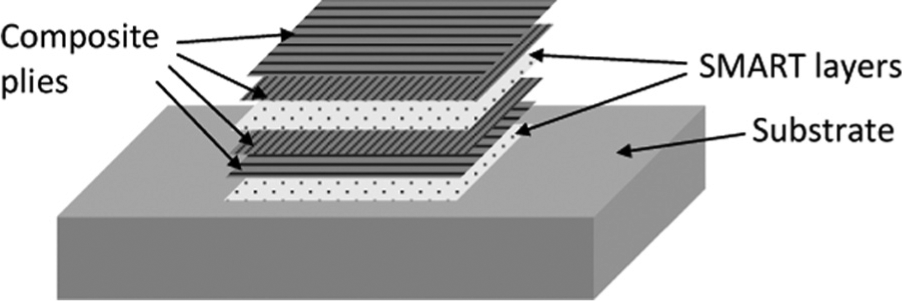
Implementation of built-in structural diagnosis concept in a repair patch.
The vast majority of these techniques utilize guided ultrasonic waves that propagate through a bounded medium where they can interact with the boundaries. These are usually generated with surface-bonded piezoelectric transducers which exploit the piezoelectric effect in order to convert electric energy into mechanical strains and vice versa. However, a number of other generation and detection methods have been employed in the past such as ultrasonic probes, piezoelectric wafers, laser-based ultrasonics, interdigital transducers (IDTs) and fiber optic sensors (Su and Ye, 2009). Extensive work has focused on several aspects related to Lamb wave damage monitoring techniques and parameters that can affect their accuracy (Willberg et al., 2013).
Data interpretation
There are a variety of methods for the interpretation of the received Lamb waves in a way that would enable a reliable and robust damage detection analysis. Three general categories can be defined, namely modeling of the wave propagation, physics-based analysis and data-driven analysis.
Modeling of the propagation of Lamb waves and the subsequent analysis of their interaction with defects in simple or complex structures has been adopted by many researchers in the past. There is a significant number of existing modeling techniques among which the most widely adopted is finite element analysis (Willberg et al., 2012). Modeling of Lamb wave propagation requires a significantly good understanding of the physical mechanisms that take place during the interaction of the waves with the boundaries of the structure and with the defects or thickness variation. For the purposes of the physics-based category, the fundamental characteristics of Lamb waves such as phase-group velocities and mode behavior are investigated and their propagation is studied with respect to the growth of damage. In addition, the time of flight (TOF) can be considered for simple configurations in order to identify the exact location of the developed damage and/or its size (Diamanti et al., 2005). The physics-based analysis is performed on experimental data and aims to assess damage through the physical interpretation of the developed changes in the received signals. These techniques usually establish a damage index, and interpret the structural integrity based on how this index varies. The distinctive characteristic of the aforementioned techniques is that they do not need a prior baseline reference. This is not the case for the data-driven approaches which mainly involve pattern recognition methods. A decision on the damage state can be given on the basis of a given feature vector. In these cases, a suitable vector is collected from an unfaulted condition and serves as a training set of data. An example includes a neural network that is trained to return the type and severity of the damage in a SHM system (Worden and Dulieu-Barton, 2004). This latter category is the focus of the current work.
The current article is structured in the following way: the pattern recognition and dimensional reduction methods that were utilized in the current study are first discussed, namely the outlier analysis (OA) in multivariate data, linear principal component analysis (PCA) and nonlinear principal component analysis (NLPCA) including a short section that explains the implemented algorithm with a demonstration example. Finally, the experimental set-up and the main results are explained followed by some concluding remarks.
Pattern recognition and dimensional reduction
Outlier analysis (OA)
OA is a pattern recognition technique which can in general be defined as the process of statistical determination of the class of a set of data. This is an approach that applies to the general novelty detection tools and deals with two general classes: “normal” or “damaged”. Being an unsupervised learning method, it only requires data from the normal condition and not from all damage classes, enabling the implementation of a fast and reliable algorithm that performs a first assessment of the structural integrity of the tested system and provides a visually friendly result that can be easily interpreted. This tool is applicable to systems that involve both univariate (consisting of one variable or else consisting of a single scalar component) and multivariate (consisting of more than one variable at each sampling point) data, although the current analysis will focus only on multivariate.
The method detects outliers among a set of given data; as an outlier, one would define any value that comes from the recorded data and which seems to follow different behavior than the rest. As a result it is assumed that it reflects the value that makes the monitored system deviate from the normal condition. It is important to say that this deviation might refer to any possible parameter that could affect the recorded signals including damage, environmental and coupling conditions among others. The current work focused on experimental conditions where any potential effect other than the damage (such as temperature variation or mounting conditions) was kept constant. The deviation is estimated on the basis that the normal condition data follow a Gaussian distribution.
OA has been investigated by some researchers for damage detection applications. Worden et al. (2000a) have performed damage detection using OA on four engineering case studies with successful results, although assumptions such as the normal condition set following a Gaussian distribution are highlighted. Worden et al. (2000b) performed novelty detection analysis on two composite plates using OA, an auto-associative neural network and kernel density estimation to detect delamination (ply separation) with Lamb waves. OA proved to be the fastest technique, however, the assumption that the normal condition data follow a Gaussian distribution is not present in the other methods. Finally, Pavlopoulou et al. (2012a) performed OA in order to detect crack propagation and the debonding of an external patch in an aluminum repaired structure, with significant success. However the Mahalanobis squared distance exhibited a slight drop in cases where damage kept increasing, a complication which will be further examined in this work. This nonmonotonic behavior was further explained in this work through the investigation of the phase shift of the time signals with respect to loading. To support this study, two additional signal processing methods were applied that better explain the reasons for this behavior.
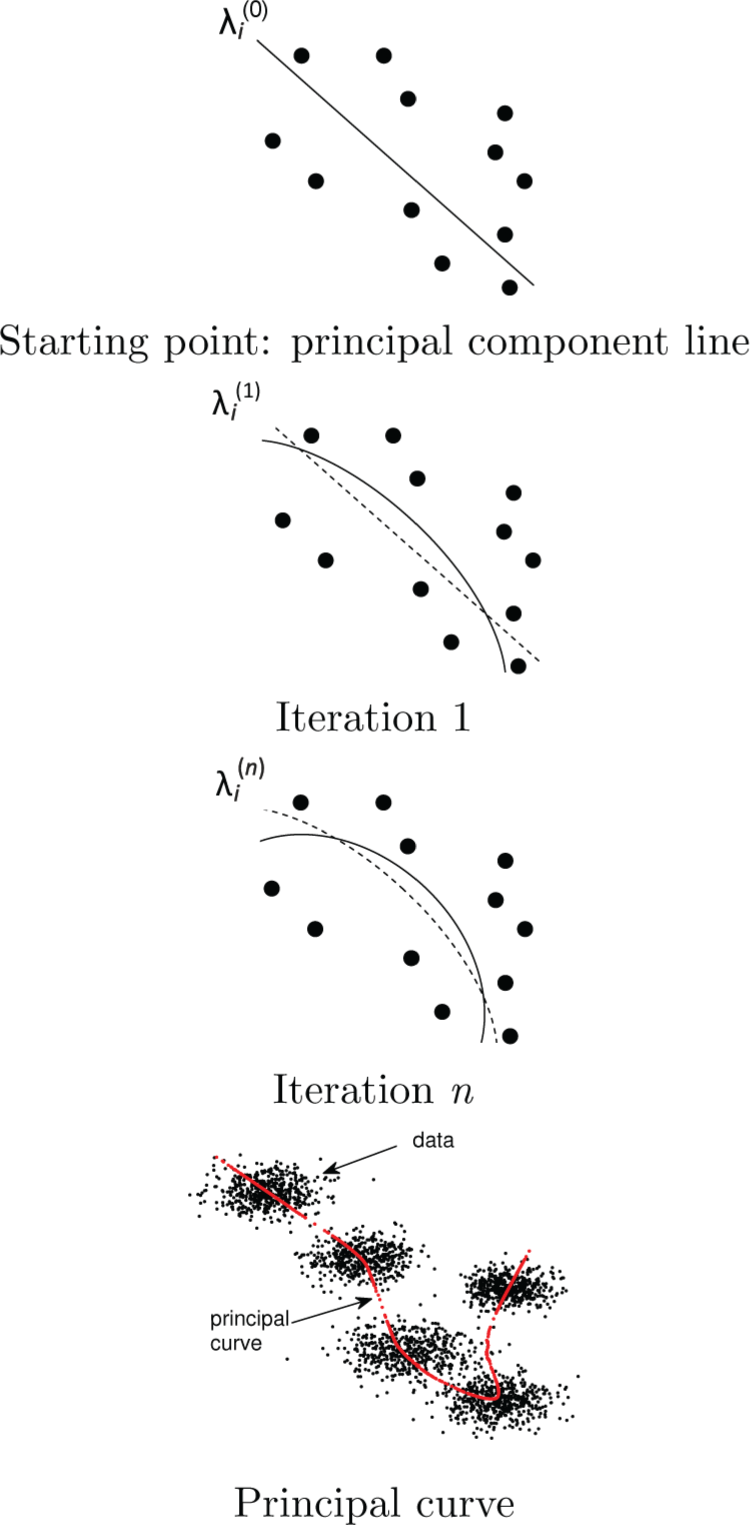
The discordancy value in the case of multivariate data is called the Mahalanobis squared distance and it can be estimated by the following equation
where
Linear principal component analysis (PCA)
In the case of multivariate sets of data, it is often essential to represent the required information in a reduced-dimensional space for the purposes of easier interpretation using PCA. This technique projects the data into a lower-dimensional space (e.g. a new set of axes) through orthogonal linear transformations in such a way that each new variable is a linear combination of the original variables. The values of the new variables are estimated on the basis of coordinates of each projected observation on each orthogonal axis. The resulting axes are called principal components and the new variables are called principal component scores. Every new variable that is estimated after the transformation accounts for a certain percentage of the total variance of the data. Therefore, the first new variable accounts for the maximum variance in the data, the second new variable accounts for the maximum variance that has not been accounted for by the first variable, and the pth new variable accounts for the variance that has not been accounted for by the p − 1 variables. The resulting variables are uncorrelated with each other. For the purpose of the current work, the concept of PCA was further developed for nonlinear cases, and therefore the standard PCA is referred here as linear PCA. In the current work PCA was estimated through the application of singular value decomposition (SVD).
PCA has been used as a tool for damage detection purposes in the past since it can provide information about the separation between the clusters of each data set and it enables understanding of their behavior with respect to damage growth. Chetwynd et al. (2008) identified optimal Lamb wave propagation paths for detection of damage that was introduced in a curved aluminum plate in the form of drilled holes and saw cuts. The investigation was performed through the post-processing of the signals with OA after the application of PCA to ensure the appropriate selection of the tested features. Yan et al. (2005) used a PCA-based approach in order to discriminate between damage and environmental effects for vibration features in a bridge model. In the present work, PCA has only been used as a tool for setting the basis for understanding damage detection problems and for further development of more advanced damage prognosis tools.
Although a number of techniques have been used for the damage detection of structures with Lamb waves, limited work has focused on the monitoring of complex structures where multiple boundaries can complicate the physics of the wave propagation (e.g. repair patches). It is therefore suggested that a data-driven approach would more reliably give quick results regarding the structural performance of complex structures under loading. The current work focuses on pattern recognition (novelty detection) algorithms which have shown some considerable progress, but not previously in the context of monitoring composite repairs. OA was successfully applied for damage detection, which accurately identified the initiation and propagation of damage for the tested configuration, being consistent with the DIC results. The effect of noise was tested which showed that OA can detect damage even in extremely noisy environments (SNR = 19). However, in the work by Pavlopoulou et al. (2012a) OA exhibited a nonmonotonic behavior with the increasing damage which has been further studied and explained in the current work. For that purpose PCA was employed as a well-established technique, through which the drop in the Mahalanobis squared distance was explored even though the damage propagated. The results showed that this phenomenon was attributed to the extreme deviation of the monitored system from the baseline reference which was pictured in the two-dimensional space captured from PCA.
Non linear principal component analysis (NLPCA)
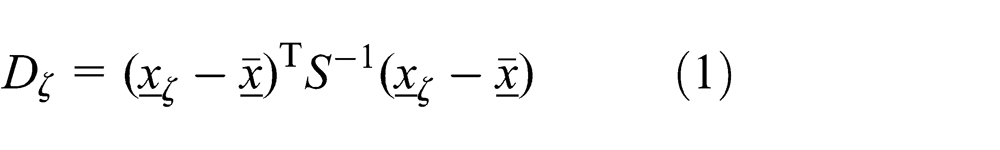
PCA only extracts linear relationships in order to project the data on the principal components. In simple words, this means that the sets of the analyzed data are projected into lines. This limitation led to the establishment of a more generalized concept, namely NLPCA as demonstrated by Pavlopoulou (2013). This approach extracts both linear and nonlinear relationships, such as higher-order statistics, and enables the projection of the data into curves or surfaces instead of lines or planes in such a manner that the lengths of the orthogonal projections from the data points to the curve are minimized. Figure 2 graphically illustrates the basic difference between the two methods.
Schematic illustration of the data projection nature for the (a) linear PCA and (b) NLPCA (arc length λ).
NLPCA can further reduce the dimensions in an accurate way for damage detection problems where high-dimensional sets of data are acquired. However, until now it has not been systematically exploited for SHM applications. Among the very few cases, Worden (2002) performed NLPCA on Lamb waves obtained from a composite plate exposed to temperature variation in order to achieve data compression. The work demonstrated that the NLPCA scores exhibited monotonic behavior with respect to the increasing temperature hence making Lamb waves a temperature sensor. Hsu and Loh (2010) performed NLPCA using an auto-associative neural network in order to extract the environmental factors and estimated the damage extent by carrying out modal analysis on a road bridge subject to varying environmental conditions.
Implementation and demonstration of the algorithm
Several algorithms have been proposed for the estimation of the principal curves but that proposed by Hastie and Stuetzle (1989) is the one that was implemented in this work. This algorithm starts with a prior line which is usually the first principal component. For the current study, a FORTRAN program was used, which can be briefly summarized in the two steps below (Worden, 2002).
Each curve is parametrized by its arc length λ as shown in Figure 2(b). The arc length is translated as the scores which are the coordinates of the projections of the data into the new axis. There are two basic steps which alternate for each iteration until the mean orthogonal distance between the data points and the curve is minimized. This is achieved when the relative change in the mean distance between the iterations is below a threshold. The data points here are expressed as xi and the resulting curve after each iteration is expressed as fi. As span here one would define the number of points in the neighborhood of the respective λi. This is a user-defined parameter and its function is to control the smoothness of the curve.
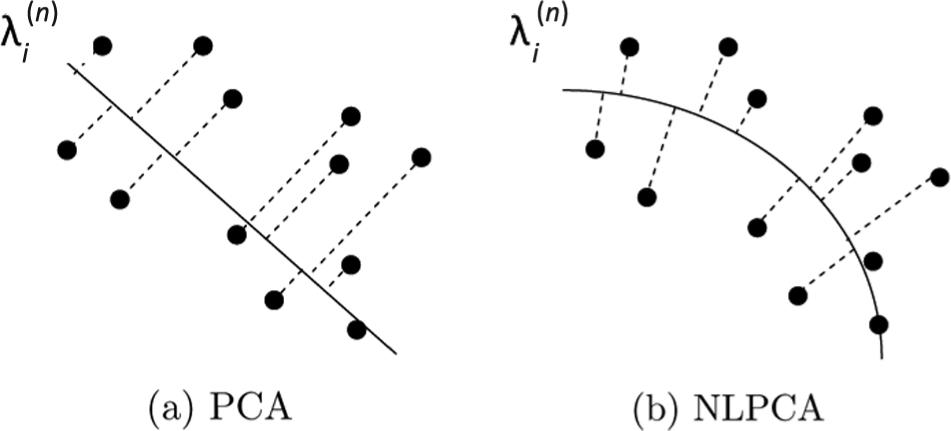
A schematic illustration of how the algorithm works is shown in Figure 3. The algorithm defines as a starting point the first linear principal component whose arc length is denoted here as λ(0). As illustrated, this line does not perfectly fit the data set, which can be evaluated through the estimation of the mean orthogonal distance between the points and the curve. This is clearly not the minimum possible.
Schematic illustration of the iterative nature of the algorithm and an example of a principal curve on a set of data.
The curve in the first iteration is a function of the obtained λ(0) from the previous step and the new λ(1) are estimated through the projection of the data to the new curve. This procedure is repeated for n iterations after which the curve has bent to the optimum shape. The successive bending of the starting line is achieved through the fact that the same data point is not projected into the same point of the curve at each iteration. Finally, an example is presented here, illustrating a principal curve fitted to a set of Gaussian distributions. The curve has bent to obtain the required shape for the given set of data.
The concept of NLPCA was utilized in order to extract the principal curves as a potential damage prognosis tool. These were further applied to the estimated clusters of the linear PCA. The proposed approach is based on the interpretation of the variation of the arc lengths of the curves with respect to the loads. The motivation of this proposal lay in the attempt to reduce the dimensionality of the multivariate data sets and depict the structural integrity of a complex system simply with a curve. This is considered to be a rather important step towards the reduction of the dimensions of what appears to be a complex multi-dimensional data set and can provide a one-dimensional representation of the data that accurately reflects the system condition. It is noted here that the principal curves could be applied to any other damage indices that show cluster-like behavior in order to explore their trend over the increasing damage. The most important reason why the principal curves extend PCA-based OA is that the Mahalanobis distance on linearly transformed (PCA) clusters is not monotonically increasing with damage extent and cannot therefore be used for prognosis; in contrast, the arc length along the principal curve is manifestly monotonically increasing and can therefore be used.
Experimental set-up of a repaired composite plate
The repaired plate was made out of woven carbon fiber (HTA) with toughened epoxy resin system (M21) supplied by Hexcel Composites and molded by Hurel-Hispano UK at a 58% fiber volume fraction. The panel’s total thickness was 2.8 mm and its lay-up was [0/90/±45/0/90]3T. After the manufacturing of the panel, an impact test was performed and the damaged area was removed. The impact height was 0.5 m and produced an impact velocity of 3 m/s (Found and Lamb, 2004). Then the surface was properly processed and the scarf repair was implemented following the Boeing 767 structural repair manual (Boeing, 2011). The scarf repair was made out of an aerospace qualified material and it was accomplished at the composite shop facility of Icelandair Technical Services (ITS) at Keflavik Airport, Iceland. The same panel has been used for previous work on DIC investigation and as a preliminary study on damage detection capabilities with Lamb waves (Caminero et al., 2013; Pavlopoulou et al., 2012b). The damaged and the repaired plates are illustrated in Figure 4. The panel was mounted in a SCHENK hydraulic testing machine and was loaded in quasi-static tension.
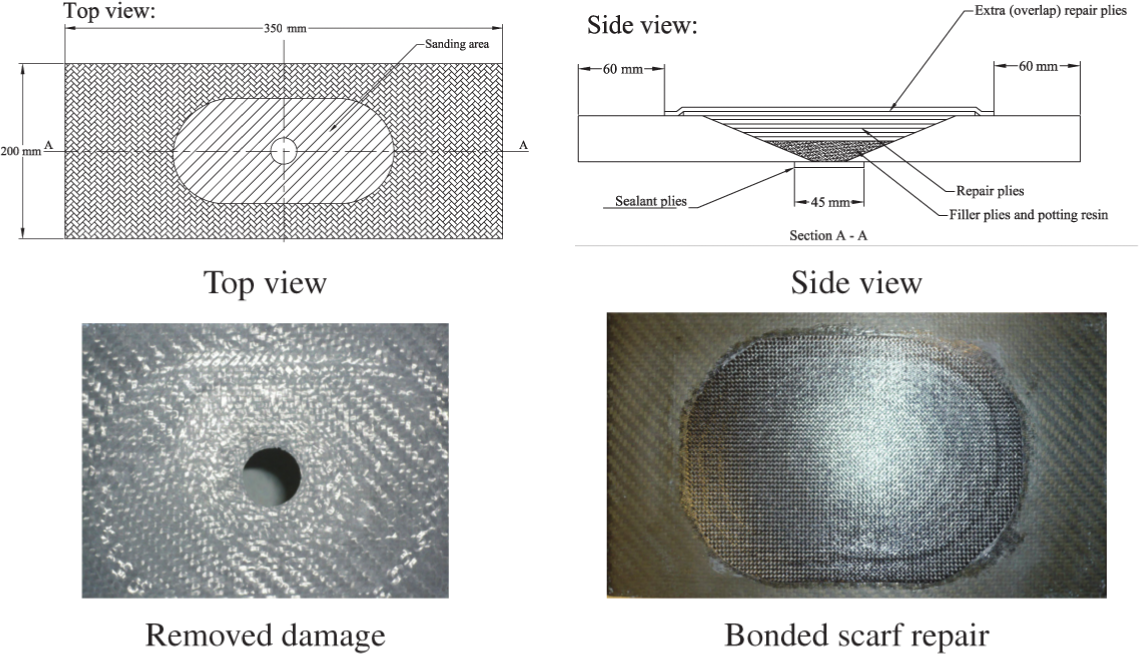
Illustration of the damaged plate and the implemented scarf repair (Caminero et al., 2013).
Two techniques were employed for the monitoring of the panel during the tensile testing, DIC and Lamb wave testing. DIC was used in order to provide full-field strain measurements from the surface of the tested panel during loading, which were further correlated with the results obtained from Lamb waves (Figure 5).
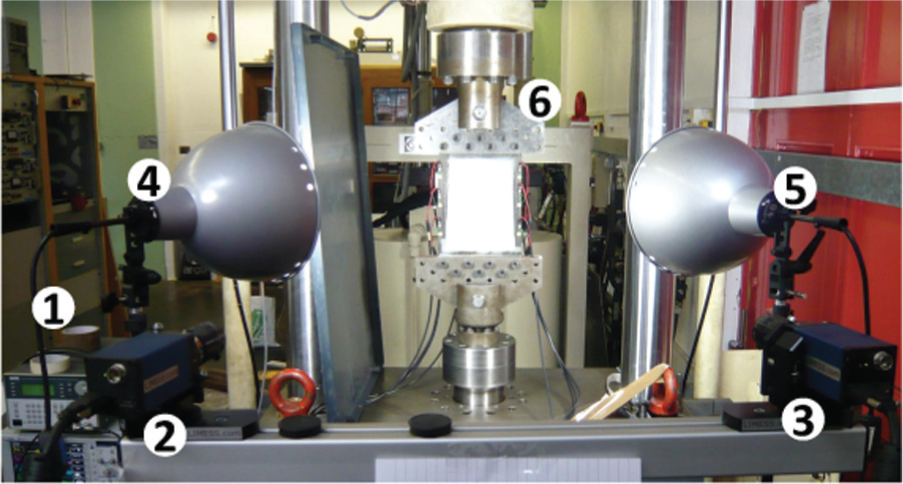
Experimental set-up: 1) Lamb wave testing equipment; 2), 3) DIC digital cameras; 4), 5) lights; 6) scarf patch repair mounted on the testing machine.
The panel surface was cleaned with acetone, a speckle pattern was applied on the surface of interest and two cameras were calibrated in order to take images during the DIC testing. The images used in the analysis were obtained by two digital cameras with a CCD matrix of more than five million pixels, model DCP 5.0 of LIMESS Messtechnik & Software GmbH. Schneider-Kreuznach Xenoplan 2.8/50 mm lenses were mounted in the cameras and they were positioned symmetrically about the specimen in order to keep the magnification level consistent.
In addition, eight Piezoelectric transducer (PZTs) of thickness 1 mm and diameter 10 mm supplied by CeramTec AG were surface-bonded with instant glue on the repaired plate as shown in Figure 6. Four of these transducers operated as actuators (1, 2, 3, 4) and the rest operated as receivers (A, B, C, D) functioning in a pitch–catch mode, forming 16 wave propagation paths in total and covering all critical areas. The excitation signal was a 10 V peak-to-peak amplitude, five-cycle sine pulse modulated by a Hanning window and the excitation frequency was 225 kHz. The excitation frequency was selected in such a way as to provide maximum response signal power for all of the propagation paths. To ensure the maximum response was achieved, a number of frequencies were tried between 10 Hz and 300 kHz and the amplitudes of the corresponding wave packages were monitored. At the selected frequency, the amplitude of the first two wave packages was the maximum. At that frequency both S and A Lamb wave modes are expected to propagate through the tested panel. This was considered to be sufficient for the data-driven approach demonstrated in this work. The wave generator that was used was a TTi TGA 1230 30 MHz model and the data acquisition was performed by a LeCroy LT224 oscilloscope at a 50 MHz sampling rate. DIC images and Lamb waves were recorded at approximate load intervals of 10 to 20 kN until the final failure of the panel. The test was performed throughout one day so the laboratory environmental conditions were considered to be constant. The specimen was illuminated by ordinary white light during the experiment. All signals were recorded under loaded conditions, namely no unloading took place during signal recording. This was decided in an attempt to keep any microdamage in the form of resin cracking or delaminations open and maximize the resolutions of the damage monitoring system. Also, the DIC calibration would be lost after the specimen unloading. The effect of the developed surface strain on the piezoelectric transducers is considered to be negligible since the measured signals show a consistent agreement with the level of induced damage and not a linear variation with respect to the linear variation of the strain. However, the possible acoustoelastic effect on the recorded signals will be discussed later. Appropriate surface preparation prior to the bonding of the transducers along with the use of a relatively brittle glue which would not allow high deformations ensured a sufficient contact quality.
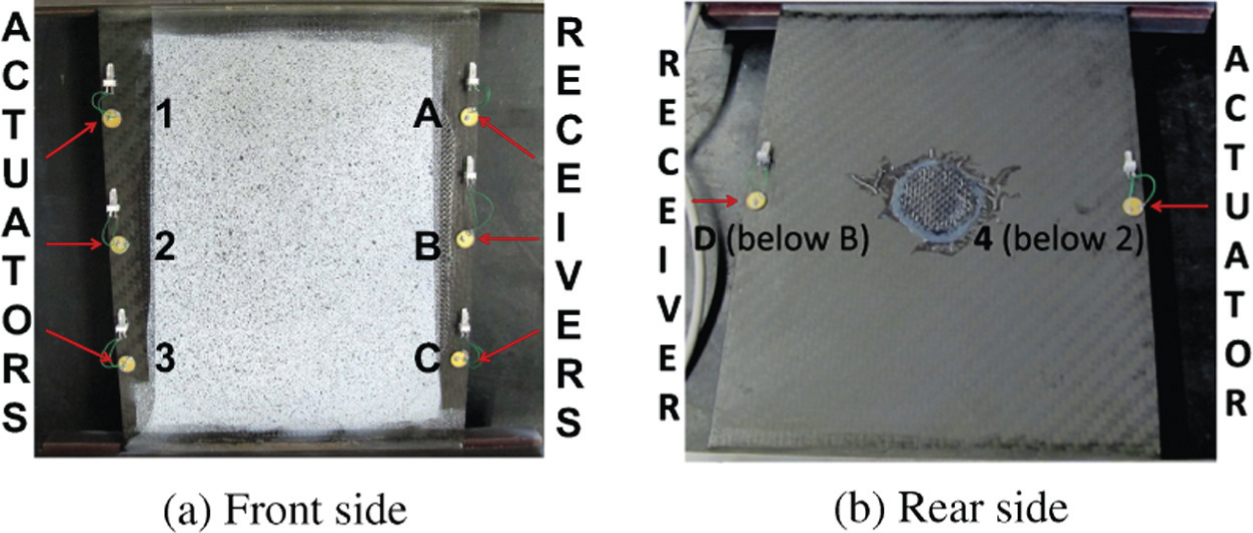
PZT arrangement for Lamb wave testing (1–4: actuators, A–D: receivers).
Lamb wave signals and DIC images were successfully recorded up to 170 kN which is close to the expected failure load. At this load, though, the panel failed earlier due to cracks that initiated around the holes that were drilled for gripping the specimen. This is a common complication in composite testing since composites exhibit relatively brittle behavior, and hence they cannot undergo plastic flow to relieve the local stresses that initiate around these holes. As a result manufacturing aspects such as specimen gripping and specimen design should follow appropriate specifications for successful testing under static or dynamic loads; the specimen end-tab should be of an appropriate size in relation to the gage length in order to achieve valid failures.
Results
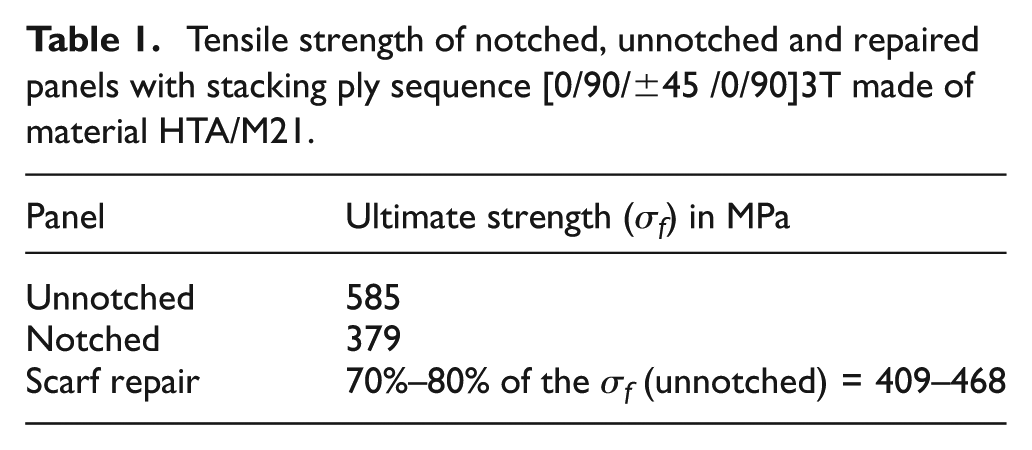
Tensile tests were performed on notched and unnotched specimens made of the same material as the repaired plate and with the same stacking ply sequence. The obtained results allowed a prediction of the ultimate strength of the repaired panel (Caminero et al., 2013). The size of the unnotched panel was 175 × 30 mm and the size of the notched panel was 175 × 50 mm while the hole diameter was 5 mm. Their stacking ply sequence was [0/90/±45 /0/90]3T and their total thickness was 2.8 mm. In Table 1, the tensile strength of the unnotched and the notched specimens is presented along with the estimated ultimate strength of the repaired plate. The latter was estimated based on the principle that the tensile strength of the scarf patch repair is expected to be 70% to 80% of the undamaged laminate strength. Therefore the tensile strength of the scarf repair is estimated to be approximately between 409 and 468 MPa. In addition there are several factors that can lead to lower strength such as the defects and other imperfections introduced during the manufacturing process. The DIC analysis of the repaired panel showed that the maximum stress that developed at 160 kN locally around the hole was 415 MPa, which is within the failure stress range of the repaired panel. This value was measured through the strain analysis of the DIC figures at an applied load of 160 kN. The current analysis concludes that it is possible that even though the load did not reach the ultimate strength of the scarf repair due to the premature grip failure, local internal damage is expected to develop. This assumption is well supported both by the DIC figures and the Lamb wave analysis as discussed later.
Tensile strength of notched, unnotched and repaired panels with stacking ply sequence [0/90/±45 /0/90]3T made of material HTA/M21.
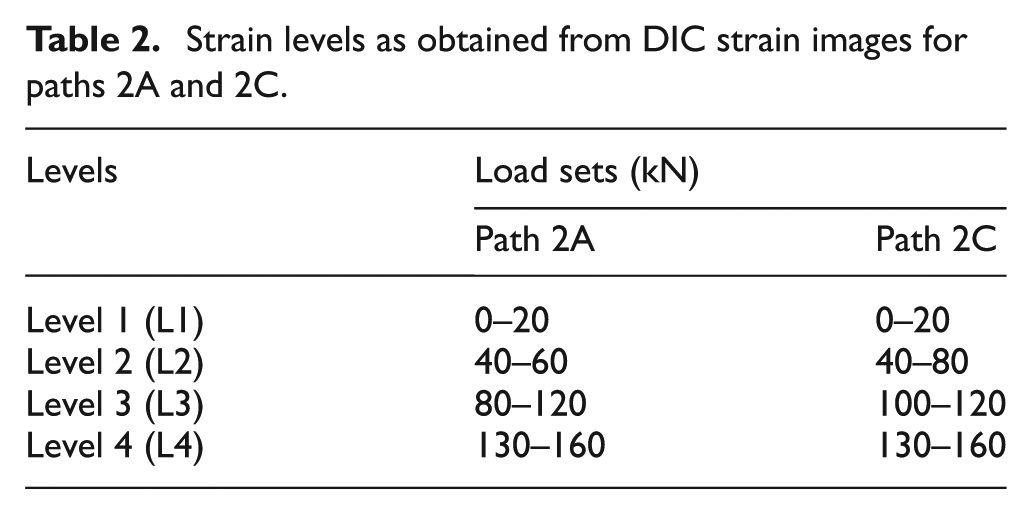
In Figure 7 the results obtained from the DIC analysis are illustrated for all applied load levels. These images were processed with Vic-3D software from Correlated Solutions, Inc. The subset size was selected large enough to ensure that a sufficiently distinctive pattern is contained in the area used for correlation. The surface strains that were obtained from the DIC analysis enabled the definition of four levels for the subsequent wave propagation paths of interest (Figure 6), each of which corresponded to groups of load levels that exhibited similar strain intensity. These levels are displayed in Table 2. Level 1 corresponds to normal and near normal condition (20 kN) where no substantial change has been introduced to the system (low applied strains). Level 2, which involves slightly different strain levels for the two paths, starts at 40 kN and is the stage at which the first noticeable change in the developed surface deformations can be observed from the DIC images. Level 3 starts at 80 kN for path 2A and at 100 kN for path 2C and it stops at 120 kN. At this stage DIC images show a more distinctive distribution of the strains depending on the most critical areas of the repaired panel: these are around the hole in the center of the panel and at the tips of the patch where debonding of the outer plies may initiate due to high interlaminar normal and shear stresses. The aforementioned levels were selected appropriately in order to reflect the measured strain as obtained from the DIC. The first level corresponded to 0% to 12% of the maximum strain, the second level for the two propagations paths corresponded to 12% to 31% and 12% to 37.5% of the maximum strain respectively, the third level corresponded to 31% to 75% of the maximum strain and finally the fourth level corresponded to 75% to 100% of the maximum strain.
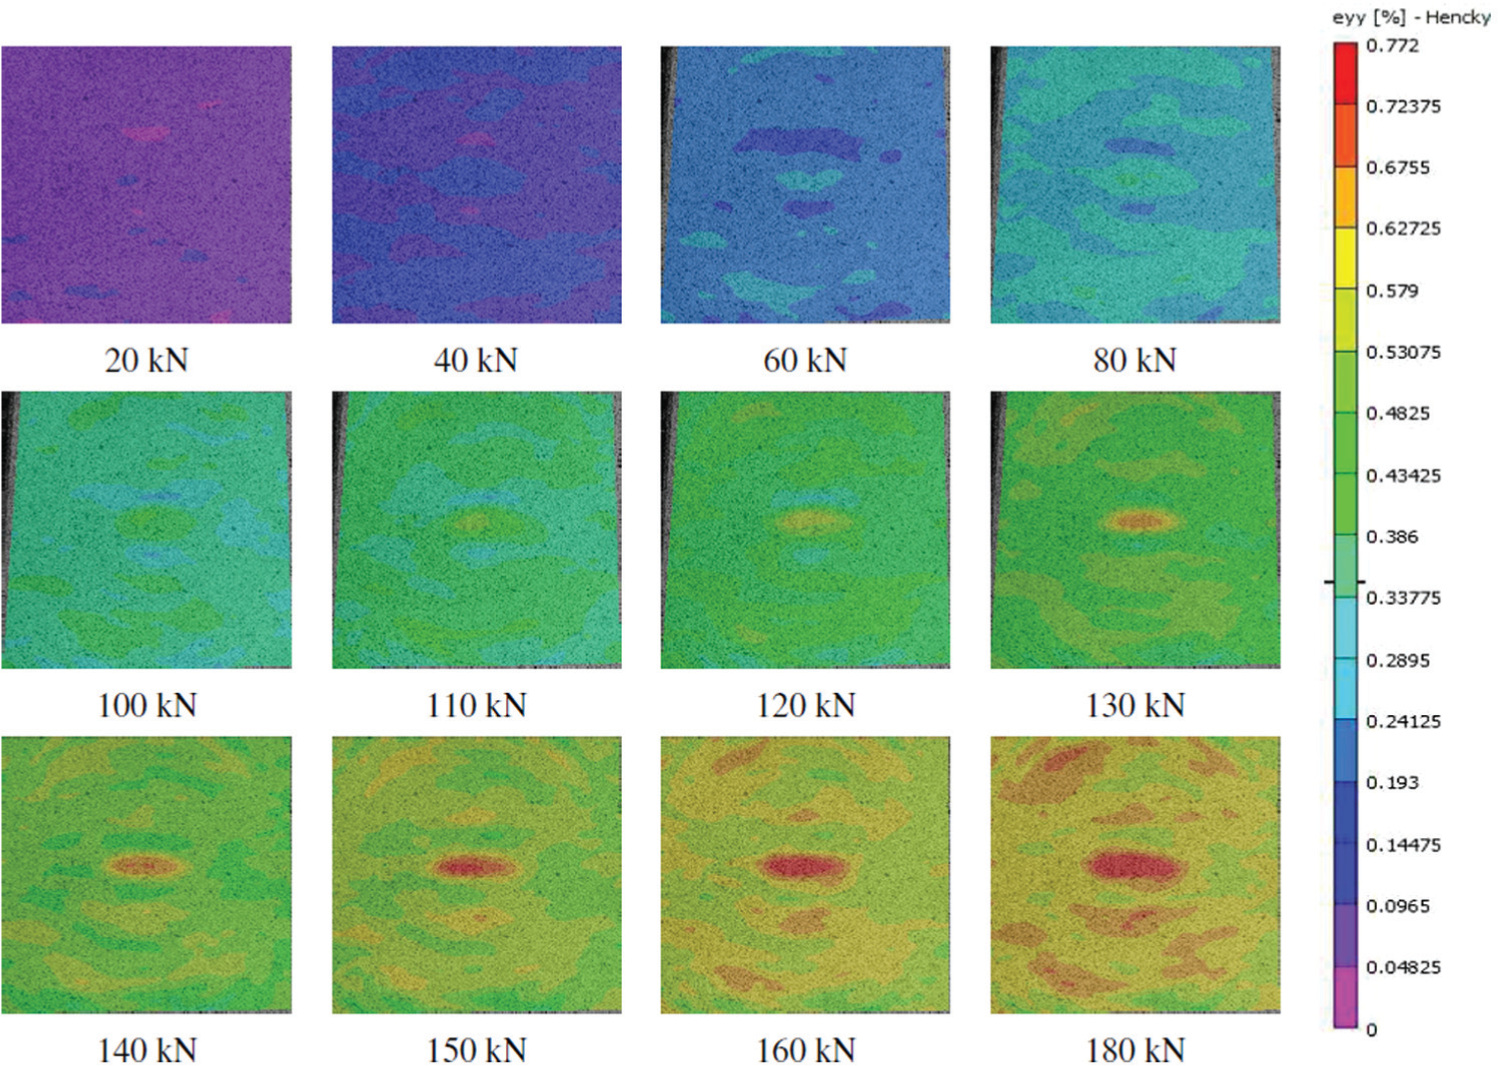
Two-dimensional digital image correlation strain maps (yy strains) (Caminero et al., 2013).
Strain levels as obtained from DIC strain images for paths 2A and 2C.
Feature selection and pre-processing
The focus of the current work in terms of pre-processing is based on the selection of appropriate features and their subsequent analysis for the reduction of the data dimensions and for their correlation with the internally developed damage. It is aimed to prove that the employed analysis techniques can provide a fast and easy interpretation of the structural integrity of the tested component with the fewest possible required dimensions. The current work only investigates these parameters on selected wave propagation paths due to size limitations. These paths are assumed to propagate through the most critical areas, covering the edges of the patch and the hole where damage was expected to be more severe even from the early stages of loading.
As a first step, all obtained signals were filtered with a lowpass filter in order to eliminate the noise. Then all signals were evaluated and the ones that were obtained from sensor 1 after 130 kN were discarded since their peak-to-peak amplitude dropped by such an unexpected extent that it was assumed that the sensor lost perfect contact with the tested panel. Moreover, some waveforms exhibited a slight DC offset which was removed. In Figure 8 the excitation signal and the time signals recorded for the unloaded condition and for the propagation paths of interest are illustrated. It is interesting to note that the arrival time of each signal varies according to the distance of the actuator from the respective sensor. At this frequency, only the first two fundamental modes (S0 and A0) are expected to propagate in thin plates made of standard Carbon fibre reinforced polymer (CFRP) materials. However, these wave packets cannot be attributed to specific modes, since a single and pure Lamb wave mode can generate a variety of other modes when it interacts with defects that can be introduced during manufacturing of the laminate or with the different boundaries between the repaired plate and the implemented scarf patch repair. Therefore the recording of a baseline reference which corresponded to the unloaded condition signal was essential in this case.
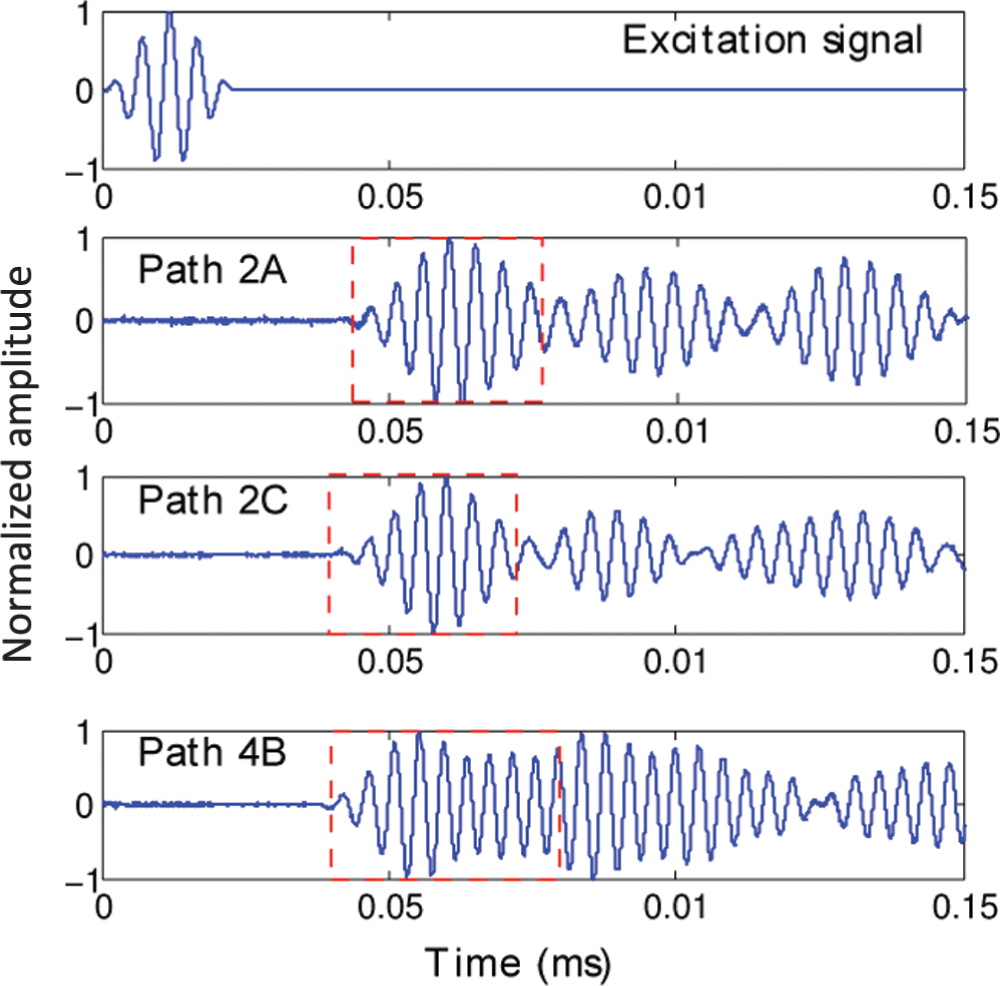
Response signals for paths 2A, 2C and 4B for the unloaded condition; dotted line boxes represent the selected features.
The recorded signals show a distinctive first wave package for most of the propagation paths (e.g. path 2A and path 2C). In these cases this package was selected as the feature for further analysis due to its immediate interaction with the developed damage and in an attempt to avoid the signal’s interference with the plate’s boundaries. In some other cases though, like in path 4B, the selection of the feature was not straightforward, due to the observed mixed wave packages. In this case, the selected feature was selected to be a bit bigger (2000 sampling points) than the previous ones in order to take into consideration the activity of the mixed wave packages and identify how this would affect the subsequent analysis. In an attempt to isolate the first interaction of the waveform with the monitored area (repaired area), the first wave package was isolated. The envelope of the waveform was applied and the first waveform was extracted from the rest as soon as the envelope reached a peak and dropped before it started increasing again. The selected features for paths 2A, 2C and 4B are illustrated in Figure 8. For further reduction of the dimensions, each feature was subsampled in order to finally get a 50-dimensional feature. This means that the total number of sampling points for each extracted feature was reduced to 50 by selecting them at even intervals along the waveform. The effect of this procedure on the final obtained features is illustrated in Figure 9. The dimensions are reduced without any considerable loss of information.
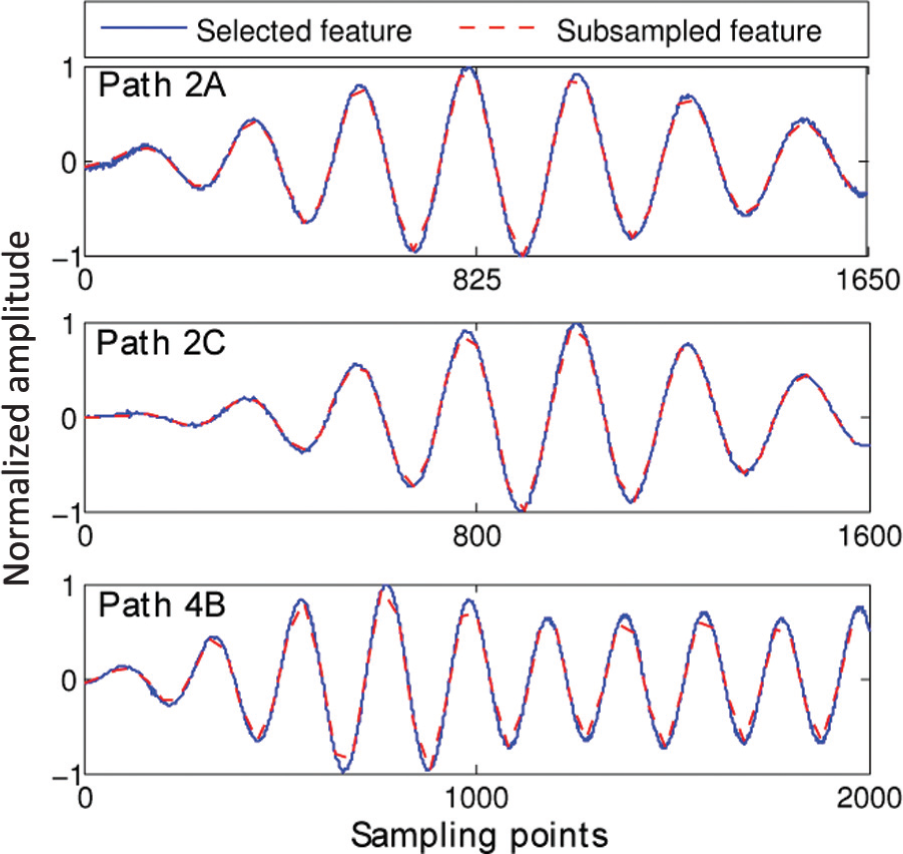
Response signals for paths 2A, 2C and 4B for the unloaded condition; selected features.
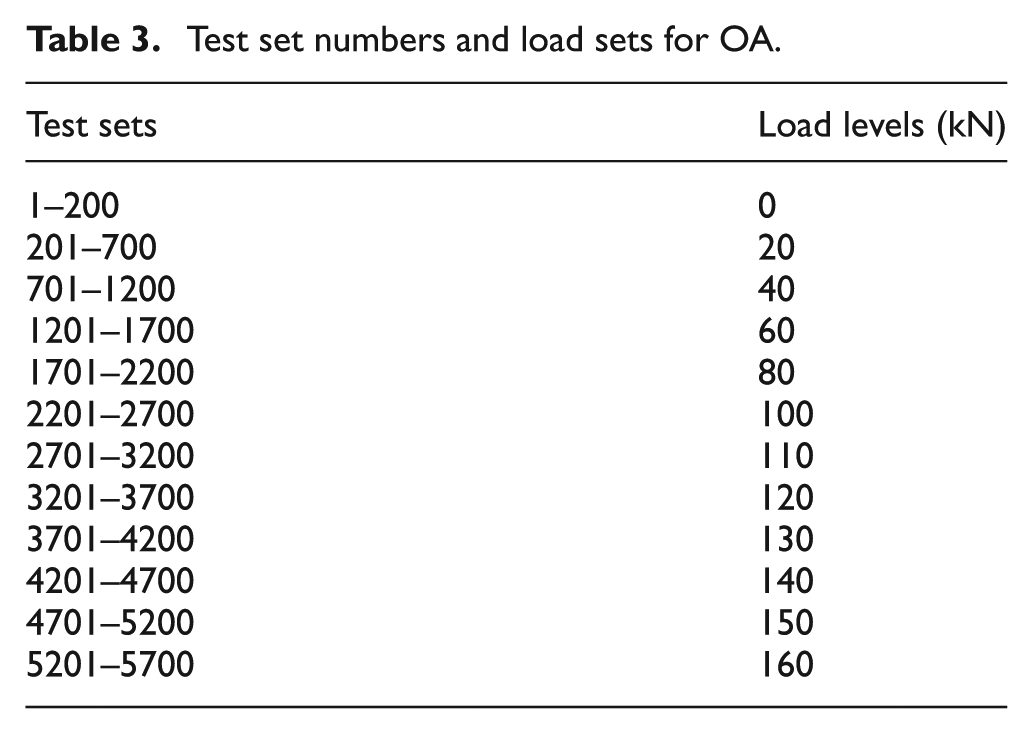
In order to construct a suitable mean vector and a covariance matrix for the normal condition, the selected features that served as the baseline reference (unloaded condition) were copied 1000 times and each copy was subsequently corrupted with different Gaussian noise of signal-to-noise ratio (SNR) equal to 30 with Matlab, as shown in Figure 10. This SNR is considered to be representative of experimental noise levels. Each testing data set was copied 500 times and corrupted with the same noise level. The total testing data set consisted of 6500 observations. It needs to be noted though that in real applications ideally a full set of signals needs to be recorded for a more efficient training of the employed algorithms. In Table 3 the test sets and the load levels they correspond to are summarized. These test sets are used to distinguish between each class in the following analysis.
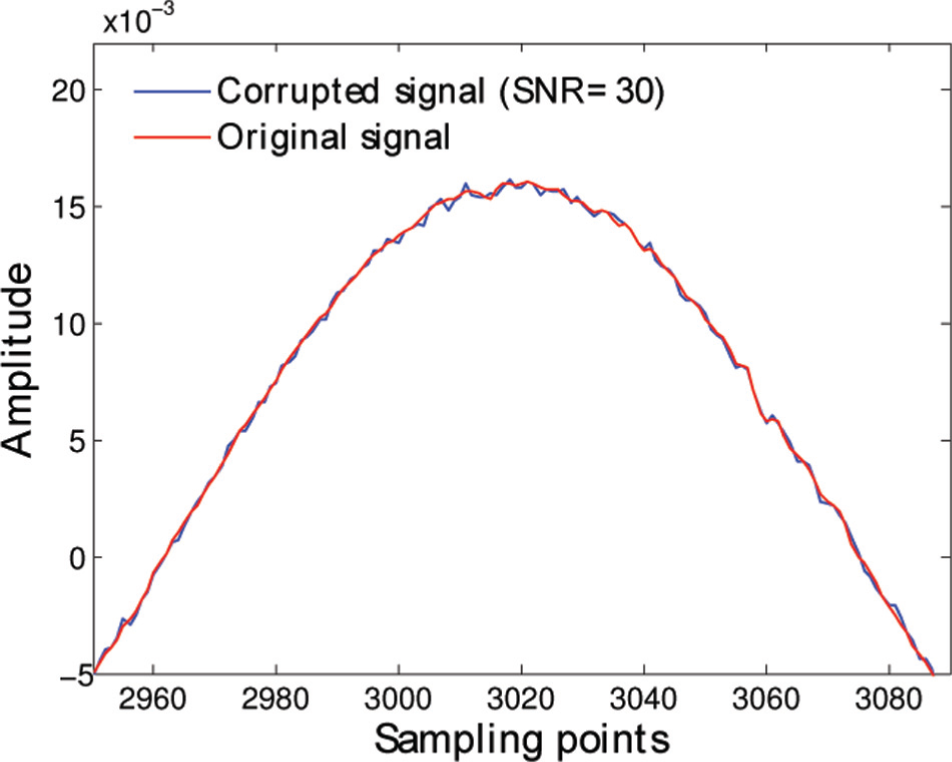
Illustration of the effect of the added noise on the original time signal (SNR = 30), path 2A, 0 kN.
Test set numbers and load sets for OA.
Damage classification through PCA and OA
After the pre-processing of the obtained signals, OA and PCA were performed in a comparative way in order to identify the agreement between the two methods and in order to explain the behavior of the OA classes based on the orientation of the respective clusters in a two-dimensional subspace. For the illustration of the PCA results, only the first two principal components were considered, since they accounted for the highest percentage of variance. For the purpose of the OA, the 1% exclusive threshold value for novelty for a 1000-observation, 50-dimensional problem was estimated after 1000 trials and was found to be approximately the same for all paths, namely 110. The first 800 observations of the unloaded condition were used as a training set in order to train the algorithm, and the remaining 200 observations were used as a validation set in order to evaluate how effectively the algorithm can identify the normal condition.
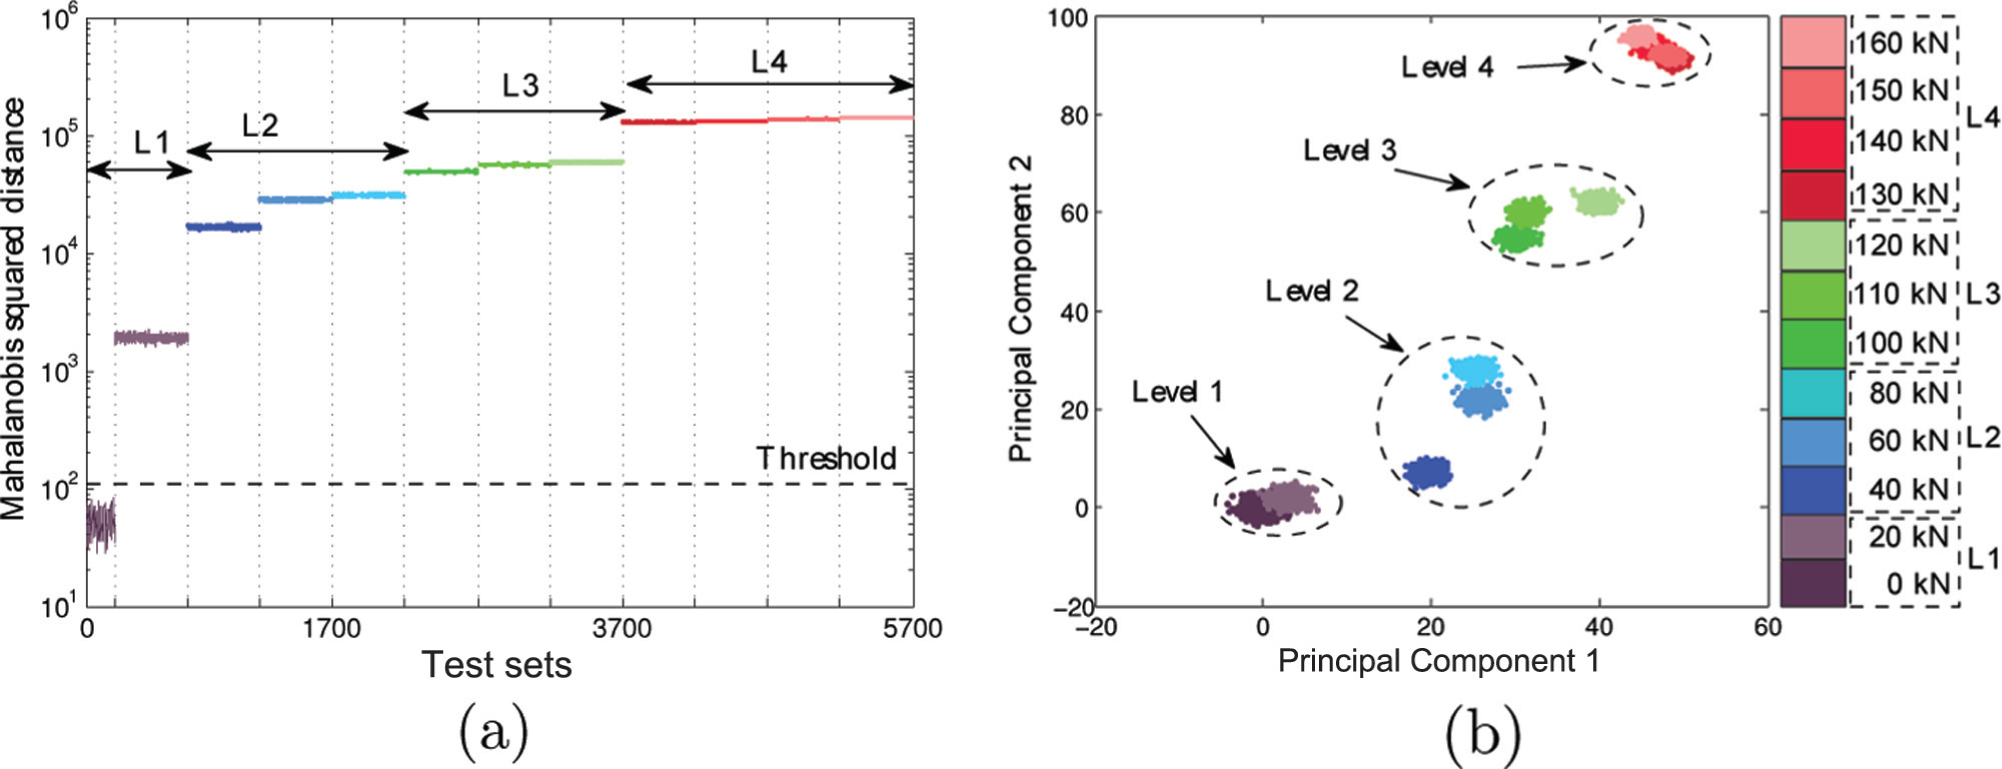
The results obtained from both processing methods for wave propagation path 2A are illustrated in Figure 11. All of the set that corresponds to the unloaded condition is successfully labeled as an “inlier”, positioned below the threshold which indicates that the training of the algorithm was accurate and that the observations obtained for the normal condition followed a Gaussian distribution as first assumed (Figure 11(a)). OA shows that as soon as damage started accumulating in the specimen, the sets are labeled as “outliers”, exhibiting a clear deviation from the normal condition while being flagged well above the assigned threshold. As load levels increase, the deviation level also increases, following a specific pattern which was further analyzed through PCA.
(a) OA and (b) PCA for path 2A.
The results obtained from PCA resulted in significantly distinctive clusters, whose position in the two-dimensional space changes with respect to the load level. This behavior proves that the application of the novelty detection analysis is well supported in this case. The resulting clusters can be visually further grouped into more precise categories as illustrated in Figure 11(b) with the circles and the same color notation. These categories agree with the assigned damage levels that are summarized in Table 2. In an attempt to comparatively assess the methods, one can observe that clusters that belong to the same level in PCA (L1–L4) exhibit equal values of Mahalanobis distance, an observation which highlights the agreement of the employed methods.
Figure 12 illustrates the same results for the second wave propagation path of interest, path 2C. The path exhibits the same behavior following an increasing deviation from the normal condition and from the threshold as loading increases, in a pattern that agrees with the orientation of the respective clusters in the two-dimensional space (Figure 12(a)). In a similar way, the PCA clusters are grouped into categories that agree with the assigned damage levels for the specific path (Figure 12(b)).
(a) OA and (b) PCA for path 2C.
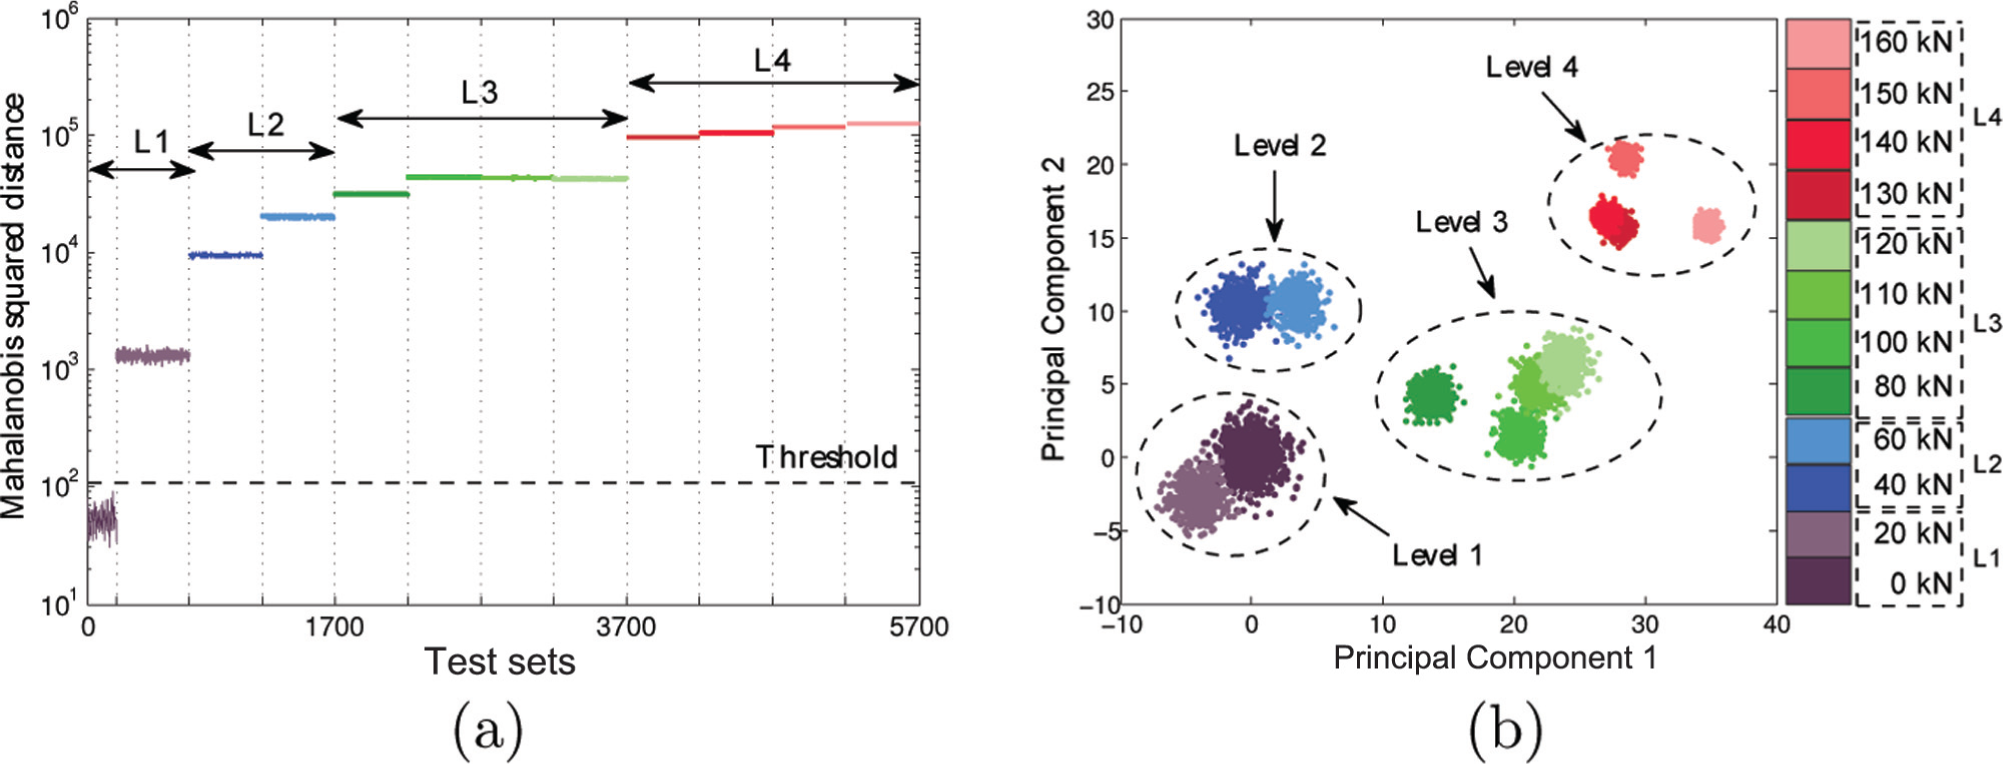
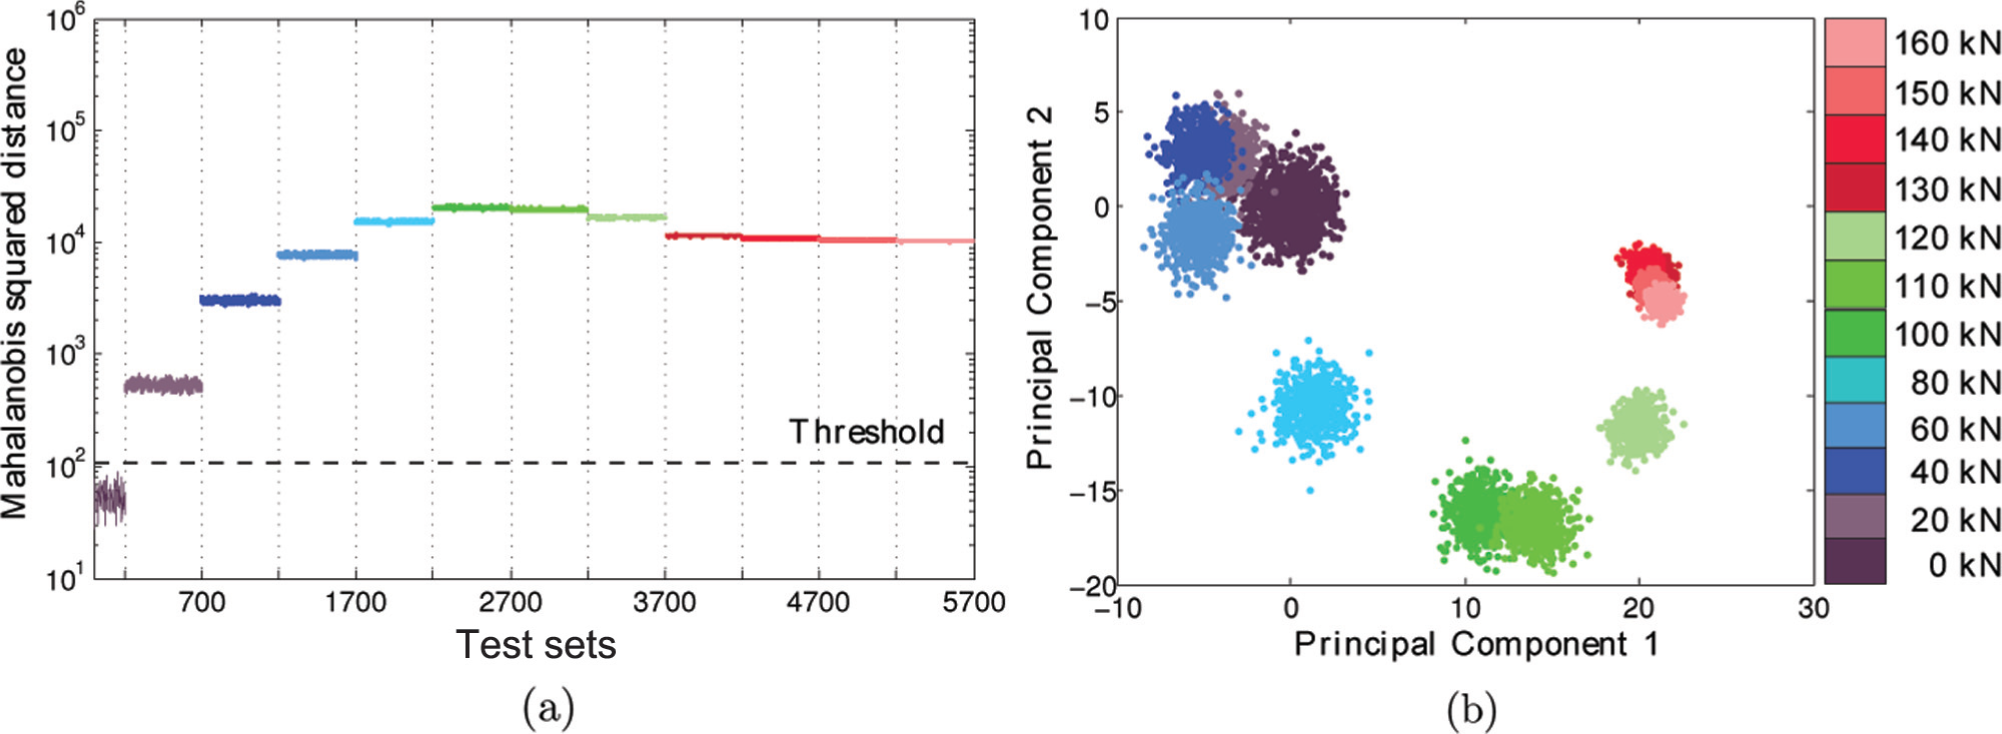
Figure 13 illustrates the OA as well as the PCA results for wave propagation path 4B. The reason why this path was selected among others is because it shows different behavior which was considered to be important to discuss. PCA exhibits very well-separated data clusters which correspond to the increasing load levels. However, after 120 kN the recorded data exhibit a significant deviation from the normal condition in such a manner that the clusters move closer to the cluster that corresponds to the normal condition (0 kN) as is illustrated in Figure 13(b). This phenomenon can also be observed in the OA results in Figure 13(a). Even though all the load sets are labeled as “outliers” exhibiting increasing deviation from 0 kN, the Mahalanobis squared distance after 120 kN drops to lower values than the previous loads but is still above the threshold. This is attributed to the significant deviation of the system to such an extent that the algorithm classifies these data as closer to the normal condition, as shown by the PCA results. This phenomenon could be a limitation in the application of OA in specific cases where significant damage scenarios might be labeled as “inliers”. However, in the specific study, the resulting indices were labeled well above the assigned threshold, hence successfully indicating damage (Figure 13(a)).
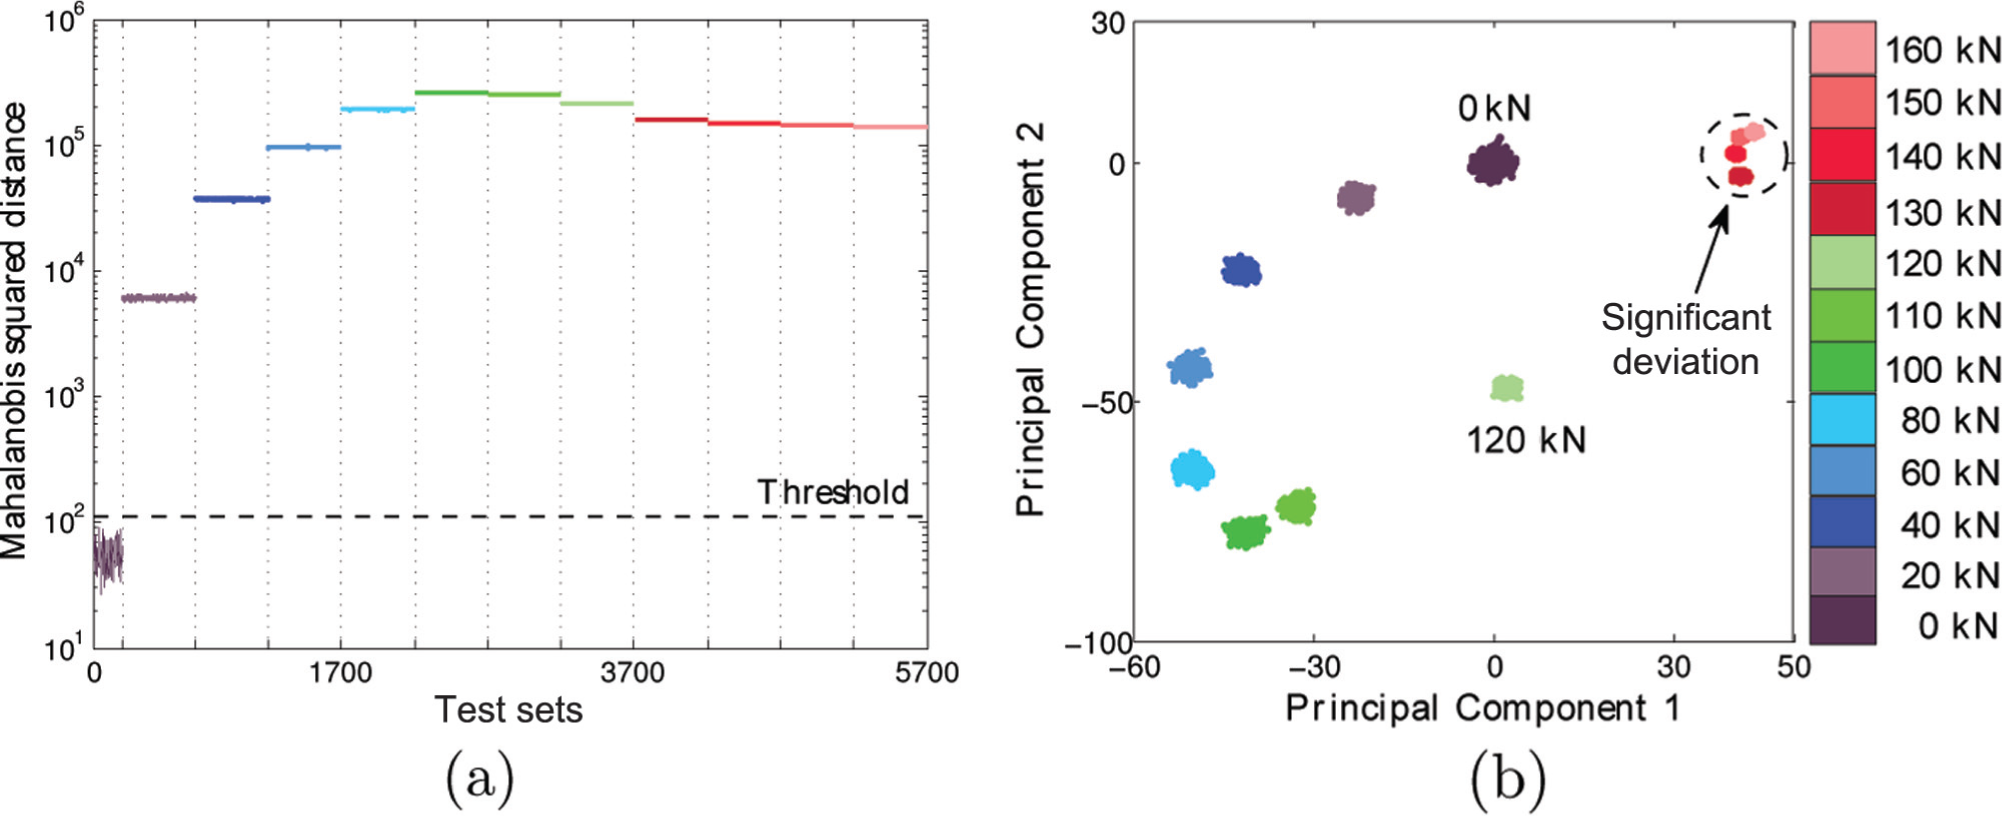
(a) OA and (b) PCA for path 4B.
The next step is the investigation of the sensitivity of the employed processing tool when compared with the results obtained from the DIC analysis for each path. The defined damage index in this case is expressed in equation (2), where MNI stands for “mean novelty index” and MSD stands for “Mahalanobis squared distance”
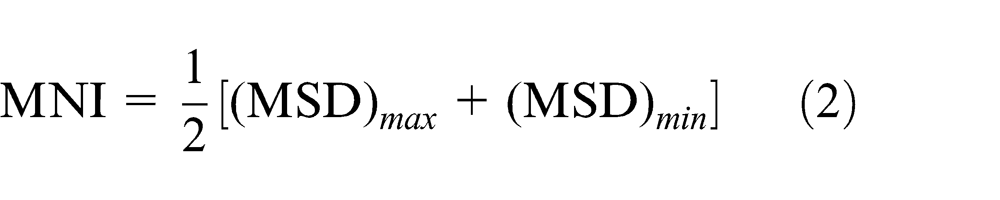
Therefore, here a representative value that is calculated through equation (2) is assigned for each path and for each corresponding load level and the results are plotted against the applied load.
The results are illustrated in Figure 14. The figure is divided into four plots, each of which corresponds to a different actuator and includes all sensors. The y-axis has the same scale for all four plots for comparison reasons, and the Monte Carlo threshold is defined for all plots to be equal to 110. The plot for actuator 1 involves fewer load levels, due to the debonding of the respective transducer after 130 kN as previously mentioned. The main damage mechanism that is investigated here is the common failure mode under which repair patches fail, which is first debonding of patch edges of the upper plies of the repair, followed by a propagation of the debonding towards the center of the repair until the plies can no longer carry the applied loads and the plate fails around the removed damaged area of the substrate. The main paths that represent these mechanisms in the current work are paths 2B, 4B, 2D and 4D which directly propagate through the removed damaged area (hole), paths 1A and 3C which propagate through the regions where the first ply debonding was expected to initiate, and paths 3B, 3D, 1B and 1D which propagate through the regions where the repair debonding would further propagate until it reached the hole. It needs to be mentioned at this point that in reality Lamb waves propagate through bounded media and as they interact with the different boundaries one cannot easily attribute a specific propagation path to a precise region of the tested system. However, in this case the selected feature is the first wave package which is the direct response the sensor receives before the wave meets any other boundaries or interphases. The results show that all paths that are associated with the patch debonding seem to have behavior similar to the paths that are associated with the damage initiating around the hole at the early stages of loading. This behavior changes as the load levels increase, and the paths that propagate through the hole (2B, 4B, 2D and 4D) exhibit higher damage indices than the rest of the paths, possibly indicating that the damage around the hole was becoming more intense.
Mean novelty index (MNI) for all wave propagation paths.
The effect of the change in the elastic wave speeds with stress is referred to as acoustoelastic effect (Gandhi et al., 2012). The effect of acoustoelasticity on the recorded signals needed to be considered in this study due to the fact that the plate was not unloaded during signal recording. In that case the DIC equipment would have to be recalibrated each time.
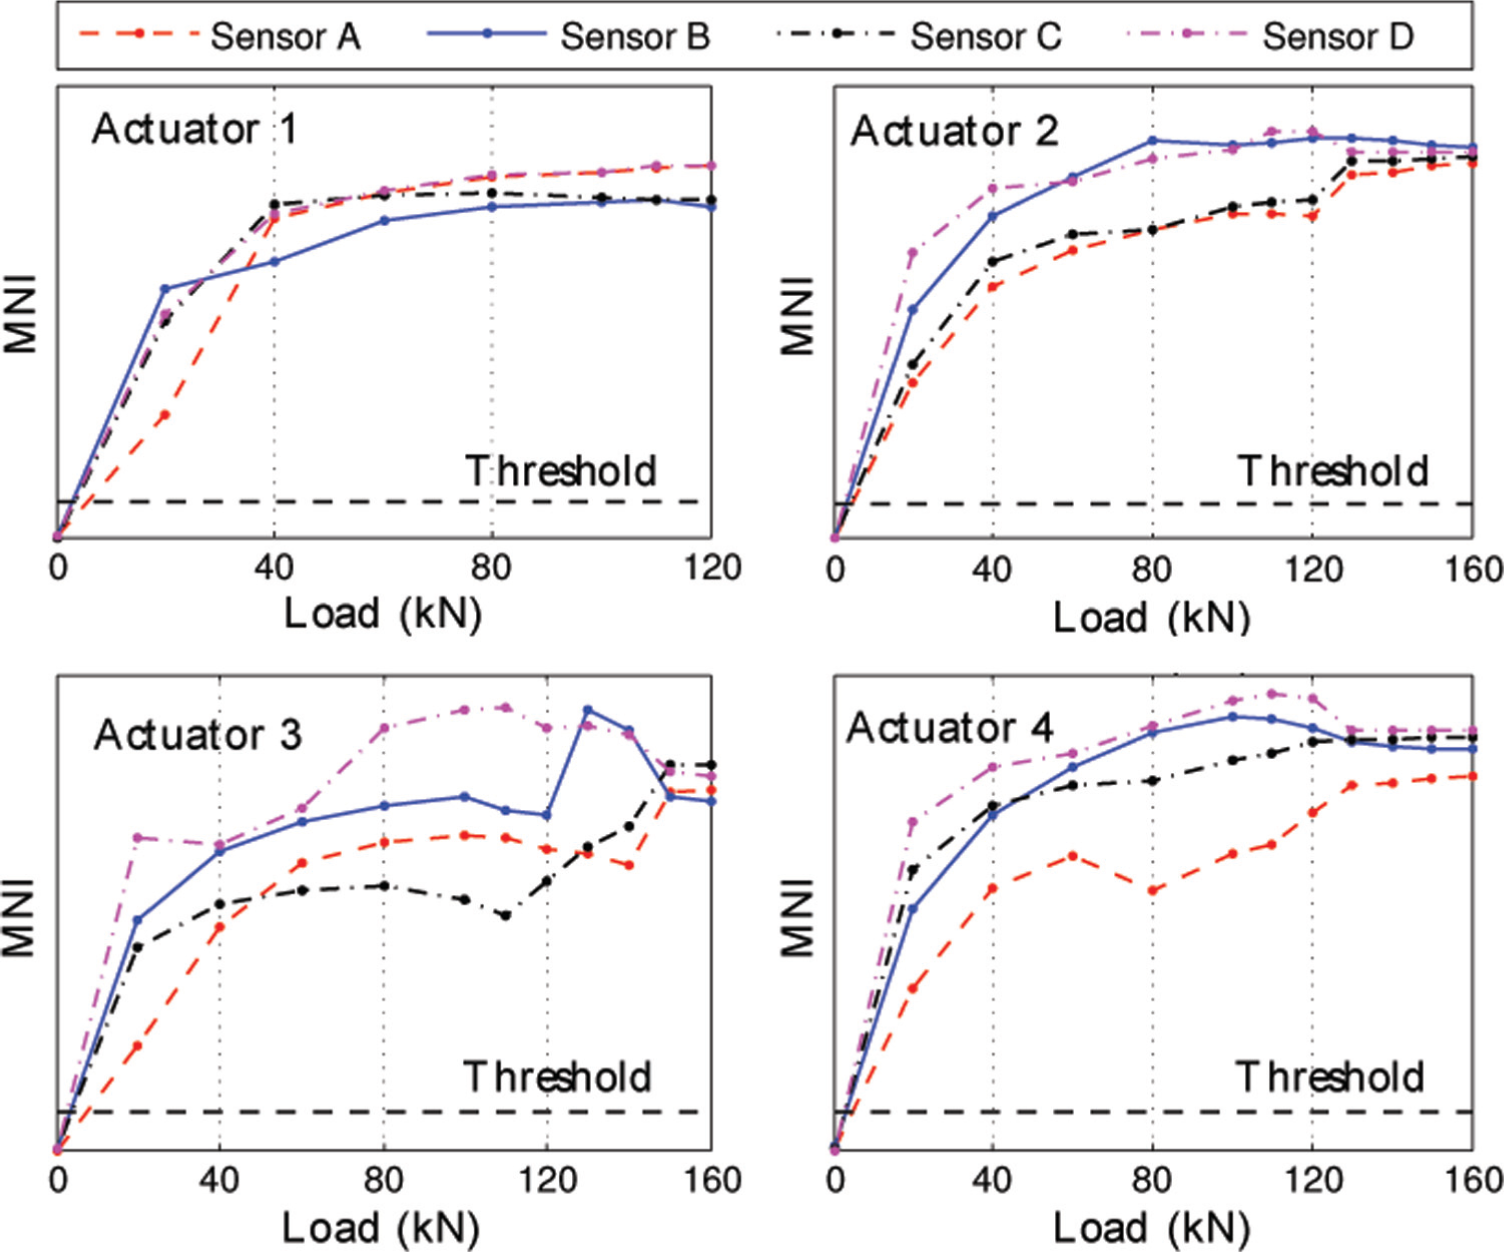
As previously investigated by Pavlopoulou et al. (2012a) there are certain cases where the introduced damage to the structure is considerable enough to cause a significant signal time shift. This was demonstrated through an OA on an aluminum repaired panel that was subjected to fatigue loading and which identified unexpected behavior which is discussed and explained in the current work. More specifically, the time shift could be of such an extent that it can make the signal recorded from a damaged state to shift out and then back into phase with the signal recorded from the undamaged state. This has an effect on the Mahalanobis squared distance and makes it drop since the deviation from the normal condition is perceived to be lower. An example is illustrated in Figure 15. The time signal recorded from path 2C for the normal condition (no damage) has been manually shifted six times starting from S1 and progressively increasing to S6, with each of the states representing a damage case scenario. The black dotted line indicates that the signals shift out and then back into phase with the undamaged signal. The OA results illustrate the expected outcome, that Mahalanobis squared distance reaches a peak at S3 and then drops as the time signals shift closer to the undamaged signal phase.
(a) Illustration of the pristine time signal (selected feature) of path 2C shifted six times in the time domain to represent progressively increasing damage (S1 to S6) until it comes back into phase with the pristine signal, (b) and its respective OA result.
The paths analytically investigated in the current work are the paths 2A, 2C and 4B. Paths 2A and 2C do not directly propagate through the damaged area as shown in Figure 6 in combination with the DIC result. This is not the case for path 4B which directly propagates through the repaired hole where damage initiated. OA results (Figures 11(a) and 12(a)) show that the Mahalanobis squared distance of paths 2A and 2C increases constantly with the test sets. However, the same results for path 4B (Figure 13(a)) show that Mahalanobis squared distance reaches a peak at around 100 kN and then starts consistently dropping. It is therefore suggested that path 4B substantially detects the damage with a contribution from the acoustoelastic effect and paths 2A and 2C detect only a minor part of the damage and largely show any acoustoelastic effect. It is argued here that the paths 2A and 2C provide a baseline for the phase shift expected from the acoustoelastic effect; this means that the much more significant phase shift shown in the outlier statistic for path 4B can be attributed to the growing damage.
Dimensions reduction through the fitting of principal curves
An investigation into further dimensional reduction of the post-processing analysis was performed through the application of NLPCA and the fitting of the principal curves. The principal curves were applied to the results of the previously analyzed PCA, namely the data clusters. The algorithm started with a prior line which was the first linear principal component and it bent in order to obtain the optimum shape successively following the implementation steps.
There were certain user-specified parameters in the applied algorithm such as the threshold for the relative change in the mean orthogonal distance which was defined to be 0.01. Also, the initial span was defined to be 0.6 times the number of points. The span was reduced by a factor of 5/6 per iteration. A brief convergence study showed that the optimum number of iterations was 10. The arc length was interpreted as the NLPCA score and it was plotted with respect to the increasing applied load.
Figure 16 exhibits the results after the application of the principal curves to the clusters that were previously obtained from the linear PCA for paths 2A and 2C. The curve is initially specified as the first linear principal component between the clusters and then bends until it fits the centroids of the illustrated data points. The curve starts from the normal/early stage damage (Level 1) and then connects the clusters that correspond to increasing loads until it stops at 160 kN which is identified as the last point. The curve represents the variation of the data clusters with only a one-dimensional curve, hence leading to a significant reduction in the dimensions of the data.
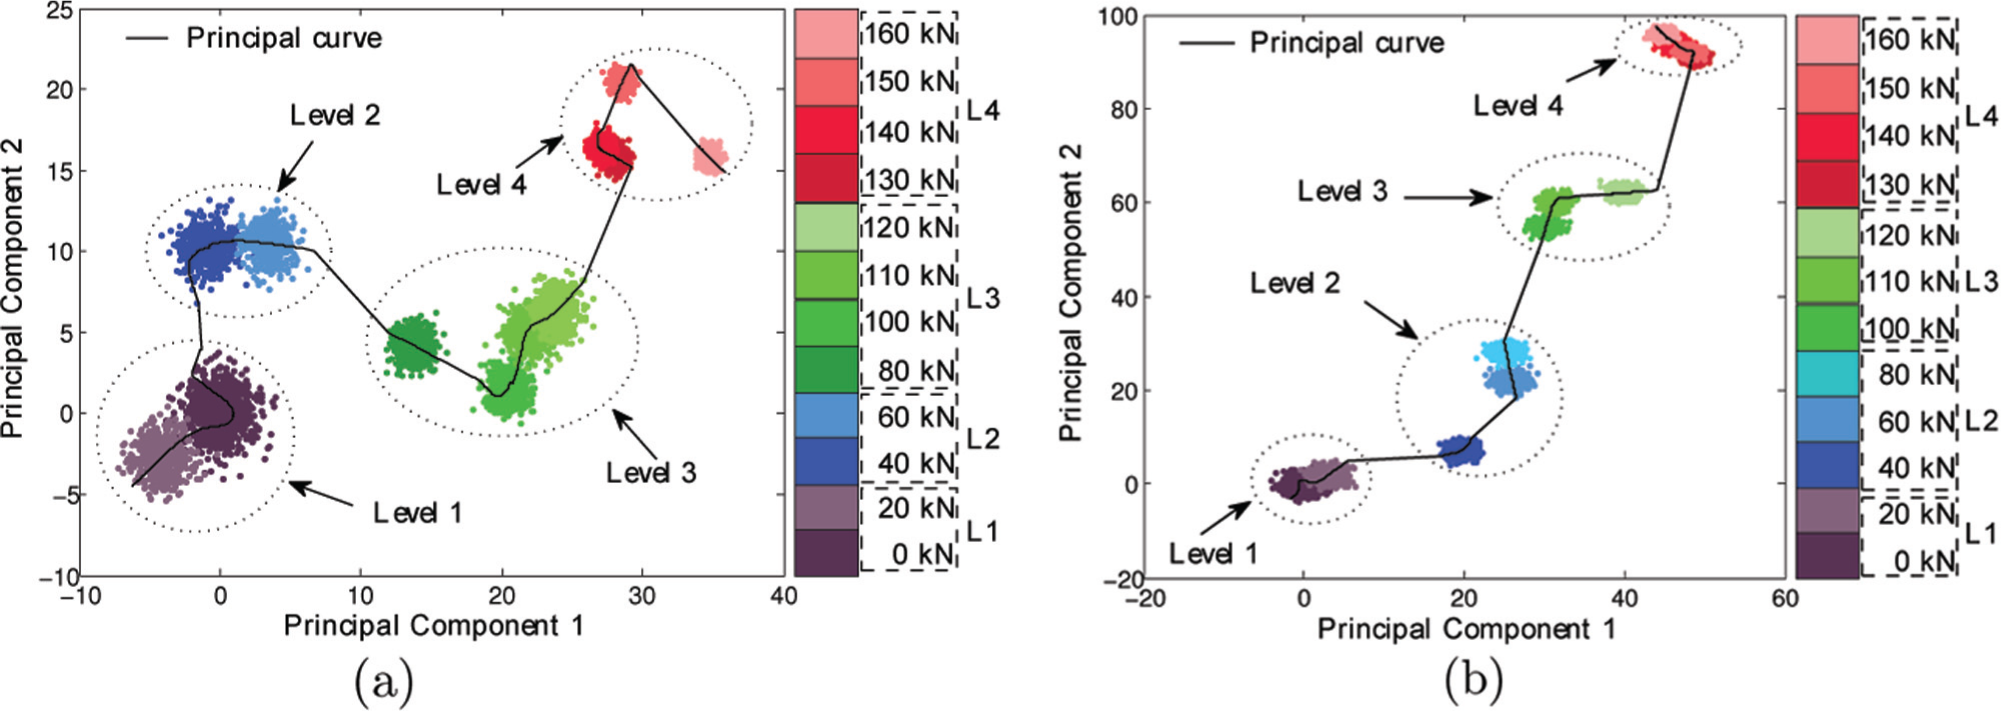
(a) NLPCA for wave propagation path 2A and (b) path 2C.
For the validation of the current results, the interpretation of the arc length of the curve was performed with respect to the load levels. The hypothesis was that the arc length increases according to the increase in the load level since all other parameters that can affect the signal’s behavior such as environmental conditions were kept under control. This variation is believed to be caused by the accumulating damage that develops within the repaired region of the tested panel. Figure 17 illustrates the resulting arc length variations for wave propagation paths 2A and 2C. For the purpose of connecting the current approach with the previously investigated mean novelty index (MNI), both curves were included in the same plot for each path. MNI in this case is plotted on a linear scale for comparison reasons. The results show that the variation of the arc length depicts the increase in the MNI quite accurately, while at the same time it shows approximately the same sensitivity as the MNI does for the different load increments between the two paths, hence reflecting the damage accumulation mode that was previously analyzed. This conclusion is rather important since the same results were obtained from a very simple data manipulation that resulted in just a one-dimensional curve.
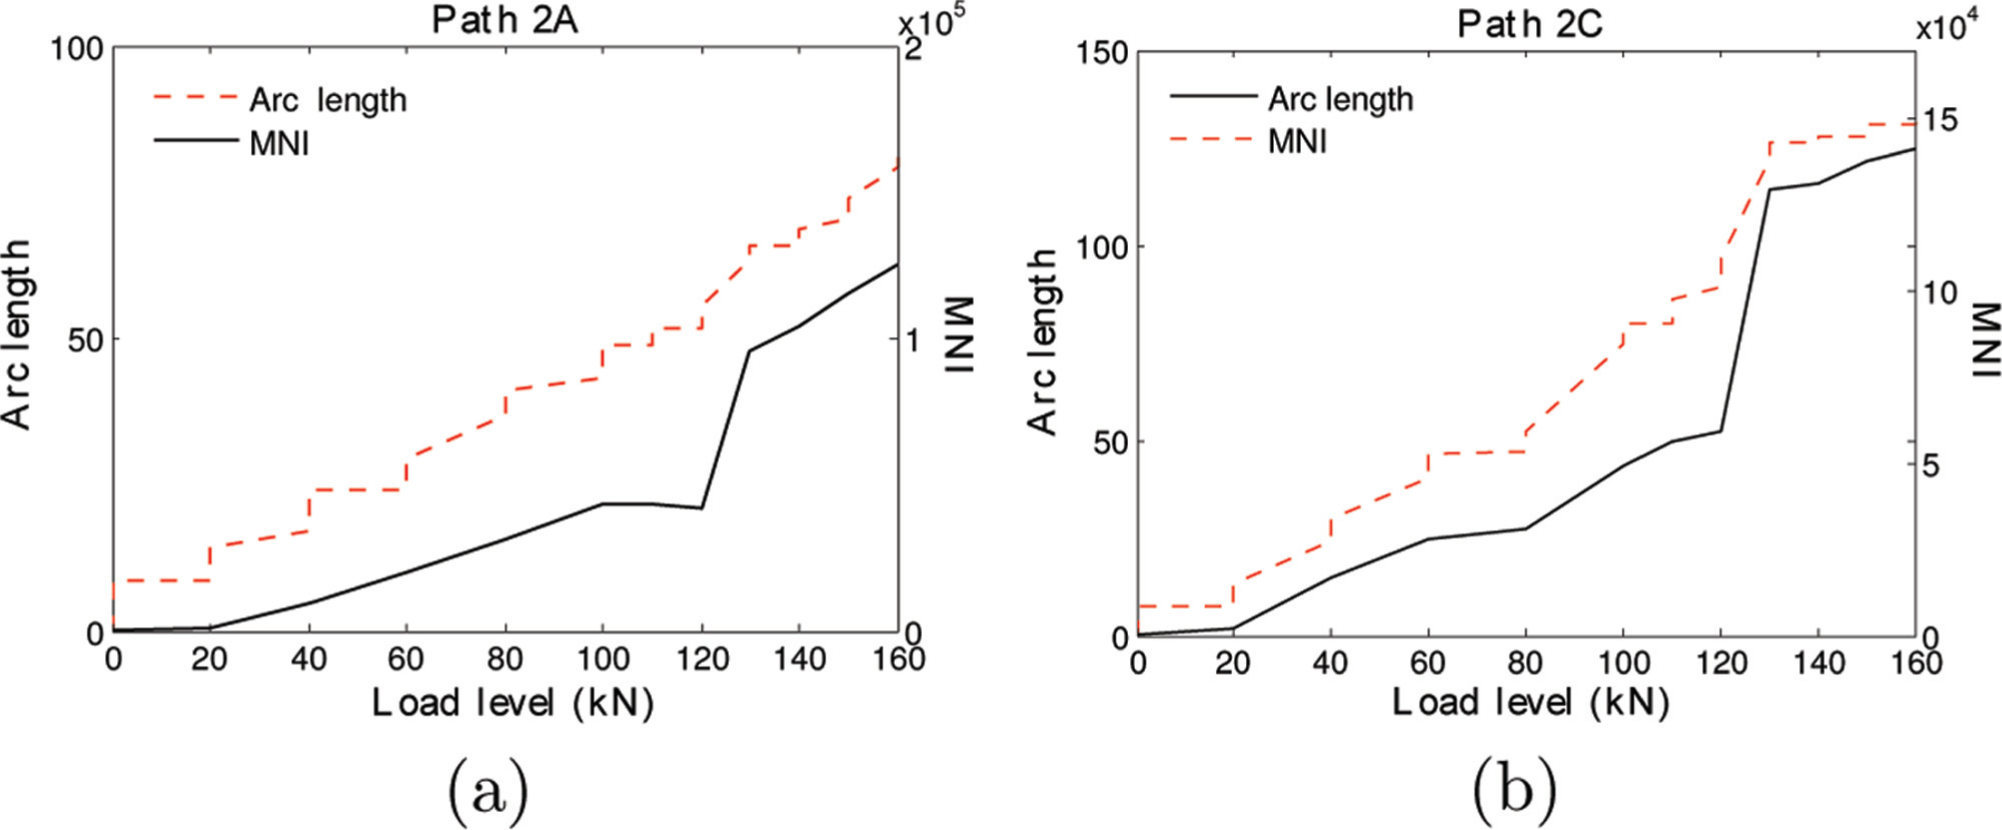
(a) Comparative study between mean novelty index (MNI) and arc length for wave propagation path 2A and (b) path 2C.
One limitation of the NLPCA is graphically illustrated in Figure 18. The principal curve here is fitted in the clusters obtained for the wave propagation path 4B. As observed, the principal curve identifies as a starting point 80 kN and ends at 100 kN. This means that the curve does not successively connect clusters that correspond to increasing levels of load. Therefore the correlation of the arc length with the increasing damage would not be reliable in this case. Reordering is a potential solution to this problem which is proposed as a future work step.
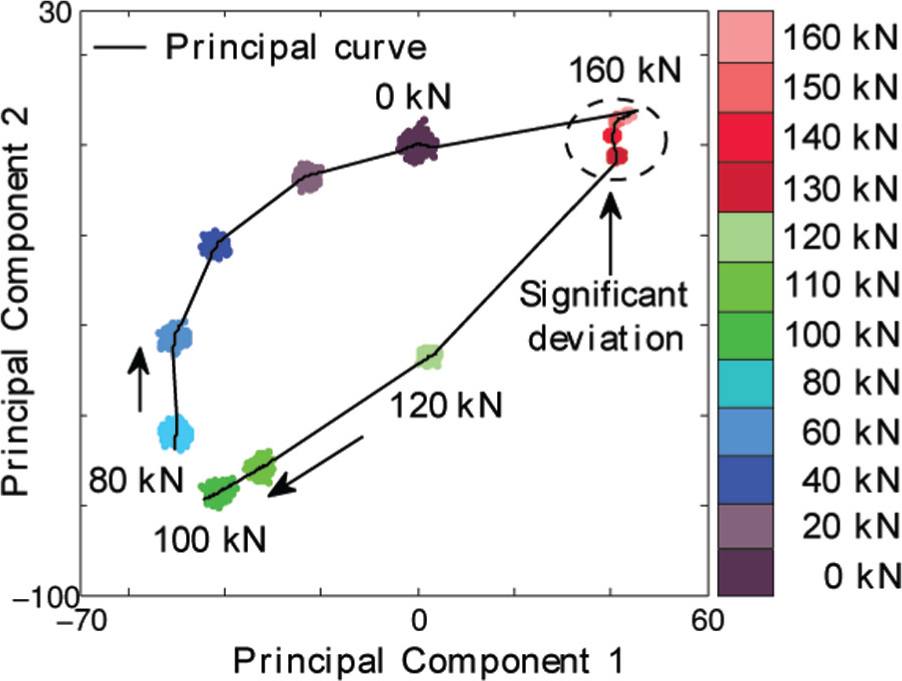
NLPCA for wave propagation path 4B.
Effect of noise
Noise in an aircraft can occur due to various operational conditions such as the normal operation of rotors, propellers, engine drive shafts and transmissions. This could reduce the sensitivity of the previously investigated methods and impose a limitation on the efficiency in the structural monitoring of the aircraft’s critical areas. Since the SNR that was considered in this work was artificially introduced based on previous experimental work, there was a need to investigate how the employed methods would be affected by higher noise levels.
In order to demonstrate the aforementioned study, a brief analysis is presented here after the original data (e.g. the data as captured from the experimental arrangement and prior to their corruption with SNR equal to 30) were corrupted with noise of a SNR equal to 19. It has to be noted that this is the level of noise at which PCA started showing different behavior. In Figure 19, the results from the implementation of OA and PCA are demonstrated for propagation path 4B for comparison reasons. As illustrated, OA exhibits behavior similar to the original results in Figure 13, only in this case the values of discordancy are lower as an immediate effect of the high SNR. However, the damage cases are still flagged as outliers and the method seems to provide reliable results. On the other hand, the same results for PCA exhibit clusters that cannot easily be distinguished from each other and hence be attributed to the different damage levels. This means that the proposed damage prognosis tool based on the principal curves would not be reliably applied in this case. Nevertheless, the examined level of noise is too high for normal operational conditions, which makes the proposed post-processing tool a strong candidate for a robust analysis in complex structures, although some further refinement may be required.
(a) OA and (b) PCA for path 4B with SNR equal to 19.
The effect of the noise has been investigated in the current article and proved that even at high SNR noises OA would still detect damage while in the case of PCA and hence principal curves possible damage might have been masked. The effect of the environmental conditions on the employed methods is a rather important issue that, as for any data-driven approach, needs to be fully investigated. This effect would possibly cause changes in the selected features (e.g. time shift) and would distort the clusters. Structures can exhibit variations in temperature on a daily or seasonal basis, leading to a change in the modulus and other material properties which might affect the boundary conditions of the monitored system. The current work did not take into consideration temperature-induced stresses due to any other factors since the testing took place in the controlled environment of a lab. This could be proposed as future work and would require appropriate further experimentation. In terms of data processing, in the past (Cross et al., 2011) linear projection methods (including PCA) have been used in order to remove environmental effects, and they offer the same promise here.
Concluding remarks
The presented work demonstrated different concepts towards the realization of a real-time damage prognosis strategy along with the identification of the levels of success and their potential limitations. The study employed Lamb waves monitoring together with alternative nondestructive techniques in order to verify the observed phenomena.
More specifically, a scarf repair patch was implemented on an impact-damaged composite laminate that was tested under tensile loading and monitored with Lamb waves together with on-line DIC. The recorded Lamb waves were treated as multivariate data and further assessed by means of OA and PCA (linear and nonlinear) after the appropriate feature selection. The principal curves were proposed as a novel damage prognosis tool through whose fitting the damage mapping of a relatively complex system was possible with just a one-dimensional curve. The study investigated the levels of success of the employed methods through a comparative manner and identified potential limitations that are associated with extreme damage loading scenarios. The effect of noise was also explored in order to identify potential effects, proving that OA can successfully detect damage even under extremely noisy conditions. All methods exhibited considerable agreement with the results obtained from the DIC, successfully validating the detected extent. A potential limitation of the principal curves lies in the difficulty of assigning a certain initiation and finishing point or of assigning a certain fitting path, and needs further investigation.
The work presented progress towards the application of data interpretation tools that will allow the use of guided ultrasonic waves for damage detection purposes in complex composite structures. Future work needs to focus on the testing of SHM tools which can overcome the complexity of the recorded data by reducing the dimensionality of multivariate data sets and depict the structural integrity of composite bonded repairs with simple damage indices.
Footnotes
Acknowledgements
The authors would like to acknowledge the contributions of Dr Miguel Angel Caminero Torija and Bjarni Nicolaisson.
Declaration of Conflicting Interests
The author(s) declared no potential conflicts of interest with respect to the research, authorship, and/or publication of this article
Funding
The author(s) disclosed receipt of the following financial support for the research, authorship, and/or publication of this article: The authors would like to acknowledge the financial support of the EU 7th Framework Programme IAPETUS (innovative repair of aerospace structures with curing optimisation and life cycle monitoring abilities). Grant number: ACP7-GA-2008-234333.