
Abstract
We use the suspensions of charged fibrous virus (fd) as a model system for charged colloidal rods, where thick electric double layers are present. In particular, the system has shown the electric field–induced phase/state transitions under a low electric field strength. We briefly present the frequency responsive dynamics in the phase/state diagram and field-induced criticality in the dynamical states by approaching the field-induced critical point. In addition, the possible mechanism of low-frequency responsive dynamical states is briefly explained by the local charge redistribution of dissociation and association of condensed ions on the charged rods. The found phases/states are unique in the bulk phase diagram, away from the electrode polarization that is dominant near to the surface of the indium tin oxide glasses, in the sense that they are observed independent from the applied field amplitude and frequency.
Keywords
Introduction: system and electric phase/state diagram
The experiments discussed here are performed with suspensions of charged chiral fibrous virus (fd) particles, which consist of a DNA strand covered with about 2700 fd-coat proteins, carrying approximately 10,000 elementary charges (Levy et al., 1994; Zimmermann et al., 1986). The length of an fd-virus is 880 nm, and the bare diameter is 6.8 nm, with a persistence length of approximately 3 µm. A number of liquid crystalline phases have been observed in these systems at a relatively high ionic strength, larger than 1 mM (Dogic and Fraden, 2000, 2001; Fraden, 1995), and the electric field–induced birefringence at low fd-concentration has been reported (up to about six times larger than the overlap concentration) at very low ionic strengths, of 0.01 mM [6]. There are no studies reported yet on the phase behavior at low ionic strength, in the range of 0.01–0.5 mM, where electrostatic interactions are dominant and packing effects lead to the formation of a glass. The system of charged fd-viruses is chosen as a model system for charged colloidal rods. Some of the important features of suspensions of fd-virus particles are as follows: First, the fd-virus particles, cultured from the Escherichia coli bacteria are long and thin, stiff, mono-disperse DNA strands, as determined by transmission electron micrograph (TEM) morphology (Levy et al., 1994). Second, the surface of virus is covered by fd-coat proteins in a helical fashion that carries many elementary charges. Third, since these charged rods are highly anisotropic, they develop orientational order when the concentration is increased. Here, the suspension is prepared at a low ionic strength, where the Debye screening length is about three times larger than the bare diameter of fd-rods, and the aspect ratio sufficiently changes the phase behaviors. Particularly, where there is isotropic and nematic phase coexistence, within the so-called “biphasic” region, the electric response of these charged rods is explored. Now, when the external electric field is applied, the various phases/states are induced, shown in the electric field–induced non-equilibrium phase/state diagram in Figure 1, as in the applied field amplitude versus frequency diagram, together with the corresponding depolarized morphologies of each of the phases and states. The electric response of unique phases and states is shown in Figure 1, depicted with depolarized morphology as local orientational order: At high frequencies, larger than about 1 kHz, a uniform homeotropic H-phase is found where the rods are aligned along the electric field. Below 1 kHz, however, on increasing the field strength, first a chiral-nematic phase is formed (denoted as N*), where the extended stripe patterns appear, and on further increasing the field strength, a dynamical state is formed (the D-state), where nematic domains melt and form (Dhont and Kang, 2010, 2011; Kang, 2010a, 2010b, 2010c; Kang and Dhont, 2008, 2009, 2010; Kang et al., 2007). The interest here is in the dynamics of melting and forming of small nematic domains in the D-state, as well as the particle dynamics in the H-phase. The depolarized optical morphologies are shown under an in situ electric field cell, shown in Figure 2, where the in situ cell is located under a depolarized optical microscope, while the alternating current (AC) sinusoidal waveform is applied through the cell gap of 1.4 mm. The bright region in the charged fd-rods is more or less aligned as compared to the black background in an isotropic phase, shown in the morphology of the N-phase. As one can see in Figure 1, there is threshold field amplitude for both low- and high-frequency responses entering the chiral-nematic phase (N*)and homeotropic phase (H), respectively. We will further discuss different interactions of many interacting charged rods in two distinguishable frequencies under an applied electric field.
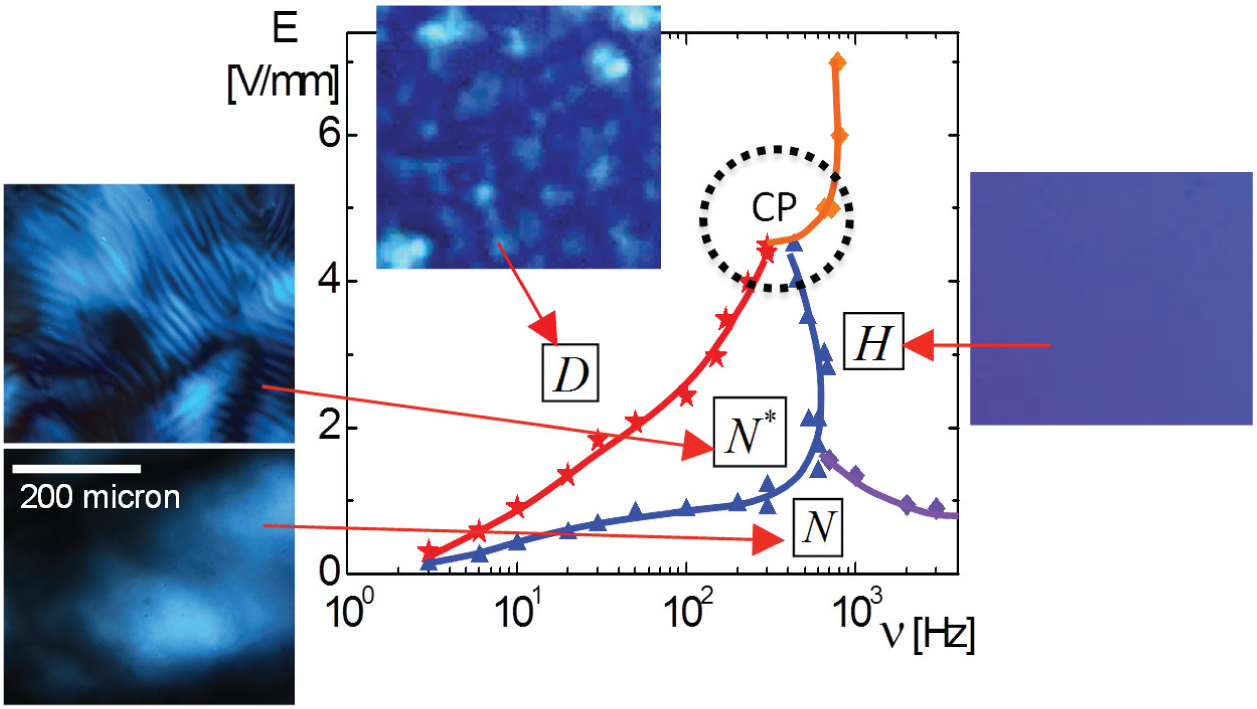
An electric phase/state diagram of charged fibrous viruses (fd) in the AC field amplitude and frequency: In the absence of field, nematic domains are seen in the isotropic background (N-phase), chiral-nematic phase (N*), dynamical state (D), and homeotropic phase (H). Multiphases meet at the critical point (CP) at a critical frequency and amplitude. Two sharp phase transitions (blue and red lines) are induced at below the critical frequency, while one transition line is observed at higher frequency.
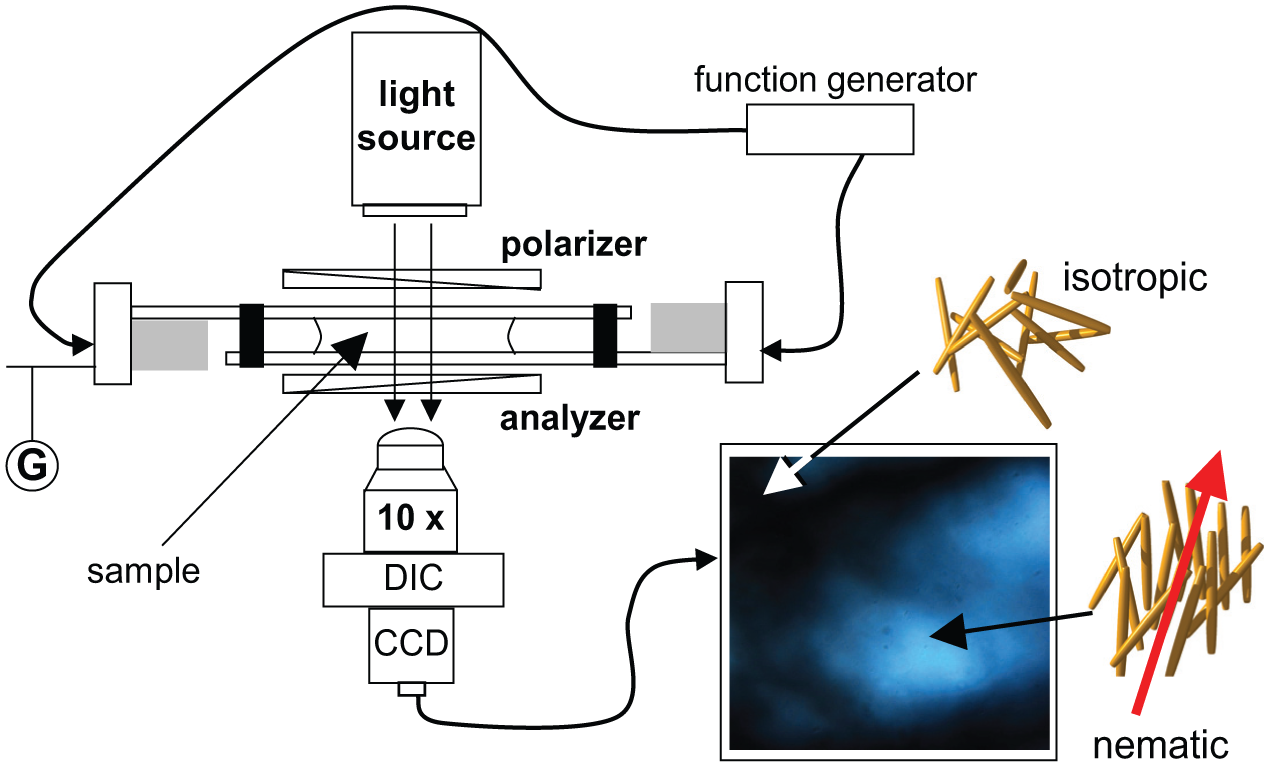
Schematic of the equipment for an in situ electric field optical cell for depolarized microscopy. In the absence of an external field, the system has isotropic (black background) and nematic (blue domain) phase coexistence. For the broader region of view, 10× objective lens is used under microscope. The field of view of the morphology is about 400 × 400 µm2.
Image-time correlation functions in dynamical states
For the dynamics of orientation textures that is the characteristic of low-frequency induced dynamical states, the melting/forming of small nematic domains is quantified by the construction of image-time correlation functions (Kang, 2010c, 2011). The principle of image-time correlation is briefly sketched in Figure 3. First, a series of time-lapsed images is collected with a charge-coupled device (CCD) camera. Note that the pixel averaged intensity is subtracted from the single pixel intensity, and the function is normalized such that it is unity at time zero. Then, the decay rate of correlation functions is used to characterize the slowly varying dynamics of textures. For a data acquisition, the time binning (or time interval), the total number of frames, and the region of interest are optimized. Time-lapsed images are collected to represent the dynamical events of textures, reconstructed by a series of black/white bitmap formats. Here, the pixel sizes are chosen as 170 × 170 pixels, which can be slightly varied with an optimization between total numbers of image frames and time binning. Each time frame image intensity value is stored in an American Standard Code for Information Interchange (ASCII) format to calculate pixel-to-pixel correlations at different time frames, normalized to an initial time frame.
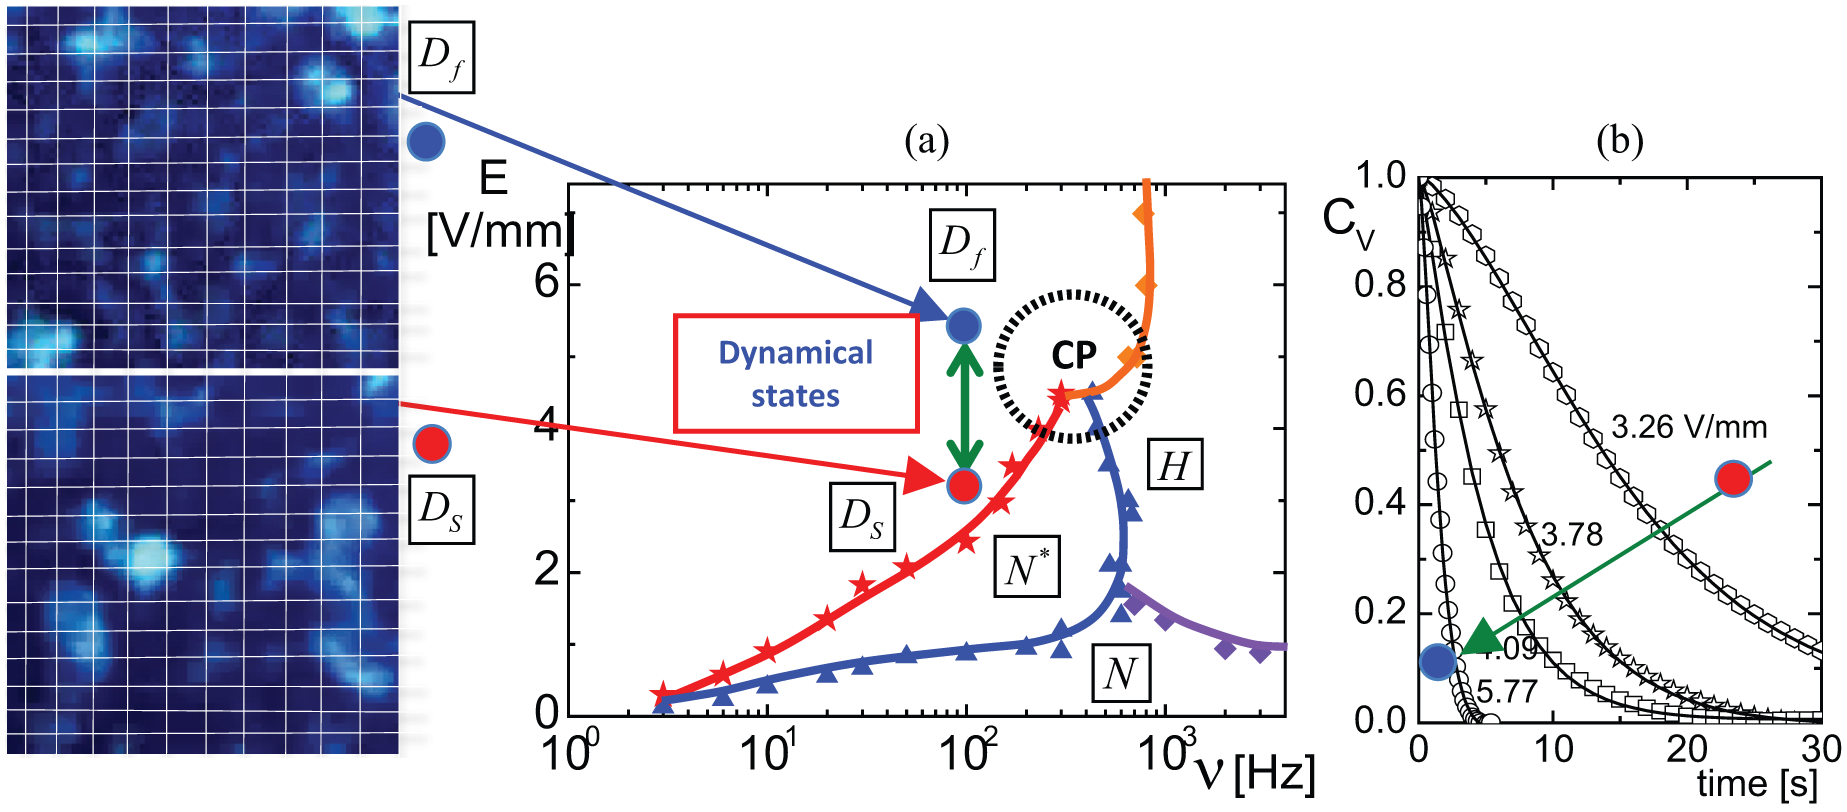
(a) Spatial–temporal images for dynamical states: for slow dynamical states (Ds) versus fast dynamical states (Df), and the field-induced phase state/diagram. (b) Example of an image-time correlation function as an increase in field amplitude. The regions of interest (ROIs) are chosen as squares.
Then, the enhanced images appear as black and white bitmap format. From these images, image-time correlation functions are constructed, which are defined as
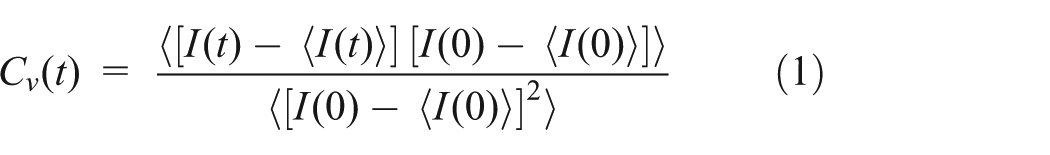
where
Electric field–induced criticality in dynamical states
The top left plot in Figure 4(a) shows the characteristic time of small nematic domains (size of 30–400 µm), as obtained from the image-time correlation functions, either on approaching the “non-equilibrium critical point (CP),” so-called CP in Figure 4(c) that is indicated within the dashed circle, by increasing the frequency (see the left blue horizontal line in the phase/state diagram). There is a power-law divergence of the time scale τ on which melting and forming of nematic domains proceed, as the CP is approached. Also, the size of domains diverges, as shown in the left plot below, and a logarithmic divergence is found (see the most right of Figure 4(b)). A stronger divergence of both the length and time scale is observed at the critical frequency, by lowering the field amplitude, on approaching the “non-equilibrium CP” (Dhont and Kang, 2011; Kang, 2010a, 2010b). There is also an evidence of critical slowing down particle dynamics on the approach of the CP from the side of the H-phase, as it can be seen from the dynamic light scattering (DLS) correlation functions of a high-frequency response, on the right side of phase/state diagram. There, clearly a non-vanishing slow mode appears in earlier time, on approach of the CP and sustains for long waiting time (Kang, 2010a). Non-equilibrium criticality for characterizing the time of melting and forming of small nematic domains, the image-time correlation functions are used that we just introduced in the previous section. To extract the critical slowing down of observables, one should take care of non-critical background contributions that are ambient as a steady state, as indicated by the red arrows on the left in Figure 4(a) and (b). The critical parameter can be determined by looking for the divergence of the “observables,” in other words, the inverse of the “observables” (in this case, the time and domain size) becomes zero, which is depicted in the middle, as blue arrows in Figure 4(a) and (b). The external parameters can be then either the applied frequency or the field amplitude. The most right panels have shown both “strong,” as a power-law like, or “weak,” as logarithmically, as a function of the frequency. Figure 4(c) shows the summary of divergences of field-induced critical exponents of time and domain-size divergence as
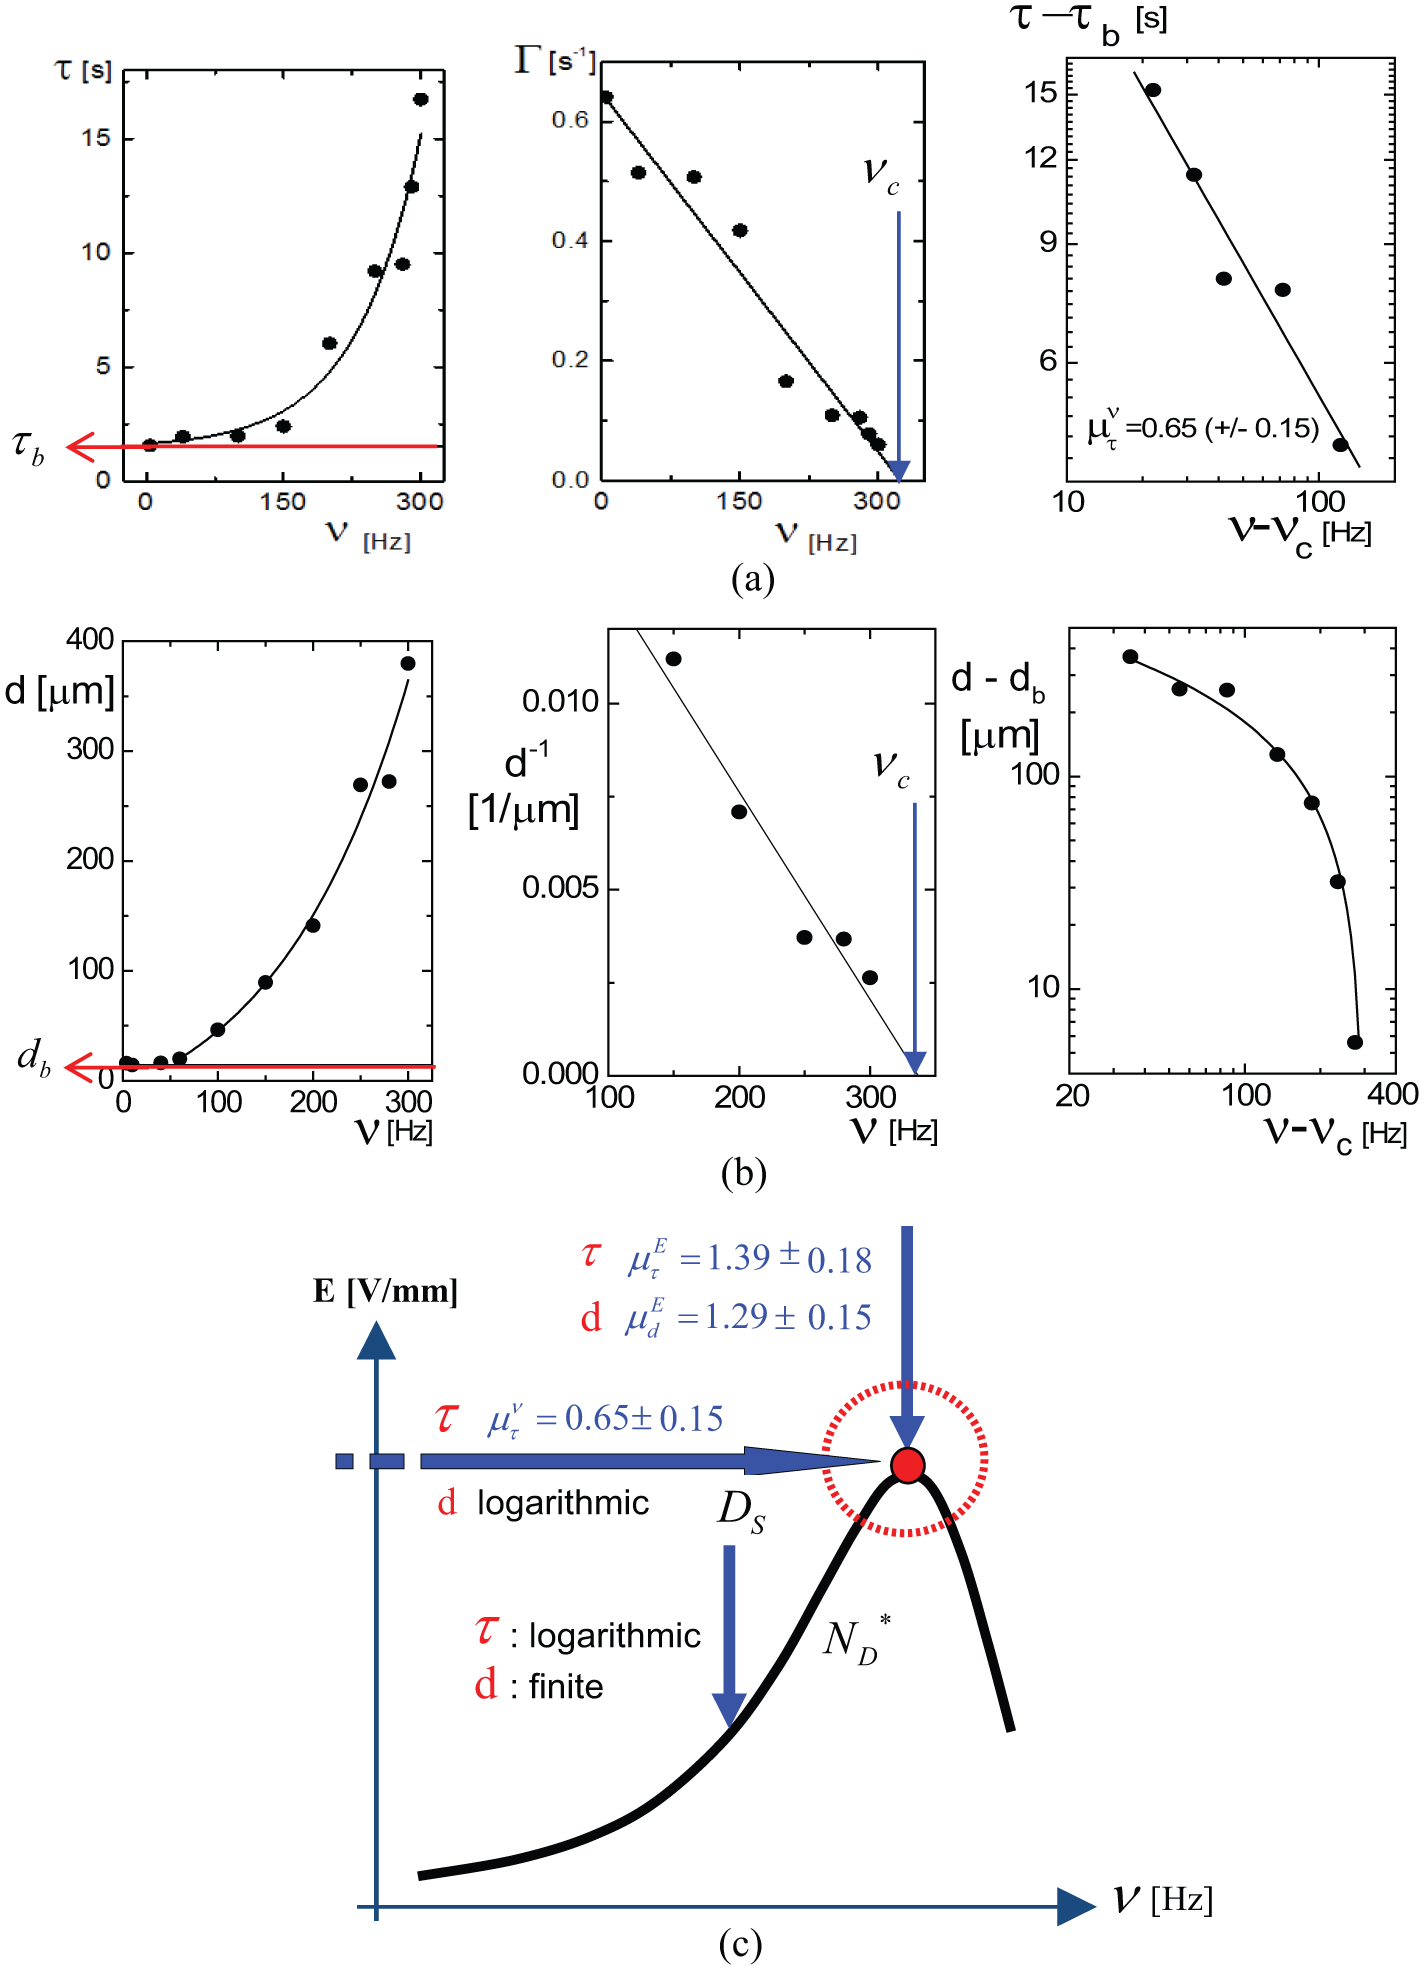
(a) Decay times τ and (b) domain size, d, as a function of applied frequency, and (c) a summary of the divergences of decay times and domain sizes of melting and forming of small nematic domains in the dynamical states. The divergence power, μ, is indicated in different pathways in the phase/states diagram amplitude and frequency plane, by approaching the CP.
Local charge dissociation/association of condensed ions in dynamical states
A possible mechanism of limiting cycle of melting and forming of small nematic domains in the field-induced dynamical states is discussed (Dhont and Kang, 2014) and presented with the local charge dissociation/association of condensed ions that is depicted in Figure 5: (1) When the external field is applied at a low ionic strength, thick electric double layers are present surrounding the charged fd-virus core, shown in the most right bottom in Figure 5. Local charge dissociation of condensed ions occurs to release condensed ions to the bulk solution, perpendicular to the rods, allowing transiently an increase in ionic strength. (2) A relatively higher ionic strength in bulk solution induces the double layers of charged fd-rods to become thinner. Consequently, it contributes to an effective diameter thinner via time-dependent electric double layers,
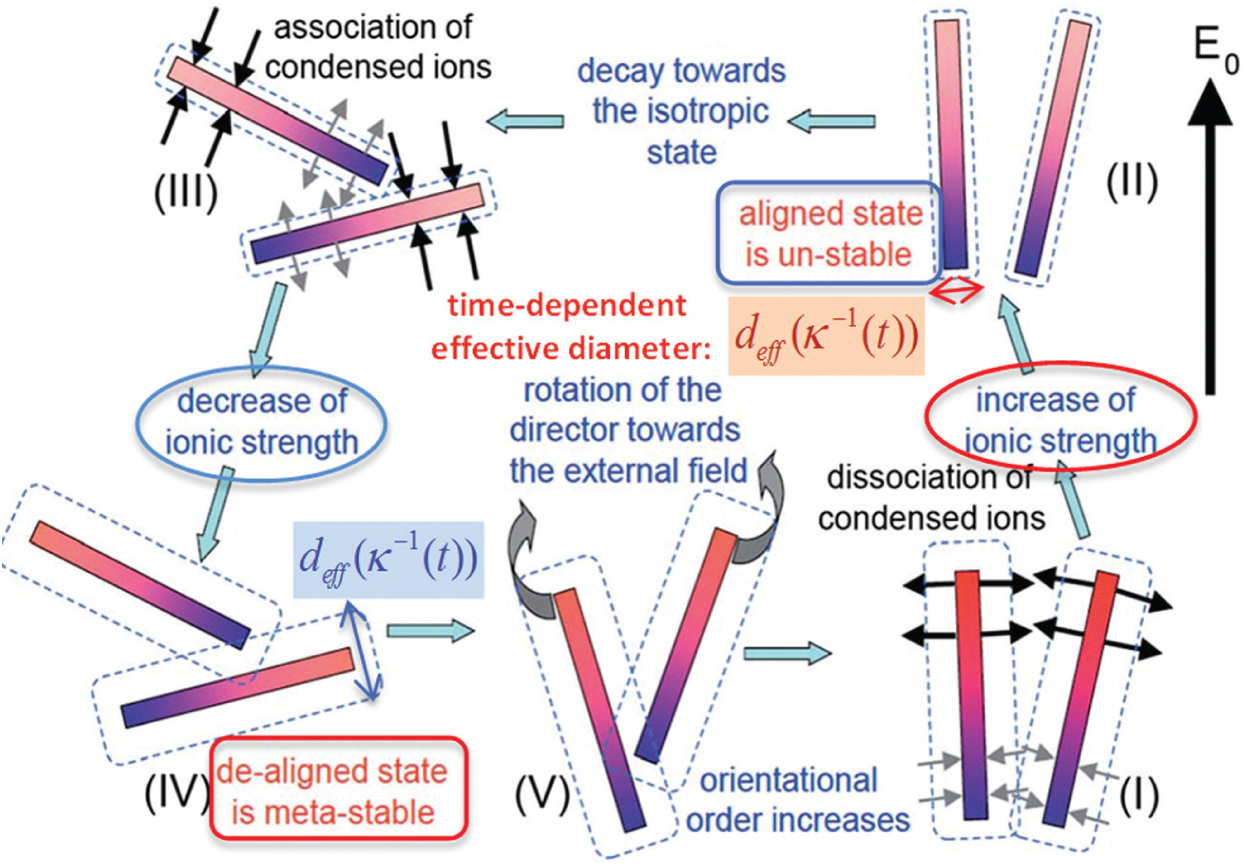
A proposed mechanism of low-frequency-induced dynamics states, where the limit cycle of melting and forming of small nematic domains is observed in the slow/fast dynamical states, in an oscillating field.
Unique frequency responsive dynamics: polarization versus hydrodynamics
Finally, unique distinguishable dynamics of frequency responses are shown in Figure 6, as the electric field–induced phase/state diagram. The low-frequency responsive dynamics are dominated by the electrostatic interactions via induced polarization, where mobile ions are accessed in the thick electric double layers (see the left side of Figure 6). However, for higher frequency responsive dynamics, polarization is not important, but the hydrodynamic interactions become important via electro-osmotic flow in solvent (on the right side of Figure 6).
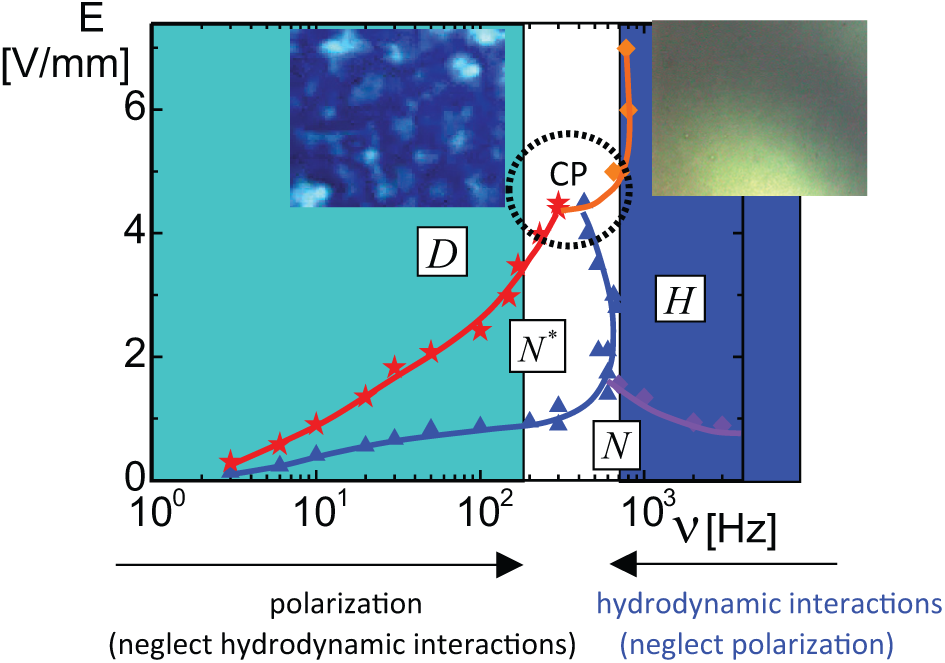
A simpler electric field–induced phase/state diagram, where two different interaction regimes are distinguished as either low- or high-frequency responsive dynamics. In between, there is a critical slowing down regime where the field-induced multi-critical phases meet.
Conclusion
Demonstrated field-induced criticality is characterized by an image-time correlation spectroscopy in the low-frequency dynamical states, Ds − Df state transition, by approaching the multi-CP. Also, by reducing the frequency near to the H-N* transition line, high-frequency responsive dynamics are exhibited by the critical slowing down behaviors. The system has shown rich and unique field-induced phase transitions in the sense that they are independent from the way the field is applied. Therefore, it can be introduced as truly an intelligent system for the electric responses of many interacting charged rods.
Footnotes
Declaration of conflicting interests
The authors declared no potential conflicts of interest with respect to the research, authorship, and/or publication of this article.
Funding
The authors received no financial support for the research, authorship, and/or publication of this article.