






Abstract
A space curved surface shape reconstruction algorithm is proposed for shape perception and reconstruction of flexible plate structure. First, biorthogonal strain data measured by optimal distributed Fiber Bragg grating sensor network are converted to discrete curvature data. Second, interpolation is done to achieve curvature continuity for structural deformation. Third, moving coordinate systems are established in two orthogonal directions of the orthogonal curved network on the plate surface. Then, all nodal coordinates are computed using the given boundary conditions and nodal curvature. Coordinate transformation is done for two orthogonal coordinates according to the coupling relationship. Finally, a square flexible smart Fiber Bragg grating plate is constructed by implanting fiber grating sensor network, and a visualization experimental platform is constructed. Experimental analysis and verification were done. The experimental results show that the proposed shape reconstruction algorithm has good reconstruction performance for pure bending deformation, torsional deformation, and low-frequency dynamic vibration shape.
Keywords
Introduction
Plate structure is widely used in industrial field especially in aerospace field, such as solar panels of satellites, wings of large fixed-wing aircraft, and fronts of large phased array radar antenna (Baldwin et al., 2004; Darus and Al-Khafaji, 2012; Li et al., 2009; Payo et al., 2009). Large plate structural deformation or long-term vibration fatigue will generate serious influence. For example, failure of solar panels will result in losing control of satellite. Failure of the wings of large fixed-wing aircraft will result in flight mission failure. Deformation of phased array radar antenna will cause performance degradation of detection and communication. Therefore, shape perception and reconstruction method has a great significance for reliable working and health monitoring of aerospace vehicles (Derkevorkian et al., 2013; Minakuchi and Takeda, 2013).
Non-visual structural deformation perception method generally uses a fiber Bragg grating (FBG) sensor network or a FBG sensor array (Li et al., 2014; Shapiro et al., 2014; Wang and Cheng, 2014). Comparing with visual perception method (Kiang et al., 2015; Liu et al., 2012; Park et al., 2015; Qiu et al., 2016), non-visual perception method needs less amount of collection data, with high acquisition accuracy, high real-time performance, and high anti-interference capability.
Non-visual perception method can be divided into strain data–based displacement mode superposition method (Kang et al., 2007; Kim et al., 2014; Li et al., 2014; Rapp et al., 2009; Wang et al., 2014) and curvature data–based geometrical iteration method (Xu et al., 2013; Yi et al., 2012a, 2012b). The basic idea of displacement mode superposition method is using strain data and strain–displacement transformation matrix to achieve shape reconstruction by obtaining the free structural vibration equation. The basic idea of geometrical iteration method is as follows: converting the obtained strain data to curvature and achieving curvature continuity by interpolation method, employing moving coordinate system to achieve iterative recursion of surface coordinates, and employing curved surface fitting algorithm to achieve shape reconstruction.
Displacement mode superposition method mentioned in Rapp et al. (2009), Wang et al. (2014), Kim et al. (2014), and Li et al. (2014) is only suitable for shape reconstruction with small amplitude distortion as the strain direction on the measuring surface is uncertain. Geometrical iteration method mentioned in Yi et al. (2012a, 2012b) and Xu et al. (2013) uses curvature data along a single direction and employs plane curve fitting algorithm to achieve shape reconstruction. Although these methods have good reconstruction performance for pure bending deformation, they are not suited for torsional deformation. Xu et al. (2013) have achieved curved surface reconstruction, but the method is not suited for real-time reconstruction as it needs to solve complex non-linear equations. Yi et al. (2012b) proposed a space curve shape reconstruction algorithm, but it is not suited for bend torsion coupling shape reconstruction.
To overcome the shortcomings of the above algorithms, a new orthogonal curve net–based space surface reconstruction algorithm is proposed. The proposed algorithm uses biorthogonal strain data and orthogonal curve net to achieve shape reconstruction of complex vibration shape. Recursive computation is employed for real-time implementation instead of solving non-linear equations.
To verify the reconstruction performance, a cantilever fixed flexible plate structure was used as experimental model. FBG sensors were implanted at the front and back surface discretely and orthogonally. And experimental analysis and verification were done. Experimental result shows that the proposed method has good reconstruction performance for pure bending deformation, torsional deformation, and low-frequency dynamic vibration shape.
Orthogonal curvature and moving coordinate system
The discrete strain data on structural surface can be obtained precisely by FBG sensor which is implanted discretely at the front and back structural surface. In a constant temperature environment, the relationship between strain and curvature is linear. The linear coefficient can be determined by calibration experiment. Based on the linear relationship between strain and curvature, the strain data of every measuring point can be transformed to curvature data. The curvature can be achieved continuously by linear interpolating algorithm. The orthogonal curve net and moving coordinate system are established based on the continuous curvature.
Orthogonal curvature continuity
In order to improve the reconstruction precision, interpolation method is employed to obtain sufficient curvature data. Considering that the deformation of the structure is mainly within the elastic limits and the process of linear interpolation algorithm is simple, linear interpolation algorithm is used to achieve distributed discrete curvature continuity. Let s be arc length. The corresponding curvature is
where M and N are constants. If the two adjacent curvatures are
M and N can be obtained by
Substitute formula (3) into formula (1)
Establish orthogonal curve net
According to differential geometry, a regular parametric curved surface S is a continuous mapping from area D on space E2 to space E3. Cartesian coordinate system is established on E2 and E3 separately. Use (u, v) to denote the coordinate in E2 and use (x, y, z) to denote the coordinate in E3. So, the equation of curved surface S is
On the basis of curvature continuity, those measuring points which have equal space (denoted by Δs) between each other were chosen. The measuring points were connecting from u direction and v direction separately. The orthogonal equal arc length grid is shown in Figure 1.

Schematic diagram of partial equal arc length grid.
In Figure 1, the orthogonal curvature of measuring points is divided into the curvature along u direction and the curvature along v direction, which is denoted by
Length-preserving correspondence can be established between deformed and original curved surface. So, the equal arc length grids mentioned above became an orthogonal curve net after plate structure deformed, as shown in Figure 2.

Orthogonal curve net.
If the coordinate of each node on orthogonal curve net, as shown in Figure 2, can be solved separately by a certain computation method, the whole smooth curved surface can be obtained by traditional curved surface fitting algorithm. Considering that the research object is one-side fixed and there is no large deformation on the partial of plate structure, two boundary conditions exist as follows:
There is no deformation on the fixed side of curved surface;
The central line along u direction of orthogonal curve net is plane curve.
In order to describe the algorithm conveniently, moving coordinate system is established along the u direction and v direction of orthogonal curve net separately, as shown in Figure 3.

Moving coordinate system.
The coordinate transformation relationship contains translation, rotation around z axis, and rotation around x axis, as shown in Figure 4.

Moving coordinate system transformation.
In Figure 4,
Space curved surface reconstruction algorithm
Nodal coordinate recursive computation
Nodal coordinate recursive computation is the key part of the space curved surface reconstruction algorithm. Because the central line along u direction is plane curve which can be obtained precisely by plate curved fitting algorithm, on the condition that using the central line as the boundary, nodal coordinate of other curve can be obtained by iterative calculation. The micro arc between point
where
The moving coordinate system whose original point is
Rotate
Rotate
Move the original point from point
So, if
Similarly, the moving coordinate system whose point is
Rotate
Rotate
Move the original point from point
Continue to rotate
Continue to rotate
Move the original point from point
From the above transformation, the absolute coordinate of
The above formula can be simplified to
The absolute coordinate (when
In formula (11),
One nodal coordinate can be computed according to formula (7) and formulas (11)–(13). All nodal coordinates can be obtained by iterative recursion combining with coupling transformation of moving coordinate system.
Coupling transformation of moving coordinate system
The moving coordinate systems along u direction and along v direction is moving along the curve on which they are located. And they converge on the next node of orthogonal curve net. If point

Coupling relationship between orthogonal coordinate direction.
First, rotate x axis and y axis of the two coordinate systems
After twisting degree obtained by formula (14), the two coordinate systems should rotate γ degree around its y axis separately to ensure superposition of corresponding coordinate axis
Thus, new moving coordinate system along u direction can be obtained, as shown in formula (16)
In the same way, new moving coordinate system along v direction can also be obtained
In formulas (16) and (17), the matrix of rotation angle α around y axis is shown in formula (18)
Therefore, the coupling transformation of the two moving coordinate systems at the node
Construction and development of experimental platform
Structural design of experiment model
A square plexiglas plate was used as the experiment model. The elastic modulus

Schematic diagram of experiment model structure.
Particle swarm optimization algorithm was used to compute optimized placement scheme of FBG sensing network. Each pair of FBG sensor was pasted on the front and back surface along two orthogonal directions separately to form orthogonal distribution, as shown in Figure 7.

Smart plate with pasted orthogonal sensors.
Construction of experimental platform
The experimental platform is consisted of experimental base platform, excitation system, strain measurement system, displacement measurement system, and software system. Experimental base platform is a highly stable optical experimental platform. Excitation system includes signal generator, power amplifier, exciter, and fixed components, which can generate high-power excitation signal of any frequency and any type. Structure shape perception and measurement system is consisted of FBG fiber grating network, fiber grating network analyzer, and collection software. It can collect FBG sensor network grating wavelength signal precisely to provide basic data for subsequent deformation curvature conversion. Displacement measurement system is consisted of three-dimensional guide, controller, driver, laser displacement sensor, and acquisition-driven software. Software system includes server and client which can achieve basic data service and visualized shape reconstruction of experiment model, respectively. The structure diagram of the experimental platform is shown in Figure 8, and the photo is shown in Figure 9.

Structure diagram of experimental platform.

Photo of the experiment verification platform.
The range of sensor central wavelength is 1532–1568 nm. The model of grating network analyzer is FONA-2008C, and its collecting precision is 1pm. The model of signal generator is SFG-2110. The model of power amplifier is YE5872. The model of exciter is JZK-10 which can generate exciting force of 200 N. The model of laser displacement sensor is LK-GD500.
Experimental analysis and verification
A total of 25 measuring points were selected discretely on experiment model surface to analyze experimental precision of static and dynamic deformation reconstruction. To get reconstruction precision of shape reconstruction algorithm effectively, the displacement changing of measurement points selected on structure surface should be measured precisely. The model of laser displacement sensor used in the experiment is LK-GD500 whose displacement measurement error is less than 0.00001 mm. To measure multiple points automatically, high-precise three-dimensional guide system was developed with 0.0025 mm movement precision. The laser displacement sensor is combined with the three-dimensional guide to form high-precision displacement measurement system, and its measuring error is less than 0.00251 mm. Comparing with centimeter-level maximum deformation of plate structural surface, the precision of displacement measurement system can completely meet the technical requirement of structural shape reconstruction verification.
To validate the precision of structure shape reconstruction algorithm, shape reconstruction experimental verification is performed in the state of static deformation and vibration excitation deformation. At the same time, to quantitatively evaluate the actual effect and accuracy of experiment model deformation reconstruction algorithm, mean square error is used to describe the selected measurement points. For static deformation, E(x) denotes the difference between the value of measurement and the value of reconstruction, and the mean square error Ea is defined as
Here N denotes the number of points and Ea denotes the average reconstruction error of N points. If
According to formula (20), the reconstruction precision of whole plate is
The average precision of measurement points is defined as
In formula (22), T is the data collecting number of measurement points.
Static deformation reconstruction experiment
Structure shape reconstruction is performed for pure bending deformation and torsional deformation. First, the experiment model structure is made to produce pure bending deformation. Then, structure deformation reconstruction experiment is done by the experimental platform and the measurement system. The mean square error and precision of structure shape reconstruction algorithm are computed by formulas (19) and (21). The result is shown in Table 1.
Mean square error and precision of pure bending deformation reconstruction.

In Table 1, the unit of mean square error is mm. In eight group experiments, the maximum mean square error is 3.2 mm, and the reconstruction precision is more than 90% for large pure bending deformation. With the decrease in the deformation, the precision of structural shape reconstruction decreased. The minimum precision is 81.15%. Figure 10 shows the reconstruction effect for torsional deformation.

Reconstruction effect for torsional deformation: (a) the actual deformation of experiment model and (b) the visualized reconstruction result.
Then, the torsional deformation reconstruction experiment is done. Four different torsional deformations are selected to perform the verification experiment. Experimental results are shown in Table 2.
Mean square error and precision of torsional deformation reconstruction.
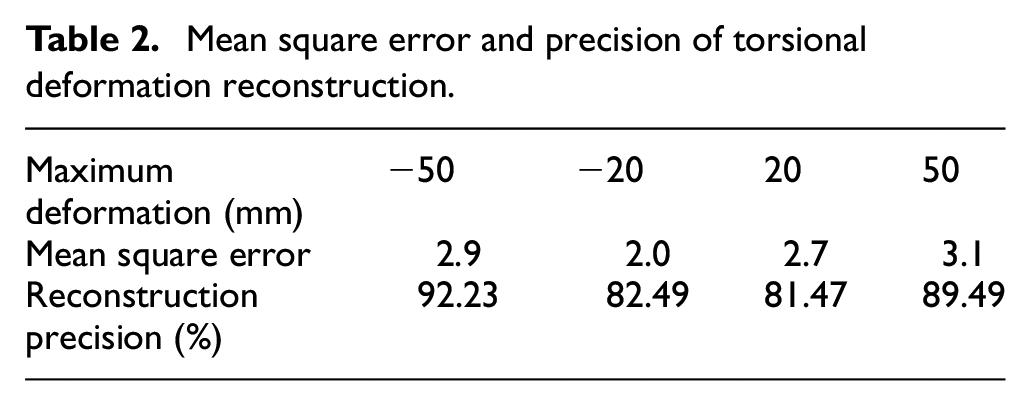
In Table 2, the unit of mean square error is mm. The maximum mean square error is 3.1 mm whose reconstruction precision is more than 81.47% for torsional deformation of experiment model structure. Figure 11 shows the reconstruction effect for torsional deformation.

Reconstruction effect for torsional deformation: (a) the actual deformation of experimental model and (b) the visualized reconstruction result.
Vibration shape reconstruction experiment
The first third-order resonance frequency is selected as the experimental vibration frequency, they are 2.3, 4.2, and 5.9 Hz. Figure 12 is the reconstruction effect for the second-order resonance frequency.

Reconstruction effect for dynamic vibration: (a) the actual dynamic vibration shape and (b) the reconstruction result.
The reconstruction precision analysis of measurement points is done according to formula (22). The experiment analysis result is shown in Figure 13.

The experiment analysis result for vibration shape reconstruction.
In Figure 13, there are 25 points. The horizontal axis denotes the order number of the point. The vertical axis denotes the precision. The reconstruction effect for the first-order resonance frequency is best, the reconstruction accuracy of each measurement point is hovered around 80%. The following is the second-order frequency, the accuracy is hovered around 75%. Figure 14 shows the comparison of actual displacement and reconstruction displacement for the fifth measurement point.

Contrast between actual displacement and reconstruction displacement: (a) first-order resonance frequency, (b) second-order resonance frequency, and (c) third-order resonance frequency.
As shown in Figure 14, the reconstruction displacement of the first third-order frequency is quite consistent with the actual displacement. It shows that the reconstruction algorithm has a precise effect for low-frequency vibration shape. Compared with the experimental result of first second-order frequency vibration, the third-order frequency reconstruction error is bigger which is identical with the experimental result shown in Figure 14.
Conclusion
A plate structure shape reconstruction method is proposed based on orthogonal curve net. Plate structure shape perception and reconstruction experimental platform are developed and established. Reconstruction experiment is performed for pure bending deformation, torsional deformation, and low-frequency dynamic vibration shape. The experimental results show that the proposed shape reconstruction algorithm is practicable with a good reconstruction performance.
Footnotes
Declaration of Conflicting Interests
The author(s) declared no potential conflicts of interest with respect to the research, authorship, and/or publication of this article.
Funding
The author(s) disclosed receipt of the following financial support for the research, authorship, and/or publication of this article: This article is sponsored by program of National Natural Science Foundation of China (No.51175319), Innovation program of Shanghai Municipal Education Commission (No. 13ZZ075), and Shanghai Key Laboratory of Power Station Automation Technology.