
Abstract
This work reports an input-dependent performance study of a nonlinear piezoelectric energy harvester with introduced magnetic interaction. The performances of the novel harvester with two external magnet arrays (I and II) are compared. Array II that has symmetric magnetic force yields better voltage output under frequency sweep test. As such, the energy harvesting capacity with Array II is performed under two vibration inputs (I and II). Under excitation Input I with periodic varying frequency, experimental results show that the nonlinear piezoelectric harvester outperforms its linear counterpart (no magnetic interaction) at alternating input bandwidths. A 104.5% improvement of root mean square voltage output (318.2% of power output) is obtained under excitation of 0.334g (root mean square) and bandwidth of 7 Hz. No advantage is observed under Input II consisting of one principal and finite non-principal components. However, detailed study indicates that the amplitude of the principal component and the amplitude ratio of the non-principal components to the principal component in Input II are essential to maintain large-amplitude periodic motion. Our work provides useful insights into the design, characterization, and application of nonlinear energy harvesters with external magnetic forces based on a priori knowledge of input.
Keywords
Introduction
Vibrational energy is one of the most prevalent ambient energy sources that could be harvested to power remote microsystems. One typical vibration-to-electricity conversion method is to use the piezoelectric transducer (Williams and Yates, 1996), which has been theoretically and experimentally studied over decades (Erturk and Inman, 2011; Shu and Lien, 2006; Sodano et al., 2005). Since the energy spectra of the available vibration sources are often spread over a wide frequency range, the application of the linear energy harvester (LEH) is limited by its single resonant frequency excitation. In addition, a resonance mismatch will result in a significant loss of energy efficiency. One promising solution is to introduce a nonlinear magnetic force to the LEH (typically a piezoelectric cantilever beam), to modify the restoring force and potential energy profile, and thus to obtain a broadband response of a nonlinear energy harvester (NEH). It was reported that the bidirectional resonance frequency tenability could be achieved by introducing a magnetic force to a piezoelectric vibration energy harvester (Challa et al., 2008). To avoid the manual interference to tune the resonant frequency, efforts have been put to design broadband NEH to improve the energy converting efficiency naturally. By introducing the nonlinear stochastic dynamics, researchers have shown that the nonlinear oscillation of a noise activated energy harvester could enhance the power output performance by about 200% comparing to its standard LEH counterpart in terms of power output (Cottone et al., 2009; Gammaitoni et al., 2009). A piezomagnetoelastic energy harvester has also been designed to study the existence of a high-energy large orbit attractor, and its superiority as a broadband electric generator has been proven (Erturk et al., 2009). A more thorough investigation of a bistable piezoelectric inertial generator has been carried out to study the nature of strange nonlinear chaotic motions (Stanton et al., 2010). Harvesting energy from the high-energy attractor in either a softening or a hardening configuration has been described and verified to be ideally suited for excitations with slow-frequency drift (Stanton et al., 2009). The use of softening springs in a microelectromechanical electrostatic energy harvester under colored noise vibrations has also been examined experimentally (Nguyen and Halvorsen, 2011). Results have shown that their nonlinear device works efficiently in spite of the variations of the resonant frequency or the deviation of the bandwidth. Later on, more elements have been introduced to further improve the performance of the NEH, such as harvesters with rotatable magnets (Zhou et al., 2013), an M-shaped asymmetric nonlinear oscillator (Leadenham and Erturk, 2014), and a broadband tristable energy harvester (Zhou et al., 2014).
As is well known, the spatial distribution of the magnetic field between the external magnets and the tip magnets features the NEH. In this article, a novel design of NEH is proposed and the output performance of the NEH with two different external magnet arrays (Array I and Array II) that have correspondingly asymmetric and symmetric magnetic interactions is first studied. The nonlinear stiffness of the magnetic–elastic structure is calculated using the measured restoring force for elucidation. More important, a periodic frequency-varying excitation (Input I) and a multiple-frequency excitation (Input II) with one principal component are compared for the input-dependent performance investigation. A well-defined output voltage averaging formula is given to compare the NEH and the LEH under Input I, providing guidance for future improvement of the NEH. Important parameters of Input II are identified from experiments, which are critical to maintain large-amplitude motion. Here, the LEH refers to the energy harvester without external magnet array, and the analysis of the NEH focuses on the decreasing sweep curve since it is where broadening of the frequency response occurs.
Experimental study of the NEH with Array I and Array II
Figure 1(a) and (b) illustrates the schematic diagram of the piezoelectric energy harvester interacted with Array I and Array II, respectively. Two piezoceramic patches QP16N (Midé Corporation) are bonded to the root of the aluminum beam (152 mm × 29 mm × 0.635 mm) on both sides. Two Neodymium magnets (9.5 mm × 9.5 mm × 9.5 mm, N42) are affixed to the free end of the bimorph piezoelectric beam, which is secured to an electromagnetic shaker. The external magnets array consists of two Neodymium magnets (25.4 mm × 19.1 mm × 6.4 mm, N42) in a parallel (Array I) and an opposite (Array II) magnetization direction, and consequently, the magnetic forces are asymmetric and symmetric, respectively. The novel design makes the nonlinear harvester have asymmetric/symmetric magnetic interactions but keep other parameters the same with the two arrays, enabling the study of magnetic force symmetry in the following context. LabVIEW and NI-DAQ (NI USB-6212) are used for input signal generation and data acquisition. A power amplifier (APS 115) and an electromagnetic shaker (APS113) provide the input excitation, which is then measured by an accelerometer with a charge amplifier. A photographic representation of the NEH prototype and the experimental setup are presented in Figure 1(c) and (d), respectively. For the sake of simplicity, Array I (Array II) is used to stand for the NEH with Array I (Array II) in the following context.
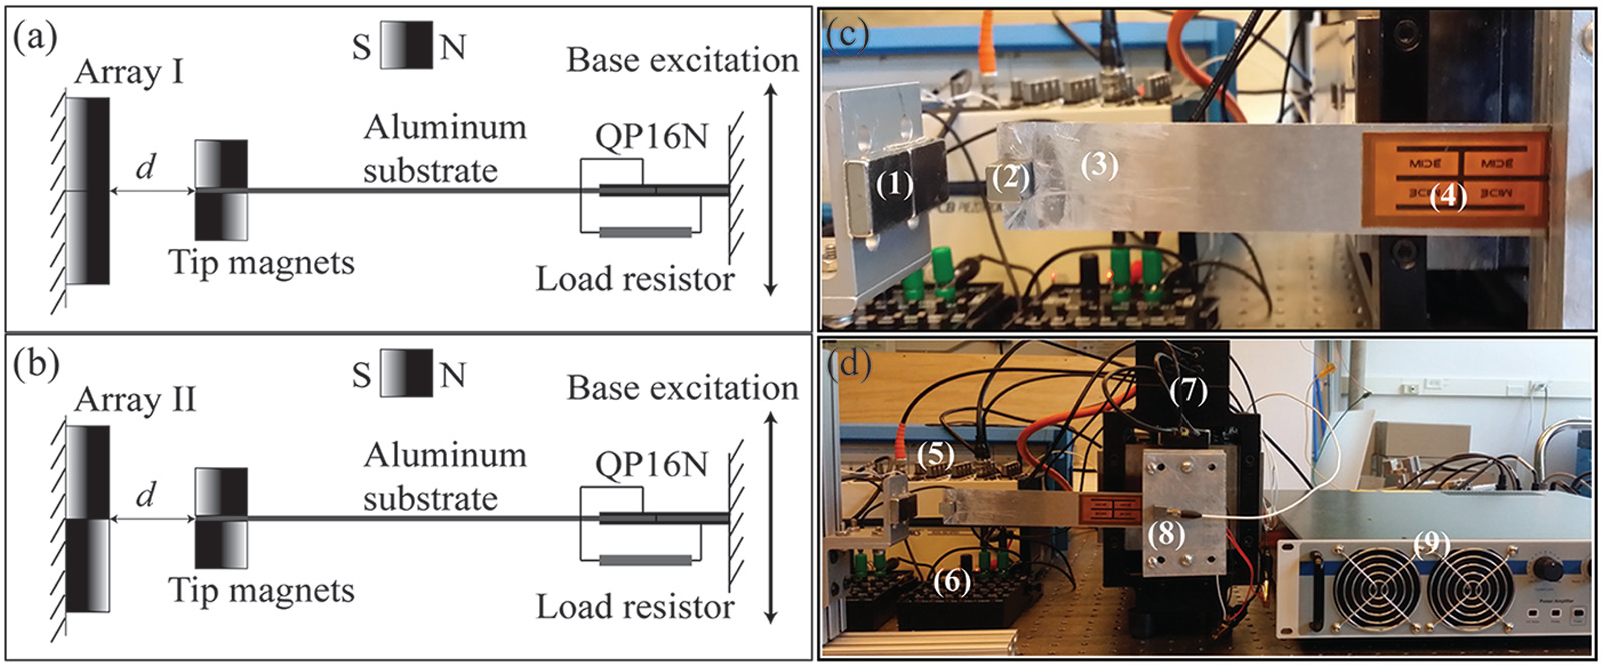
Schematic diagram of (a) Array I and (b) Array II, as well as a view of the (c) proposed NEH and the (d) experimental setup. The numbers denote the following: (1) external magnet array, (2) tip magnets, (3) aluminum substrate, (4) QP16N, (5) NI-DAQ, (6) resistor box, (7)electromagnetic shaker, (8) accelerometer, and (9) power amplifier.
A typical experimental method of characterizing nonlinear dynamics is to use a frequency sweep. Both increasing and decreasing sweep have been conducted for Array I and Array II at different surface distances between the external magnets and the tip magnets. The distance is denoted by d in Figure 1(a) and (b). The root mean square (RMS) voltage output of each case is measured across a 1 MΩ load resistance and indicated by Figure 2. Intuitively, Array II produces much broader bandwidth comparing to Array I and the output is greatly determined by distance d, on which the magnetic force depends. Under certain excitation conditions, the bandwidth is negatively related to d due to the arising magnetic force. It is important to note that when d is too small, like 20 mm, the attractive magnetic force is too strong so that the tip motion is confined to a relatively small space around the equilibrium position. Such a small-amplitude motion consequently yields a small voltage output. The resonance frequency is shifted due to the modified stiffness from the imposed magnetic force, which should also be considered in the harvester design (Tang et al., 2012). The restoring forces at d = 25 mm are measured for each case and are shown in Figure 3(a) along with the corresponding nonlinear stiffness in Figure 3(b). Array II has two symmetric near-zero-stiffness regions but Array I only has one due to its asymmetric external magnet array. The differences on near-zero-stiffness regions thus direct to different outputs. The small resonant peak at 6 Hz in Figure 2 might result from the small-amplitude oscillation around the near-zero-stiffness region or the sub-harmonic response due to the nonlinearity.
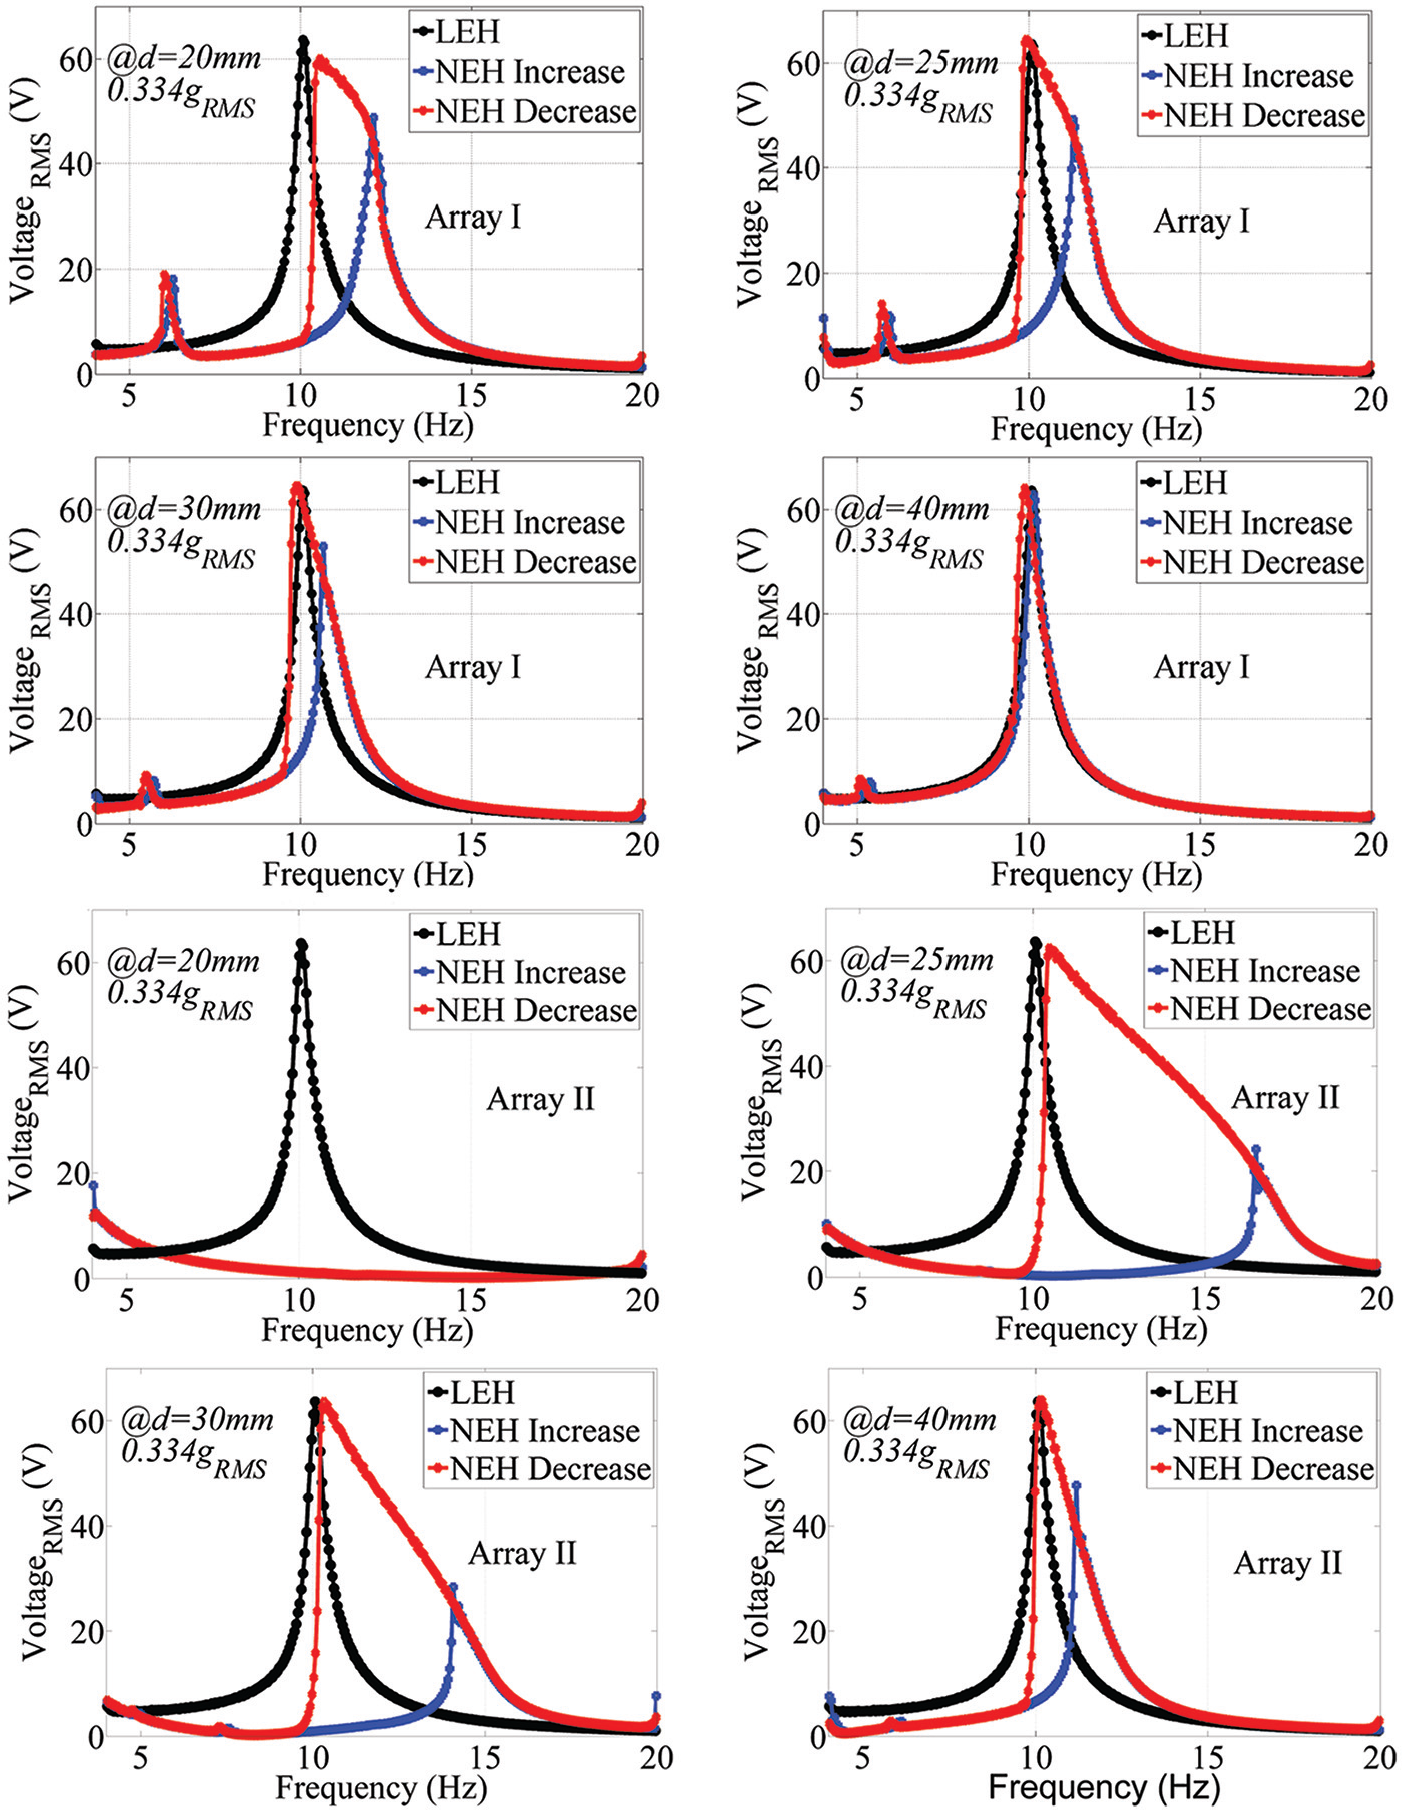
Experimental frequency sweep results for the NEH with Arrays I and II.
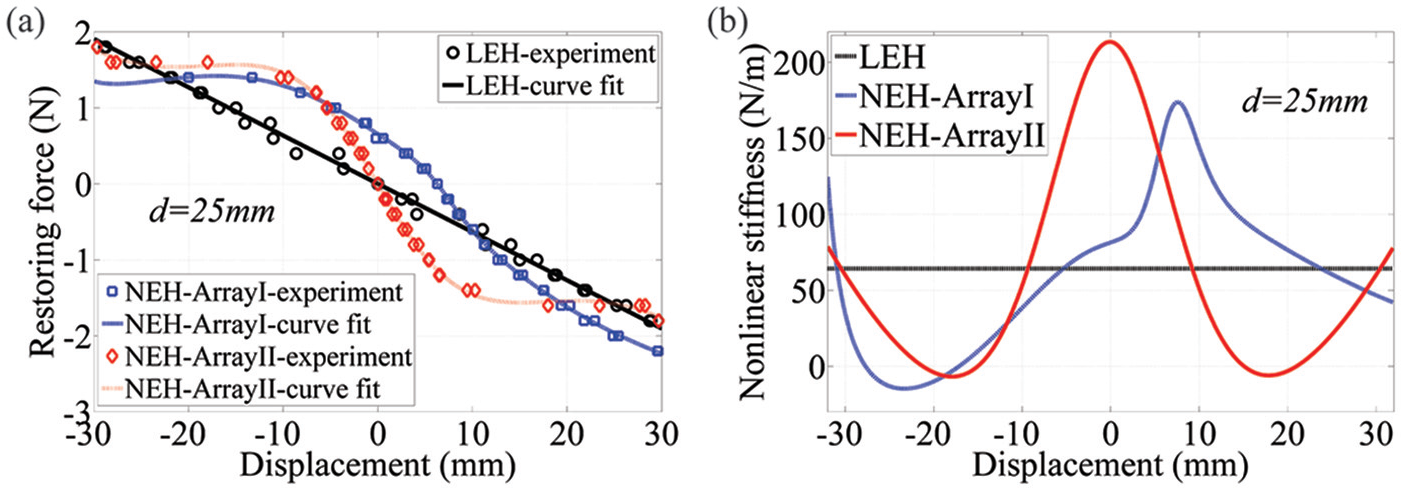
(a) Restoring force and (b) nonlinear stiffness of the NEH.
In order to quantitatively evaluate the outputs, the half-power bandwidth is adopted, which defines two 3-dB cut-off frequencies: f1 and f2 (Sebald et al., 2011). The output bandwidth from the decreasing sweep is therefore defined as

The calculated bandwidth as a function of d is presented in Figure 4. It can readily be seen that Array II has a broader bandwidth than Array I, indicating the advantage from the structure symmetry. And both of them excel their LEH counterparts. As such, Array II will be used for the following input-dependent performance study. Note that even though decreasing d results in increased magnetic force and broadened bandwidth, under certain excitation conditions, the NEH may not be able to resonate if the magnetic force is too strong.
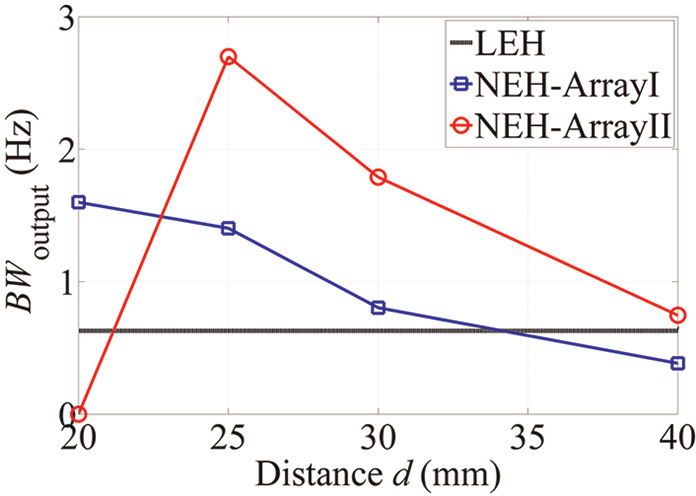
Calculated output bandwidth of the NEH with Array I and Array II.
Input-dependent performance study of the NEH under excitation Input I
Although the frequency sweep and the as-defined half-power bandwidth shed light on the comparison, the design and the characterization of the NEH should be pursued to better understand its performance dependence on input excitations to make practical sense. It is easy to understand that the NEH is capable of harvesting energy more efficiently from excitations under a slow-frequency variation because the decreasing frequency sweep shows broadened responses under such cases. In different applications, the excitations have different input bandwidths and the NEH consequently has different performance. The frequency-varying excitation is a typical vibration phenomenon often seen in ambient environment. For instance, the resonant frequency of an arch dam varies with the water level in it (Darbre et al., 2000), and the vibration frequency of an engine depends on its rotation speed. However, from a practical sense, the frequency drift of an ambient excitation is limited to a certain range, which we define as the input bandwidth, instead of covering a large band as frequency sweep does. Since the output performance is largely dependent on its input bandwidth, further investigations on their relationships are demanded. Here, Input I is defined as a periodic varying frequency sinusoidal wave at a constant acceleration magnitude A that is expressed as

The frequency f(t) varies with time t periodically in the form of
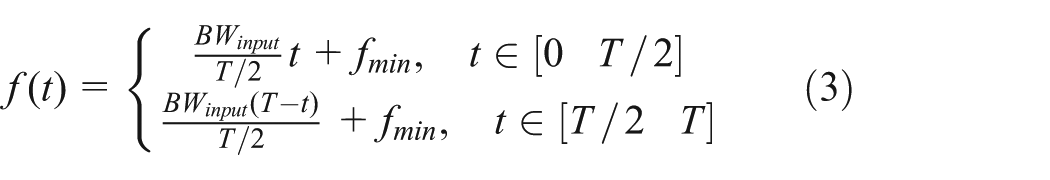
Here, BWinput denotes the input bandwidth, T corresponds to the frequency-varying period, and fmin is the left end point of the input frequency band.
One can notice that the average voltage output over a certain input bandwidth BWinput can be calculated using the same way in which RMS voltage is calculated, based on equations (2) and (3). With the relation between the frequency and the time expressed as equation (3), the average output becomes
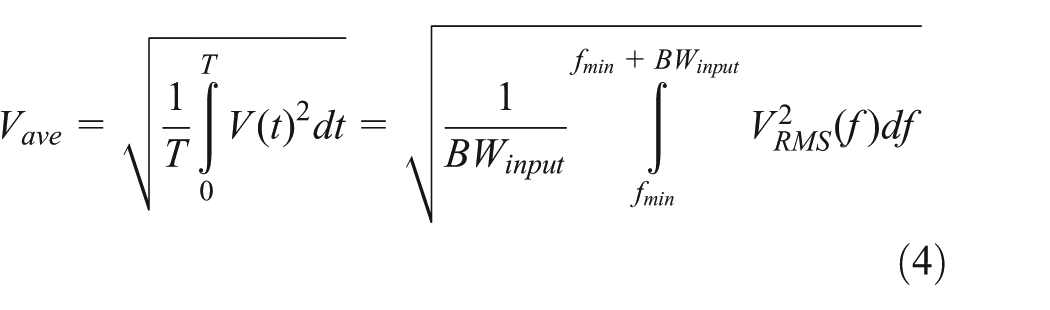
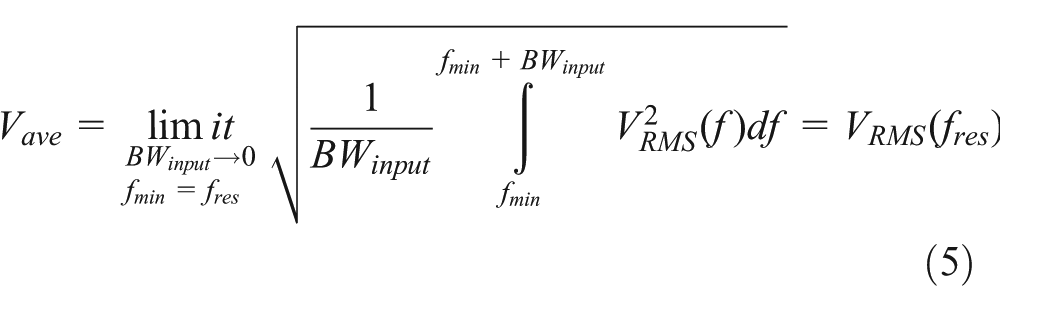
Here, VRMS (f) is the frequency-dependent RMS voltage output. More specifically, it can be obtained through the decreasing sweep curve shown in Figure 2. The input-dependent RMS voltage output can therefore be calculated numerically using equation (4), and the results are illustrated in Figure 5(a). For the LEH, one could expect the maximal RMS voltage output when BWinput is infinitely small and includes the resonant frequency, that is, the excitation is a single harmonic signal at the harvester’s resonant frequency, fres, in which case equation (4) turns into
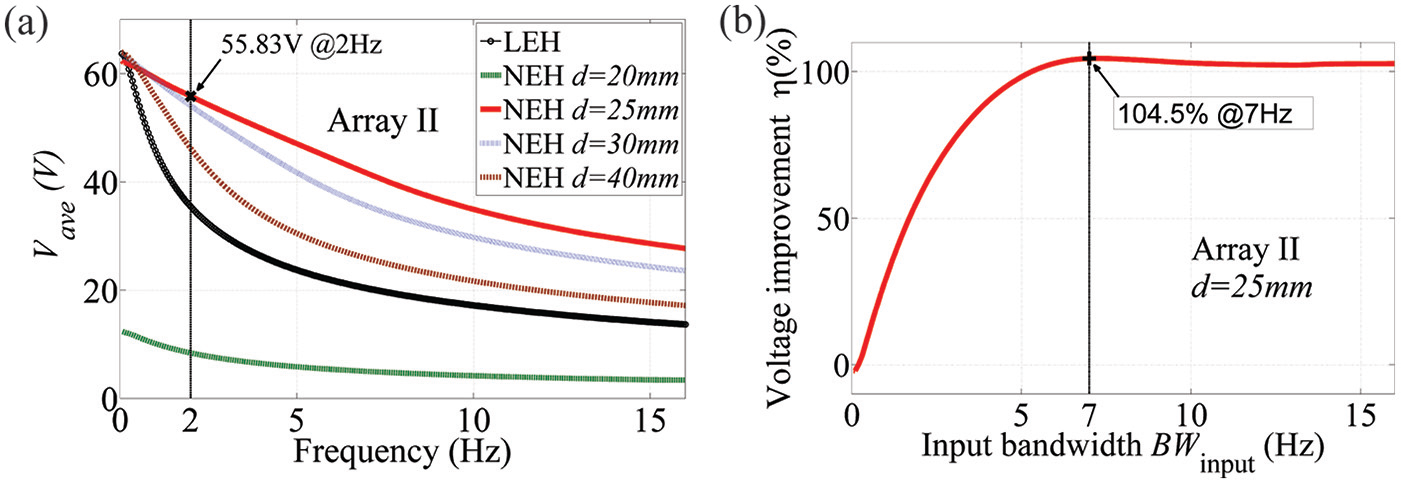
The average voltage output and improvement: (a) the average voltage output of the LEH and NEH under Input I and (b) the average voltage output improvement of the NEH (with Array II at d = 25 mm) compared with the LEH under Input I.
The output of the LEH decreases dramatically under either an off-resonance frequency excitation or a large input-bandwidth excitation. Therefore, the LEH is demonstrated with low-efficiency under frequency-varying excitations. For the NEH, the bandwidth is set right to the jump down point at the decreasing sweep curve. One can observe that the voltage output decreases in a much slower way along with the increase in the input bandwidth, in particularly, at d = 25 mm, where vibration energy could be harvested much more efficiently even with a much larger input bandwidth.
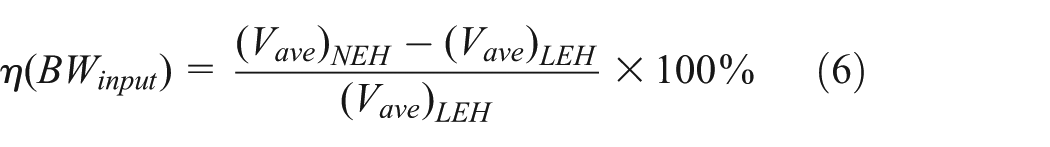
To make a clearer comparison, the voltage output improvement of the NEH (at d = 25 mm) comparing to the LEH is defined as a function of BWinput in the form of
Their comparison results are shown in Figure 5(b). As the input bandwidth increases, the voltage output improvement increases drastically until it reaches about 100% around 6 Hz input bandwidth and then it almost holds constant, which means that the NEH can improve the voltage output by about 100% (the power output by 300%) when the input bandwidth is larger than 6 Hz but smaller than 16 Hz (the frequency sweep band). The maximal voltage improvement of 104.5% (power output improvement is 318.2%) is attained under excitation of 0.334g and bandwidth of 7 Hz. However, the voltage improvement will also be saturated at 7 Hz and above.
The stability of the large-amplitude periodic motion is critical to maintain a decent harvesting performance (Erturk et al., 2009; Stanton et al., 2010). In order to further validate the results shown in Figure 5, the RMS voltage outputs under Input I with BWinput = 2 Hz (fmin = 10.6 Hz) and T = 40 s are measured and listed in Figure 6. The input frequency (the red line in Figure 6) is first decreased from 20 to 10.6 Hz using decreasing sweep to set the NEH work at large-amplitude motion and then Input I is used for the excitation where the input frequency drifts between 10.6 and 12.6 Hz periodically. As shown in Figure 5(b), the maximal voltage improvement of 104.5% is attained at 7 Hz input bandwidth but also saturated at 7 Hz and above. A 2-Hz bandwidth is thus chosen for the analysis. Figure 6 shows that the large-amplitude motion is maintained under periodic frequency-varying excitation. It also shows a 52.6 V average voltage output in a period under excitation of 0.334g and bandwidth of 2 Hz. This value is slightly smaller than the one from Figure 5(a) of 55.8 V, because here fmin is chosen to be a little bit larger than the jump down point to ensure its stability.
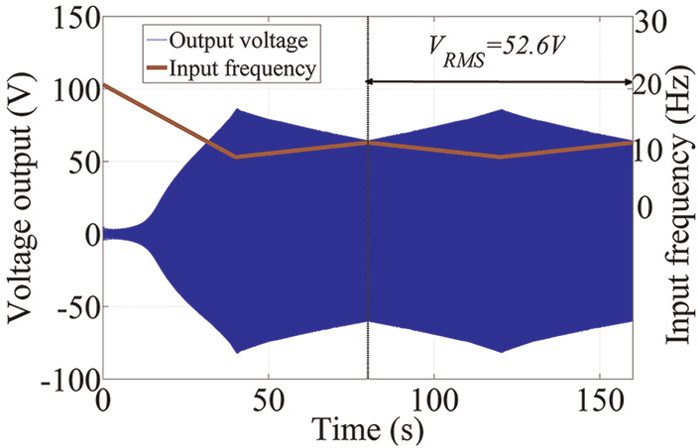
The voltage output of the NEH (with Array II at d = 25 mm) in time domain under Input I with 2 Hz input bandwidth.
Input-dependent performance study of the NEH under excitation Input II
Another typical ambient vibrational source is the one consisting of multiple-frequency components (Roundy et al., 2003), but different from random or noise activated excitations, it (named Input II) usually has one principal component determined by its base structure and finite small-amplitude non-principal components. Excitation Input II is thus defined as
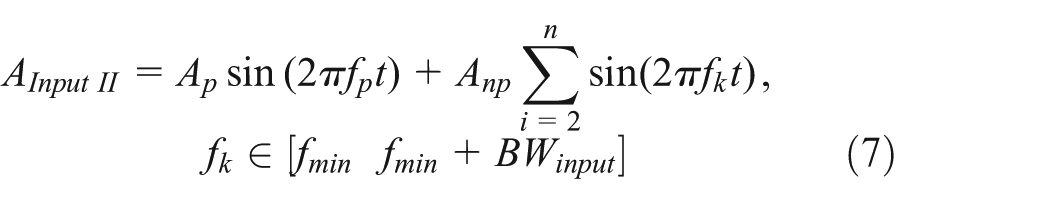
where Ap and fp are the amplitude and the frequency of the principal component, respectively. fk is the frequency of the non-principal component and n is the number of all components. In order to make a fair comparison, the amplitudes of all non-principal components are set to be the same, denoted as Anp. The frequencies of the principal component and non-principal components are all included in the frequency band, [fmin fmin + BWinput].
For the LEH, its output is the superposition of all responses corresponding to each input component due to the nature of the additivity of a linear system. However, one could not expect the same for the NEH because of the uncertainty in nonlinear system response (Thompson and Stewart, 2002). In this experiment, we choose n = 10 and BWinput = 2 Hz for further analysis. Frequencies are evenly distributed in the frequency band with a 0.2-Hz frequency interval. For the LEH, the selected frequency band is from 9.1 to 11.1 Hz, and 10.1 Hz is the principal frequency. For the NEH, the selected frequency band is from 10.6 to 12.6 Hz, and 10.6 Hz is the principal frequency. Ap is set as 0.4 and 0.5 and Anp varies. The voltage output at Anp = 0 is used as the baseline for the normalization of the results, that is

Vnormalized is the normalized voltage output, V(Anp) is the voltage output at different values of Anp, and V(Anp = 0) is the voltage output at Anp = 0. Note that, here Ap and Anp are input voltage amplitudes to the power amplifier, instead of the measured acceleration amplitudes.
Figure 7 shows the experimental outputs at different Ap and Anp levels. The voltage output of the LEH goes up a little bit as Anp increases because the output voltage corresponding to the off-resonance excitation is indistinctive. However, significant improvement could be achieved if all the non-principal components are very close to the resonant frequency. Also, the normalized outputs at Ap = 0.4 and 0.5 are identical due to the linear nature of LEH. As for the NEH, the output is independent of Anp/Ap when Anp/Ap is very small (<0.05). However, when Anp/Ap becomes larger than 0.05, the output suddenly falls down to a small-amplitude response. It is a fair conclusion to make from the results that to maintain the large-amplitude vibration of the proposed NEH under Input II, Anp/Ap should be relatively small so that the minimum excitation amplitude in time domain will not be too small to trigger the jump down because a minimal excitation level, or we can say, the excitation threshold, is necessary to maintain certain large-amplitude motions or a high-energy orbit. The results are in agreement with Stanton’s work, where the increasing and decreasing amplitude sweep results revealed the dependence of vibration amplitude on the excitation amplitude (Stanton et al., 2010). Once the excitation level falls below the threshold, the jump down occurs. Even though a large excitation amplitude is followed after the jump down, it is not able to retrieve the large-amplitude vibration unless the large excitation amplitude is maintained for the harvester to pass the transition period and get back the high-energy orbit, which is not the case here (Stanton et al., 2010). Figure 8 shows more details about the measured acceleration and voltage output in time domain. Decreasing frequency sweep is used to set the harvester to work at large-amplitude vibration, following the excitation of Input II. Figure 8(a) indicates the acceleration and voltage output at Ap = 0.4 and Anp = 0.02. The minimum acceleration amplitude is 0.47g at Anp = 0.02 and the large-amplitude vibration is maintained. Nevertheless, when Anp is 0.07, shown in Figure 8(b), the minimum amplitude falls to 0.34g, resulting in the jump down of the vibration. As one can also see from Figure 7, the maximal allowable Anp/Ap is 0.05 at Ap = 0.4 and 0.14 at Ap = 0.5. The phenomenon is easy to understand since for a certain excitation threshold, larger Ap is more resistant to Anp, therefore larger Anp/Ap is allowable.
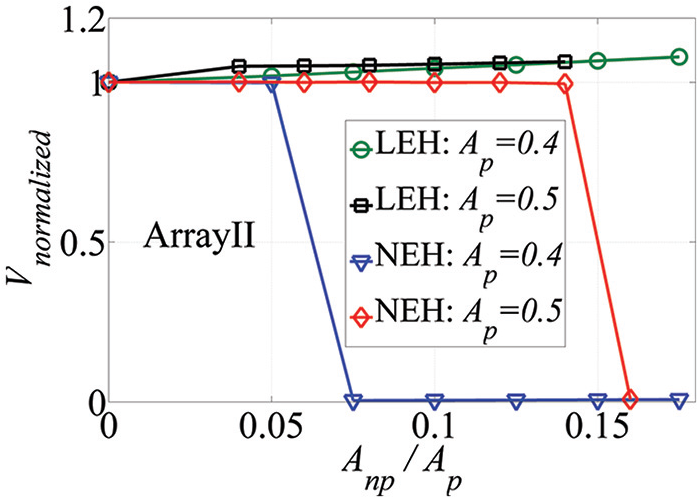
The voltage output of the LEH and NEH (with Array II at d = 25 mm) under Input II.
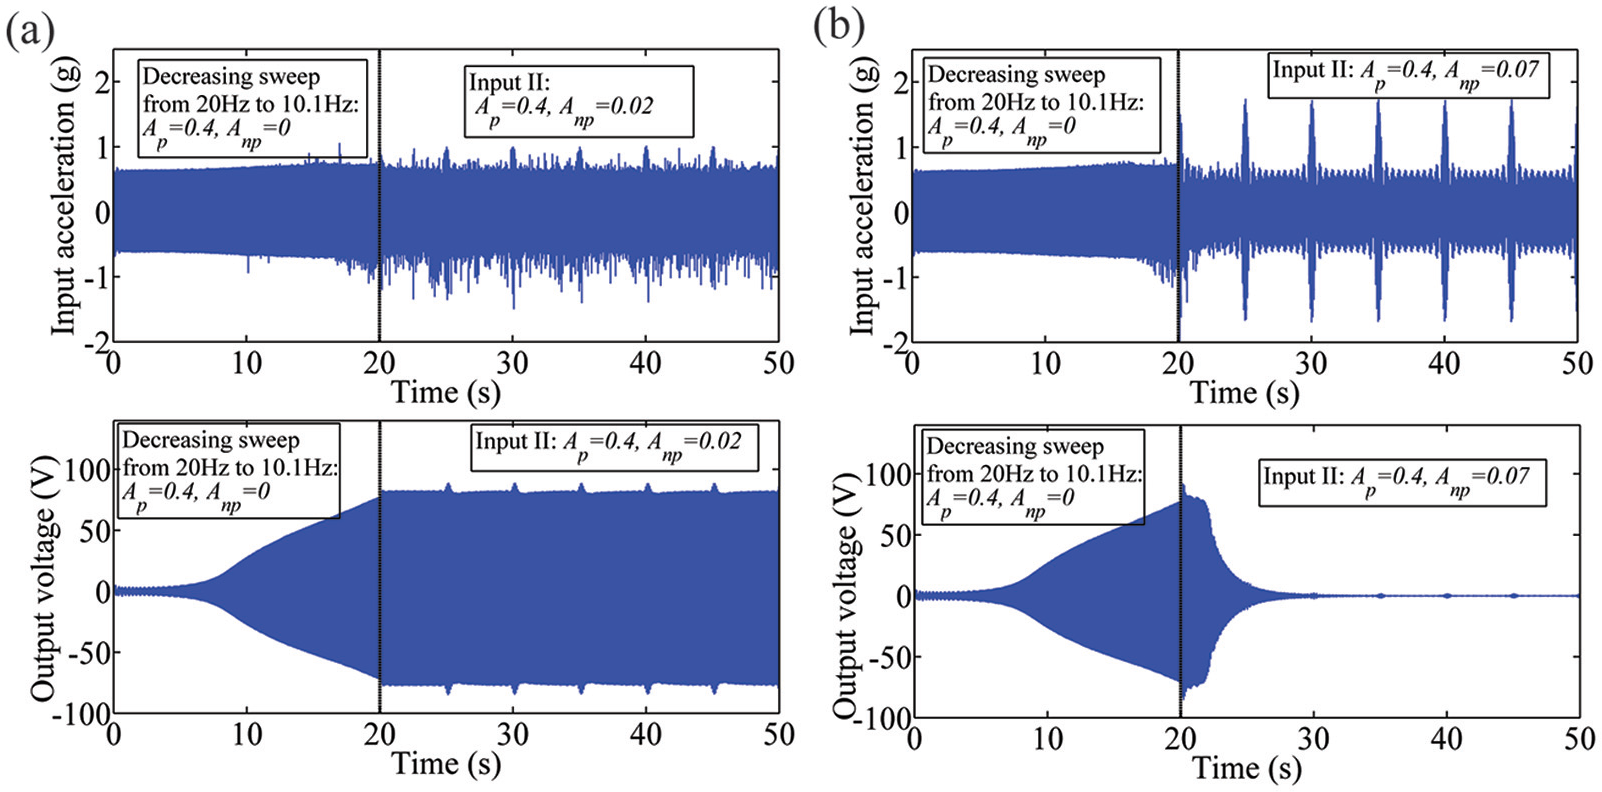
The measured acceleration and voltage output at (a) Ap = 0.4, Anp = 0.02 and (b) Ap = 0.4, Anp = 0.07.
Even dense frequencies of non-principal components could be chosen for analysis by reducing the frequency interval, the amplitude of Input II will still encounter a minimum in time domain to trigger jump down when the minimum is smaller than the threshold. As expected, when d is increased, the characteristic of the nonlinear harvester will be close to that of the linear harvester since the magnetic force is decreased. Increasing d enables a larger allowable value of Anp/Ap, but still, the nonlinear harvester would not excel the liner harvester under Input II. Therefore, for input excitation with multiple-frequency components, like Input II, it would be better to choose a multiple-beam structure, as introduced by Xue et al. (2008) and Kim et al. (2011).
Conclusion
This article studies the input-dependent performance of a piezoelectric NEH. Two external magnet arrays (Array I and II) are integrated into the NEH, respectively, for experimental studies. Array II is proved to have broader half-power output bandwidth under frequency sweep test. The input-dependent performance of the NEH with Array II is analyzed and verified using two types of excitation inputs (Input I and Input II). The average voltage outputs under Input I with different input bandwidths are obtained, and it is concluded that the performance of the NEH outperforms its LEH counterparts: RMS voltage output increases by 104.5% (power output increases by 318.2%) under excitation of 0.334g (RMS) and bandwidth of 7 Hz. No advantage is observed for the NEH when it is excited under Input II. However, thorough study shows that the amplitude of the principal component (Ap) and amplitude ratio of the non-principal components to the principal component (Anp/Ap) are essential to keep the minimum excitation acceleration amplitude above the threshold for the proposed NEH to work at large-amplitude periodic motions. Our work here provides a useful method to evaluate the dependence of output performance on various input excitations. Valuable insights into the design, characterization, and the application of the NEH could be derived when a priori knowledge of the vibration input is available.
Footnotes
Declaration of Conflicting Interests
The author(s) declared no potential conflicts of interest with respect to the research, authorship, and/or publication of this article.
Funding
The author(s) disclosed receipt of the following financial support for the research, authorship, and/or publication of this article: The authors would like to thank the support of DOE ARPA-E through “Electroactive Smart Air-Conditioner Vent Registers (eSAVER) for Improved Personal Comfort and Reduced Electricity Consumption” under grant DOE-AR0000531.