
Abstract
The behavior of film-type piezoelectric energy harvesters under simultaneous aerodynamic and base excitation was experimentally investigated. Two flutter type piezoelectric film transducers (LDT0-028K and LDT1-028K) were excited with the 31 excitation mode. The aerodynamic excitation was produced by a centrifugal fan. The base excitation was produced by a cone speaker driven by sinusoidal voltage waveforms in the frequency range of 20 to 250 Hz. This frequency range includes the two transducers’ resonant frequencies. The voltage output of the harvesters was monitored by an oscilloscope and the base excitation was monitored with acceleration measurements. The measured output voltage signals were analyzed by Fast Fourier Transformation. The tip deflection of the piezo-films was monitored with long exposure photography. Harvesting power output was estimated by simple calculations. The results are discussed aiming to support the optimal design of vibration energy harvesting layouts with piezoelectric transducers. To this end, information was extracted about the exploitable bandwidth of piezoelectric films.
1. Introduction
1.1. Background and context
The need for wireless sensor networks (WSNs) use is rapidly growing due to the multitude of automations introduced in everyday applications and the extension of their use in various industrial, domestic, environmental and health applications. Each one of a WSN’s nodes consists of a transceiver, a microcontroller and an energy source and is usually connected with several sensors. The growing demand for WSNs pushes to the implementation of energy harvesting applications in order to lower their environmental footprint, cost and maintenance needs by reducing battery use. Efforts are also being made to optimize WSNs’ communication schemes to integrate energy harvesters (Ulukus et al., 2015).
Piezoelectric energy harvesters (PEH) aim to extract ambient vibration energy and convert it to an exploitable energy form. Potential ambient vibration sources for piezoelectric energy harvesters include mechanical excitations transferred by vibrating equipment, vibration induced by fluid flow and wave energy. Such sources are widely available in rotating machinery, railways, waves, and flowing liquids and gases.
Mechanical vibration sources are characterized by their vibrations’ amplitude, maximum acceleration and frequency range. In flow-induced vibration of harvesters, sources are characterized by the type of flow phenomena or instabilities that cause the vibration. Some flow phenomena usually exploited in PEH are fluttering, vortex-induced vibrations and transverse and wake galloping (Abdelkefi, 2016). A large part of experimental PEH applications concentrates on aerodynamic excitation (Safaei et al., 2019).
Piezoelectric transducers’ characteristics have to be considered and analyzed to identify their possible applications in vibration energy harvesting and aid the design process. A limiting characteristic of piezoelectric transducers is the strong dependence of their power output on the excitation frequency and how far it is from their resonance frequency. This makes them suitable for applications with machinery presenting stable vibration frequencies such as turbomachinery rotating at constant speeds. There are also strategies to increase the working bandwidth of linear generators like generator arrays and the use of complex systems with two or more resonance frequencies (Twiefel and Westermann, 2013).
The bandwidth limitation seems to be less prominent in PEHs excited by fluid flow. The parameters that influence the power output of PEHs excited by flow-induced vibration are the average flow speed, turbulence intensity, the harvester’s distance and orientation with respect to the flow source as well as the distance from walls (Goushcha et al., 2015). An attempt to visualize the main characteristics of PEH affecting their behavior in the various excitation modes is presented in Table 1. There is a need for extensive investigation of the PEH characteristics affecting their operation under combined excitation.
Modes of excitation of a Piezoelectric Energy Harvester and related characteristics.

The output of piezoelectric energy transducers is in the form of an AC voltage. Hence, the use of rectification and power management circuits is necessary. Power losses inserted by these circuits can be critical because of the small power scale. Maximum power transfer in rectifying circuits is achieved when the load impedance is the complex conjugate of the source impedance (Priya et al., 2017). The source impedance of a piezoelectric transducer changes as the operating conditions change. The studied strategy for impedance matching and power maximization is maximum power point tracking (MPPT). MPPT requires the control of one or more tuning parameters with respect to the vibration frequency (Brenes et al., 2020) to achieve impedance matching. A popular impedance matching strategy is synchronized switch harvesting on inductor (SSHI) (Shu et al., 2007), where the optimized parameter is the output impedance.
The above characteristics are under study in order to assist the design of autonomous applications. In order to predict the piezoelectric beams’ behavior and guide the optimization process, the computational modeling of PEH beams has been attempted by several research groups. PEH modeling presents peculiarities as it is a multidisciplinary problem including structural dynamics, piezoelectric transduction and in some cases flow—structure interaction. An early attempt of the piezoelectric beam’s vibration modeling was made with an 1-D electromechanically coupled model by du Toit et al. (2005). The piezoelectric beam’s single degree of freedom (SDOF) modeling was found to be inaccurate and a correction factor has been proposed (Erturk and Inman, 2008b) to improve the accuracy using the Euler-Bernoulli beam approach. The model included strain-rate, Kelvin-Voigt and viscous air damping. Today, the distributed parameter electromechanical model by Erturk and Inman (Erturk and Inman, 2008a) is widely accepted and used for PEH modeling. The model assumes excitation with base motion in the form of translation in the transverse direction and small rotation.
It has been observed in earlier PEH experiments that base vibrations can be transported to an energy harvester through its base (Stamatellou and Kalfas, 2019). In that case, there is a simultaneous aerodynamic and base excitation acting on the harvester. The base excitation in energy harvesting applications can be created unintendedly with possible sources being unbalanced fans and other rotating devices, resonating parts and operation problems of wind tunnels used in experiments. Because of the small size of energy harvesting test rigs, such disturbances can have a significant influence on the energy harvesters’ power output. It is possible that experimental results of PEHs subjected to flow excitations used for model validation also contain base excitation.
The “general 1-D model of piezoelectric vibration energy” with a base excitation only was presented in the pioneering work of duToit et al. (2005). A simple 1-D model (Figure 1) for the combined aerodynamic and base excitation of a piezoelectric film transducer can be given with the electromechanically coupled equations:
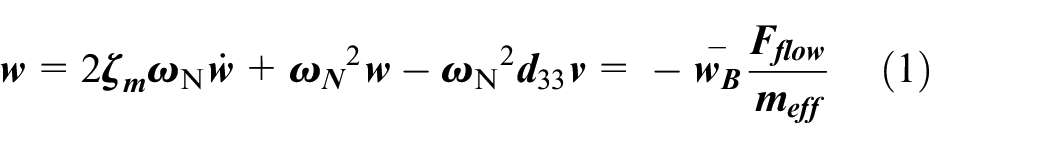

Where w is the harvester’s displacement, wB is the base displacement and v is the voltage. ζm is the mechanical damping ratio, ωN is the natural frequency of the device. The piezoelectric element has a mass mp and is connected to a power-harvesting circuit, modeled simply as a resistor. M is a proof mass. The approximate effective mass is meff = M+mp, and d33 is the piezoelectric constant relating charge density to stress. The 33 mode is used in these equations because the model is 1-D. Extension of the model to include flow induced excitation can be made in a simplified way by adding Fflow as an average, fluctuating aerodynamic force acting on the piezo-film.
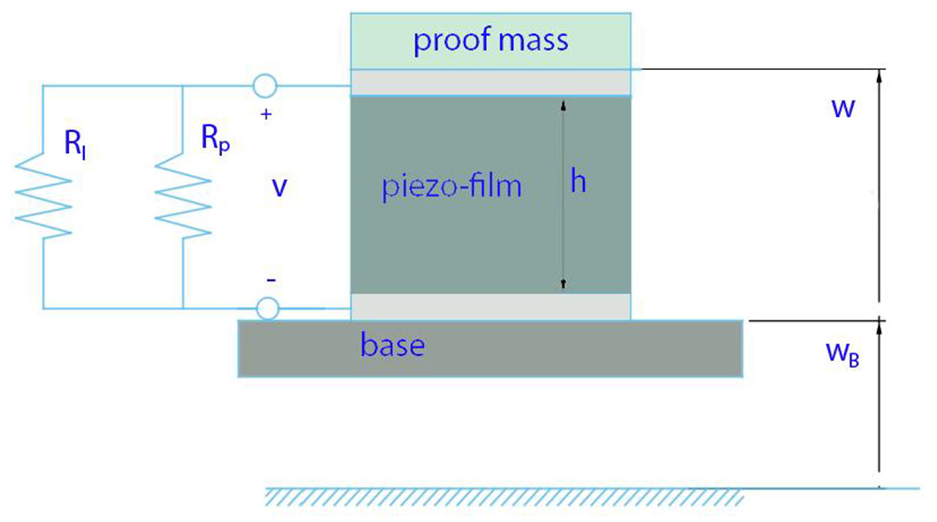
Schematic of the 1-D model according to duToit et al. (2005).
The resonance frequency of the 1-D device is given by:

where Ap is the effective area of the piezoelectric element and h is the height of the beam.

As regards the computational study of the simultaneous contribution of mechanical and aerodynamic excitation of piezoelectric energy harvesters, there exist limited published work. The first study concerning combined excitation of piezoelectric energy harvesters was published by Bibo and Daqaq (Bibo and Daqaq, 2013) and was a 5-D model. The study investigates a piezoelectric beam’s behavior around the onset of the flutter instability. Another study involving piezoelectric energy harvesting from galloping and base vibrations on a cantilever beam with a triangular geometry attached to its end was by Yan et al. (Yan et al., 2014). They found that the maximum levels of harvested power were accompanied by a minimum transverse displacement when varying the electrical load resistance. Another study on combined vortex-induced and base excitation by Dai et al. was validated using measurements including only vortex induced excitation of the harvester (Dai et al., 2014). Finally, a prototype piezoelectric energy harvester with a mechanical stopper that was excited by galloping and base vibrations was fabricated and tested in a narrow excitation frequency range of 6 Hz including its resonance (Zhao and Yang, 2018).
To the authors’ knowledge, the simultaneous contribution of base and aerodynamic excitations on a piezoelectric cantilever-type energy harvester has not been experimentally studied so far, and this study is a first attempt in this direction. Particularly, measurements are conducted using a flutter type piezoelectric energy harvester subjected to harmonic base excitation created by a cone speaker and aerodynamic excitation induced by a centrifugal fan. The measurement sets included first the separate use of the aerodynamic and base excitation and finally the use of the two excitation modes in cooperation.
An important aspect of this work is related to the optimal design of layouts to exploit available vibration energy in different ranges of base vibration and flow characteristics. The study aims to showcase the different characteristics of the two excitation types and the results of their combination on the voltage output, power output and frequency domain of the voltage output signals of PEHs. The results of these experiments are used to draw conclusions for the design of PEHs subjected to base, aerodynamic and combined excitation.
2. Experimental methods
2.1. Experimental set-up and equipment
The typical PEH system consists of the vibration source (either natural or artificially created), the mechanical system, mechanisms for motion transmission, the transducer, power electronics and energy management and control circuits (Zuo and Tang, 2013). A novel type of test rig was designed for the specific study, which employs a cone speaker as a vibration source and a centrifugal fan as a flow induced vibration source. The basic energy harvester part—the piezo-film transducer—was included for this initial investigation phase, without a power electronics part.
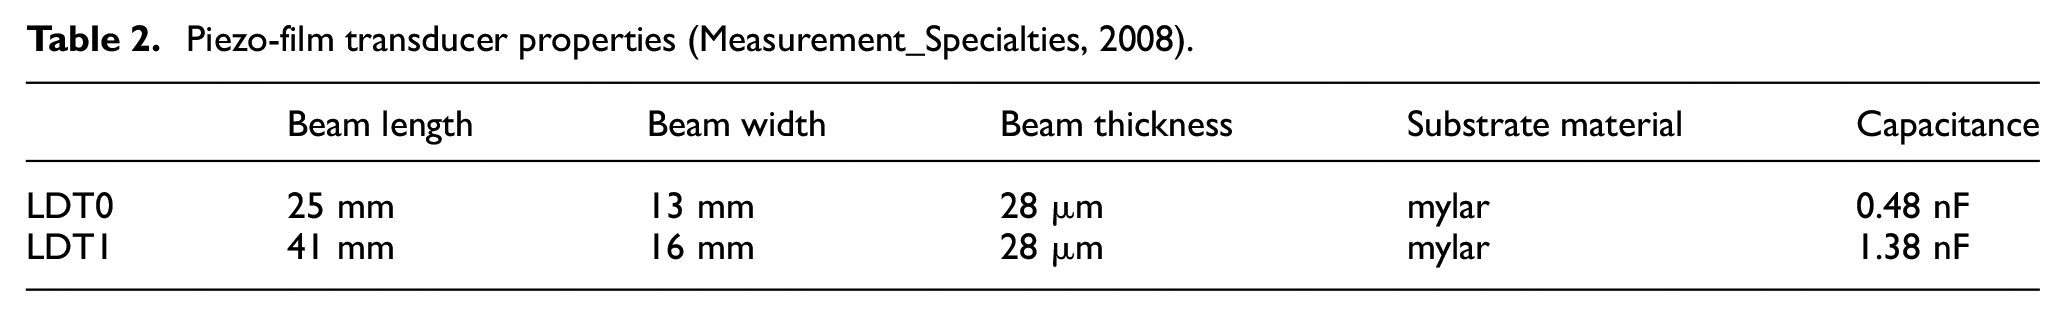
Two commercial Polyvinylidene fluoride (PVDF) film transducers, namely, LDT0-028K and LDT1-028K, were employed in the tests. These films are manufactured with a layer of the piezoelectric fluoropolymer material PVDF covered with protective layers of the polyester film Mylar. The use of off-the-shelf piezoelectric transducers is commonplace in energy harvesting experiments because of their low cost and ease of use. The two transducers’ characteristics are summarized in Table 2. The two piezo-films have the same thickness but different length and width as seen in the table.
Piezo-film transducer properties (Measurement_Specialties, 2008).
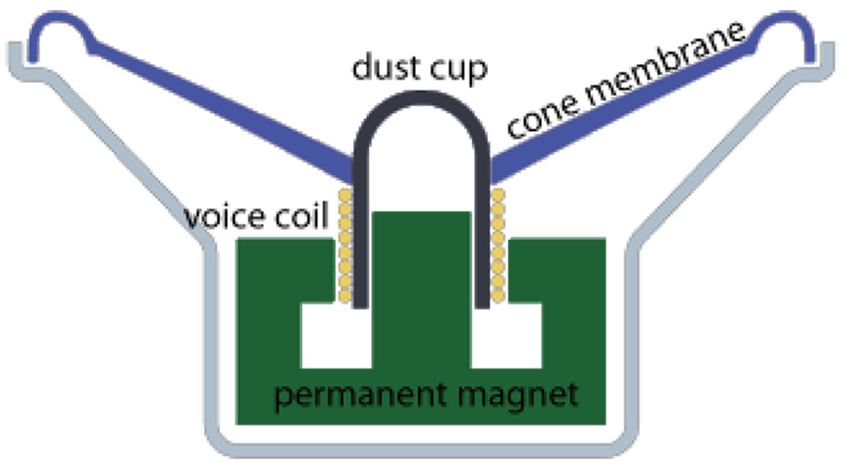
Two types of exciters were used in this study: a harmonic base exciter and an aerodynamic exciter. The base excitation was created by a signal generator (RIGOL DG-1022), two amplifiers (a vacuum tube pre-amplifier and a 2 × 25W RMS main amplifier) and a commercial cone speaker (50 W rms, 4 Ω impedance, 180 mm diameter). The piezo-film transducers are horizontally mounted on a wooden base as cantilever beams, with the base attached on the dust cup of the cone speaker (Figure 2).
Cone speaker schematic and operation principle.
The principle of operation of this type of speaker is seen in Figure 2. This is a typical cone driver consisting of a cone-shaped membrane with a dust cap in the middle. The membrane is attached to a voice coil which moves according to the forces of the magnetic field produced by the flow of current through the coil produced by the input signal. This vibrating motion is known as excursion of the driver. The motion is employed here to produce base excitation with varying amplitude (Hill, 2018). The greater excursion a driver has, the greater the volume of air it can move. To create low frequency sound, a significant volume of air needs to be pulsated. This can either be done by a larger speaker or by increasing driver excursion.
The signals input to the cone speaker were sinusoidal. The piezo-film’s base is mounted on the dust cap of the speaker as shown in Figure 3. The beam was mounted in a horizontal position and with zero incidence angle with respect to the average incoming flow velocity vectors.
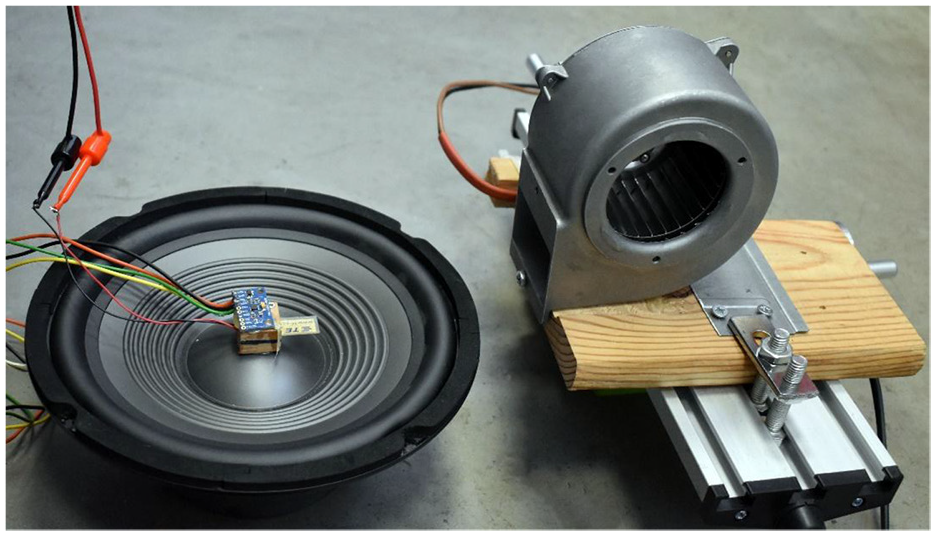
Cone speaker and centrifugal fan used as exciters.
The aerodynamic excitation was created by a centrifugal fan (28 W). The fan’s exit cross-section is 31 × 53 mm. The air flow at the fan’s exit is characterized by a mean velocity of 7 m/s in the horizontal direction. However due to the small size and length of the diffuser there exist significant pressure fluctuations and velocity pulsations in the vertical direction. These fluctuations excite the piezo-film to transverse vibrations. The fan was placed at a 100 mm distance from the piezo-film’s tip (Figures 3 and 4). A traverse base was used to place the centrifugal fan’s exit at the desirable distance from the piezoelectric film.
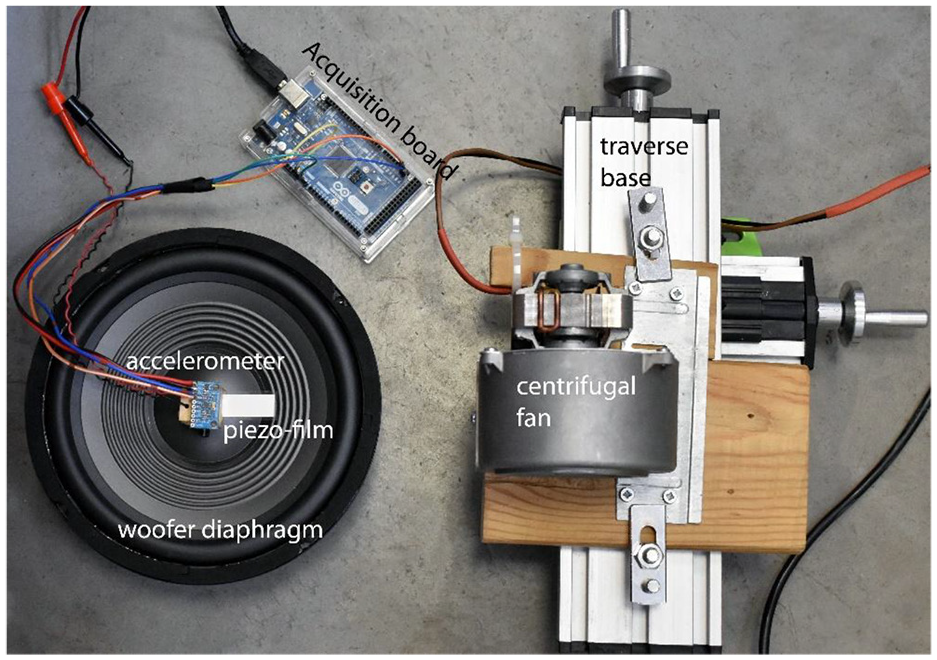
Experimental setup with the main parts indicated.
The output variables measured during the experiments were voltage and acceleration. The voltage output was measured in the piezo-film’s output leads by connecting to an oscilloscope (DSO3102A, Agilent Technologies). The measurement sampling frequency was 500 Hz. The voltage output is an important variable indicating the extractable power output of the harvester.
Acceleration measurements were taken with the MPU 9250 accelerometer connected to the Arduino Mega 2560 board. The sampling frequency was 250 Hz. The accelerometer was mounted on the wooden piezofilm’s base. It provides acceleration measurements in the longitudinal, lateral and normal directions. These measurements were used to observe the base vibration’s characteristics and determine the piezo-films’ sensitivity.
The main parts of the set-up are named in Figure 4 where their layout is shown.
A schematic of the overall experimental setup is shown in Figure 5, indicating the flow of the electrical signals among the various components.
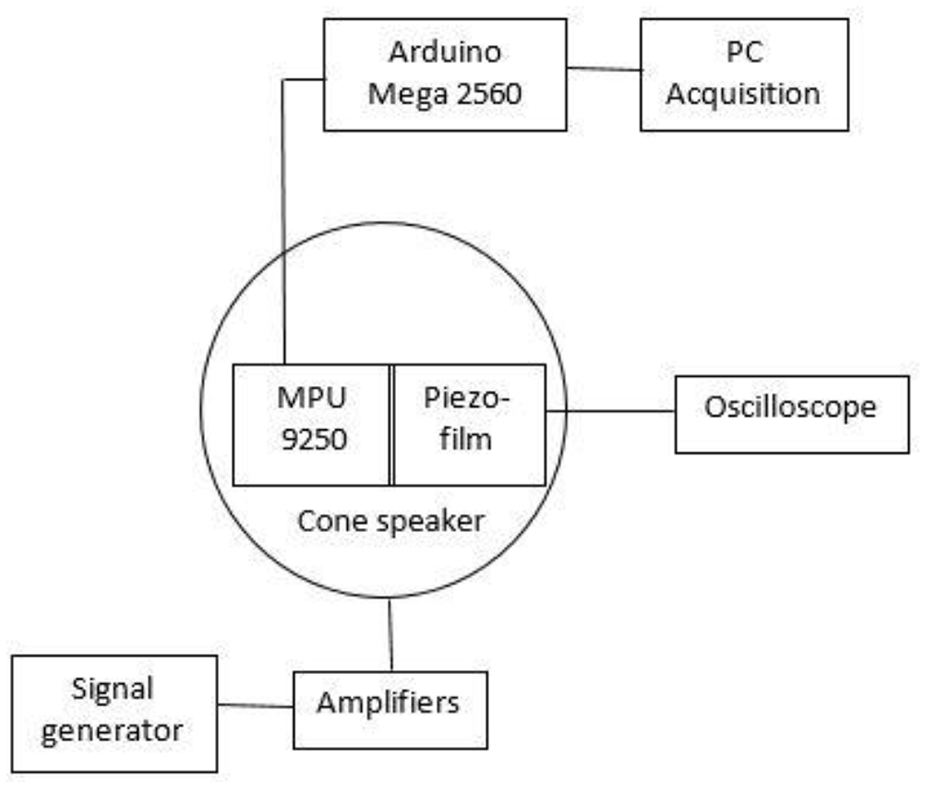
Schematic of the overall experimental set-up with signal flows.
2.2. Contribution of excitation types
First, the aerodynamic and base exciters’ effects on the piezoelectric transducers were separately tested. In order to monitor the cone speaker’s behavior across the frequency range of the experiments, acceleration measurements were performed. The results are presented in Figures 6 and 7. The cone driver is oscillating in the z direction which coincides with the poling direction of the piezoelectric transducers. Since the bending are in the axial direction, the piezo-film is excited in the 31 mode of operation. The 31 mode demonstrates a lower coupling coefficient than the 33 mode (Li and Liu, 2017).
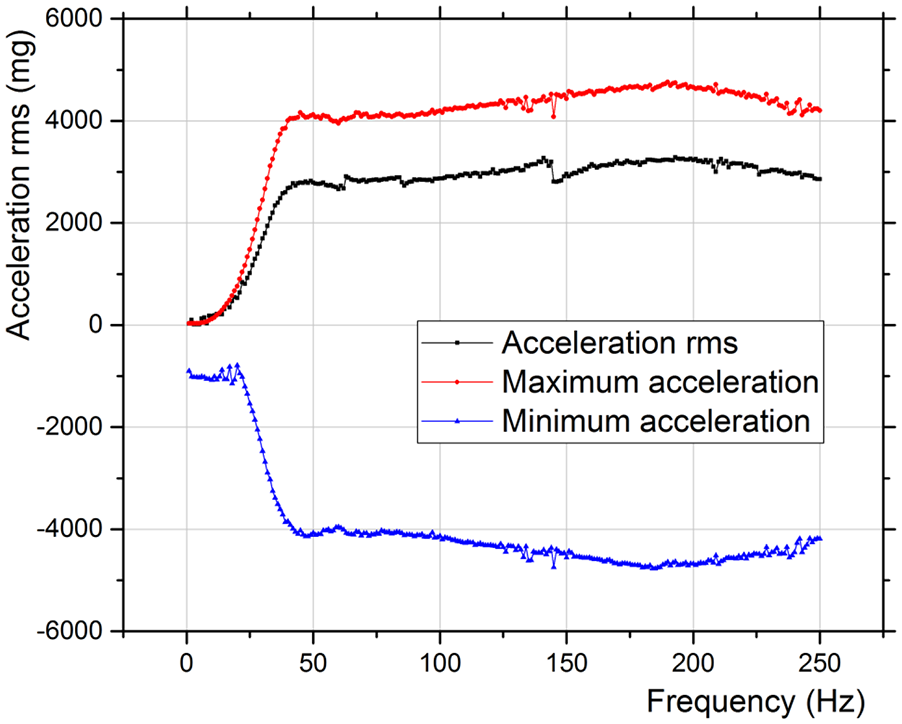
Cone speaker base acceleration as function of the frequency of excitation.
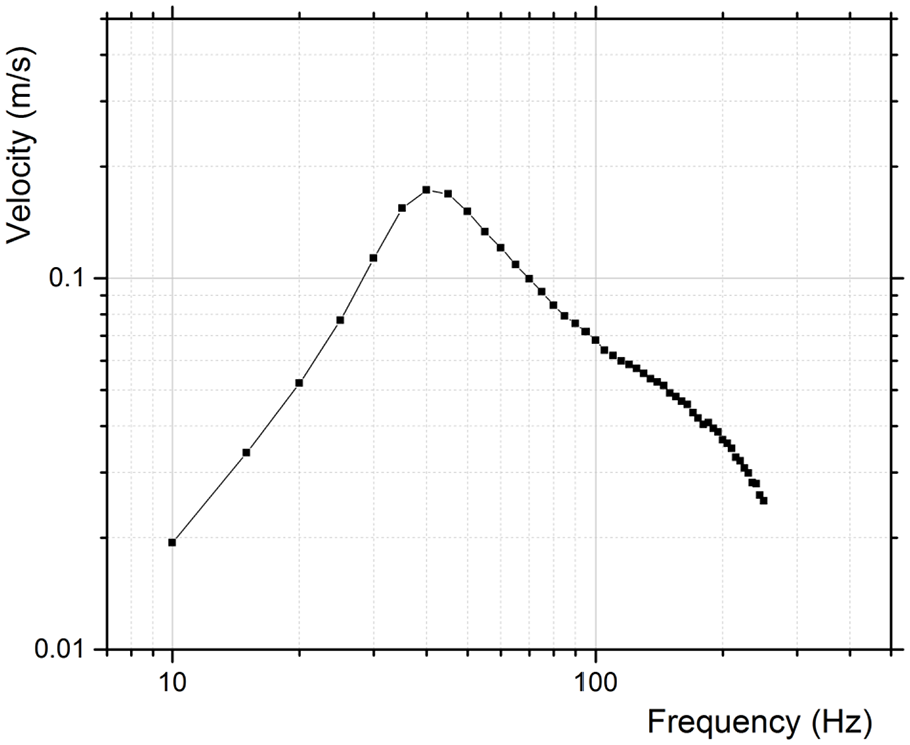
Excitation frequency—velocity plane of the cone speaker.
The cone speaker produced a sinusoidal response to the sinusoidal input signals that can be described as follows:

Where zB is the base position, z0 is the amplitude of vibration, Ω is the vibration frequency and t is the time.
The maximum and minimum acceleration were measured to be fairly constant at about ±4000 mg for the largest part of the measurement frequency range (60–250) Hz. The acceleration measurements were performed at a frequency range of 5 to 250 Hz that covers the range of the voltage output measurements that followed.
The maximum velocity of the driver for each frequency point is presented in Figure 7. The maximum velocity of the driver can be calculated as:

The performance curve (Maximum velocity vs. frequency) of the cone speaker is close to that of a typical shaker (de Silva, 2007) as presented in Figure 7.
The cone presents a constant displacement—amplitude region (10–40 Hz) a narrow constant velocity—amplitude region (40–60 Hz), and a constant acceleration—amplitude region (60–250 Hz). This behavior is produced by the principle of operation of the cone speaker. The speaker produces air displacement which is proportional to the driver excursion and to the excitation frequency. Therefore, producing the same sound intensity at low frequencies requires high excursion levels. This can be seen at the constant displacement-amplitude region in the figure by means of increasing maximum driver velocity. The maximum excursion is produced at the resonance frequency of the driver which is determined by the oscillating mass and the stiffness of the cone. The resonant frequency is less than the natural frequency of the driver.
Three amplification levels are employed in the experiments. The rms voltage input in the cone speaker is presented for each amplification level in Figure 8. Amplification level C was chosen to be very high -close to the maximum capacity of the amplifiers.
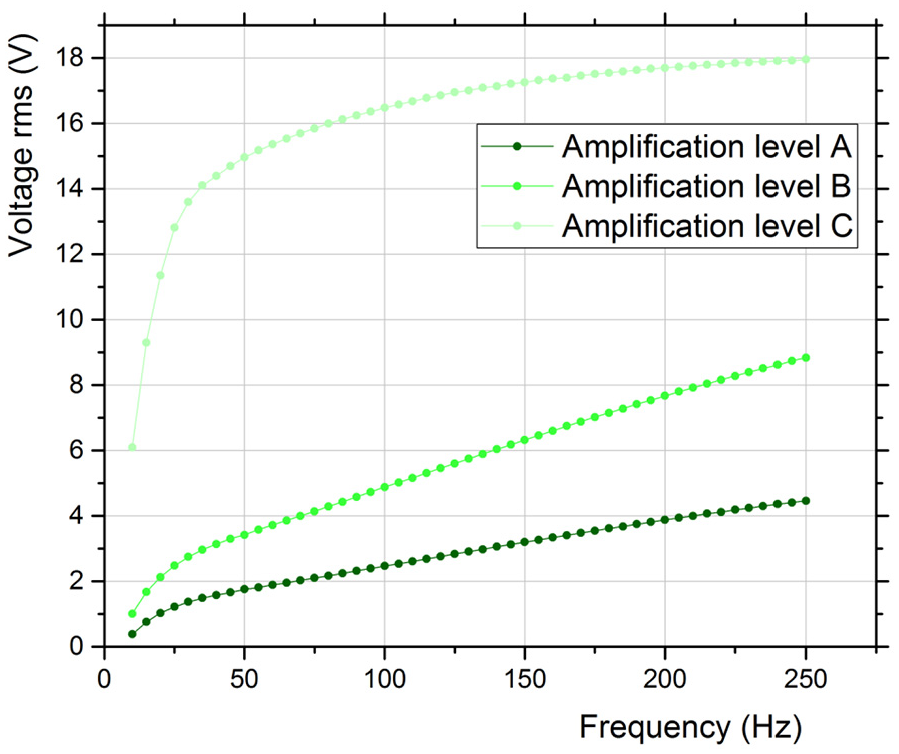
Amplification levels employed in the experiments.
As seen in this Figure, the amplification levels changed the amplitude of the sinusoidal voltage signal that was input to the cone speaker to produce the base excitation.
As regards the aerodynamic part, the harvester was subjected to steady aerodynamic excitation by the centrifugal fan at maximum speed of 2150 rpm and a mean flow velocity of 7 m/s measured at 100 mm distance from its exit.
2.3. Combined excitation measurements
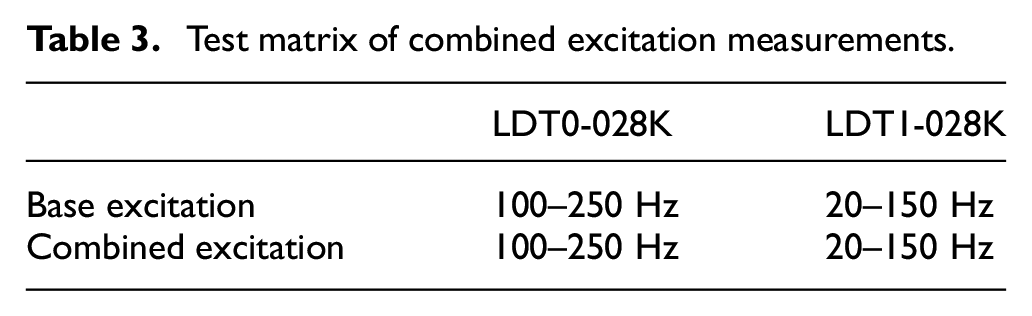
In the second phase of the experiments, the energy harvester was subjected to simultaneous aerodynamic and base excitation. The base frequency ranges of both the base and the combined excitation are shown in the test matrix (Table 3). The frequency ranges were selected to include the piezo-film’s resonance frequencies. The excitation frequency was varied with a step of 1 Hz in the ranges reported in Table 3.
Test matrix of combined excitation measurements.
3. Experimental results
3.1. Eigenfrequency and sensitivity of the transducers
First, a test was performed to determine the resonant frequency of the two transducers experimentally. For this test the piezo cantilever was subjected to a small impulse and was then allowed to vibrate freely. The resulting voltage waveform was monitored in the oscilloscope, as presented in Figure 9.
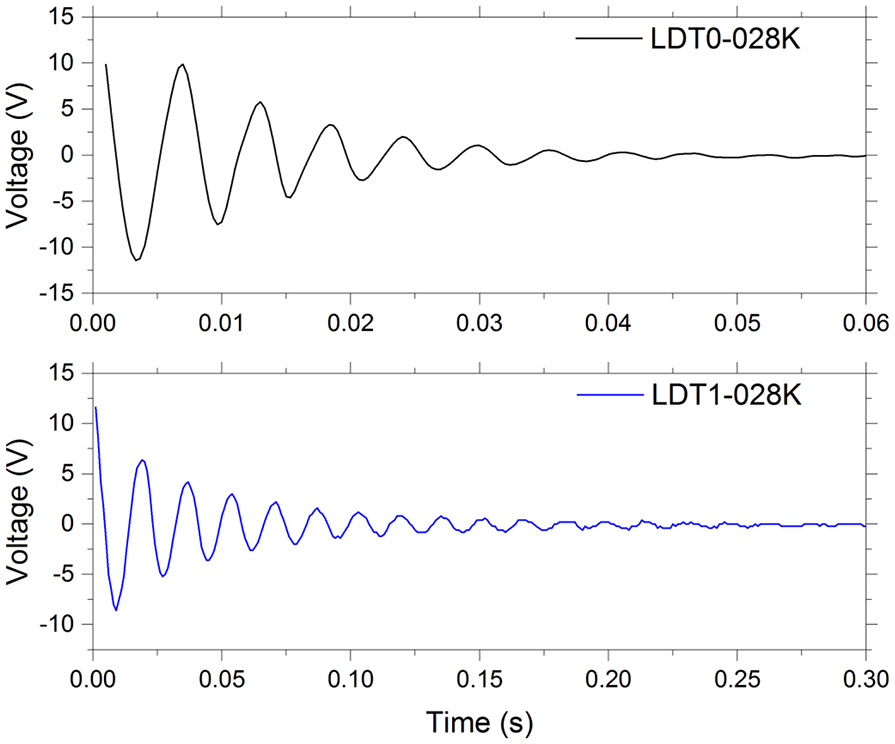
Voltage waveforms of the two piezo-films after a small impulse.
From these measurements, a natural frequency of 167 Hz was observed for LDT0-028K and 58 Hz for LDT1-028K, respectively.
The piezo-film’s manufacturer provides a sensitivity diagram that shows the effect of adding a variable mass to the sensor’s tip (Figure 10). The curve at far right corresponds to the LDT0-028K transducer without added mass as it is used in the present study. It can be seen that the addition of tip masses shifts the eigenfrequency of the piezo-film in lower frequencies. Sensitivity measurements were performed for the two transducers used in this study and are presented in Figure 11 as a function of the base excitation frequency.
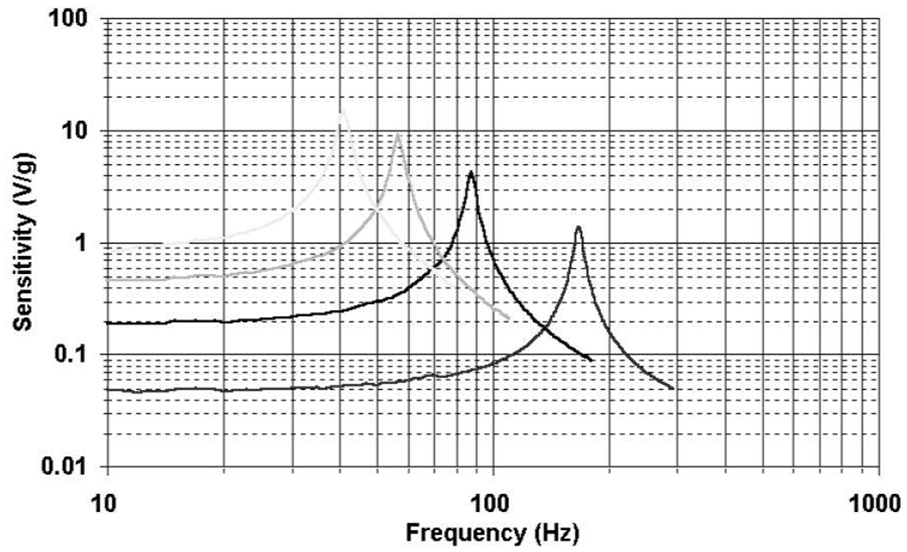
Sensitivity of LDT0-028K as given by its manufacturer (Measurement Specialties, 2008). The characteristic curve of the specific piezo-film without added mass is the far right.
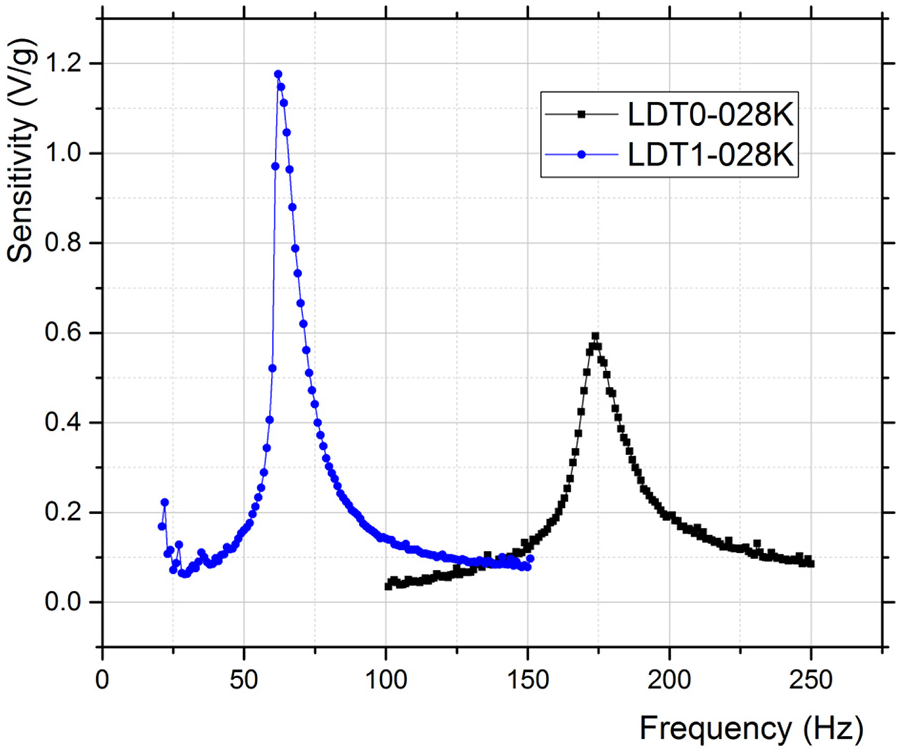
Sensitivity curves measured for LDT0-028K and LDT1-028K in the base excitation experiments.
In these measurements only base excitation was used. The sensitivity was calculated by dividing the maximum voltage of the output waveform by the maximum acceleration in each measurement point of base excitation frequency. Each transducer presents a characteristic sensitivity peak (1.18 V/g at 61 Hz for the LDT1-028K, 0.593 V/g at 174 Hz for the LDT0-028K). The base excitation frequency of the sensitivity peak of LDT0-028K is in good agreement with the data from the manufacturer’s datasheet (LDT0-028K) (Measurement_Specialties, 2008). However, the maximum sensitivity at resonance measured for this transducer is about half the value documented in (Measurement_Specialties, 2008) (see Figure 10). The LDT1-028K demonstrated a higher sensitivity than LDT0-028K around its eigenfrequency and peaks at a lower frequency than LDT0-028K. However, the authors did not succeed in finding similar sensitivity data from the manufacturer for LDT1-028K (TE_Connectivity, 2017). The two sensitivity peaks are observed at frequencies slightly higher than the natural frequencies observed during the measurements of Figure 9.
3.2. Output voltage measurements with base and combined excitation
The first in this series of measurements employed the base exciter only. The LDT0-028K piezo-film produced an output voltage of up to 1.84 V (rms) at resonance. Further, it produced voltage values exceeding 1 V (rms) at the frequency range of 160 to 180 Hz. The highest voltage output value was for only base excitation at resonance. The LDT1-028K produced the maximum output voltage of 3.6 V (rms) in combined excitation, while the output exceeded 1 V (rms) for the base excitation frequency range of 55 to 80 Hz. The voltage peaks were observed at 60 and 170 Hz signal frequencies for the two exciters as seen in Figure 12. It was observed that in LDT1-028K the combined excitation maximum voltage rms was at 60 Hz while for the base excitation it was at 61 Hz.
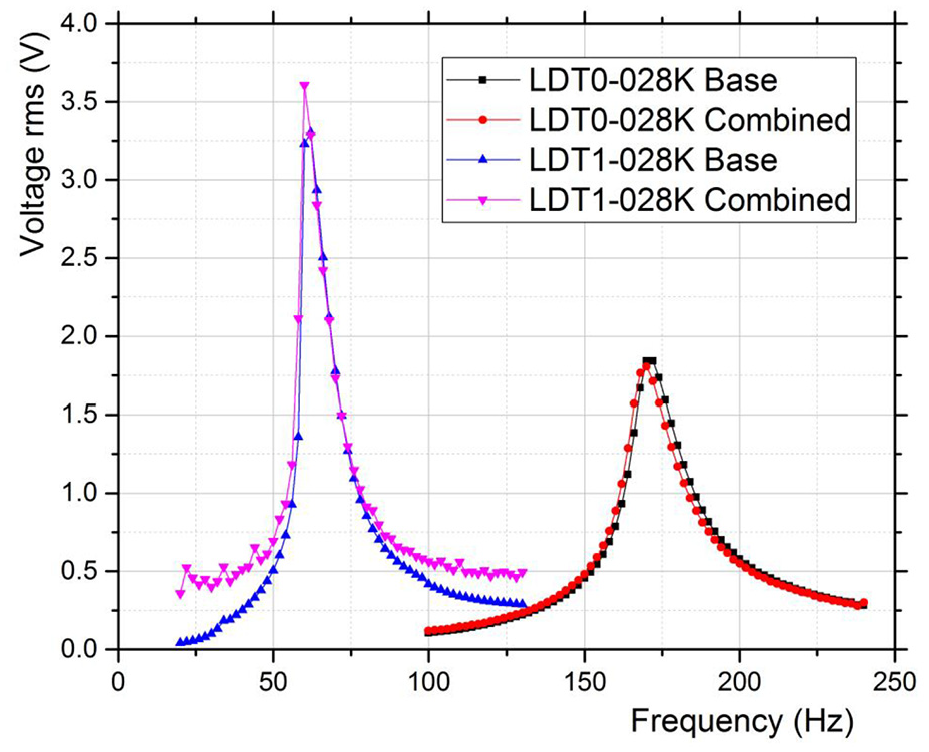
Comparison of rms voltage output of LDT0-028K and LDT1-028K piezo-films with base excitation and combined excitation (amplification level A).
As reported in section 2, three different amplification levels were used during testing of the cone speaker’s frequency response. The amplification level changes the amplitude of the voltage waveform that is given as input to the cone speaker. It is observed that amplification levels B and C result in a similar response of the piezo-film’s output voltage despite their significant difference in input voltage (Figure 8).
As regards the resulting transducer’s output, comparatively presented in Figure 13 for the three amplification levels, rms voltage peaks as high as 15 V are observed at resonance. Moreover, the resonance frequency for output voltage is shifted to lower values (49 Hz) at amplification levels B and C while it is observed at 60 Hz for level A. Understanding of this phenomenon should start from the behavior of the cone driver. As already explained in the context of Figure 7 the cone driver demonstrates its own natural frequency, which depends on the driver mass and membrane stiffness. On the other hand the resonance frequency of the driver is affected by the damping of its oscillations according to the following relation:
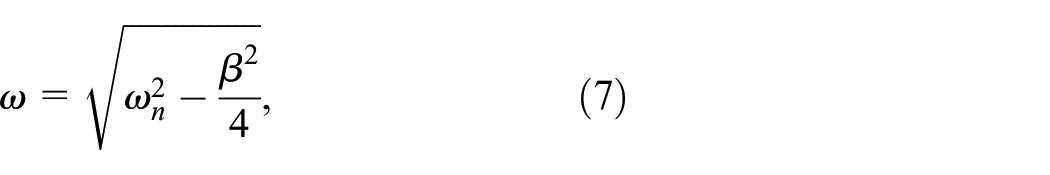
Where ω is the damped frequency of the driver, ωn is the natural frequency (no damping) and β is a damping factor that is significantly affected by distortion phenomena at low frequencies of driver oscillation. The dominant source of this distortion is variation in the magnetic field due to the travel of the voice coil with respect to the permanent magnet. Ideally, the force of the magnetic field between the voice coil and permanent magnet would remain the same at all times during excursion, but as the voice coil moves away from the center of its rest position, the force of the magnetic field exerted on the voice coil changes. At small excursions, the change of this magnetic force is slight, but at high excursions a larger section of the voice coil leaves the central magnetic field of the permanent magnet (called “the gap”), and, as a consequence, the magnetic force between the voice coil and permanent magnet is substantially weakened. Since the magnetic field has a weaker grip over the voice coil, control over the entire moving assembly has diminished. The loss of cone control manifests itself in distortion.
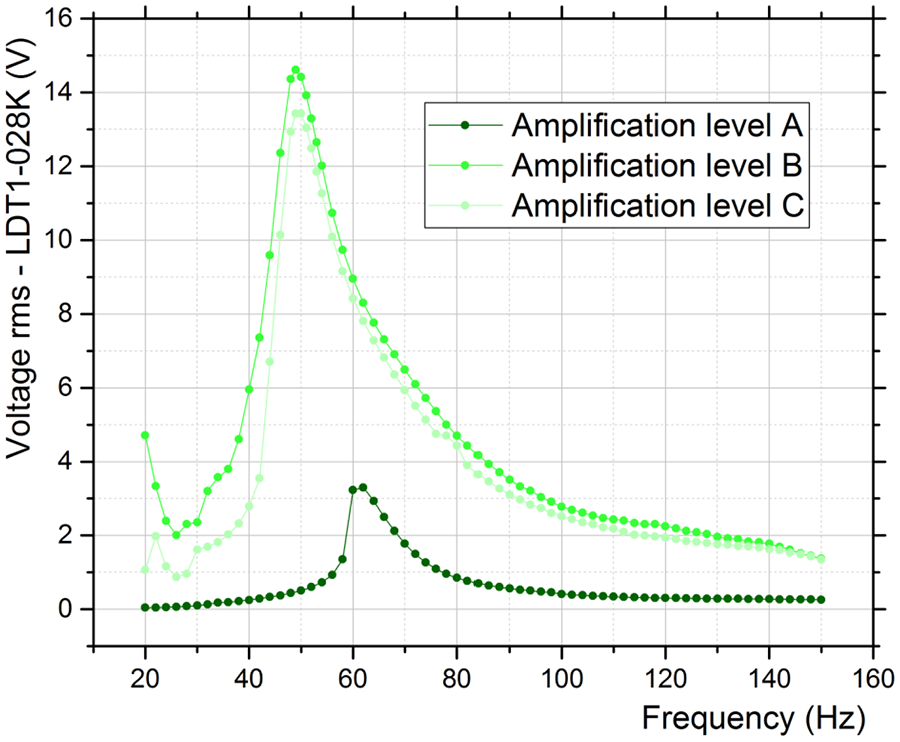
Effect of three different amplification levels on the rms voltage output of LDT1-028K with base excitation only.
Additionally, the rms voltage output of the piezo-film depends on its vibration frequency and tip deflection. The piezo-film’s vibration frequency and the base excitation frequency are not necessarily the same. Also, higher tip deflections of the piezo-film produce higher voltage outputs as stated by its manufacturer. It is thus possible that in the case of the vibration shift presented, the piezo-film vibrates in a frequency slightly shifted from the excitation frequency for amplification level A and that its tip deflection is larger at 49 Hz, producing a higher voltage rms output.
3.3. Output voltage measurements with aerodynamic and combined excitation
In the second series of measurements, the transducers were subjected to pure aerodynamic excitation. They produced rms voltages in the order of 0.05 V on the LDT0-028K and 0.55 V on the LDT1-028K. As regards the LDT0-028K, it is known from previous experiments (Stamatellou and Kalfas, 2019) that it requires a bigger fan to be excited, due to its smaller size.
On the other hand, the aerodynamic excitation’s effect on the LDT1-028K is notable on its voltage output rms. In base excitation frequencies far from the eigenfrequency, the aerodynamic excitation is a significant addition to its output (Figure 12). In frequencies around the eigenfrequency the effect of the aerodynamic loading is less important. However, the highest voltage rms output is observed for LDT1-028K at its eigenfrequency under combined excitation. In this case, the aerodynamic exciter added to the voltage rms about 0.3 V.
The LDT0-028K seems to not be significantly affected by the aerodynamic excitation. This was expected because the fan alone could make the LDT0-028K produce only 0.05 V rms voltage in the distance it was placed. In Figure 14 the outcome of the aerodynamic excitation on the two piezo-films is presented.
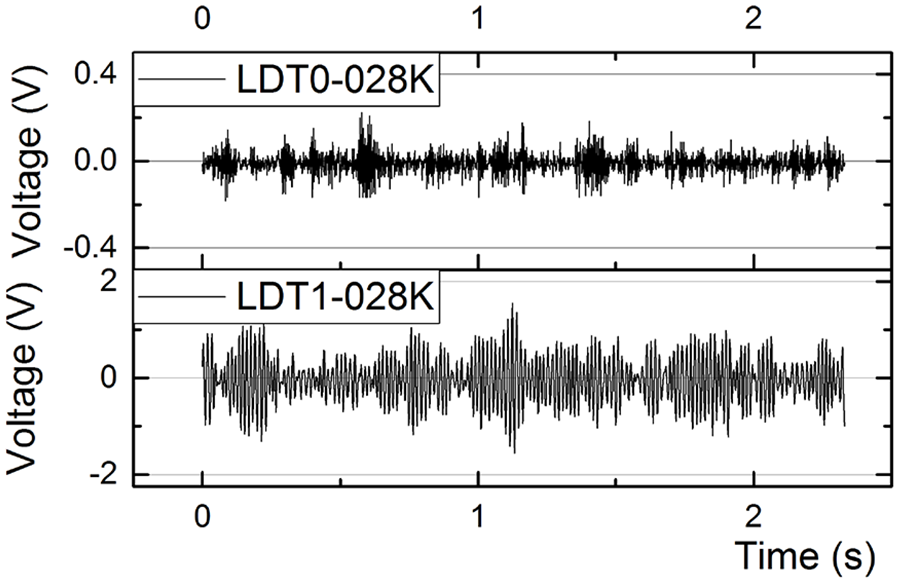
Voltage output waveforms of the two piezo-films for aerodynamic excitation only.
The amplitude of the voltage output waveforms is variable with several frequencies involved that will be showcased in the following section.
3.4. Output voltage waveforms analysis
It is observed from Figure 15 that the standard deviation of the voltage rms is higher when the two sources of excitation are combined. It seems that the aerodynamic excitation has an uncertain outcome on the harvester. This is due to the coexistence of various frequencies in the piezo-film’s vibration due to the flow as opposed to the mechanical excitation. The randomness of the signal is also observed in the LDT1-028K waveforms in Figure 16.
Waveform diagrams for indicative base excitation frequencies of LDT0-028K.
Waveform diagrams for indicative base excitation frequencies of LDT1-028K.
The range of the voltage waveforms is higher with the combined excitation for every base frequency presented. It seems that the two forms of excitation forces are at some points working together and at other points opposing. The above waveforms were transformed with FFT.
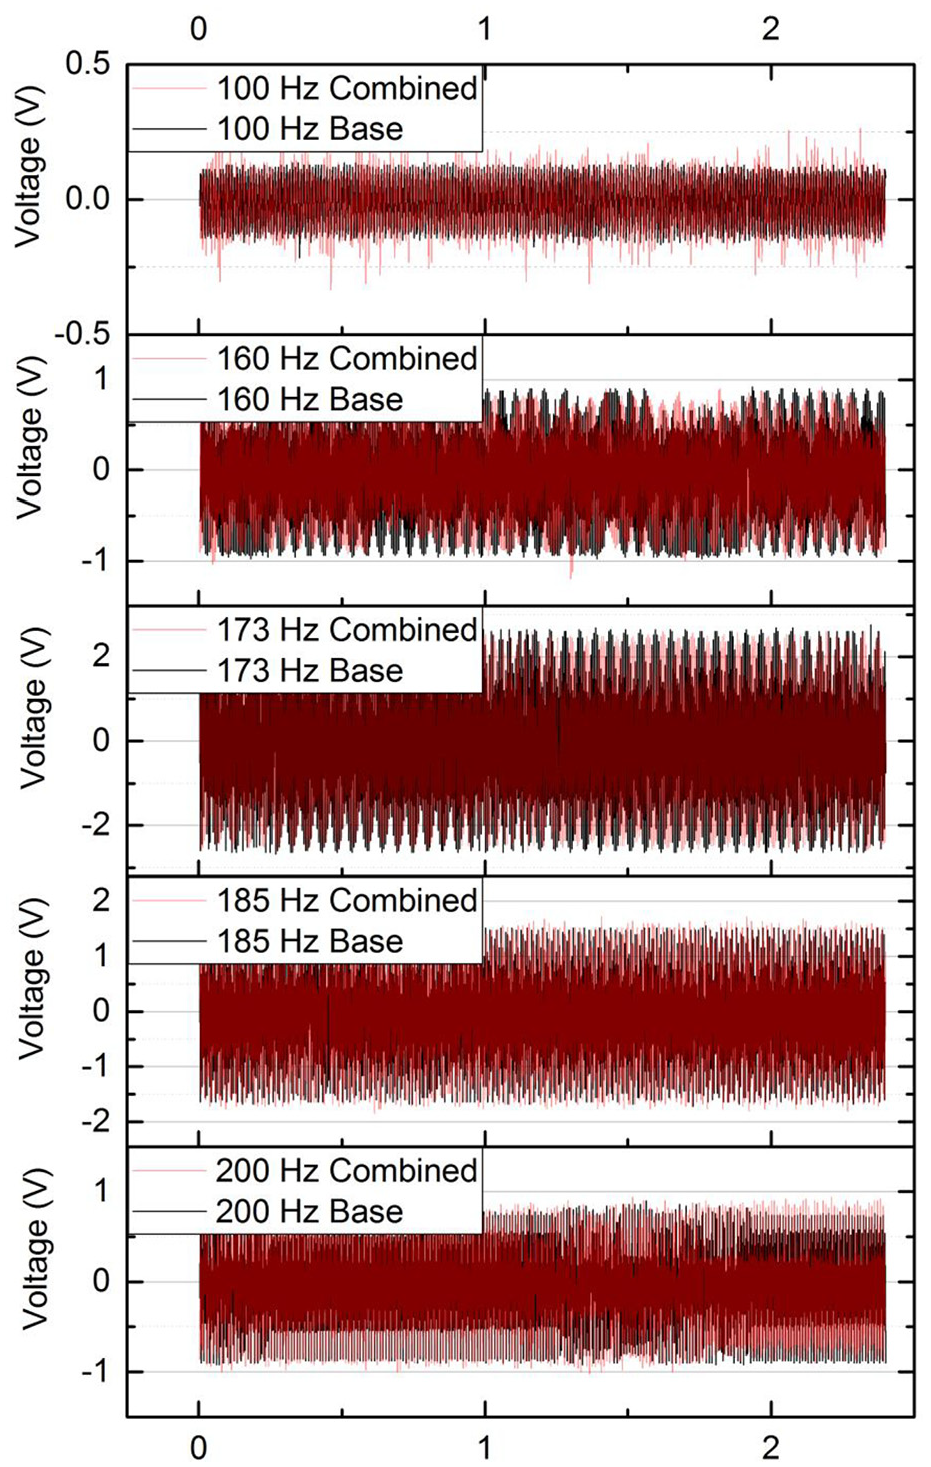
New frequencies are observed to emerge in the output voltage signal due to the aerodynamic excitation. In Figure 17, for the base excitation frequency of 100 Hz, a new output voltage set of frequencies is additionally observed at 170 Hz, caused by the aerodynamic excitation. In the rest of the base frequencies the FFT transformation shows that the piezo-film’s output is only slightly influenced, increasing some of the existing frequency peaks. In these cases, the aerodynamic excitation seems to work complementary to the base vibration. It is noted that the aerodynamic excitation alone has a small effect on LDT0-028K.
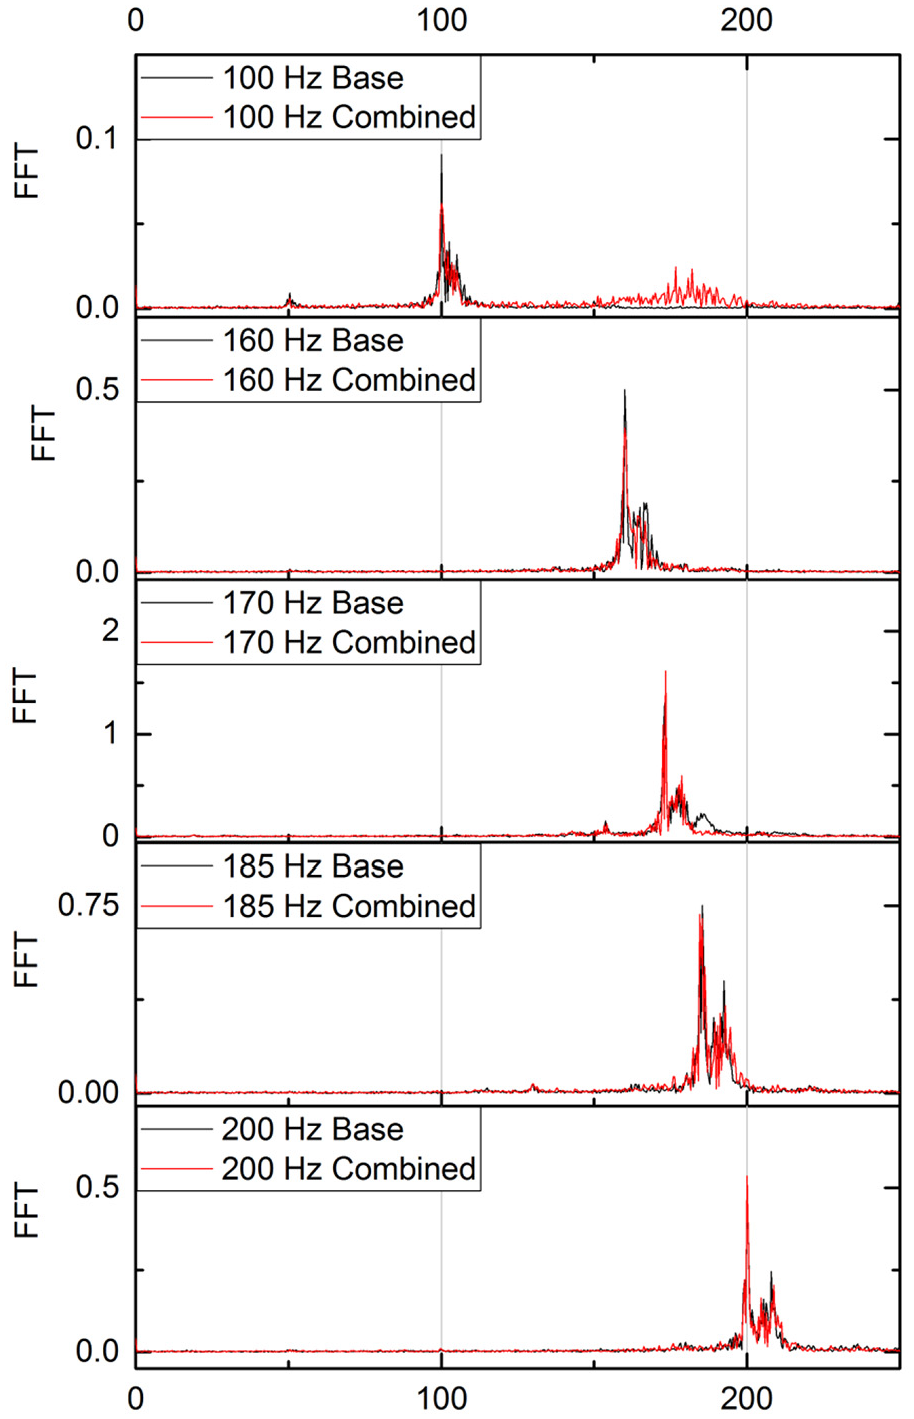
FFT diagrams for indicative base excitation frequencies of LDT0-028K.
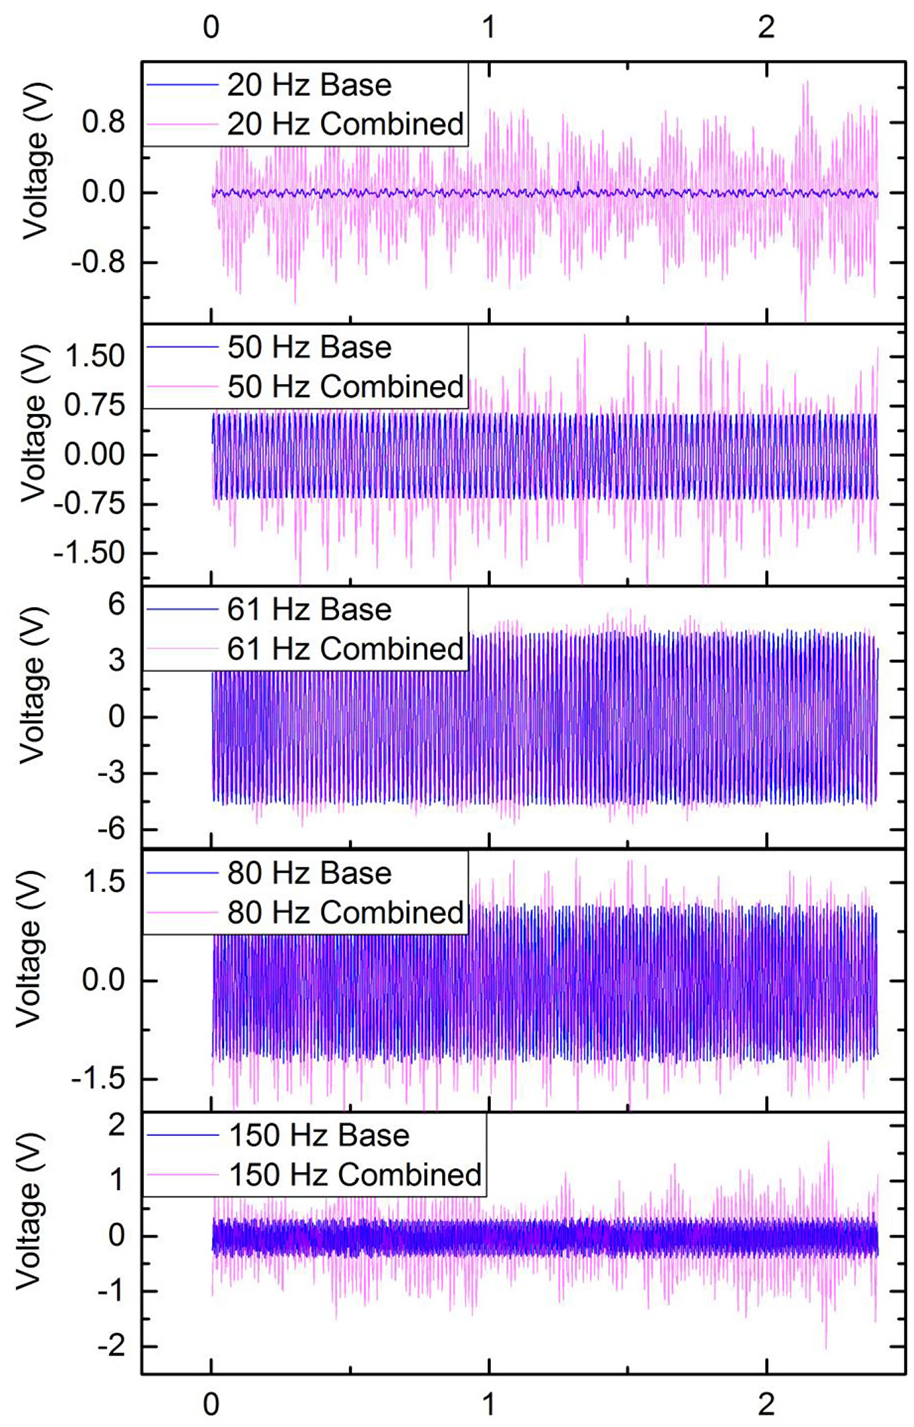
In Figure 18 the aerodynamic excitation results to the emergence of an additional set of frequencies to the voltage waveform, when the base frequency shifts from the LDT1-028K’s eigenfrequency.
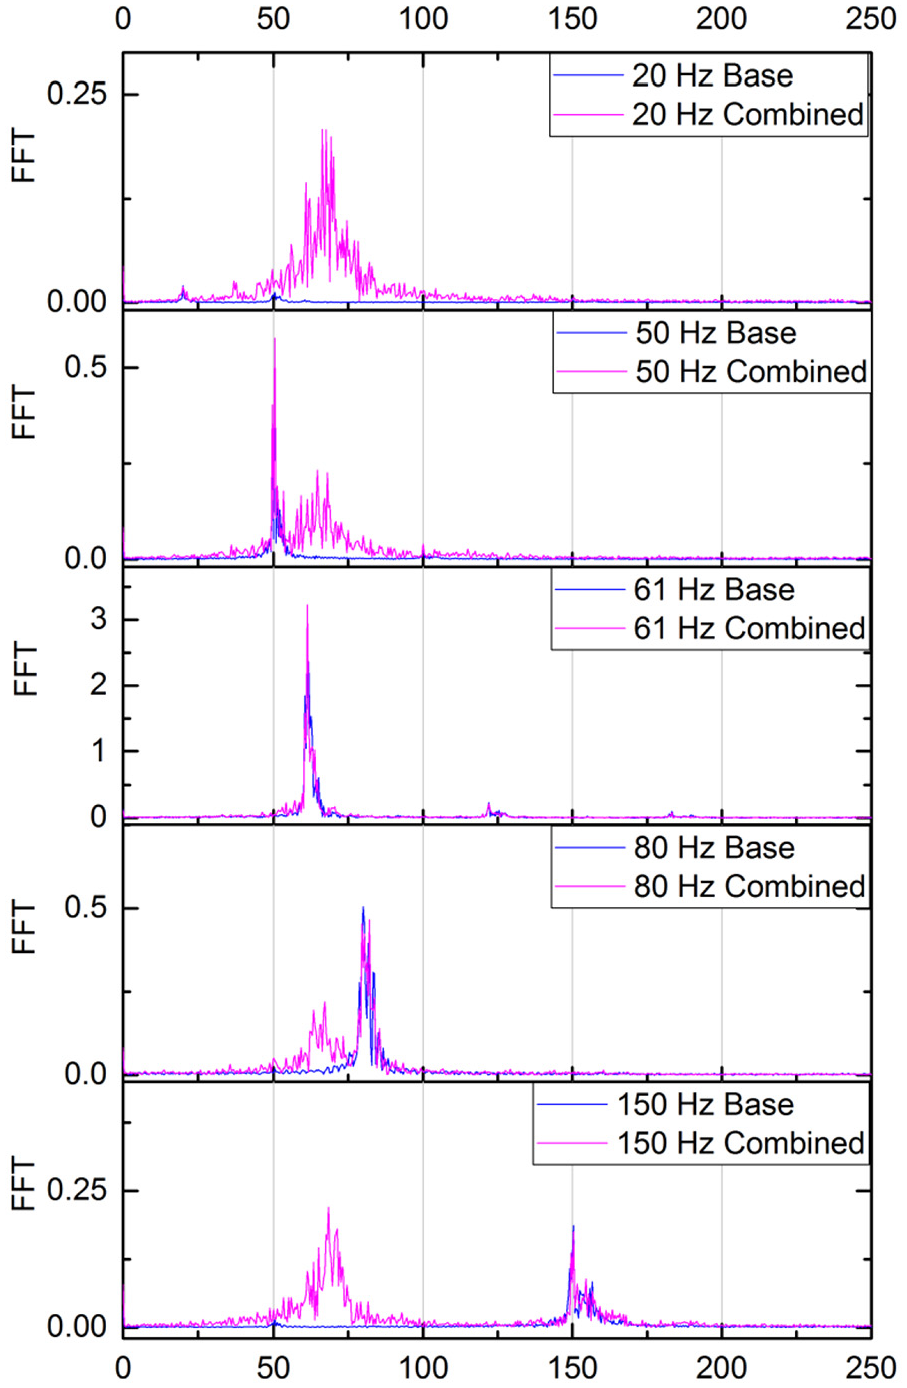
FFT diagrams for indicative base excitation frequencies of LDT1-028K.
The peak of the combined excitation is observed to be higher than the peak of the base excitation. In the case of the 61 Hz base excitation (eigenfrequency of the piezo-film), the signal’s frequency mix is not influenced by the aerodynamic excitation.
Further, it should be noted that the sets of frequencies that are inserted to the signal due to the aerodynamic excitation are close to each beam’s resonant frequency, namely 170 Hz for LDT0-028K and 61 Hz for LDT1-028K.
Finally, it is useful to attempt approximate estimates of power harvesting levels attainable with the specific transducers’ response results. A theoretical power output of the harvester can be computed by the following equation:

where
Estimated power as function of base frequency for LDT0-028K and LDT1-028K for amplification level A are presented in Figure 19.
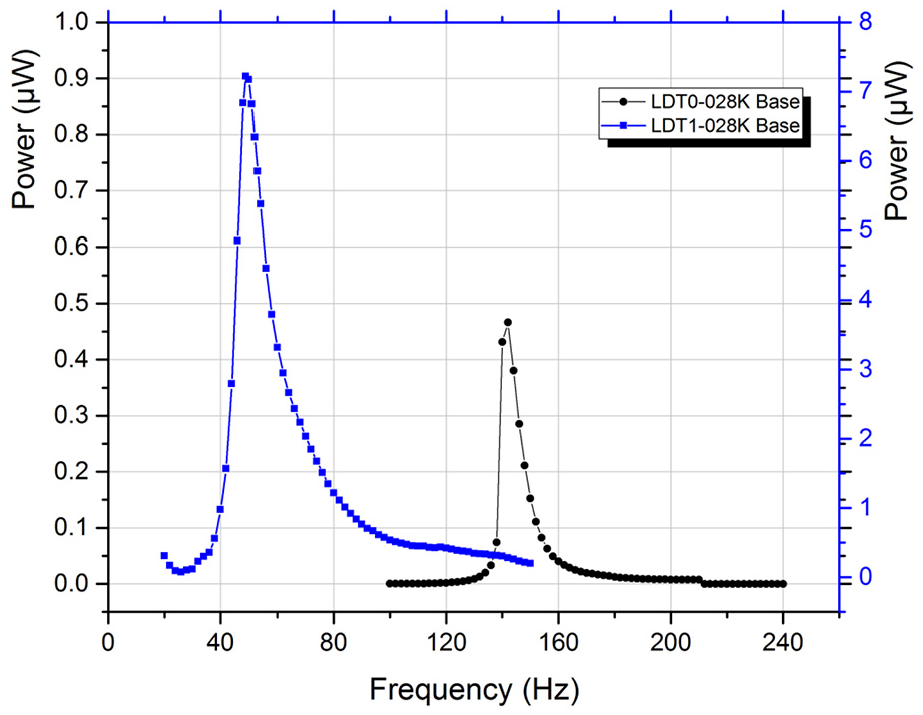
Estimated harvested power output as function of base vibration frequency.
The maximum theoretically estimated harvested power was 0.47 μW for LDT0-028K at 142 Hz and 7.2 μW for LDT1-028K at 49 Hz for amplification level A.
3.5. Observation of LDT1-028K film’s forced vibrations
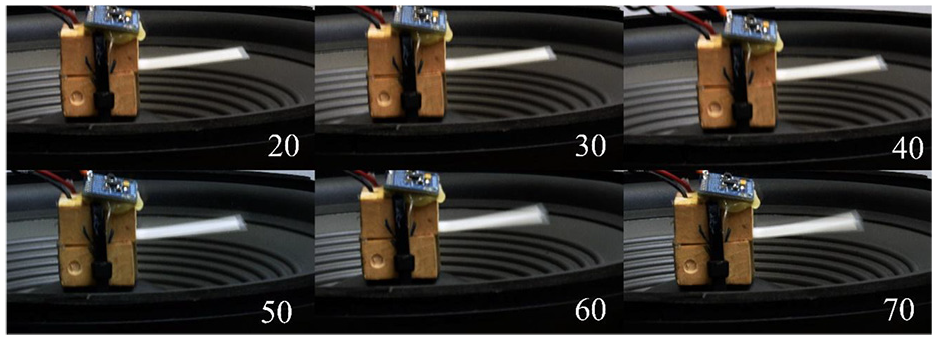
An observation of the tip deflection was attempted by photographing the piezo-film transducer with a shutter speed of 2 s. This enabled the capture of the beam’s oscillation extents as presented in Figure 20. The base vibration frequency range was 20 to 130 Hz. The photographs reveal the differences in the base vibration amplitude as well as the beam’s tip deflection. It is clear that in lower frequencies (20–50 Hz) there is a larger amplitude of about 4 mm. The amplitude gradually decreases with the increase of the base vibration’s frequency. The tip deflection is the largest (10 mm) at 50 Hz.
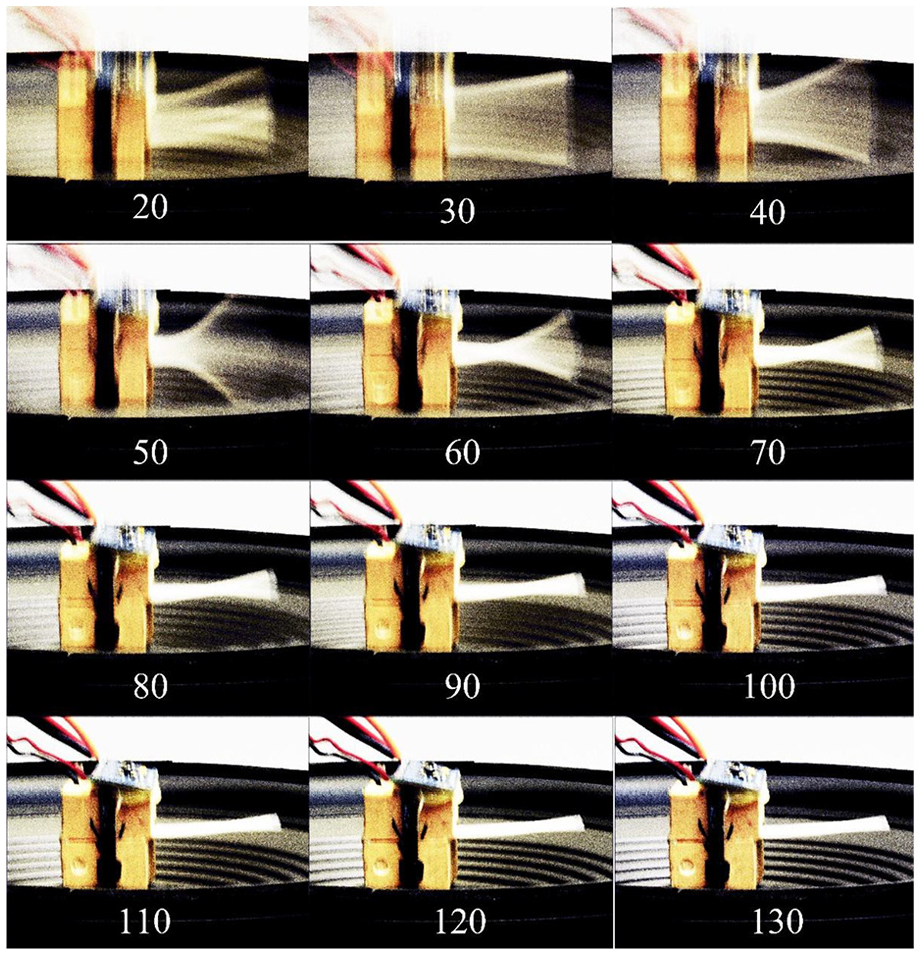
Snapshots of LDT1-028K at various base vibration frequencies at amplification level C.
According to the LDT0-028K manufacturer’s datasheet (Figure 21), for a tip deflection of 4 mm one would expect 12 V and for a tip deflection of 10 mm 26 V, respectively. As already reported, manufacturer’s data for the LDT1-028K transducer could not be provided.
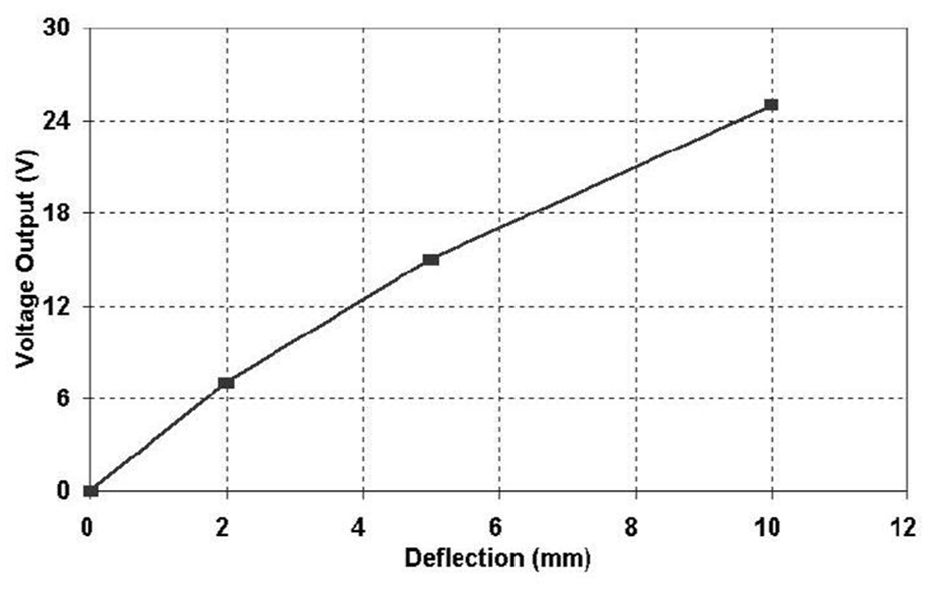
Voltage output versus tip deflection for the LDT0-028K (Measurement Specialties, 2008).
Additionally, in the specific application the damping due to the air surrounding the piezo-film is affected by the confined space between the piezo-film and the membrane. This can affect the modelling of viscous air damping.
The same observing photographs were taken for amplification level A, in which much smaller tip deflections were observed and are presented in Figure 22.
Snapshots of LDT1-028K at various base vibration frequencies at amplification level A.
At amplification level A the highest tip deflection was observed at 60 and 70 Hz. The amplitude was about 1 mm in frequencies 50 to 70 Hz. The base amplitudes for amplification level A were <1 mm. The largest voltage rms value for LDT1-028K at amplification level A was at 60 Hz, which coincides with the largest observed tip deflection.
3.6. Implications on the design of piezoelectric energy harvesters
In order to give an accurate power output prediction, complete energy harvesting experiments with rectification circuits should be performed (Stamatellou and Kalfas, 2019), while the present study only included voltage output measurements. However, the voltage output rms of a PEH is a useful indicator of the resulting power output and its processing leads to useful conclusions about the design process of PEH.
The size of transducer is an important parameter in the design of PEH. It has been shown in the experiments that different sizes of transducer respond differently to specific frequencies of base vibration as their resonant frequencies depend on their size. Additionally piezo-film behavior in flow-induced vibration also depends on their size and design.
It was observed that LTD1-028K was able to exploit the combined vibration and increase the voltage output in the frequency range it was tested. The aerodynamic excitation increased its power output for the majority of base excitation frequencies tested. In contrast, LDT0-028K did not significantly benefit from the use of aerodynamic excitation. This difference is probably due to the different beams’ length and exposed area. The longer size of LDT1-028K better exploits the aerodynamic forces and is able to produce larger deflections.
It is observed from the results of the current study that a steady aerodynamic excitation, such as a fan working at constant speed, produces a predictable voltage output rms on piezoelectric flutter-type harvesters. This is due to the tendency of the beam to vibrate in frequencies close to its resonant frequency when subjected to flow. This makes flutter-type piezoelectric harvesters a suitable energy extractor from steady aerodynamic excitation sources, as the predictability of a harvester’s power output is an important parameter for their design.
As regards base excitation, it was observed that the harvester’s output is strongly dependent on the excitation frequency. This narrows the field of its applications. A possible type of application in mechanical excitation sources is the use of piezoelectric transducers with different eigenfrequencies in arrays. In this context, it was observed that the two harvesters used in these experiments had a satisfactory power output in an area of 20 to 30 Hz around their eigenfrequency. This quantification helps the design process and the identification of possible applications.
4. Conclusions
The contribution of mechanical base vibration and flow-induced vibration in the voltage output of two commercial piezo film transducers was experimentally investigated, aiming to assist the design process of piezoelectric energy harvesting devices and applications.
Base excitation actualized by a cone speaker’s harmonic vibration produced higher voltage outputs than the aerodynamic excitation on the piezo-films with the specific set-up. Voltage peaks as high as 15 V were produced during the tests.
On the other hand, it was observed that steady aerodynamic excitation by means of a fan at constant rotation speed, produced a steady voltage output of 0.5 V (rms), which could become higher if a stronger fan would be employed. The aerodynamic excitation evoked the piezo-films’ vibration at a frequency range close to their resonance.
As regards base excitations, the strong dependence of the harvester’s output on the excitation frequency was confirmed. The resonant frequencies of the two transducers tested were measured at 60 and 170 Hz respectively.
Finally, it was observed that the two piezoelectric transducers had a satisfactory power output in an excitation frequency bandwidth of 20 to 30 Hz around their eigenfrequency. This quantification helps the design process as well as the identification of possible favorable applications.
Footnotes
Declaration of conflicting interests
The author(s) declared no potential conflicts of interest with respect to the research, authorship, and/or publication of this article.
Funding
The author(s) received no financial support for the research, authorship, and/or publication of this article.