
Abstract
Electrorheological (ER) fluids generate mechanical responses to applied electric field strength via changing their rheological properties from liquid to solid and vice-versa reversibly. As a result of this, ER fluids can be used in the industrial vibration damping systems. In order to increase applicability of ER fluids, it is necessary to understand electric field induced polarization and ER mechanism of different materials. Therefore, the aim of this study is to illuminate ER and vibration damping properties of polyanthracene (PAT), which is a new material for ER studies. PAT was synthesized from anthracene and characterized by several techniques namely: ATR-FTIR spectroscopy, particle size, SEM image, four-point probe conductivity, and magnetic susceptibility measurements. A series of PAT/silicone oil (SO) dispersions having various concentrations were prepared and subjected to dielectric and ER tests. Then, the colloidal stabilities of 20% PAT/SO and 20% PAT/SO/TritonX systems were determined. Dynamic viscoelastic data obtained by the oscillation tests showed that viscous behavior was dominant under zero electric field, whereas elastic behavior was prevailing under external electric field strength and highlighting the vibration damping characteristics of PAT/SO dispersion. In the creep-recovery measurements, the highest %recovery was recorded to be 62% indicating potential industrial use of PAT/SO dispersion.
1. Introduction
Electrorheological (ER) fluids are colloidal dispersions of particles, which can polarize under the external electric field, in a non-conducting base liquid. After the electric field is applied, the polarized particles attract to each other to form a column-like structure along the electric field direction within the milliseconds. The electric field induced process leads to reversible and rapid change from liquid-like to a solid-like behavior. Thus, there is a drastic change in flow behavior of ER fluid such as viscosity (
It is important to prepare dry-based ER fluids for industrial applications to prevent evaporation, electrical breakdown, or corrosion problems arising in wet-based ones (Dong et al., 2019). The hydrophobic, conjugated, and semiconductive polymers can polarize under electric field stimulus via hoping of
To the best our knowledge, the previous ER studies on the fully conjugated and nonpolar polymers were only based on polyphenylene. It is a simple linear polymer meaning the aromatic rings are bonded through a single bond. The fully conjugated, nonpolar, and stepladder polymer, which is defined as a group of aromatic rings connected by a single bond, may be more advantageous for the ER studies. The step ladder structure leads to high degree of conjugation, possess a planar π-electron system ensuring the optimum electron delocalization and allows the structure to do rotational chain motion (Schlüter, 1991). This can provide the formation of strong electric dipoles during the application of electric field stimulus. The structure also shows remarkable properties such as high thermal, mechanical, and chemical stability. Therefore, the objective of this study is to understand the electroactive flow behavior, vibration damping property, and creep-recovery characteristic of fully conjugated, nonpolar and stepladder polymer, polyanthracene (PAT), based ER fluid. PAT is very attractive polymer for semiconductive and optoelectronic devices due to its highly polyaromatic structure (Yoshizawa and Klosterman, 2014). To the best of our knowledge, the ER activity and electro active vibration damping properties of PAT not hitherto been reported in the literature. The previously reported ER active polymers similar to PAT were the radical quinone derivatives of polyacene, which is named as poly(acene quinone) radical (PAQR). PAQR is a type of ladder polymer with polar groups such as carbonyl and hydroxyl. The reported studies have shown that PAQRs have high dielectric constant (
2. Experimental section
2.1. Materials
Anthracene and FeCl3 were provided from Merck and used as monomer and catalyst, respectively. Methanol (>99.9%), ethanol (96%–97%), and HCl (36%) were obtained from Merck. Silicon oil (SO) with
2.2. Synthesis of PAT
PAT was synthesized via a modified procedure of oxidative polymerization (Desai et al., 2014; Tanemura et al., 2013). The mass ratio of monomer:oxidative catalyst was arranged to be 1:2, the reaction was performed in nitrobenzene under N2(g) atmosphere at 150°C and run for 24 h. The polymerization was terminated by adding methanol to the reactor and the crude product of PAT was recovered. The unreacted monomer, Fe2+ and Fe3+ ions were removed from the crude product by washing with ethanol/HCl(aq) solution and approved with negative potassium thiocyanide (KSCN) test result, which was disappearance of red color of Fe(SCN)3 (Unal et al., 2014). Eventually, purified PAT homopolymer was obtained as the final product, dried in a vacuum oven at 120°C for 24 h, cryogenically grinded by using a mill (Retsch, MM400, Germany) to obtain fine-grade particles and then stored in a desiccator for further use.
2.3. Characterizations of PAT
The synthesis of PAT from anthracene monomer was detected by ATR-FTIR (Thermo Scientific Nicolet IS5, USA) spectrometer to reveal the chemical structure. The hydrodynamic diameter of PAT was determined in aqueous dispersion containing 10−3 M NaCl(aq) solution at pH 7 and 25°C via dynamic light scattering (DLS) method (Malvern Zetasizer, Nano ZS, England). The instrument is equipped with a 4-mW He–Ne laser operating at λ = 633 nm and a noninvasive backscatter system (NIBSTM) which measures the light scattered at a backscatter angle of 173°. The morphology and dimensions of synthesized PAT particles were investigated by scanning electron microscope (SEM, FEI Quanta 400F Field Emission, Netherland) operating with an accelerating voltage of 30 kV. The powdered PAT was compressed, and the pellets were prepared with certain dimensions (height = 0.2 mm, diameter = 13 mm). Then, the conductivity of PAT was measured by four-probe technique at room temperature (Entek Electronic, FPP 470-A, Turkey). Additionally, the density of PAT was calculated from the basic mass/volume equation by using experimental results obtained from compressed pellets with known dimensions and mass. The magnetic susceptibility measurement of PAT was carried out by using Sherwood Scientific, MKI model Gouy scale at room temperature. The powdered PAT was placed in a pyrex tube and the magnetic susceptibility was determined. The experimental readings were turned to the magnetic susceptibility per gram by using equation (1) and the conductivity mechanism of PAT was decided to be whether polaron or bipolaron.
2.4. Dielectric properties of PAT/SO dispersions
SO was vacuum dried in an oven for 24 h at 110°C to remove any moisture present. A series of PAT/SO dispersions having various mass (g)/volume (mL) percentages (5, 10, 15, 20, and 25 m/V%) were prepared. The dispersions were homogenized by using an ultrasonicator (Sonics, Vibracell, USA) before all the measurements carried out. Dielectric analyses of dispersions were carried out by using Agilent E4980A Precision Impedance analyzer/LCR meter (USA) equipped with a liquid test fixture (16452A) at room temperature. The analysis was performed at 1.0 V constant AC voltage in the frequency range of 20 Hz–2 MHz. The dielectric properties were determined from the Cole-Cole equation fitted curves.
2.5. ER activity of PAT/SO dispersions
ER activities of PAT/SO dispersions were investigated with parallel plate torque electrorheometer (Thermo-Haake RS600, Germany) at 25°C under various electric field strengths (E = 0–4 kV/mm with 0.5 kV/mm increments) generated by a DC electric field generator (Fug Electronics, HCL 14, Germany). The gap between the parallel plates was 1.0 mm and the diameters of the upper and lower plates were 35 mm. Pre-mixing (
After dielectric and ER studies, the optimum dispersion concentration was determined to be 20 m/V% and this dispersion is designated as 20% PAT/SO for the rest of the study.
2.6. Colloidal stability of PAT/SO dispersion
The colloidal stability of the optimized dispersion, 20% PAT/SO, was determined in a graduated glass tube at room temperature. During the measurements, the height of phase separation between the particle-rich phase and oil-rich phase was recorded as a function of time. The heights were measured by using digital caliper for 30 days. The colloidal stability ratio was calculated by the height percentage of particle rich phase relative to total height of the dispersion. The further colloidal stability test was performed for 20% PAT/SO dispersion by adding 1 m/V% TritonX non-ionic surfactant. The dispersion was defined as 20% PAT/SO/TritonX system.
2.7. Electroactive vibration damping properties of PAT/SO dispersion
Electroactive vibration damping properties of 20% PAT/SO dispersion were investigated via dynamic oscillation tests and creep-recovery measurements under various electric field strengths (E = 0–4 kV/mm with 1.0 kV/mm increments). Before oscillation measurements, linear viscoelastic region (LVR) was determined at
The creep-recovery behavior was also analyzed by applying different shear stresses depending on the applied electric field strengths to 20% PAT/SO dispersion for 100 s. The applied shear stresses were selected as
3. Results and discussion
3.1. Characterization of PAT
PAT was synthesized from anthracene via oxidative polymerization (Figure 1). The polymerization mechanism proceeds from carbon atoms at 9th and 10th positions of the monomer. This is proven by comparing ATR-FTIR spectra of anthracene and PAT (Figure 2). The peak at 885 cm−1 belongs to the stretching vibration of C−H groups at 9th and 10th positions and the intensity of the peak decreases for PAT because of the formation of new bonds (Desai et al., 2014). It is also found that the peaks indicating neighboring C−H groups shift from 720 to 692 cm−1 and from 957 to 931 cm−1 due to the polymerization reaction. For both PAT and anthracene, aromatic C−H and C−C stretching peaks are observed in 3050, 1620 and 1535 cm−1 regions, respectively.
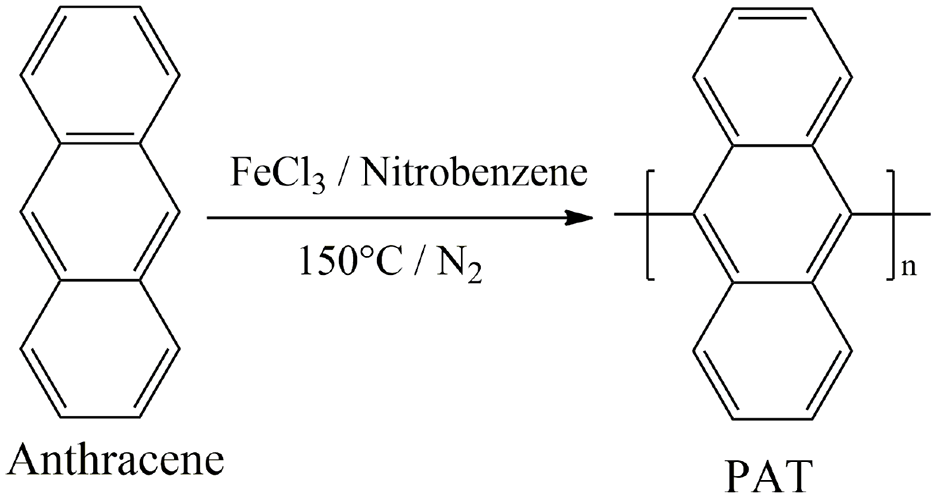
Polymerization of anthracene to PAT.
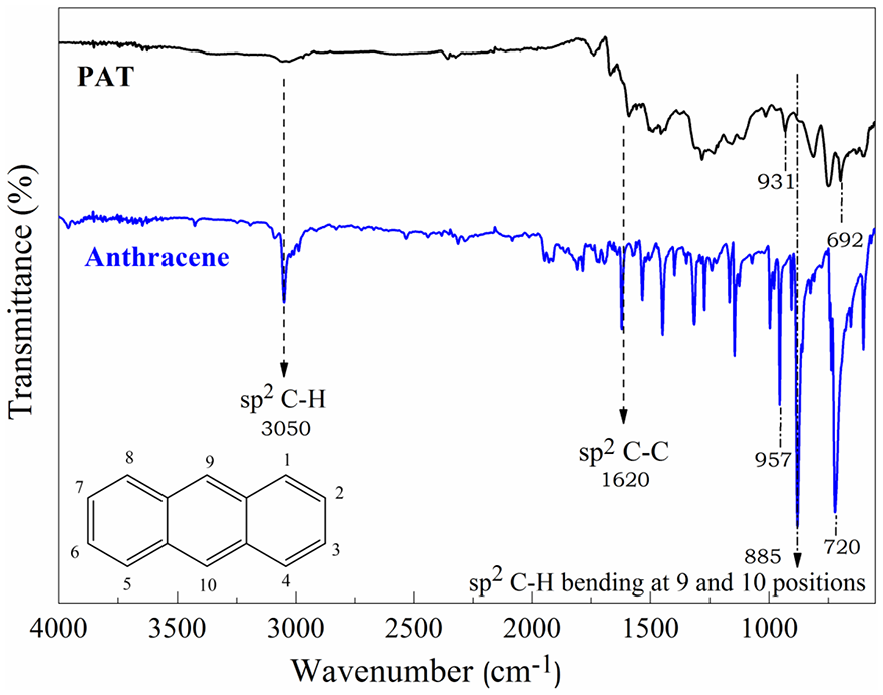
ATR-FTIR spectra of anthracene and PAT.
The average hydrodynamic diameter of PAT particles was determined in 10−3 M NaCl solution at pH 7 by DLS. As reflected from Figure 3, the ground-milled PAT particles have two different particle size distributions. The main distribution was having average hydrodynamic diameter of 600 ± 100 nm corresponding to the 94% of the dispersed particles and the rest was having 110 ± 20 nm corresponding to the remaining 6%. Desai and coworkers reported similar size distribution for the PAT particles synthesized with an identical method (∼500 nm) (Desai et al., 2014, 2017). The nano scale size can improve the colloidal stability of PAT particles when dispersed in SO. Additionally, the presence of smaller particles can be advantageous because they can penetrate between the larger particles, provide maximum packing efficiency, and help to form stronger chain-like structures under applied electric field.
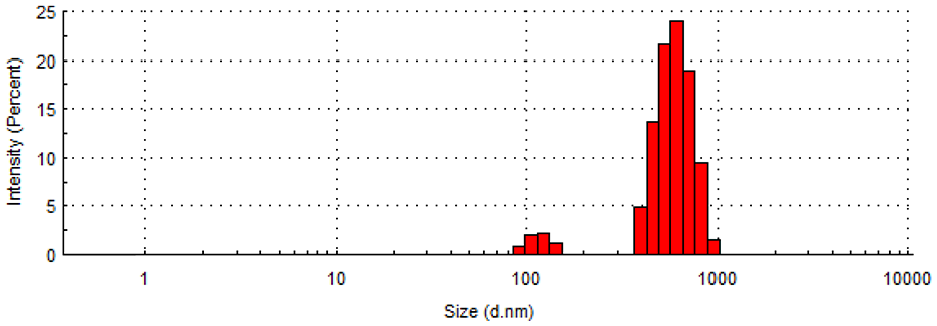
The hydrodynamic size distribution graph of PAT in 10−3 M NaCl at pH 7 and 25°C.
The morphology of synthesized PAT was observed by SEM technique (Figure 4). It was observed that PAT particles show a varying shape and also differing distribution of sizes ranging from submicron to microns by showing no agglomeration. Although PAT particles were cryogenically ground milled it was not possible to obtain a monodisperse distribution but the agglomeration was prevented in contrast to the previously reported study on PAT particles (Desai et al., 2014). On the other hand, this kind of closest packing, filling of gaps between the big particles by small ones, is preferred for ER dispersions.
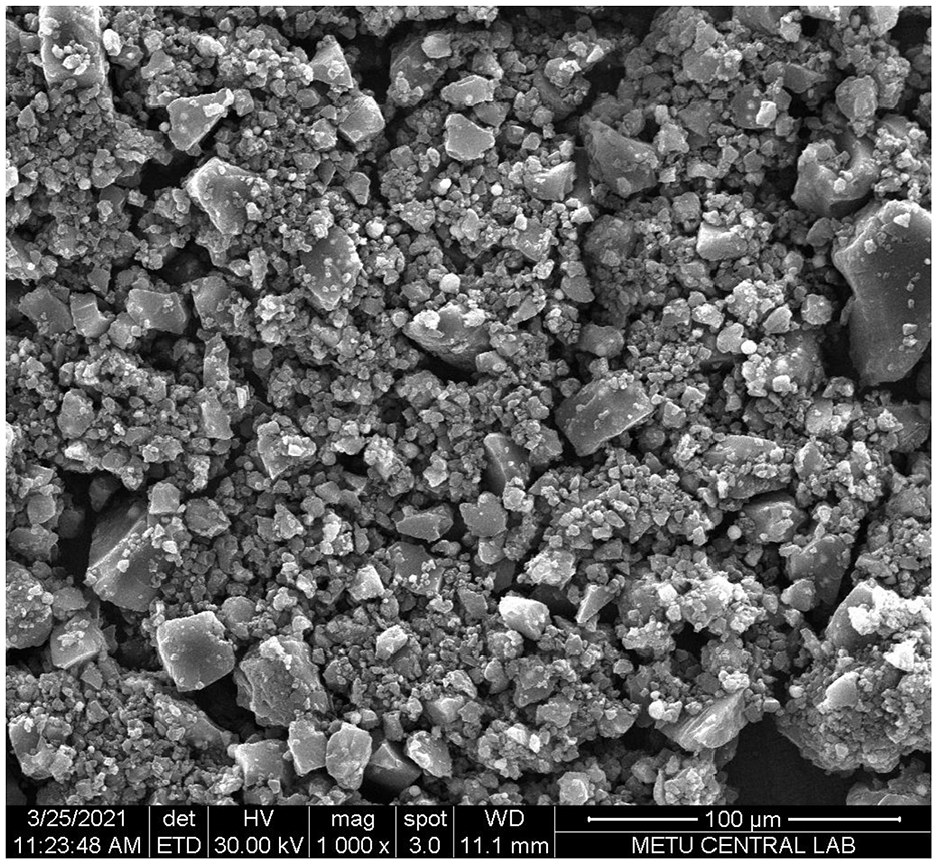
The SEM image of PAT particles.
The conductivity (
The conductivity mechanism of PAT can be determined whether polaron or bipolaron by the help of magnetic susceptibility measurements. The polaron-bipolaron model is frequently used to explain the conductivity and electrochemical properties of conjugated semiconductor polymers (Santos et al., 2007). Polarons (radical cations) and bipolarons (dications) are charged quasiparticles present in the polymer backbone structure. Polarons are formed by the coupling of excess charge carriers, which are holes and electrons, in polarizable structures owing to the ionic vibration and the dielectric polarization (Franchini et al., 2021). Thus, polaron can be identified as a charge carrier with self-induced deformation. On the other hand, bipolarons are formed when the energy for the combination of two polarons are large enough to overcome the Coulombic forces (Fobasso et al., 2020; Volkov et al., 2017). The important difference between polaron and bipolaron is that polarons carry a magnetic moment while bipolarons are spinless, and they can be distinguished by means of the magnetic susceptibility. The positive and negative values of magnetic susceptibility indicate paramagnetic (polaron) and diamagnetic (bipolaron) character of the conduction mechanism. The magnetic susceptibility per gram was calculated via following equation:
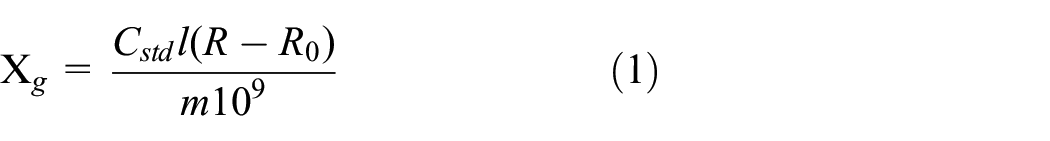
where
According to this equation, the magnetic susceptibility of PAT was calculated to be 6.6 × 10⁻⁶ cm3/g. The positive value indicates that PAT is paramagnetic and the conduction occurs through polarons. The estimated conduction mechanism of PAT is represented in Figure 5. This shows that when the voltage or another electrical stimulus is applied to PAT particles, it causes the distortion in the structure and the formation of polarons. The movement of these polarons are responsible for the conduction. Compared to an electron in undistorted structure, the mobility of polarons are lower and the mobile mass are higher due to the interaction between the charge carrier and the self-induced deformation (Bombile et al., 2018). Thus, the conductivity of polarons is low. For PAT based ER fluids, the moderate conductivity is an advantage.
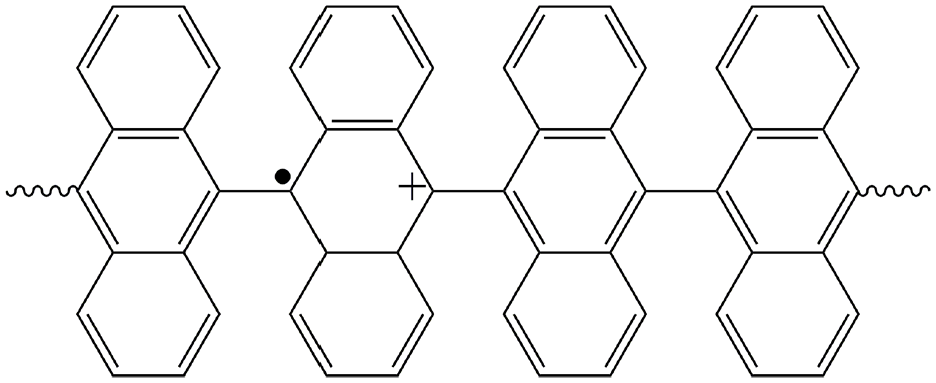
The polaron structure of PAT.
3.2. Dielectric properties of PAT/SO dispersions
The polarizability and the polarization time of dispersed particles are important properties for ER performance. These properties are related to the dielectric parameters. Firstly, the polarizability is related to the dielectric constant (
The dielectric analysis was carried out for PAT/SO dispersions for 5%, 10%, 15%, 20%, and 25% concentrations. The Cole-Cole equation, which is a dielectric relaxation model to describe the dielectric properties of polymers, is used to establish a relationship between ER effect and dielectric properties (Cole and Cole, 1941). Therefore, the curves are subjected to the Cole-Cole fitting by using equations (2) and (3):
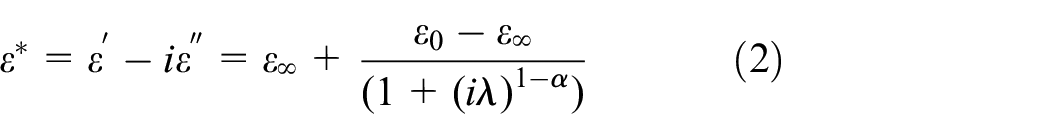

where
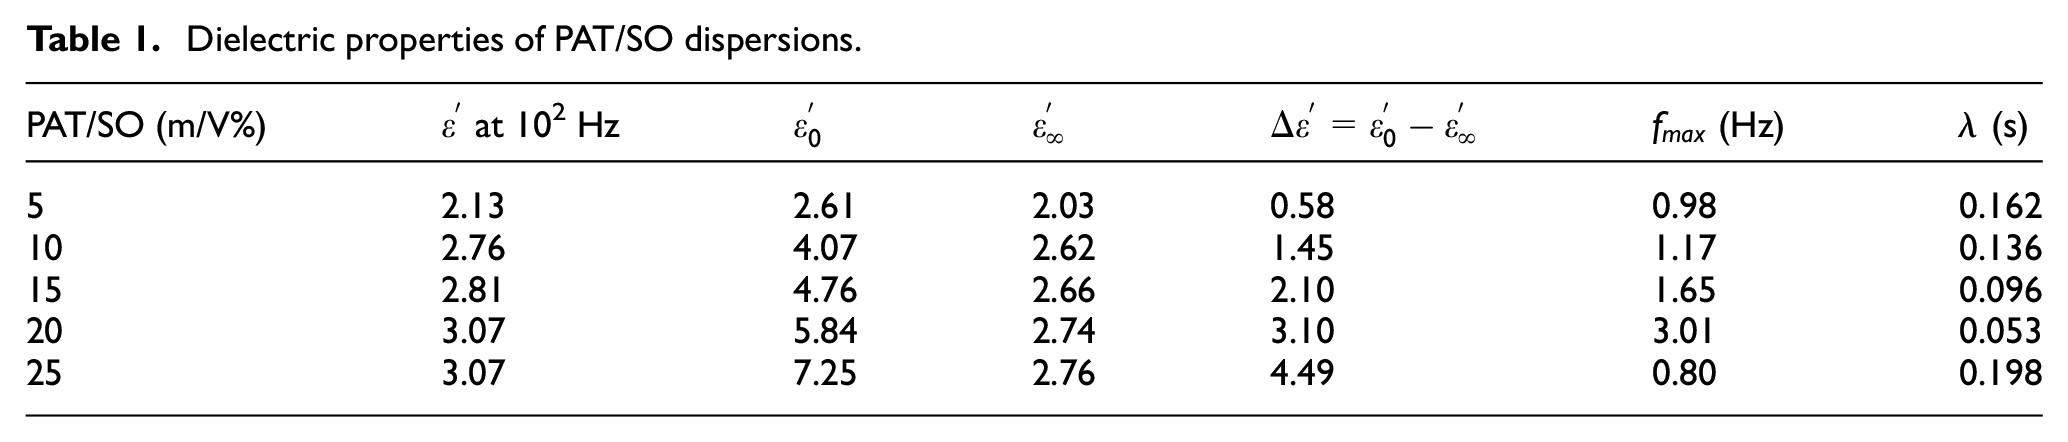
The dielectric data, which are
Dielectric properties of PAT/SO dispersions.
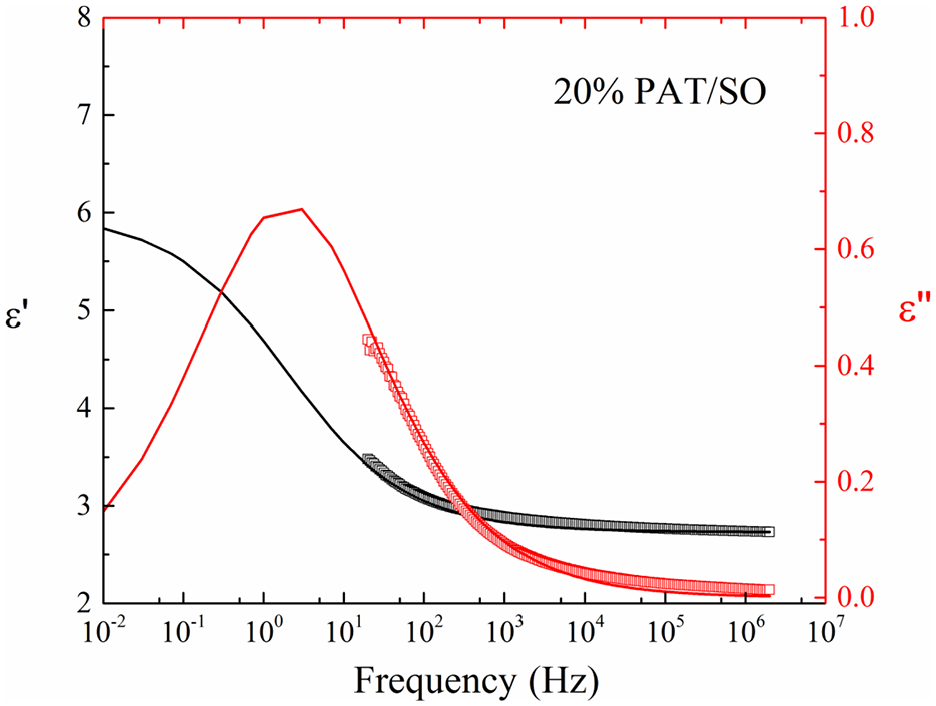
Dielectric spectra of 20% PAT/SO dispersion: dielectric constant (
On the other hand, conjugated, nonpolar, and linear polymer polyphenylene doped with FeCl3 had higher
The polarizabilities of PAT and PAQR can also be compared by considering their
The relaxation times (λ) of PAT/SO dispersions are calculated from equation (4):

where
As seen in Table 1, the relaxation time of PAT/SO dispersions decreases with increasing amount of PAT up to 20% (
3.3. ER activity of PAT/SO dispersions
The time depended ER responses of PAT/SO dispersions were investigated by applying increasing electric field strengths (E = 0–4 kV/mm with E = 0.5 kV/mm increments) for 30 s time intervals at a constant shear rate (
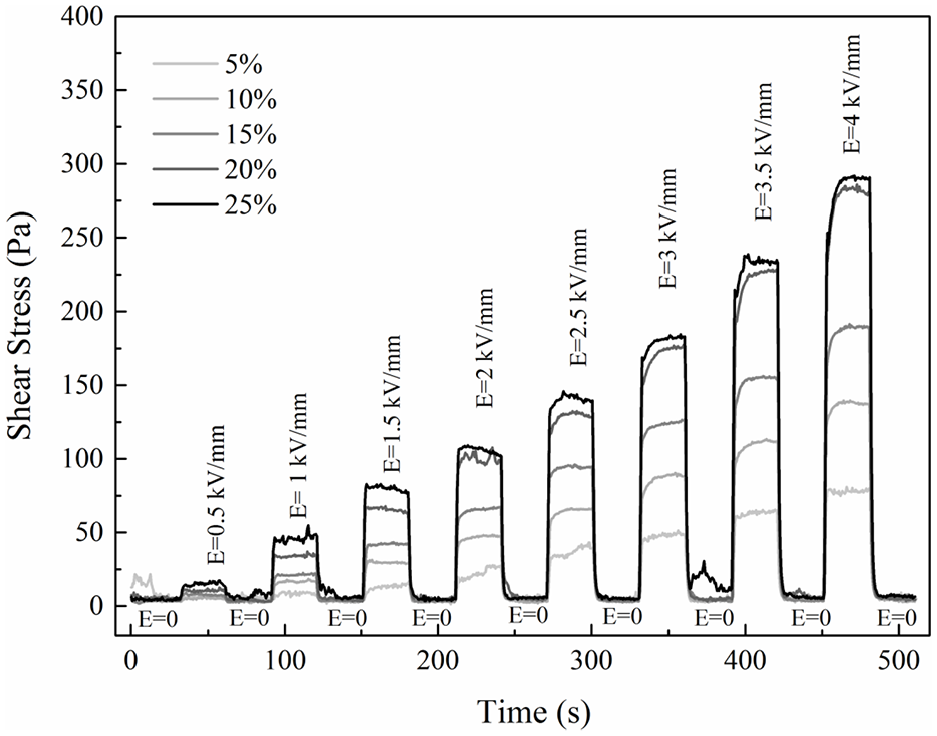
ER responses of PAT/SO dispersions: 5%, 10%, 15%, 20%, and 25% (m/V%).
In Figure 7, the shear stress of PAT/SO dispersions increase with applied electric field strength and this is due to increasing polarization forces between the dispersed particles. The polarization forces in the direction of applied electric field is defined as (Koyuncu et al., 2012):
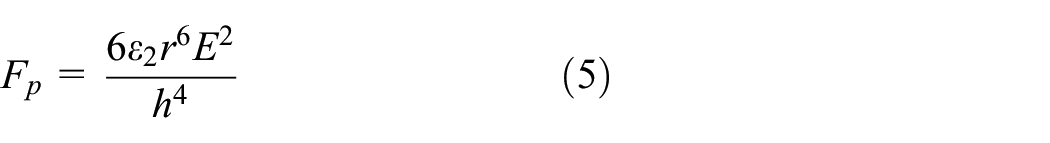
where
The equation shows that the polarization forces are proportional to the electric field strength and inversely proportional to the interparticle distance. Therefore, the higher amount of PAT leads to increase in the shear stress (Figure 7) due to decreasing interparticle distance and thus increasing interparticle interactions between PAT particles in PAT/SO dispersion. The shear stress is reached to 292 Pa at E = 4 kV/mm for 25% PAT/SO dispersion system. However, the increment is not significant between 20% (
The flow behavior of optimum 20% PAT/SO dispersion under applied electric field (E = 0–4 kV/mm with E = 0.5 kV/mm increments) is revealed via investigating the changes of shear stress and viscosity with increasing shear rate. Non-Newtonian shear thinning flow behavior is observed for the dispersion. The shear stress values observed to increase and show larger plateau region in a low shear rate range with increasing applied electric field strength (Figure 8). When shear deformation applied to a material under external electric field, two types of interactions, namely; electrostatic and hydrodynamic, between dispersed particles compete with each other to dominate the flow behavior. The electrostatic and hydrodynamic interactions are induced by the applied electric field and the shear deformation, respectively. In low shear rate range, the electrostatic interaction is dominant, and the shear deformation can be recovered in time. Thus, the shear stress remains constant for certain shear rate range in the plateau region. As shear rate increases, the hydrodynamic interactions become prevailing, and the dispersion starts to flow as the interactions are not enough to recover the electric field induced chain-like structure in expected time. The dynamic yield stress is a minimum shear stress at which the dispersion starts to flow. The extrapolation of the data of shear stress to zero shear rate gives the dynamic yield stress and it is a good measure of magnitude of the ER effect. In the previous studies, the Bingham model was used to explain the flow behavior and to determine the yield stress of ER dispersions, but Cho and coworkers proposed a new model (Cho-Choi-John, CCJ) (equation (6)) including six parameters for better fitting and explanation of flow behaviors of conducting polymer based ER fluids (Cho et al., 2005). The first and second parts of CCJ model can explain the flow behavior phenomena at low shear rate and high shear rate regions, respectively.
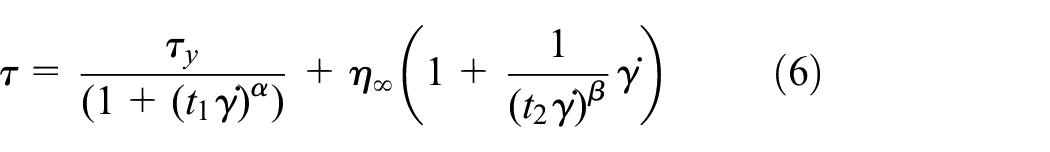
where, t1 and t2 are time constants,
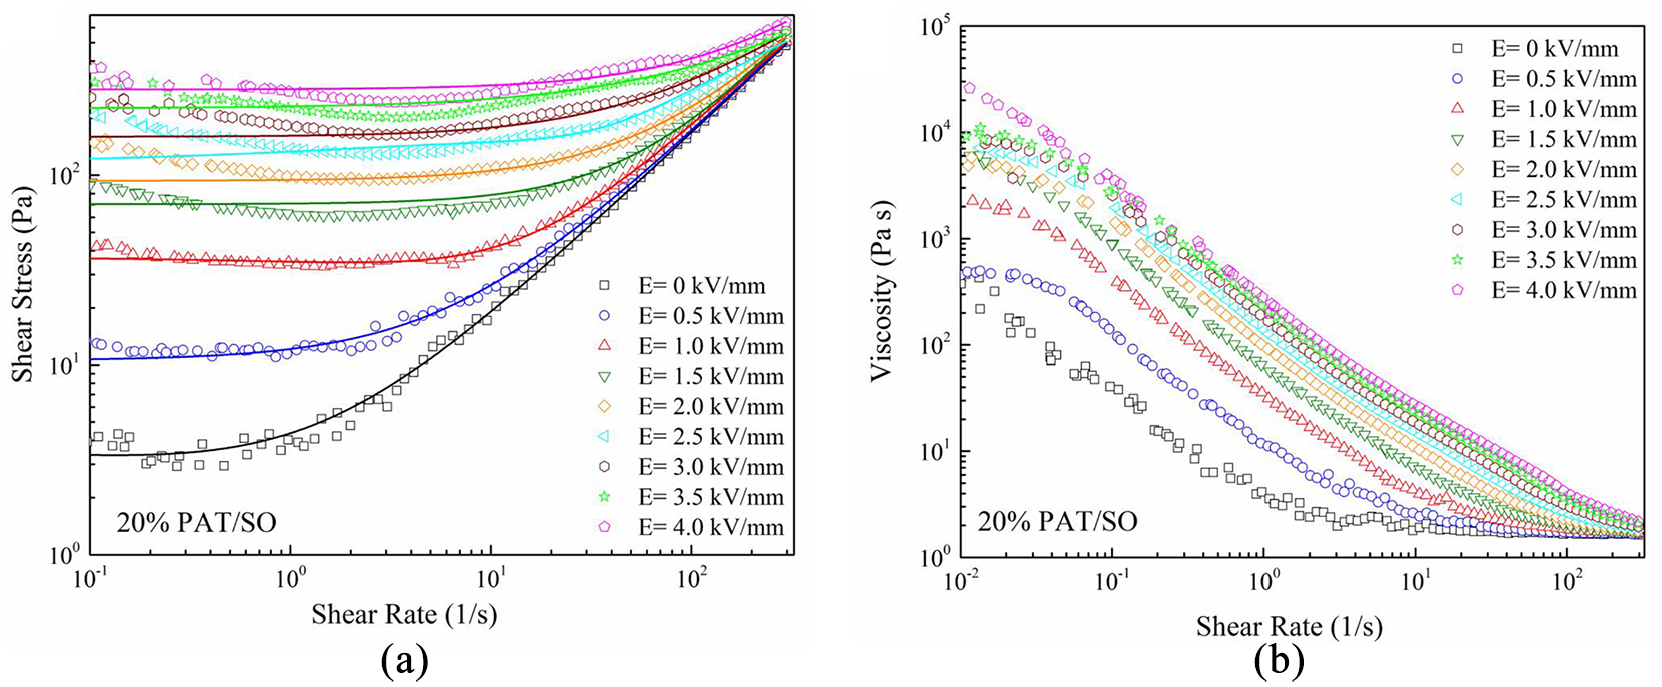
The effect of shear rate on shear stress (solid lines for CCJ fitting) (a) and viscosity (b) of 20% PAT/SO dispersion under various applied electric field strengths.
The electric field induced flow curves of 20% PAT/SO dispersion are fitted to CCJ model. The dependence of dynamic yield stress obtained from CCJ model to applied electric field strengths is illustrated in Figure 9. The yield stress increases with applied electric field strength due to the enhanced polarization of dispersed particles, so the highest yield stress is determined to be 283 Pa for E = 4 kV/mm for PAT/SO system. For PAQR/SO and polyphenylene/SO, the yield stress values were reported to be ∼100 and ∼240 Pa at E = 2 kV/mm (Plocharski et al., 2005; Wang et al., 2016). There is a significant difference in electric field induced yield stress value of PAT when compared to the previously reported PAQR and polyphenylene. It is well known that, dispersing medium viscosity affects the yield strength of an ER fluid and makes the comparisons difficult. Therefore, it is more reliable to compare the ER efficiencies of various systems in which the effect of viscosity of dispersing medium is discarded by subtracting off field (E = 0 kV) from the on field (E ≠ 0 kV) yield stresses.
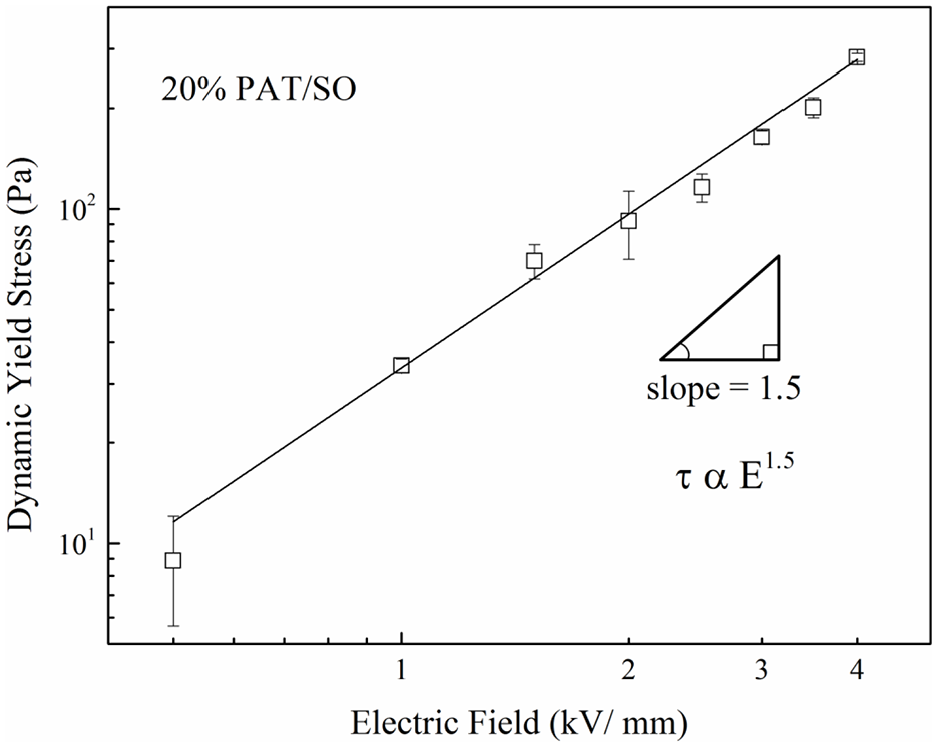
The change in dynamic yield stress values of 20% PAT/SO dispersion obtained from CCJ model with increasing applied electric field strengths.
The ER efficiency was calculated by using the following equation:

where
In this study, the ER efficiency of PAT/SO system under E = 3 kV/mm is calculated to be 81 which is much higher than the one reported for PAQR (23.75 at
The dynamic yield stress versus applied electric field strength graph also provides information about the ER activity mechanism of PAT/SO system. The dependence of the yield stress on the electric field strength is correlated in equation (8):

where
There are six ER mechanism models namely: (i) fibrillation, (ii) electrical double layer, (iii) water/surfactant bridge, (iv) polarization, (v) conduction, and (vi) dielectric loss models. According to equation (8), if m equals to 1.5 or 2; the ER mechanism follows the conduction or polarization model, respectively. (Dong et al., 2019). The electric field induced structure forms due to the conductivity and dielectric constant differences between dispersed particles and dispersing medium for conduction and polarization models, respectively (Krztoń-Maziopa et al., 2006). For PAT/SO dispersion system, the slope of the fitting line is 1.5 indicating that the driving force is the conduction model (Figure 9). The ER mechanism of previously reported conjugated, nonpolar, and linear polyphenylene was reported to be obeying the polarization model and the magnitude of polarizability attributed to the amount of doped FeCl3.
3.4. Colloidal stability of PAT/SO dispersion
The colloidal stability of ER fluids is an important parameter for industrial applications. The sedimentation of particles causes the ER activity of dispersion to decrease in time. According to the Stoke’s law, the density mismatch between dispersed particles and dispersing medium results in the phase separation with time (Cavicchi et al., 2018; Uemura et al., 1995; Whitmer and Luijten, 2011). The colloidal stability of optimized 20% PAT/SO dispersion system is identified according to the colloidal stability ratio versus time graph shown in Figure 10. The colloidal stability ratio is defined in equation (9):
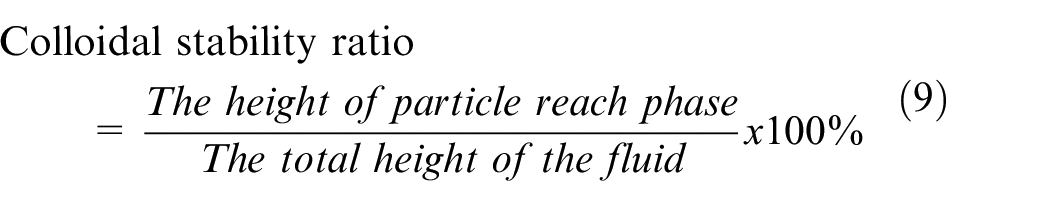
The results indicate that the colloidal stability ratio of PAT/SO system is below 50% after 10 days and only 40% of the dispersion remains unsettled after 30 days. Although the average hydrodynamic size of PAT is relatively small (600 nm by DLS), the colloidal stability measured in non-polar SO was not as high as expected. This may be attributed to the density mismatch between PAT (
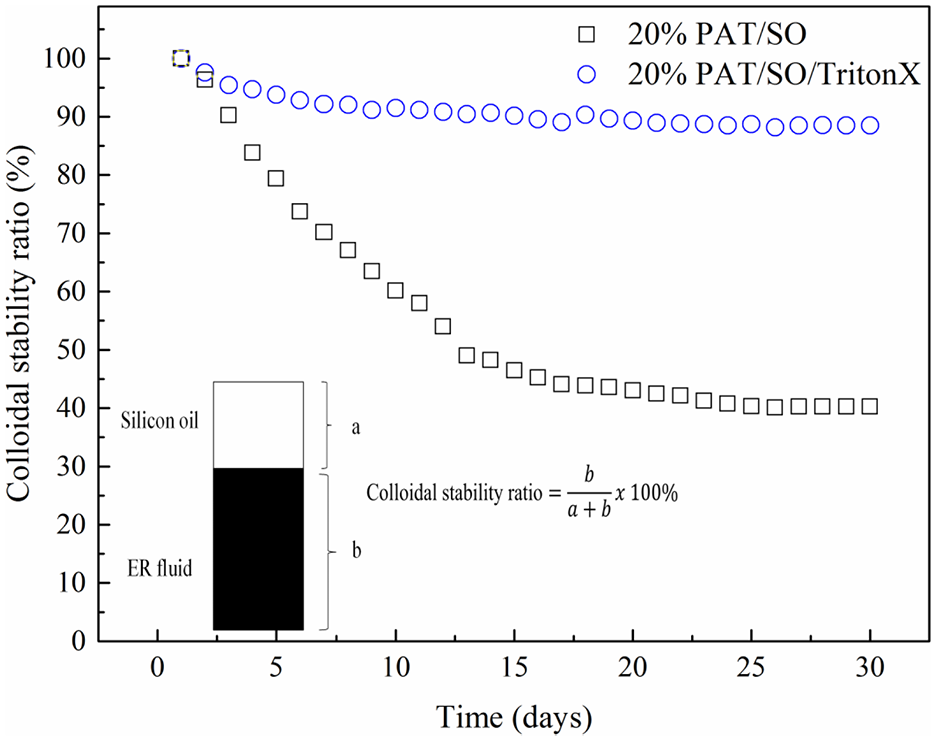
The colloidal stability ratio of 20% PAT/SO and 20% PAT/SO/TritonX dispersions for 30 days.
3.5. Electroactive vibration damping properties of PAT/SO dispersion system
To the best of our knowledge, the electroactive viscoelastic, creep-recovery, or vibration damping properties of PAT not hitherto been reported in the literature. For the industrial applications, it is important to obtain strong and sustainable elastic character for ER fluids; therefore, the dependence of
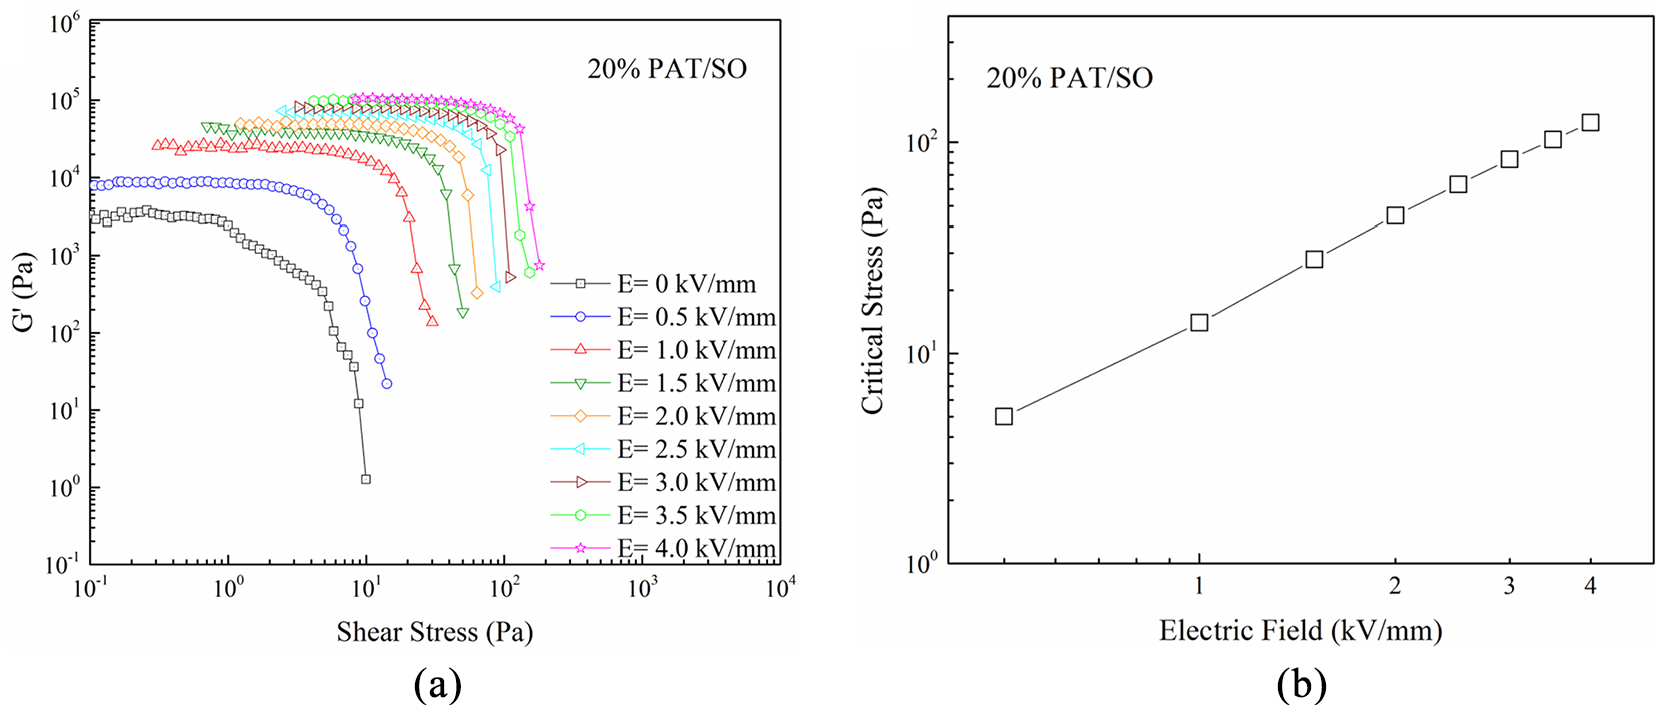
(a) The change of elastic modulus (
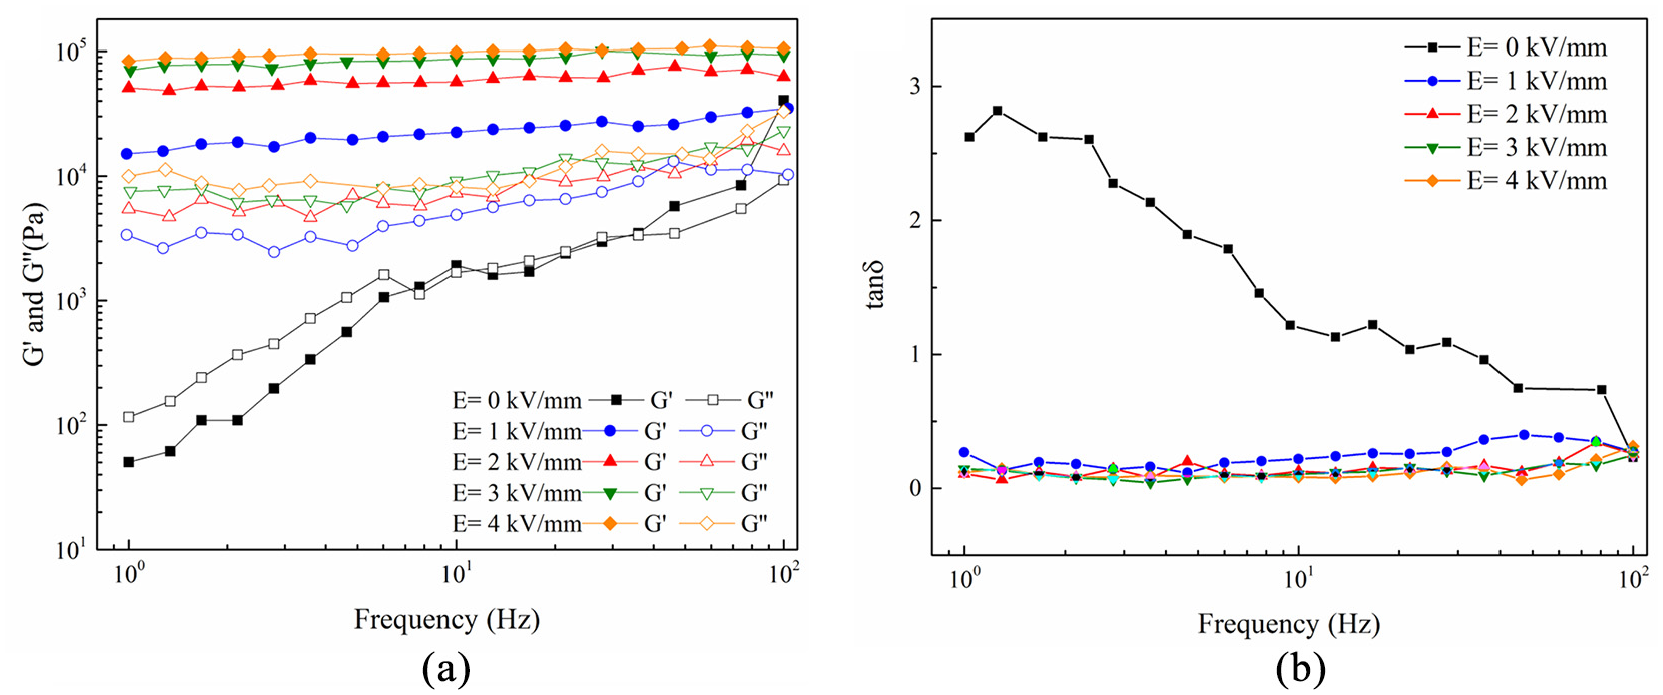
The change in (a) the elastic (
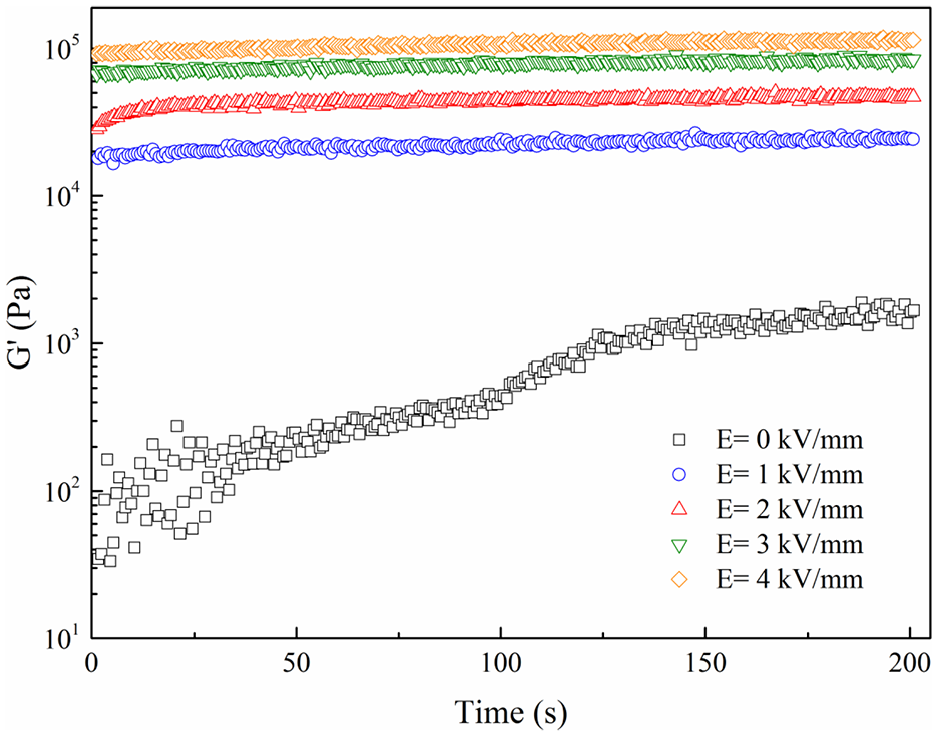
The time dependent change in
The change in the elastic (
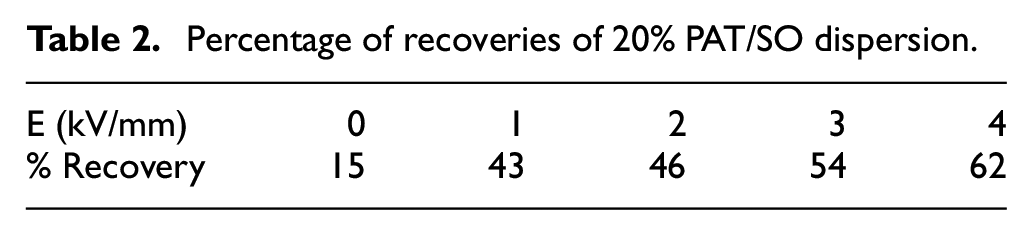
Viscoelastic properties are also investigated by the creep-recovery tests under various electric field strengths and the recoverable elastic portion of deformation are determined (Figure 14). The shear stresses were applied to the 20% PAT/SO dispersion system for 100 s and then the strain values are detected. The recovered strain and constant deformation are related to elastic and viscous parts of the material, respectively. The percentage of recoveries are calculated using equation (10):

where,
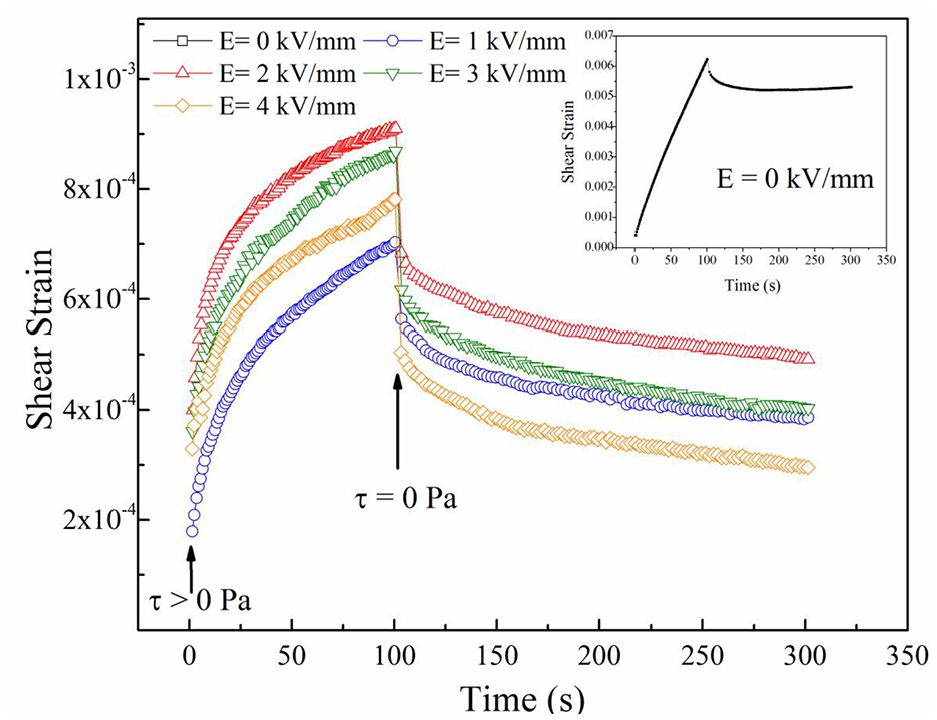
The creep-recovery behavior of 20% PAT/SO dispersion.
Percentage of recoveries of 20% PAT/SO dispersion.
4. Conclusion
The dielectric and time dependent ER response results indicate that the optimum PAT content is 20 m/V%. The dielectric analyses indicate that the polarizability of PAT/SO dispersion system is higher than the previously reported PAQR/SO dispersion. The electric field induced flow tests have shown that 20% PAT/SO dispersion system have ER activity following the conduction model with 283 Pa yield stress at E = 4 kV/mm. Additionally, its ER efficiency is better than the previously reported PAQR/SO and polyphenylene/SO dispersions, which have comparable structures. To the best of our knowledge, the vibration damping properties of PAT/SO system have not hitherto been reported and the experimental results in this study show that PAT/SO dispersion system can be promising material for the industrial vibration damping applications. The investigations on viscoelastic properties depicted that PAT/SO dispersion system has viscous behavior under E = 0 kV/mm; on the other hand, the elastic behavior is dominant under externally electric field induced conditions. The
Footnotes
Declaration of conflicting interests
The authors declared no potential conflicts of interest with respect to the research, authorship, and/or publication of this article.
Funding
The authors disclosed receipt of the following financial support for the research, authorship, and/or publication of this article: The authors thank to Gazi University Research Fund (Grant No.: 05/2020-12) for financial support of this work.