






Abstract
The suspension strut mount plays a crucial role in any vehicular suspension system, where it acts as a connector (bolted) to the vehicular body and suspension strut. The mount’s purpose is to cushion the Vehicular impacts and reduce the jarring effect, noise, and vibration caused due to vehicle movement over the undulated roads. The self-loosening of bolts results because of the up and down impact of the spring cause the jounce bouncer to push and pull action at the mount interface, cause vibrations transmitted to the vehicle camber. Self-loosening leads to damage of mount followed by clunking noises, noisy steering, tire misalignment, and can cause discomfort to the passenger. Therefore, condition monitoring and assessment of an upper strut mount is necessary for vehicles. This paper studies the feasibility of the piezo Impedance-based Structural health monitoring (SHM) technique to monitor the self-loosening bolts in the upper strut mount of the suspension system (MacPherson strut suspension) of passenger car. The piezo coupled signatures were obtained experimentally by loosening all the three bolts (connected to strut bearing) through control torques through a digital torque wrench. All the experimental signatures were acquired with a single PZT patch bonded to the surface of the upper strut mount for loosening bolts with pre-tight loss. Progressive damage scenarios are simulated along with preload loss of either single bolt or all three bolts, respectively. Three different statistical damage indices were evaluated for damage quantification raised due to bolt loosening. A 3D numerical modeling of strut mount is done using ANSYS WORKBENCH, and piezo impedance signatures were acquired (hence converted to admittance) for validating the experimental signatures. In an overall, this study provides an insight into the loss of structural integrity due to the self-loosening of suspension bolts, which can be threatful to vehicular integrity.
Keywords
1. Introduction
The suspension system of a vehicle, a mechanical assembly that connects the wheels to the vehicular frame. Many engineering efforts were made to design effective suspension systems to improve vehicle rides and passenger safety and comfort (Organiscak, 2014). The main functions of a suspension system are to prevent the road shocks from transmitted to the vehicle frame, to preserve the stability of the vehicle in pitching or rolling, to safeguard the occupants from road shocks, and to provide good road holding while driving (Shirahatti et al., 2008). There are two primary components of a suspension system, namely spring, which absorbs road shocks or impacts due to bumping in the road by oscillating and damper, which reduce the tendency of the carriage unit to continue to jump up and down on its springs. Oscillations due to road shocks are restricted to a reasonable level by a damper (Huo et al., 2017; Temitope, 2015). Springs are resilient members and act as reservoirs of energy.
The damping system mainly dissipates the absorbed energy (Goodarzi and Khajepour, 2017; Jugulkar et al., 2016). The shock absorber consists of a piston rod connected to the upper strut mount, and the upper mount is connected to the piston, which sits in a tube filled with hydraulic fluid (Manoharan et al., 2017). The MacPherson type is the most widely used suspension system. Earle S. MacPherson invented it in the year 1947 (Gilles, 2005). The upper strut mount is a significant component in a vehicle that connects the vehicular body to the strut and acts as a force connector between them. The upper strut mount consists of two elements, that is, bearing plate and rod nut and bolt connection.
Upper strut mounts are often ignored during routine maintenance of vehicles until bolts were complete wear and tear due to excessive vibration (Pai and Hess, 2002). Failure to replace a worn upper strut mount can cause a knock-on effect on other vehicle components. Therefore, condition monitoring of the upper strut mount can be performed for better evaluation of vehicular health compared to routine assessment of the suspension system (Caccese et al., 2004).
The threaded rod nut and bolt joint is a widespread type of joint, acts as a connector for many complex engineering systems. In actual condition, the bolt joint requires a sufficiently large preload to guarantee a reliable force transmission between the clamped components. However, due to the complexity of working environments, bolt joints often experience self-loosening with increasing service time, which can cause a decrease in the contact stiffness and, in some cases, may even lead to fatal consequences if it remains undetected when the vehicle moves over the irregular road surface, the caused vibrations that are said to be transferred by the upper strut mount, which causes the self-loosening of its bolts (Wang et al., 2013a).
Pai and Hess (2002) introduced the concept of localized slip and classified the self-loosening process into four different combinations of the bolt head and thread slip to check the loss of contact stiffness while loosening. Bolt joints often cause problems because of their operational conditions. Condition monitoring of the upper strut mount of a vehicle’s suspension system is vital. It is often ignored during routine maintenance, which can lead to many defects in the vehicle. Due to excessive vibrations from the road, strut mount often experiences self-loosening of the bolts, termed a damage criterion for the suspension system. Many times, unintentional loosening of bolts is seen during operation, called as vibrational loosening. It must ensure that the bolts remained tightened and maintain the preload conditions (Huynh et al., 2018). Also, Failure to replace a worn upper strut mount will cause it to deteriorate very quickly, which will have a knock-on effect on other components, such as the shock absorbers and even the tires (Huynh et al. 2018; Li et al., 2020a, 2020b). Often, fatigue failure results from the self-loosening of the bolt, which reduces the clamping force acting on the joint (Dahil, 2017; Goodarzi and Khajepour, 2017; Wang and Song, 2019; Wang et al., 2013b, 2013c, 2019).
Such self-loosening has been a critical problem since the industrial revolution, but it’s only a decade since the inventors have coined the prevention technique. This mechanism can be classified as rotational and non-rotational loosening. Rotational loosening, more commonly referred to as self-loosening, is when the fastener rotates under the action of external loading. As a result of rotation, the relative motion occurs between threads and bearing surfaces of the bolt and the joining material. Junker (1969) found that transverse dynamic load can cause a severe condition for self-loosening than dynamic axial loads. Hence, many researchers suggested that the tightening specification of structural/machinery joint must include a torque range, that is, prevailing torque with maximum and minimum limits, so that the joint can be economically assembled with ensured safety.
The term SHM originated in the early 19th century, quite before it had been widely used for practical applications, including various non-destructive techniques and evaluation (NDT&E). Structural Health Monitoring (SHM) is typically used to track and evaluate the performance, symptoms of operational incidents, and anomalies due to deterioration or damage during operation and after extreme events (Aktan et al., 1998). The Electro-mechanical Impedance (EMI) is one of the emerging methodologies, has tremendous potential applications in the civil, mechanical, and aerospace industries. In this application, the PZT transducers, bonded on the surface of the structure, interact with the host structure to acquire a unique health signature, called admittance signature which is the function of the structural impedance (Bhalla, 2001; Bhalla and Soh, 2004a, 2004b, 2004c; Bhalla et al., 2005, 2009; Kim et al., 2019).
In the EMI technique, the PZT patches attached to the structures are electrically excited by an impedance analyzer or an LCR meter at a higher frequency range of 30–300 kHz (Lim et al., 2011; Na, 2017; Sun et al., 1995). Usually, the electro-mechanical admittance signature, comprising of the conductance (real part) and the susceptance (imaginary part), is acquired in the healthy condition of the structure, called the reference baseline for future checks on the structural integrity. Bhalla and Soh (2004a, 2004b) developed a two-dimensional piezo-impedance approach based on the concept of effective impedance to model the PZT-structure interaction manifesting active and passive part of coupled admittance signature. The structural impedance (Zs,eff), which in turn alters the admittance (
where, ω is the angular frequency, l the half-length, and h the thickness of the patch,
Okugawa (2004) proposed a new method of bolt loosening detection by adopting a smart washer composed of piezoelectric material by using a sub-space state-space identification algorithm (4SID). Through the experiment, he established a correlation between the natural frequency change with the difference in bolt tightness. A similar kind of study was reported by another researcher (Mascarenas et al., 2005), where an intelligent washer monitoring system equipped with PZT patches installed on their surfaces. They found that the proposed is efficient only after a significant preload loss in bolt. Again, their studies were limited to a very low torque level only.
Further, a more insightful and embedded ultrasonic method was proposed by Zagrai et al. (2010) to monitor bolt loosening monitoring for space structure for SHM of spacecraft components, monitoring system dynamics during launch, and assessment of in-service variation of structural properties. They used a small unobtrusive piezoelectric wafer active sensor to detect and locate the loosened bolt in complex space structure structures through induced elastic wave propagation. Nguyen et al. (2011) presented a structural health monitoring method for bolted connections by using multi-channel wireless impedance channels to the PZT patch. They utilized RMSD variation for damage monitoring and only found it efficient for low frequency (<100 kHz) EM impedance measurements.
Many researchers have done a complete review of monitoring techniques utilized for bolted joints (Miao et al., 2020; Nikravesh and Goudarzi, 2017; Wang et al., 2013a). They found piezoelectric impedance method has a high sensitivity to the local structure damage and a large-frequency bandwidth and most suitable for bolted joints that are dominated by local dynamics of high-frequency characteristics. Most of them stressed more on the efficiency of indirectly based tests, that is, impedance-based methods and ultrasonic-based methods, than direct methods (strain gages and torque control).
Later, the piezo impedance-based monitoring technique was explored by Panidis et al. (2014) for full-scale aircraft components. They found that loosening of a bolt-joint caused a significant and statistically stable change in the real part of the EMI signature and suggested the installation of the PZT patch nearest to examined bolt for better results. Wang et al. (2013a) analytical modeled the bolted joint for EMI technique and conferred a significant correlation between electric Impedance of a PZT patch and mechanical Impedance of a bolted joint at high frequencies. Martowicz et al. (2016) proposed an experimental technique for damage monitoring of a bolted pipeline section equipped with custom-made washers that allowed for the measurement of both point and transfer frequency response functions (FRFs). But the major drawback was the researchers could not be able to find some inevitable variation in deterministic damage indices for progressive damage growth.
An image-based bolt-loosening monitoring technique was employed for bolted joints connecting tubular segments for wind turbines by Park et al. (2015). From the study, they studied the feasibility of wave-based method to monitor a large structure having a ring flange and 32 sets of bolt and nut. Another wave propagation technique was employed to monitor the status of bolted joints through sending and receiving elastic waves by Parvasi et al. (2016). From the results, they found that the energy of the propagated signal to be focused on a source (damage) location for better detection. A coupled finite element method analysis was prepared to demonstrate that the peak amplitude of the focused signal was closely proportional to the value of the applied bolt preload. For the very first time, the integration of global vibration and impedance response was proposed by Nguyen et al. (2017) and they examined for a laboratory-scale wind turbine tubular structure for various bolt-loosening scenarios. Through the supported global vibration-based technique for damage location estimation, however, they had several errors because of limited measurement data.
Many other researchers also studied the cause and effects of self-loosening of bolts and their undesired dynamic stresses, fatigue, and consequent Failure of the structure/machine, power, and energy losses, and reduced reliability (Liu et al., 2021 ; Kakirde and Dravid, 2017). Rusli et al. (2006) proposed a multi-input and single-output modal impact testing of bolt mounted on cantilever beam for piezo impedance-based Structural health monitoring. They found that the self-loosening significantly decreased the natural frequency of the structure and increased the damping ratio.
A complete and extensive experimental study was done on the self-loosening of the bolt by Huynh et al. (2018). They measured impedance signatures for lab-scaled bolted girder connections and found a sensitive frequency band to evaluate the effectiveness of the proposed method for bolt-loosening detection. From the numerical and experimental observations, they conclude the impedance signatures were very efficient and sensitive to preload losses in bolts. In addition to that, other researchers also tried to implement artificial intelligence to identify the loosening in a multi-bolt connection for large civil and mechanical infrastructure (Amerini and Meo, 2011; Rutherford et al., 2007; Wang et al., 2018, 2020a). However, they only considered the binary status (loosening or not) of each bolt. An attempt of multi-input and single output method based SHM was made by Chen et al. (2020) for better monitoring with series and parallel connection for impedance signal through a frequency sweep. The proposed technique locates the position and reveals the severity of loosening bolts based on experimental results.
This paper investigates the potential of the piezo impedance-based SHM technique for self-loosening of bolts in vehicular components, that is, upper mount strut. In this study, the upper strut mount of Hyundai Accent is considered for condition monitoring. The piezo-coupled signatures were acquired using an impedance analyzer. The coupled signatures were compared for undamaged (all bolts are tightened) and damage state (near piezo bolts or all bolts are loosened) for vehicular health evaluation. Statistical damage indices are evaluated for quantitative damage severity. An attempt is made for numerical simulation of upper mount strut through ANSYS coupled field simulation. Also, numerical signatures are also compared for both undamaged and damaged states. The following section covers the experimental setup and procedure.
2. Experimental set-up
In this study, a MacPherson strut, commonly used for automotive (passenger car) suspension system was considered (see Figure 1). It consists of a strut insulator with congenital integration of spacer, upper mount nuts, and bolts (three numbers, acting as a connector for suspension system to that of upper body). For the experiment and numerical studies, the author has taken the Front-Suspension Strut of MacPherson-Strut class of Hyundai car 1999-05. Specifically, the authors obtained the strut mount for the Hyundai accent car. The steel bolts of M12 torque converter bolt used for this study. The minimum preload required for fully tighten for this Upper strut mount nuts, for Accent 20–30 N m (Autozone, 2019).
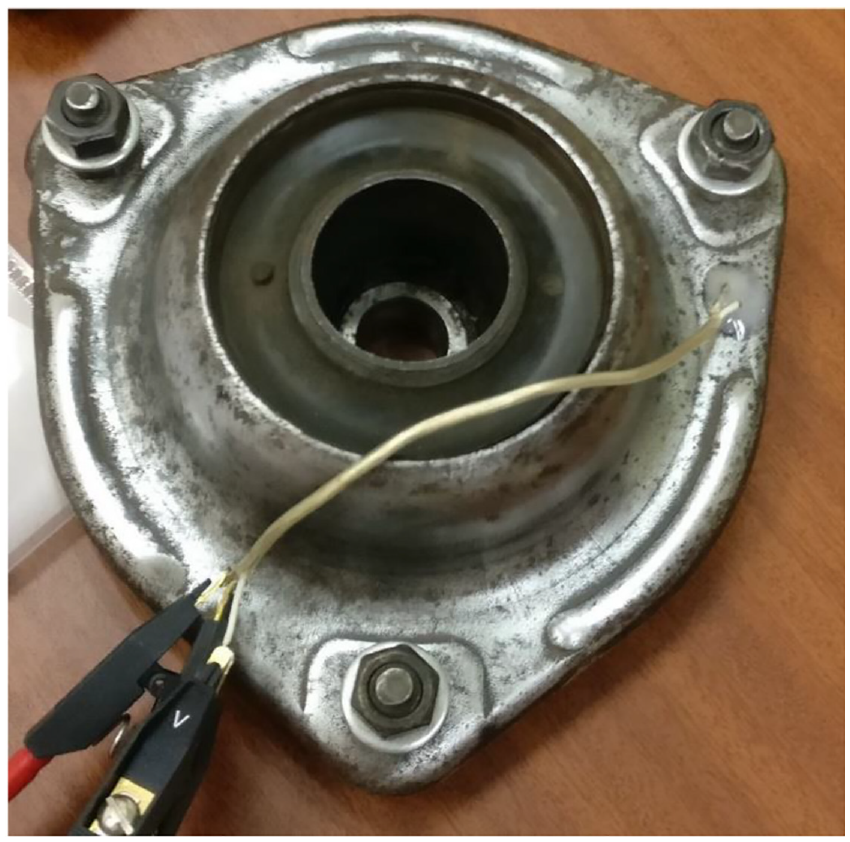
An upper strut mount.
A single PZT patch (PIC 151, PI Ceramic, 2019) was bonded on the surface of the bearing plate of strut mount using high-strength adhesive, and baseline data was acquired for the sensor via LCR meter (Agilent E3440A). The EMI signatures were obtained by actuating the PZT patch to high-frequency excitations (30–300 kHz) of the electric field using an impedance analyzer or LCR meter (refer to Figure 2). In general, for the EMI technique, the operating frequency range of 30–400 kHz is quite suitable for greater dynamic interaction between the structure and the PZT patch (Sun et al., 1995). Park et al. (2003b) recommended a frequency range from 30 to 400 kHz for PZT patches 5–15 mm in size. Through self-sensing techniques, any change in the mechanical impedance of the structure (i.e. deterioration of contact stiffness) caused by any damage (loosening of bolts) alters the piezo coupled admittance signature. Usually, the electro-mechanical admittance signature, comprising of the conductance (real part) and the susceptance (imaginary part), but this study includes conductance only.

Experimental setup for EMI technique.
Many past studies have confirmed that conductance plots are sufficient to indicate any deterioration in structure for monitoring purposes (Sun et al., 1995). At the initial stage, the repeatability study of signatures were done for confirming the stability of sensor reading and considered as baseline signature (Moharana and Vishnu, 2019). The baseline scenario considered here as when all the three bolts of strut mount were tightened to 20 N m.
Different damage states were induced by loosening the bolts through a digital torque wrench for three torque amounts. The damage scenes are divided into two sections, that is, (a) loosening the bolt (only) near to bond PZT patch (b) loosening all three bolts simultaneously. The complete information of the damage scenario is listed in Table 1. The electro-coupled admittance signatures were recorded via LCR meter, and a comparative study was performed to determine the loss of damage and structural integrity (contact stiffness) of the strut mount through the graphic user interface of VEE-PRO software.
Damage scenario for different stages of self-loosening of bolt.

Bolt 1 is the bolt near PZT patch.
As listed in Table 1, For the first case, the damage was induced by loosening one bolt near to the PZT patch with a digital torque wrench with the amount of 5, 10, and 15 N m, respectively (named as damage state B1, B2, and B3). The above damage situation category is put under incipient damage condition upper mount strut. For the second case, the damage scenario was simulated by loosening with a digital torque wrench with an application amount of 5, 10, and 15 N m, respectively (named damage state C1, C2, and C3). These damage situations collectively put under moderate damage condition upper mount strut. Finally, severe damage is created by loosening all the bolts completely with the torque of 20 N m, named D. The EMI signatures were measured for each of these damage scenarios for the frequency range of 30–300 kHz (Sun et al., 1995). For better visibility of frequency shifting, a closer view of conductance signatures were plotted for the selective frequency ranges, that is, 30–50, 95–100, 150–170, 245–255, and 260–300 kHz (see Figure 3). For the incipient damage scenario (i.e. B1, B2, and B3), the conductance signatures were plotted and shown in Figure 3.

Experimental real admittances for incipient damage cases (B1, B2, B3). (a) for frequency range 30–50kHz; (b) for frequency range 95–100kHz; (c) for frequency range 150–170kHz; (d) for frequency range 245–250kHz; (e) for frequency range 260–300kHz.
The conductance peaks shift left and attain a very high value with an increment of damage level for all the frequency range plotted for incipient damage condition. This may cause due to initial loss of contact stiffness in the vehicular system (see Figure 3(b) and (d)) (Li et al., 2020a, 2020b; Zhang et al., 2017). In a similar fashion, the conductance plots were obtained for damage scenarios C1, C2, C3, and D, shown in Figures 4 and 5. For moderate damage scenarios (C1, C2, C3), it can be observed that peaks shift left and decrease with progression of damage, and there was the progressive lowering of vehicular integrity with a decrement of contact stiffness (see Figure 4(c) and (d)). Moreover, for all loosened states (damage state 3), the conductance peaks get lowered and shifted leftward (see Figures 3 and 4). Only difference is found for sever damage condition where the piezo resonance frequency shifts to right (see Figure 5). This typical behavior of conductance peaks notices when there is degradation structural stiffness occurred in any smart structural system.

Experimental real admittances for moderate damage cases (C1, C2, C3). (a) for frequency range 30–50kHz; (b) for frequency range 95–100kHz; (c) for frequency range 150–170kHz; (d) for frequency range 245–250kHz; (e) for frequency range 260–300kHz.

Experimental real admittances for sever damage case (D). (a) for frequency range 30–50kHz; (b) for frequency range 95–100kHz; (c) for frequency range 150–170kHz; (d) for frequency range 245–250kHz; (e) for frequency range 260–300kHz.
For quantitative damage estimation, three different statistical damage indices were evaluated for this study, namely Root Mean Square Deviation (RMSD), mean absolute percentage deviation (MAPD), and correlation coefficient deviation (CCD) index can be expressed (Tseng and Naidu, 2002).
where
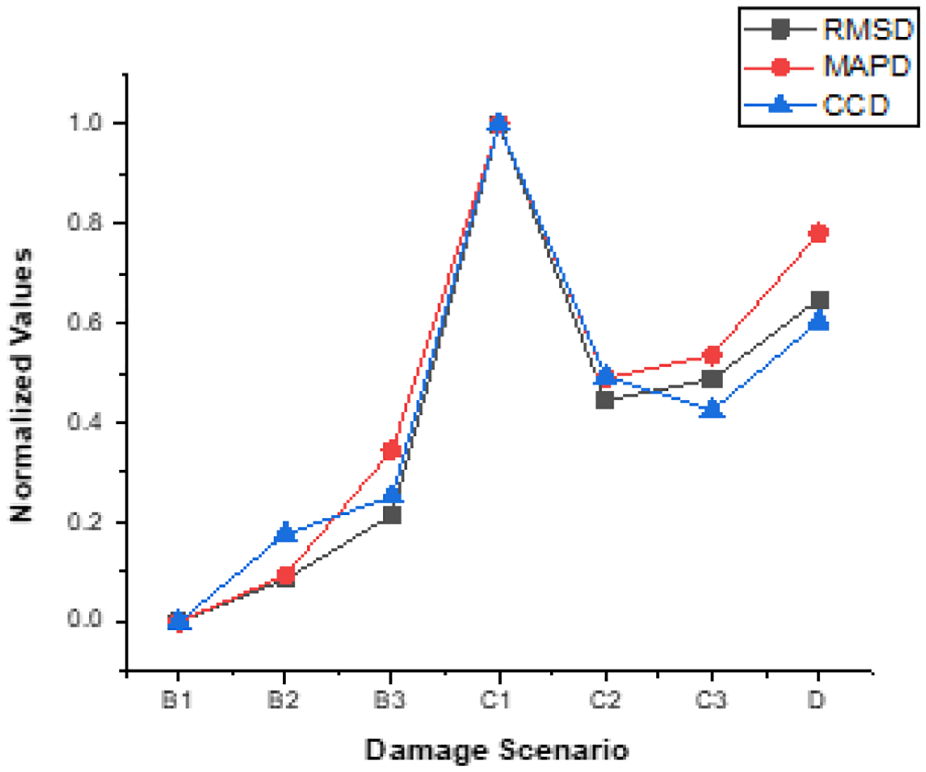
Experimental damage metrics for different scenarios.
For insightful data exploration, two consecutive piezo conductance peaks are chosen for two sets of the frequency range, that is, 43–45 and 50–54 kHz (basically structural peaks). As mentioned earlier, piezo conductance peaks are sensitive toward damage progression, hence percentage variation of frequency decrement for all the damage scenarios has tabulated in Table 2. In most cases, the conductance peaks shifted to the left (shown in admittance signature) indicates the decrement of frequency for incipient damage, quite pertinent from Table 2. A similar pattern has observed for the moderate case but severe condition, the overall decrement frequency is quite drastic and noticeable (see Table 2). Also, it is also verified the suitability of chosen frequency range as Piezo coupled structural frequency usually lies in the lower frequency range.
Change in the peak frequencies due to bolt-loosening.

3. Numerical analysis of self-looseningof bolts
Bolt geometry complexities forced many researchers to pursue numerical methods, in particular the finite element method (FEM). The advantage of FE analysis is that the strain and electrical field distributions throughout the Structural system with complex geometry can be calculated. Over the past decade, significant progress has been made in the development of finite elements for piezoelectric applications. But most of these developments are limited to the application of commercial finite element codes, such as NASTRAN, ABAQUS, and ANSYS. The new piezoelectric finite element capability available in these commercial codes makes them a very powerful tool in an integrated process of designing, prototyping, and testing a transducer. Hence this study also includes the piezo impedance analysis of upper strut mount with bonded PZT patch with the help of coupled the nodes for VOLT degree of freedom.
In continuation with FE, analysis of loosening bolts for structural joints has been done by many researchers. Pavelko (2013) proposed a 2D model of constrained PZT patch and performed a frequency based on modal decomposition analysis for monitoring bolt-joint loosening through evaluations of elastic properties and geometrical parameters of PZT patch. They found the model successful structural health monitoring of aircraft components with different possible damages. Panidis et al. (2014) developed a 3D model PZT and structure with Mi-8 helicopter bolt-joint and performed dynamic analysis. They found that the main effect of loosening is indicated by the change of the peak of the real part of the EMI, but their semi-analytical is only effective when the loss factor for loosening at 80% and 60%. Wang et al. (2018) proposed energy dissipation due to damping of the bolted joint caused by bolt preload through wave propagation and analytical fractal contact theory. The proposed methods took care of the imperfect interface into account and the correlation between preload loss and equivalent bolt stiffness. Luo et al. (2021) effective method to design and fabricate PZT transducers with distinguished EMI characteristics by bonding PZT patch on permanent magnet disks ensures to obtain distinguished peak frequency for thickness change. The proposed smart modulation transducer (SMT) under the different thicknesses of the magnetic disk were obtained by finite element method (FEM) simulations and verified through experimental results. They obtained severity and location of bolt looseness via the modified MAPD (mean absolute percentage deviation) damage index. Wang et al. (2020) proposed a FEM simulation of bolted connection status through stress-strain analysis of a bolt head during the pre-tightening force of the bolt. The authors monitored the average radial strain in the bolt annulus increases with the increase of the bolt pre-tightening force also the strain in the annulus closer to the center of the bolt top surface. Li et al. (2020b) proposed a novel numerical model is proposed to simulate the PZT transducer enabled SHM method for monitoring the looseness of bolted connection. They have modeled a 3D modeling of lap joint of steel plates bonded together with bolt joint. The authors introduced microscopic roughness of bolted interface by using the fractal contact theory. They established the relationship between the peak amplitude of the received signal and the applied preload on the bolted joint. Fan et al. (2018) developed a finite element model for a pin-connected structure including the contact interfaces between the pin, and the support base is proposed to monitor the pin connection loosening through piezo impedance SHM. The couple field analysis was done for pin structure, and they found that with the load reduction, the contact stiffness of pin connection decreases which causes the resonant frequencies to shift to the lower frequencies. They noticed the frequency shift and peak splitting of the EMI signature. Huynh et al. (2019) developed a Piezoelectric-Based Smart Interfaces for bolted connection in a lab-scaled girder. The PZT smart interface acts as flexible bending (actuation-sensing) sensor module, facilitate monitoring. Again, Sun et al. (2020) proposed the evaluation and design of anti-loosening bolts for the reliable performance of mechanical and building structures, is highly significant. The obtained damage sensitivity of the numerical impedance responses is compared with the experimental results for the verification. Though many FE simulation studies found in literature bolt loosening with torque loss either surface or interface bonded configuration.
4. Modeling information
A three-dimensional CAD model of the upper strut mount was modeled using SolidWorks, as shown in Figure 7. Later the model is exported to ANSYS Workbench. The eight noded brick element SOLID 187 was used for modeling the upper strut mount and SOLID 5 for the PZT patch. Figure 7(b) shows the meshed volume of the mount strut (host structure). Solid 187 (3D brick element) is being used for modeling the host structure. It has three structural Degree of Freedom (ux, uy, and uz) at each node. For the PZT patch, Solid 5 was used for both structural (ux, uy, and uz) and electrical degree freedom (VOLT). The material properties for the steel mount, the PZT patch, and the adhesive (used for bonding) are listed in Table 3 (Moharana, 2021; Moharana and Bhalla, 2012).

(a) CAD model of upper strut mount and (b) meshed model of upper strut mount.
List of material properties used for numerical analysis.

The bottom of the upper strut mount (area under xz plane) of the FE strut mount was set to zero to simulate bonding with the strut insulator, which is further connected to the vehicular suspension system. In real vehicular system, the bottom part of the front strut mount refers to the jounce bumper. The bottom of the PZT patch was simulated as bonding on the insulator by setting all the displacements are zero. Bolts and nuts are modeled with the real thread geometry. The other connector properties are confirmed to EN 1993-1-8. For the modeling of bolts, the necessary care has been taken to have appropriate stiffness of the bolt and connection with compliance with the ultimate limit state of the connection.
The piezo impedance analysis was done through ANSYS workbench under the module “Piezo and Micro-Electro-Mechanical Systems (MEMS) extension.” Modal analysis was performed to check the frequency convergence with an optimal mesh size of 5 mm. The natural frequency was found to converge this particular meshing. Harmonic response analyses were performed to determine the dynamic response of the smart system (strut mount + PZT patch) for the frequency range of 30–300 kHz. The voltage is applied across the thickness of the PZT patch with a potential difference of 1 V. At first piezo impedance, signatures were obtained for Baseline (Pristine) scenario and for other damage conditions, that is, Incipient (B1, B2, and B3), Moderate (C1, C2, and C3), and Sever (D).
Bolts and nuts are modeled with the real thread geometry preloading of the bolts are applied by the turn-of-nut method (Heistermann et al., 2017). In this method, hexagon edges of nuts are kinematically coupled to the reference points in the centerline of each nut. Reference points are turned by applying moments. The bending moment is applied “displacement controlled” by imposing rotations of the upper reference point (i.e. the top face of the bolts). For simulation of damage scenario, Moments were defined by a vector of magnitude (5, 10 N m, etc.) corresponding to the damage cases (B1, B2…. etc.) and applied on the top face of the bolts to simulate the application of torque (enabling gradual self-loosening of bolts). The clockwise moment (for tightening) and anti-clockwise moment (for loosening) were employed in bolt model for FE model (De Castro et al., 2019; Tawie et al., 2019). The explicit dynamic solver of ANSYS is known to be robust for this kind of analysis, where complex contact interactions are coupled. In this model, the dynamic solver is used to efficiently solve the quasi-static problem. The magnitude of torque is kept the same as an experimental case to achieve a damage scenario, as mentioned in Table 1. The piezo impedance (
where
5. Numerical simulation results
The numerical admittance signatures were obtained through ANSYS workbench for the pristine (all bolts tightened to 20 N m) and three different damage conditions that is, incipient (B1, B2, and B3), Moderate (C1, C2, and C3), and severe (D, all bolts are loosened to 20 N m) damage scenarios.
The numerical admittance (real part. G) were plotted for the selective frequency ranges (i.e. 30–40, 50–90, 120–170, 190–230, and 255–300 kHz) for better visualization of conductance peaks variation (Figures 8–10). Though the conductance values of numerical signatures are not the same order as experimental signatures, but the overall pattern of conductance curve and occurrence of its resonance peaks follow the same order as experimental signatures. Similar inconsistency was also reported by another researcher (Fan et al., 2018) with a reason of non-homogenous distribution of materials properties (density, mechanical damping factor, and elastic modulus) in the actual case. However, in the ANSYS numerical analysis, it was assumed to be the same. It is seen that the conductance peaks are shifted left for incipient damage scenarios (refer Figure 8(c) and (d)). For moderate damage conditions, similar variation is seen for resonance frequency (shifting left) but a sudden decrease in peaks occurred (see Figure 9(a) and (b)). For severe damage conditions, the conductance signature pattern significantly changed, as it can be noticed that peaks shift right and attain higher value. This signifies the suitability of the FE model as it captures the loss of complete contact stiffness between bolt connector and spacer and insulator plate (see Figure 10(b), (d), and (e).

Numerical conductance signature for B1, B2, B3. (a) for frequency range 30–50kHz; (b) for frequency range 95–100kHz; (c) for frequency range 150–170kHz; (d) for frequency range 245–255kHz; (e) for frequency range 260–300kHz.

Numerical conductance signature for C1, C2, C3. (a) for frequency range 30–50kHz; (b) for frequency range 95–100kHz; (c) for frequency range 150–170kHz; (d) for frequency range 245–255kHz; (e) for frequency range 260–300kHz.
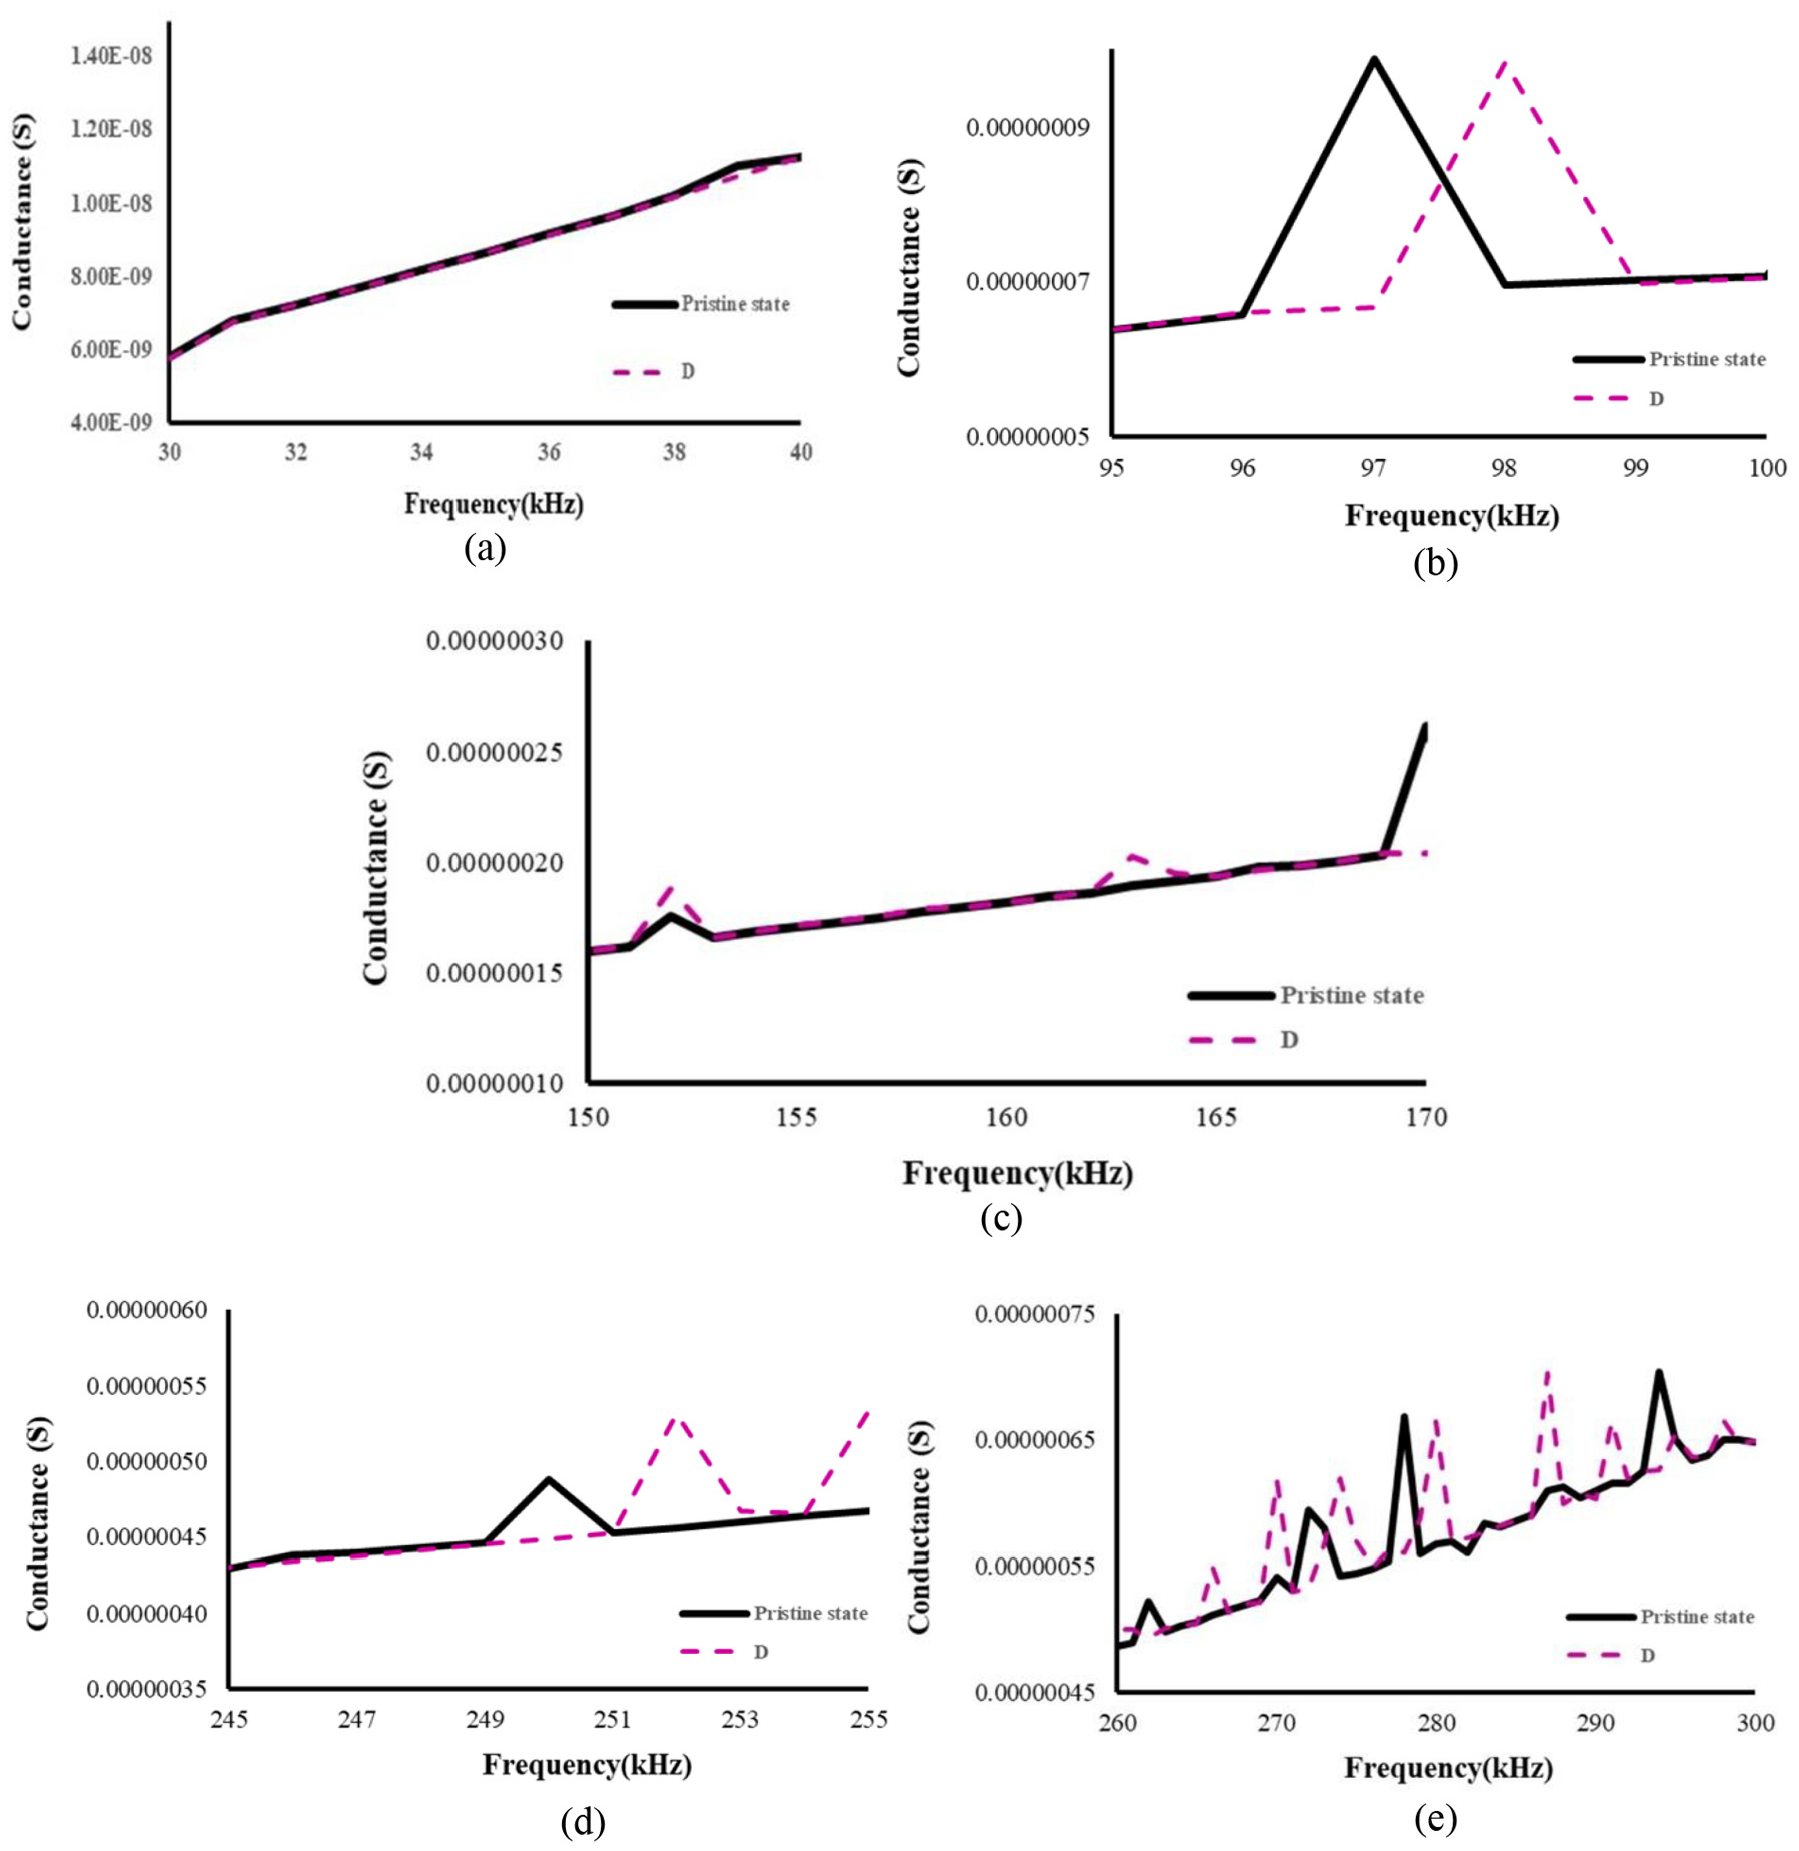
Numerical conductance signature for D. (a) for frequency range 30-50kHz; (b) for frequency range 95-100kHz; (c) for frequency range 150-170kHz; (d) for frequency range 245-255kHz; (e) for frequency range 260-300kHz.
It is observed that the conductance peaks tend to shift to upwards to the left when the bolts are loosened progressively. A similar trend is observed for experimental results as well. From the numerical results, from close observation, it is seen that for resonance frequency range and structural range (i.e. 30–50 kHz), the trend of conductance peak and frequency shift is quite similar to experimental signatures. Though ANSYS results are not in the same order as of experimental, but they did follow a similar trend as experimental signatures do, which can utilize for pre-emptive study.
The damage metrics for each of the damage case scenarios in the frequency range of 30–300 kHz are obtained numerical conductance signature is shown in Figure 11. The Normalized values of RMSD, MAPD, and CCD are in increasing as the damage severity Progress (i.e. loosening of bolts in the upper strut mount). From the study, it is found that, the RMSD and MAPD are very sensitive toward the damage (hence self-loosening) of bolt and nut arrangement.
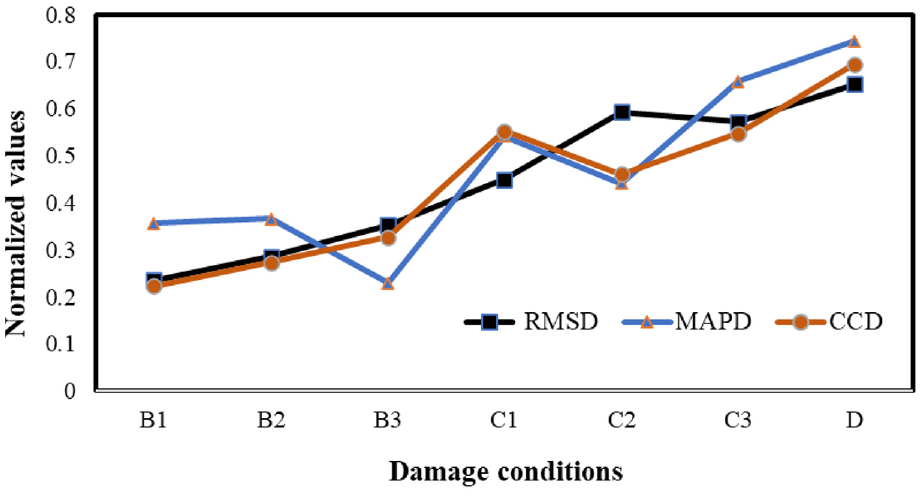
Numerical damage metrics for different scenarios.
Through insightful discretion of EMI signature plot, obtained from both ANSYS simulation and experimental method has very sound and satisfactory toward the detection of damage scenario caused by self-loosening of bolts through applied torque. From Figure 3, it is observed that the piezo conductance peaks are lowered with increasing torque moment (loosening mode, anti-clockwise). Also, from EMI plots, it is proved that signatures were very sensitive toward initial preload loss on bolt bearing area, caused due to self-loosening (see Figure 3(a), (c), and (d)). Similarly, for moderate and severe damage conditions, where all bolts were loosened to higher torque loss for simulation of complete loss of preload in the bolt. The piezo conductance spectra have successfully detected the damage scenarios (i.e. C1, C2 …etc.) by lowering conductance peak and shifting peak frequency toward left (see Figures 4(a) and 5(a)). In a similar line, for Piezo, impedance analysis through ANSYS has very commendable and complements to experimental EM conductance plots. Though the order magnitude of the conductance peak is quite lower compared to experimental results, but the spectral trend is quite identical. This is clear from Figures 8(c), (e), and 9(e). For Sever damage condition (when all the bolts are loosened to 20 N m), the peak frequency shift to the right, indicating the complete loss of contact stiffness (see Figure 10(b) and (e)). A similar trend is also seen in experimental signatures for damage scenario D (see Figure 5(c) and (d)).
6. Conclusions
This paper discusses the experimental and numerical study of piezoelectric-based monitoring techniques for the detection of self-loosening bolts of the upper strut mount of the vehicular suspension system. The attempt was made to establish an experimental study to explore the potential of a single PZT patch for progressive loss of preload in bolts (i.e. incipient, moderate, and severe). Basically, this study focused on detecting the loss of contact stiffness through-bolt loosening, which very is crucial for vehicular health and passenger comfort and safety. The stages of preload loss have been quantified through the loosening of bolts for different torque levels. The obtained piezo coupled conductance signatures were detected the initial prestress loss (i.e. initial loosening of the bolt, incipient damage case) and loss of contact stiffness (i.e. all bolts are completely loosened, severe damage case). The statistical damage indices (RMSD, MAPD, and CCD) were plotted to quantify the damage severity for different stages of loss of preload in the upper mount strut. The proposed technique paved a pathway for vehicular health and usage monitoring system for the motoring industry. For further verification, this study has extended for FE simulation of upper mount strut and modeled in ANSYS workbench. The piezo impedance analysis has done for different damage scenario similar to experimental study. Though the conductance (real part of admittance) values are very low compared to experimental results, but the overall trend of conductance signature is similar to that experimental signature in terms of occurrence resonance peaks and frequency shift. Hence, one can refer to the numerical results for preliminary investigations.
Further, the proposed technique can be further utilized for detection of failure of the suspension mount of vehicular system, caused due to losing contact stiffness of strut mount. The contact stiffness can be measured through extracted piezo identified stiffness using impedance-based structural identification. Also, the measured signals can be further processed to create a classifier system for the machine learning model to categorize the severity of damage with the conjunction of vehicular engine health and road roughness.
Footnotes
Declaration of conflicting interests
The author(s) declared no potential conflicts of interest with respect to the research, authorship, and/or publication of this article.
Funding
The author(s) received no financial support for the research, authorship, and/or publication of this article.
