
Abstract
Structural health monitoring of structures in general usually require an expert to permanently attach a sensor onto a specific area. This would be important for mechanical structures with bolted joints, such as in aircrafts or even machines as human lives depend on its structural integrity. However, for large civil infrastructures with bolted joints, such as in cable stayed bridges, installing a monitoring system with a large number of sensors would be unrealistic as the cost of the system would be significantly high. In addition, the time frame for certain bolts to loosen for civil structures can be quite long and one could say that a real time monitoring system is unnecessary as a routine maintenance is conducted for civil structures. An effective way of identifying bolt loosening would be vital for safety inspectors to inspect the target structure with minimized time. Thus, in this study, a piezoelectric transducer based non-destructive testing method is introduced to identify bolt loosening. The concept of real time online monitoring could be replaced with the portable damage detection concept shown in this study as the proposed idea could minimize the overall cost of the maintenance process.
Keywords
1. Introduction
One of the most common joint methods in aerospace, civil, and mechanical engineering area is achieved by using bolts. These bolted joints have advantages such as simplicity, use of simple tools, fast progress, noiseless installing, and more. Although tightening the bolt with adequate torque guarantees safety and stability of the structure, vibration occurs in almost all dynamic systems that may cause the bolts to loosen. Thus, to ensure safety, it is absolutely vital to inspect or monitor the bolt joints to avoid unwanted events such as structure failure that can be critical for civil infrastructures. The importance of bolt loosening detection can be realized by the vast number of researches performed by various authors up to date where thorough review work can be found (Miao et al., 2020; Nikravesh and Goudarzi, 2017; Wang et al., 2013). There are more than 15 methods for evaluating the condition of the bolts which can be generally divided into two categories, direct and indirect measurement methods which can be briefly summarized by Table 1 (Nikravesh and Goudarzi, 2017).
Direct and indirect methods for bolt loosening detection of structures.
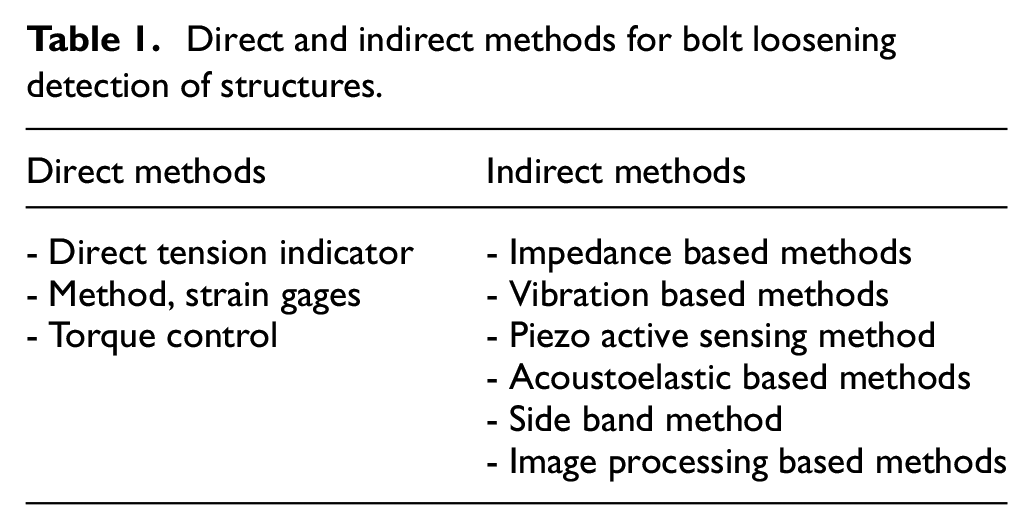
Direct measurement methods include using a washer installed below the bolt (Huo et al., 2017), strain gages embedded onto the bolt (Wang et al., 2020), or using the commonly known torque wrench technique where an inspector examines the torque of a bolt at determined time intervals using torque-meters (Miao et al., 2020). On the other hand, indirect measurement methods include measuring impedance using a piezoelectric (PZT) transducer (Wang et al., 2018) vibration based method which analyzes vibration signals from the structure (Nguyen et al., 2017), ultrasonic based method that examines the changes in the ultrasonic wave sent to a structure for detecting existence of flaws (Marshall et al., 2012) and image processing based methods using a computer to digitalize various images for detecting changes by comparing one another (Huynh et al., 2019).
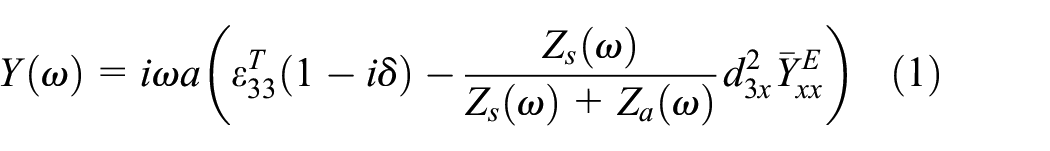
In this study, an indirect measurement method of using a PZT transducer to detect bolt loosening is investigated where various authors have researched related to this area. Shao et al. (2016) used PZT transducers to develop a relationship between the specified frequency shift and bolt loosening, Li et al. (2020) developed numerical modeling to simulate the piezoelectrically enabled active sensing method which was verified with experiments, Zhang et al. (2017) proposed a two-step health monitoring strategy using PZT transducers for detecting bolt loosening of a thermal protection system, Chen and Xu (2012) designed a steel and aluminum specimens and used PZT transducers to identify bolt loosening, and more research related to this area can be found by various authors (Mascarenas et al., 2005; Na, 2021; Park et al., 2003; Rhee et al., 2012; Samantaray et al., 2018; Ye et al., 2013). Most of these researches show promising outcome of using PZT transducers for bolt loosening detection where one needs to permanently attach the PZT transducer onto the target. Although these approaches are suitable when creating an online monitoring system, large size of structures such as cable-stayed bridges would dramatically increase the cost of the sensors to be installed. As routine maintenance is carried out for structure such as cable-stayed bridges, a wise choice would be to create a portable system to aid the inspection process when the inspector is out for a routine inspection (e.g. bolt inspection). Thus in this study, electromechanical impedance (EMI) technique is used to detect bolt loosening while transforming the technique into a portable system with ideas to successfully identify damage. The principle behind the EMI technique is that the attached PZT transducer acts as both actuator and sensor. Measuring the electrical impedance of the PZT transducer allows one to detect any changes in structure. The 1-D equation proposed by Liang et al. (1997) in equation (1) proves that electrical admittance (the inverse of impedance),
In this work, a different approach to the conventional way of attaching the PZT transducer onto a target structure is applied and a new concept of locating loosened bolt(s) of the test specimen will be introduced and evaluated. The work presented in this study only considers bolt loosening of the structure to investigate how the impedance signatures change and factors such as aging of metal plates (such as corrosion) will not be considered.
2. Experimental setup and data processing
2.1. General setup for the EMI technique
In general, three types of devices can be used to measure impedance. The first one is to use an impedance analyzer (e.g. Agilent 4294a). This is the most commonly used, but the most expensive among the ones to be introduced. A lower cost version was proposed by Peairs et al. (2004). It is a form of connecting a function generator with an oscilloscope and applying a simple circuit, which can approximate the electrical impedance of the PZT patch attached to the structure. The third and last method of measuring the electrical impedance can be achieved by using the AD5933 evaluation board manufactured by Analog Devices. Co. This device is much cheaper compared to the previous aforementioned devices. For this research, AD5933 evaluation board was used as it can measure up to 100 kHz with more than 500 data points. The general setup for performing the EMI technique using the AD5933 evaluation board can be seen in Figure 1 where the board is connected to a computer and the bolted structured. The PZT transducer model PSI-5A4E used for this study was purchased from Piezo Systems (where all the properties of this model can be found in http://piezo.com) where all the tests were conducted at 24°C (±0.1°C) to minimize the change in measured impedance signature subjected to temperature fluctuation.
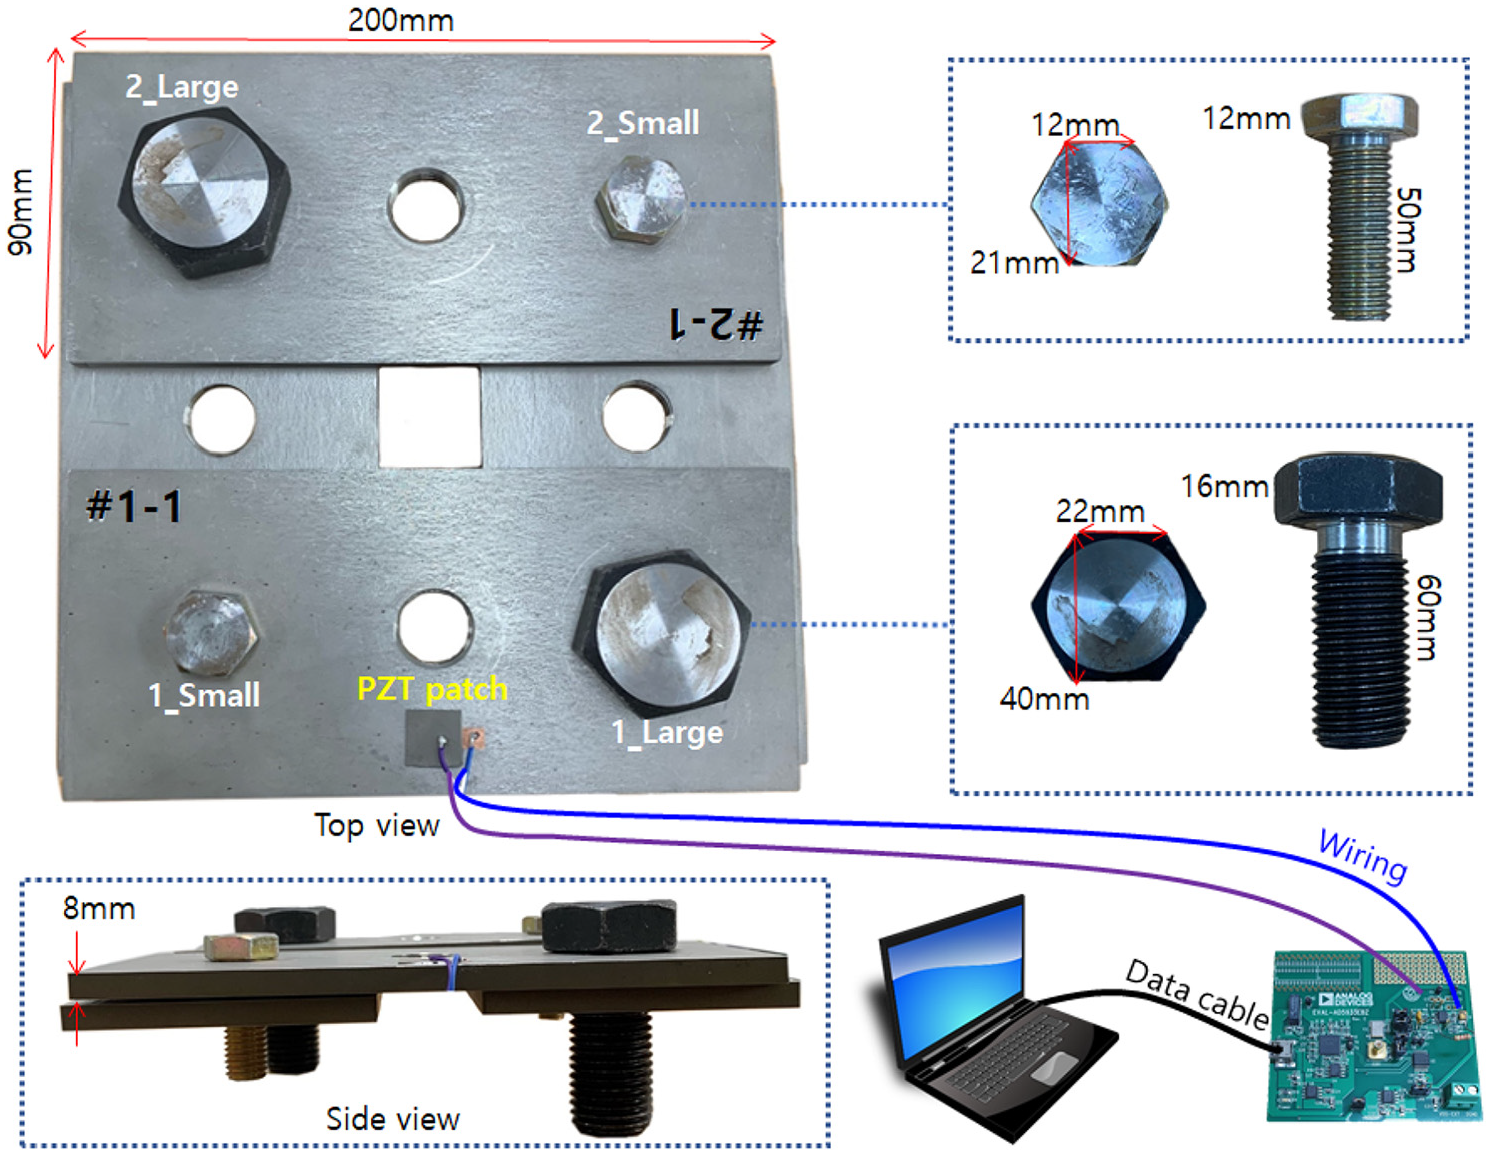
Experimental setup of the bolted structure subjected to loosening.
The bolted structure (made of steel) used for this study in which two layers of plates (200 mm × 90 mm × 8 mm) are connected with two different sized bolts. Each layer is a structure in which two plates are laid horizontally and the two layers are perpendicular to each other. The bolted structure was manufactured from a domestic company Partners Lab (http://www.partners-lab.com). For the two metal plates at the top layer, the small and large bolts of #1-1 plate will be referred to as “1_Small” and “1_Large,” and the bolts of #2-1 plate will be referred to as “2_Small” and “2_Large” for the remainder of this study. On #1-1 plate, a square 15 mm sized PZT transducer is attached to be tested subjected to bolt loosening for Section 2.3.
2.2. Statistical metrics for data processing
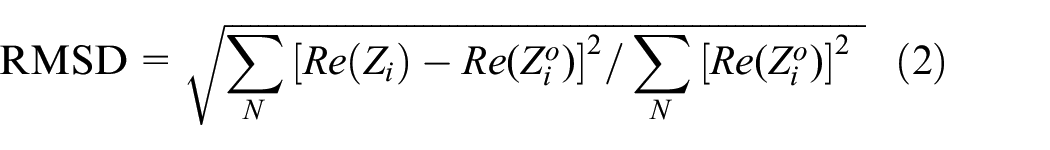
After measuring the impedance signatures from the experiment, the next step is to quantify the severity of the signature variations subjected to bolt loosening. Thus, a reference impedance signature at intact state is measured and another impedance signature is measured after damage (bolt loosening for this study) to be compared for analysis. Here, a statistical method known as RMSD (root mean square deviation) is used for this study where the equation is shown in equation (2). The variables
2.3. Impedance signature changes subjected to bolt loosening
Before introducing the concept of portable EMI technique for detecting bolt loosening, the authors first tested the EMI technique using the conventional approach of attaching the PZT transducer onto the bolted structure as shown in Figure 1 in the previous section. The test involved completely loosening of all the bolts on #1-1 and #2-1 plates where the measured impedance signatures are shown in Figure 2. For Figure 2(a), four impedance signatures were measured where the black dotted line represents the signature at intact (no bolts loosened) state. The label “1_Small” represents the acquired impedance signature when only 1_Small bolt was loosened, where “1_Large” is the impedance signature with only the 1_Large bolt loosened. “1_Both” in the figure represents both bolts loosened on #1-1 plate. By observation, there are multiple number of large peaks (resonance) in the signature where some of the peaks overlap one another. One could say that by visual, no dramatic variations are observed between the signatures. When the RMSD values are calculated using the intact case as the reference signature, the values of 9.86%, 13.43%, and 13.93% were acquired for 1_Small, 1_Large, and 1_Both, respectively. Since 1_Large bolt is larger in size compared to 1_Small, it is not surprising to see a higher RMSD value for the larger bolt. However, loosening both bolts resulted in a RMSD value very close to the case with loosening 1_Large only. For Figure 2(b), the RMSD values were 8.05%, 8.30%, and 9.67% for 2_Small, 2_Large, and 2_Both, respectively. Again, loosening the large bolt resulted in a higher RMSD value (8.30%) compared to loosening the small bolt (8.05%). In addition, since the bolts are located further away from the PZT transducer compared to the bolts on #1-1, all the calculated RMSD values show smaller values compared to Figure 2(a).
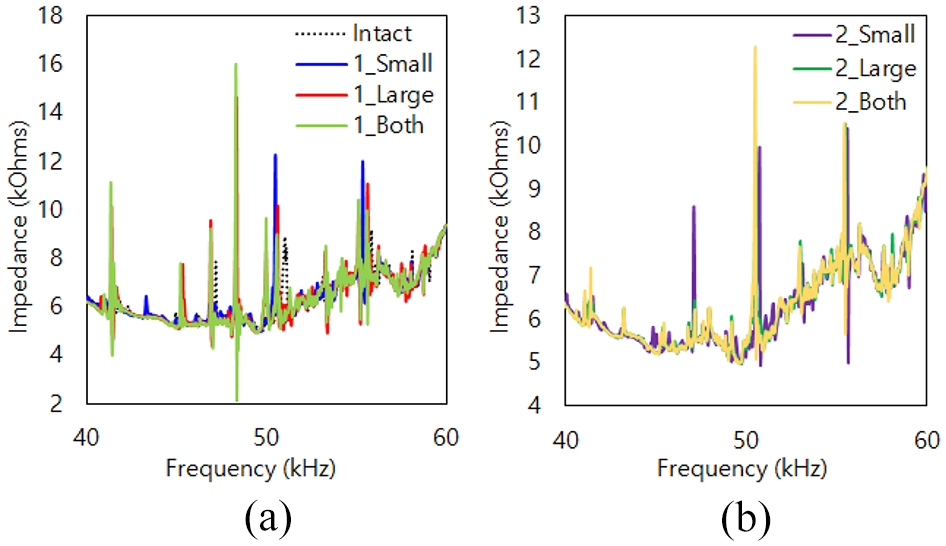
Impedance signatures for bolt loosening on: (a) #1-1 Plate and (b) #2-1 Plate.
2.4. Application of 3 and 5 mm Metal-PZT device for temporarily attachment
The concept of using a metal object sandwiched between the PZT transducer and the surface of the host structure was first introduced in Na and Lee (2012). This concept can be used to create a PZT device that can be temporarily attached to a host structure. An online monitoring system can be expensive and depending on the size of the structure, the cost can significantly increase. Thus, a device that can be temporarily attached to a surface to quickly and accurately evaluate the state of the structure could be very useful. Shown in Figure 3, two impedance signatures using different metal disk (made of steel) can be seen where the blue line is measured from a 15 mm square PZT transducer permanently attached to a 25 mm diameter circular metal disk with 3 mm thickness. The red line on the right side of the graph was obtained by measuring the impedance signature of a PZT transducer attached to a metal disk with 5 mm thickness. Comparing these two Metal-PZT devices, the amplitude for both of the impedance signatures are virtually the same at around 37 kΩ located near 38 kHz and 52 kHz for 3 mm thick Metal-PZT and 5 mm thick Metal-PZT, respectively. Using these devices, a temporarily attachment can be made using a double-sided tape for securing it onto the surface of the target structure. Thus, from the next section, the two Metal-PZT devices are used to evaluate the performance of the device by completely removing the PZT patch shown in Figure 1 and attaching the Metal-PZT devices with a double-sided tape. Using the device with the AD5933 evaluation board and a laptop makes this system portable. Now the next step would be to come up with a concept for analyzing the data for bolt loosening detection.
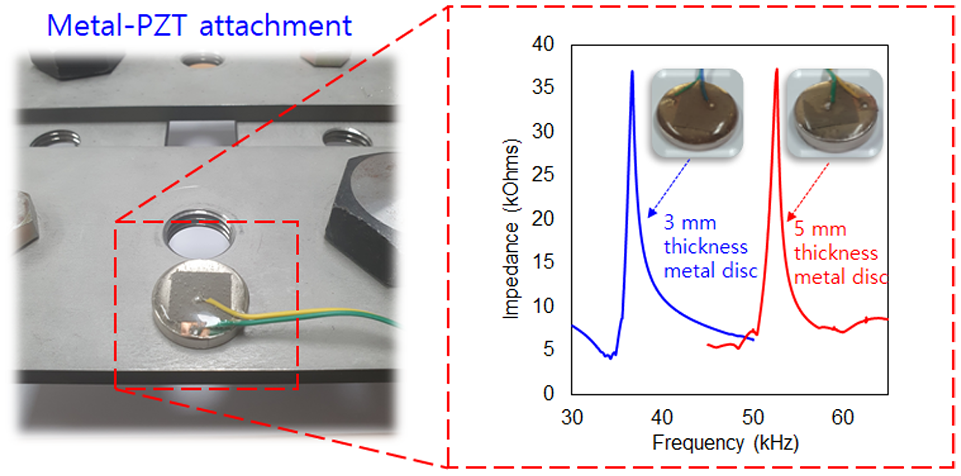
Impedance signatures for 3 and 5 mm thick Metal-PZT device.
3. Bolt loosening detection withMetal-PZT devices
3.1. Repeatability performance of the Metal-PZT devices
For the proposed portable system to be reliable for real field application, the repeatability performance of the re-usable PZT device must also be reliable. One of the main parts for the study includes attaching the Metal-PZT device onto the host structure for an impedance signature measurement and then completely detaching it for another new measurement. Since the EMI technique uses high frequency range usually over 20 kHz, even a slight displacement of the Metal-PZT device when re-attaching it may cause the impedance signature to change. Thus, to check how severe the impedance signature changes subjected to re-attachments, five impedance signatures were measured for both of the Metal-PZT devices created using the 3 and 5 mm thick metal bases. Figure 4(a) shows the 3 mm thick Metal-PZT device measured for five times by attaching and re-attaching it onto the same spot. Comparing back to Figure 3, the one large peak that existed at around 36 kHz has significantly decreased with the attachment to the structure. The peak amplitude of around 37 kΩ has been reduce to 13 Ω with multiple resonance peaks. In addition, the changes between the five impedance signatures are not significant as the general shape of the impedance signatures are kept regardless of reattachment of the Metal-PZT device. This is a positive outcome as reattachment of the Metal-PZT device onto the exact same spot every time for inspection would be extremely difficult for real situations. Furthermore, virtually no shift movements or large changes in amplitude of impedance signatures exist subjected to re-attachments where the largest difference of the RMSD value was calculated to be 3.20% between two impedance signatures.
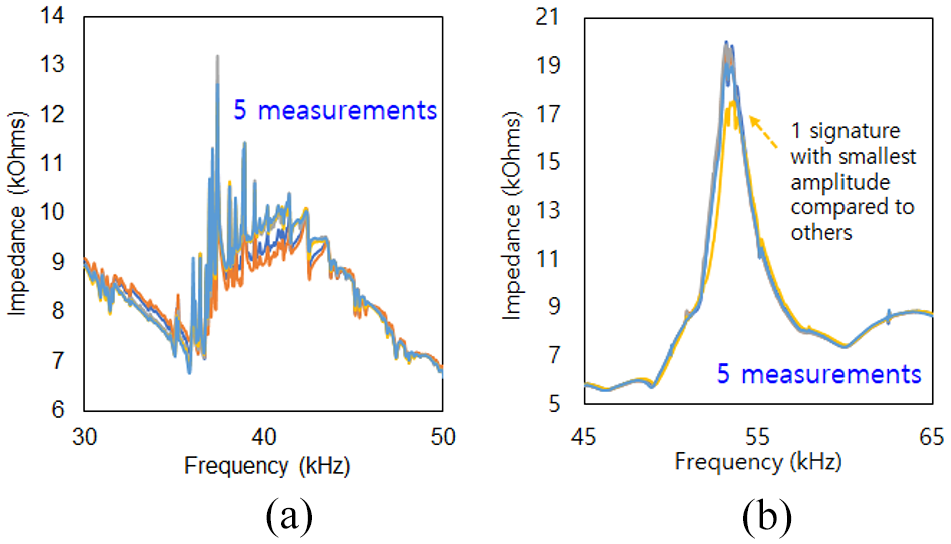
Five consecutive impedance signature measurements on the bolted structure using Metal-PZT device with thickness of: (a) 3 mm and (b) 5 mm.
Next, Figure 4(b) shows the 5 mm thick Metal-PZT device measured for five times where the experiment was identical to the previous test. Here, the shape of the impedance signatures is quite similar to the impedance signature shown in Figure 3 with one large impedance peak located at around 53 kHz. However, the amplitude has reduced down from 37 to 20 kHz with the attachment onto the structure. Again, no significant change in the impedance signatures can be witnessed except for the one signature labeled in the figure where the impedance signature peak seems to have shifted in the right direction with reduced amplitude. This is no surprise as reattachment of the Metal-PZT device could be misplaced by a very small distance. Nevertheless, such difference in the signature is an important data which needs to be taken into consideration for this study. Here, the largest difference between two impedance signatures is 6.90% between two impedance signatures.
3.2. Impedance signature variations with 3 mm Metal-PZT device attached to bolted structure
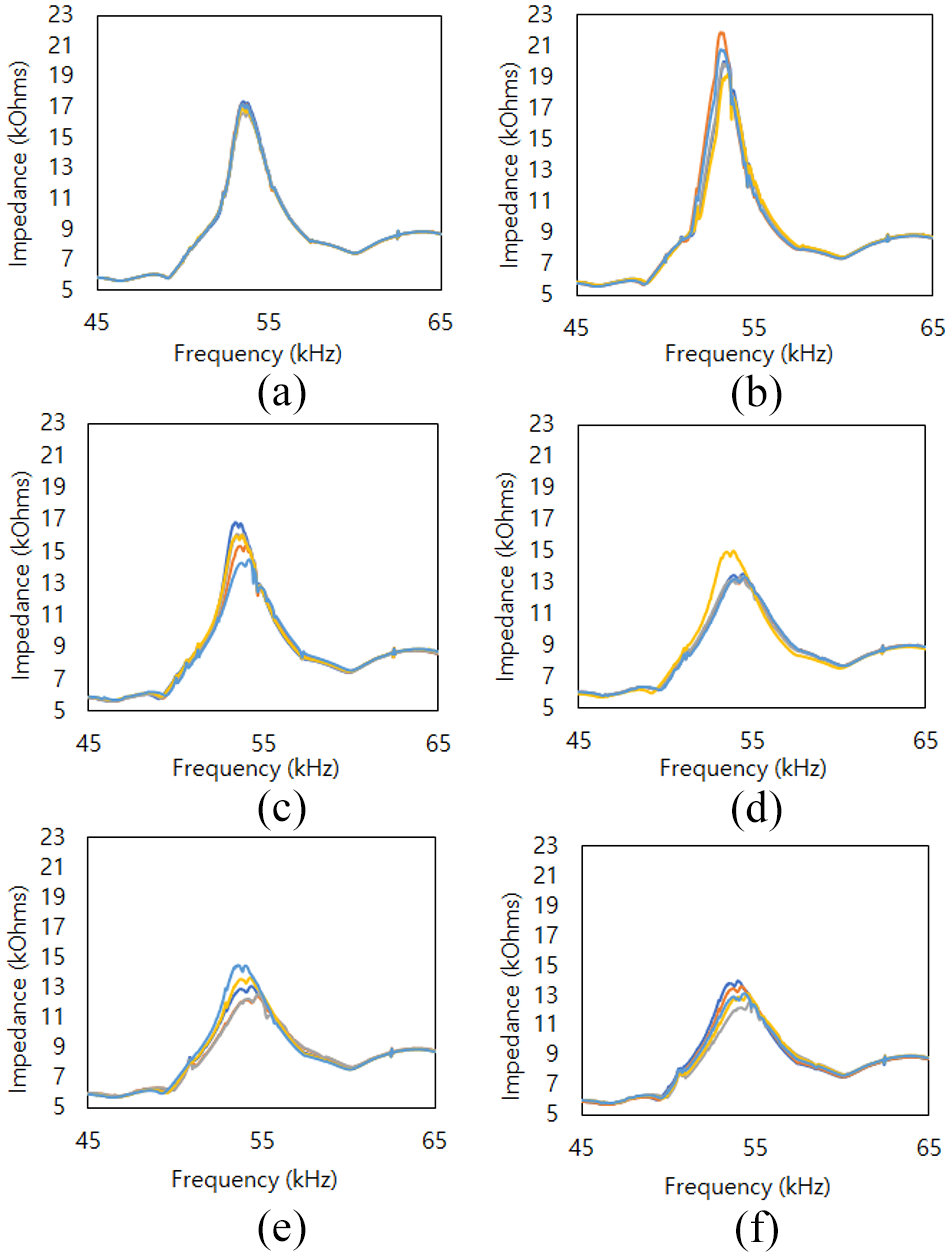
In the previous section, we have seen that reattaching the Metal-PZT device regardless of the metal thickness resulted in changes in impedance signatures. Thus in this section, the investigation on how the impedance signatures change subjected to bolt loosening is observed. Figure 5(a) to (f) shows five impedance signatures measured by attaching the 3 mm Metal-PZT device and reattaching onto the same spot after complete detachment. First examining the bolt loosening damage on plate #1-1, the general shape of Figure 5(a) looks quite similar to undamaged case shown in Figure 4(a) with the largest impedance of around 12 kΩ observed in between 35 and 40 kHz range. Here the largest RMSD value observed between two impedance signatures were 3.92%. In section 4, the authors will average all the impedance signatures shown in this section and overlap one another to see the difference in signatures subjected to change. Thus for now, the general shape of the impedance signatures are described in this section to see how the impedance signatures change in general. For Figure 5(b), the number of small peaks which existed in between 35 and 40 kHz seemed to be reduced but the peak amplitude of 16 kΩ can be observed at around 37 kHz. The largest RMSD value of 4.30% was calculated between two impedance signatures for this data. When both bolts were loosened for impedance signature measurements which are shown in Figure 5(c), one could argue that there is more number of peaks compared to Figure 5(b) with smaller amplitude of less than 16 kΩ at just over 37 kHz. The signatures shifts in the up or down direction in the range of 38–44 kHz which could give out a false alarm when identifying a structure for bolt loosening as large change in signature may result in a high RMSD value. The largest difference between two impedance signatures here was 5.85%.
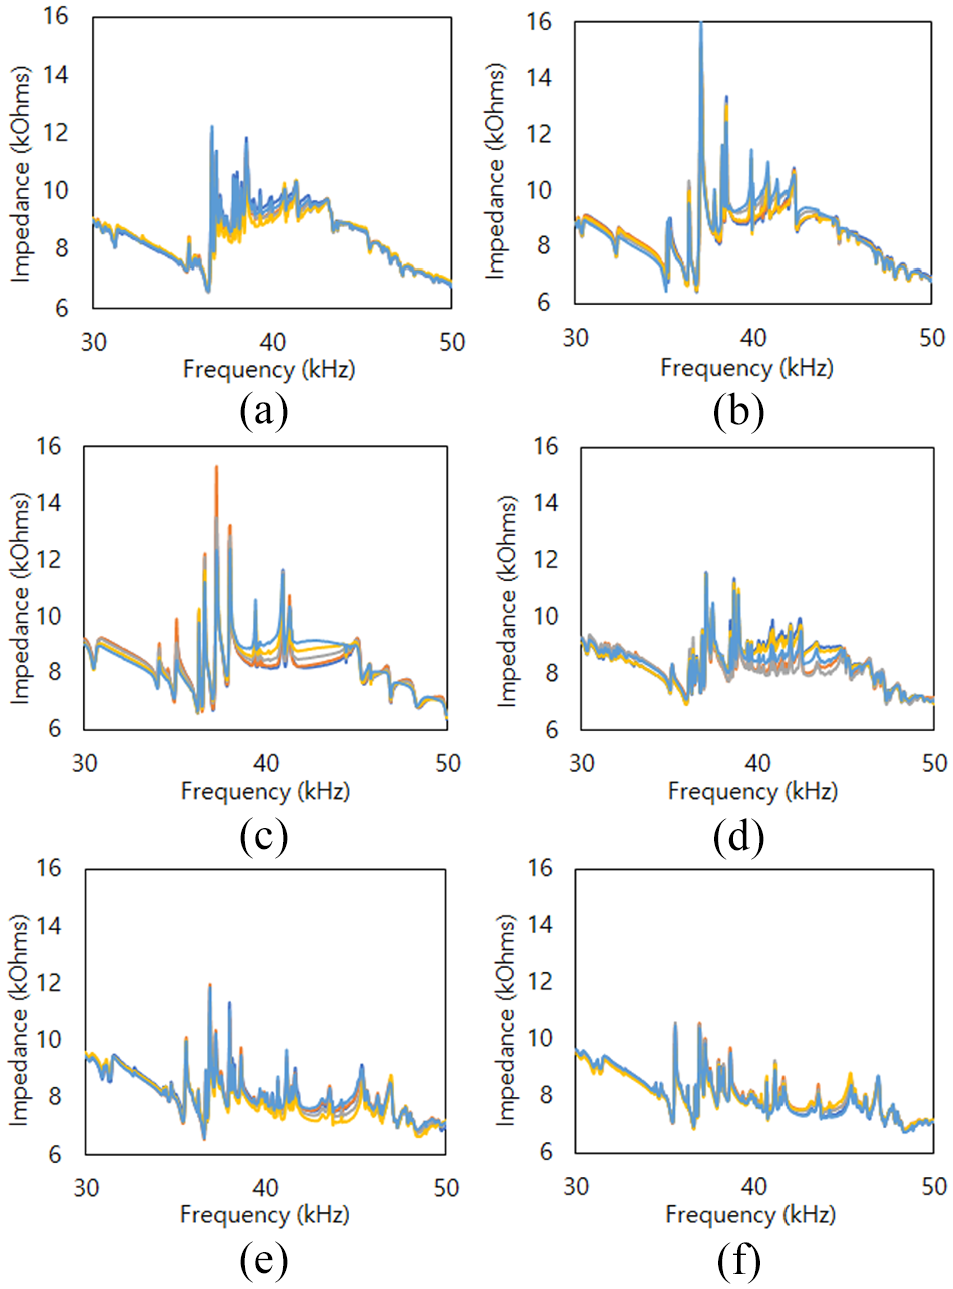
Impedance measurements using the 3 mm Metal-PZT device for bolt(s) loosened at: (a) 1_Small, (b) 1_Large, (c) 1_Both, (d) 2_Small, (e) 2_Large, and (f) 2_Both.
Impedance signatures acquired subjected to bolt loosening damage on #2-1 plate is shown in Figure 5(d) to (f). At first glance, it is easy to notice that highest amplitude of all signatures are below 12 kΩ for all figures. The changes in impedance signatures are quite noticeable for Figure 5(d) with the small bolt loosening in the frequency range between 39 and 45 kHz where the signatures shift in the Y-axis direction. The largest difference between two impedance signatures for this data was 6.53%. For Figure 5(e) with the large bolt loosening, not too much change in impedance signatures are observed up to 40 kHz where shift movements in Y-axis direction is observed after this range. Thus, one could disregard signatures acquired after 40 kHz and only use the data below 40 kHz to minimize error when identifying damage as we required minimal signature change subjected to re-attachment of Metal-PZT device. For this figure, the highest RMSD difference was 4.40% between two signatures. The last Figure 5(f) shows the smallest variations in impedance signatures by visual when compared to the rest of the figures. Here, the largest RMSD difference between two signatures was 1.91%.
Overall, the impedance signatures for all figures change with shift movements in the Y-axis direction for certain frequency ranges. The general shape of the impedance signature is maintained without complete change of the signature such as existence of new peaks. This is a positive outcome for the analysis conducted for the later part of the study.
3.3. Impedance signature variations with 5 mm Metal-PZT device attached to bolted structure
In this section, impedance signatures where measured using the 5 mm thick Metal-PZT device subjected to bolt loosening of the structure. At first glance, all the figures have a shape in a form of a “bell curve.” Thus it would be visually easy to identify how the signature change subjected to re-attachment of the structure. Also, since there are a smaller number of impedance peaks compared to the previous sub-section 3.2, one could guess that the calculated RMSD values would be smaller. One possible explanation of less peaks is due to the thickness of the metal as 5 mm thickness places the PZT transducer 2 mm further away from the test structure compared to the 3 mm thick Metal-PZT. Thus the vibration received from the structure to PZT is less sensitive, causing the impedance signature to change less.
For bolt loosening damage on #1-1 plate, Figure 6(a) shows virtually no change in impedance signature with the loosening of 1_Small bolt. The amplitude height is at around 17 kΩ near 54 kHz. Only a very small shift movement at the peak of the impedance signature can be seen. The highest RMSD value calculated for two impedance signatures between two signatures was 1.70%. For the large bolt in Figure 6(b), the highest amplitude is around 22 kΩ near 53 kHz where variations in the impedance signatures can be seen. Here, the largest difference between two impedance signatures was 11.8%. Regarding Figure 6(c) with both of the bolts loosened, the highest amplitude observed is at around 17 kΩ near 54 kHz, which has quite the similar shape compared to Figure 6(a). However, most of the signatures has an amplitude height below 17 kΩ thus it would be interesting to evaluate the performance of the proposed system shown later in the study. Here, the largest difference in the RMSD value was 8.12% between two impedance signatures.
Impedance measurements using the 5 mm Metal-PZT device for bolt(s) loosened at: (a) 1_Small, (b) 1_Large, (c) 1_Both, (d) 2_Small, (e) 2_Large, and (f) 2_Both.
For the impedance signatures of bolt loosening damage on #2-1, Figure 6(d) shows that loosening the small bolt results in virtually no change in the signature except for one signature which has the amplitude height of 15 kΩ near 54 kHz. For Figure 6(e), the amplitude of the signatures range in between 14.5 and 12 kΩ where similar trend is observed for Figure 6(f) as well with both bolts loosened. Thus one could assume that differentiating between a case with just the large bolt loosened and both bolts loosened for #2-1 plate could be difficult as the signatures show high similarity. One solution to overcome this problem would to acquire more signatures for each case and search for a feature to distinguish between the two. However, such task would be time consuming in real field thus this study will investigate the possibility of using just five acquired signatures as reference signatures to create a reliable damage detection system. For the three figures, the largest RMSD values between two signatures were 7.83%, 9.42%, and 8.33% for Figure 6(d) to (f), respectively.
4. Creating reference signatures for predicting bolt loosening
In the previous section, the authors measured the impedance signatures five times for each damage cases by attaching and re-attaching the Metal-PZT device. This caused the impedance signatures to change for every re-attachment. However, if one were to average the five impedance signatures into one signature, it would be possible for the averaged signature to be used as a reference signature. In other words, any new impedance signatures subjected to bolt loosening can be compared with this reference signature to identify bolt loosening. Figure 7(a) shows the averaged signatures from the data acquired using the 3 mm Metal-PZT device. Thus each impedance signature is averaged from Figure 5(a) to (f). Although it is quite difficult to distinguish between signatures, the important fact is that most of the signatures are different. This is important because if the signatures were to be same, it would fail to identify the location of the loosened bolt. For an example, “2_Both” and “2_Large” signatures seemed to virtually overlap each other, which is not a positive outcome. However, a small variation in the signature is seen around 45 kHz where the amplitude of “2_Large” is higher than “2_Both” by a small amount. Such small difference would be the key for identifying the location of loosened bolt and this will be tested in the next section. Observing at other impedance signatures, “1_Large” has the peak with the highest amplitude of 15 kΩ at around 37 kHz. With the other three impedance signatures of “1_Small,”“1_Both,” and “2_Small,” the difference between the signatures are clearly seen. Overall, except for the impedance signatures that is to be used as a reference signature for “2_Both” and “2_Large,” one can assume that other four signatures should be able to locate the position of loosened bolt with high accuracy.
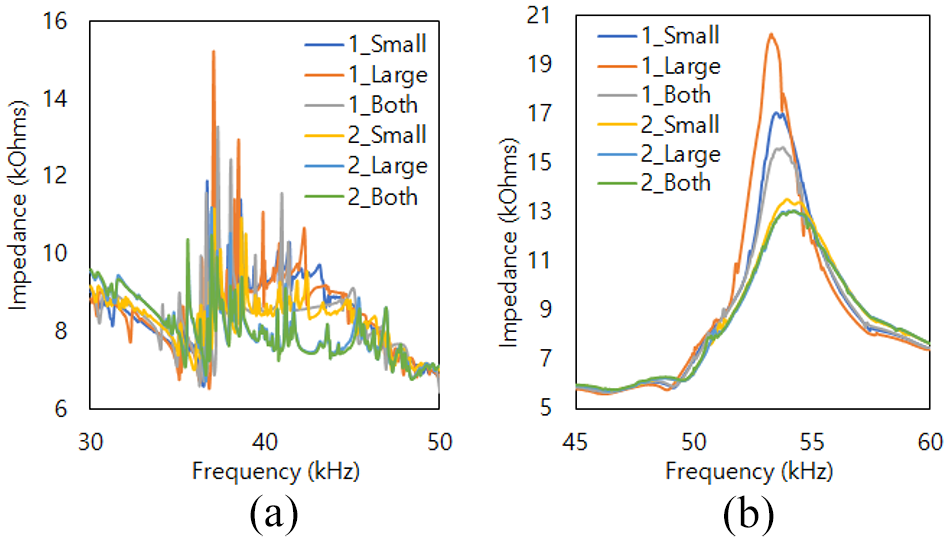
Next observing Figure 7(b) with the use of the 5 mm Metal-PZT device, the difference between the averaged impedance signatures calculated from Figure 6 is quite clear and easy to identify the difference between one another. The signature with the highest amplitude is observed for “1_Large” with the amplitude of around 20 kΩ at around 53 kHz. The second highest amplitude of around 17 kΩ is seen for “1_Small” and the third highest amplitude of around 15 kΩ is observed for “1_Both.” This observation is interesting as one can assume that loosening both bolts would allow the #1-1 plate to vibrate more freely which can result in a resonance with higher amplitude. A possible explanation is that loosening both bolts changes the mode shape of the structure in a way that the location of the Metal-PZT device becomes closer to a node (a point along a standing wave where thee wave has minimum amplitude) in general throughout the frequency range. Observing at the impedance signatures for the other three impedance signatures (“2_Small,”“2_Large,” and “2_Both”), it is difficult to identify the difference in signatures. With a closer observation at around 54 kHz, “2_small” has higher amplitude compared to the rest of the two signatures by a very small amount. Thus is would be interesting to find out how these reference signatures will perform when identifying the location of the loosened bolt in the later section.
5. Experimental validation of the proposed concept for bolt loosening detection
5.1. Concept of portable bolt loosening detection system
The key concept of the proposed system is to use the five impedance signatures acquired for each bolt loosened case by re-attaching a Metal-PZT device for measurements after complete detachment. With the averaged signatures shown in the previous section, this is used as reference signatures and new signatures (new experiments) will be used to calculate the RMSD values where the lowest values will indicate the position of loosened bolt(s). In other words, lowest RMSD value means that the newly acquired impedance signature matches with the reference signature. Thus seven reference signatures are acquired from 3 and 5 mm metal PZT devices and new tests will be conducted to evaluate if the reference signatures can locate loosened bolts with high accuracy. Since the AD5933 evaluation board is fully powered by a USB cable, one could use a laptop and connect the evaluation board with the Metal-PZT device for an onsite inspection assuming that the reference signatures can be acquired. With this concept, the need for installing an online monitoring system can be avoided which can be costly when we consider structures such as cable-stayed bridges that would required a vast number of sensors for installation.
5.2. Performance of bolt loosening detection with 3 mm PZT-Metal device
To test the proposed concept using the reference signatures, five more impedance signatures were measured by attaching and reattaching the 3 mm Metal-PZT device subjected to bolt loosening of all four bolts. Thus from non-damaged state to loosening both of the bolts up to #2-1 plate, 35 impedance signatures were measured in total (seven cases with five impedance signatures measured each time). In section 3, the five impedance signatures were displayed separately using line graphs with frequency on X-axis and impedance on Y-axis to investigate how the impedance signatures change subjected to re-attachment.
In this section, all 35 measured impedance signatures were displayed into a single 3-D graph to take a look at how the impedance signatures change subjected to different bolts and locations. This is shown in Figure 8 where frequency, impedance and bolt loosened cases is labeled onto X-axis, Y-axis, and Z-axis, respectively. At first glance, we can easily identify that amplitudes are at its highest for “1_Large” and “1_Both” in the frequency range of around 35–40 kHz. We can also identify that intact case has larger amplitudes compared to “1_Small.” These experiments experimentally prove that bolt loosening can either increase (e.g. “1_Large”) or decrease (e.g. “1_Small”) the amplitudes in general which shows that bolt loosening does not always increase the amplitudes where one could assume that it can depend on dimensions and properties of the structure. With the bolts loosened for the #2-1 plate (“2_Small,”“2_Large,” and “2_Both”), one can easily identify that amplitudes are relatively low compared to the rest of the bolt loosened cases. However, the variations in signatures clearly exist.
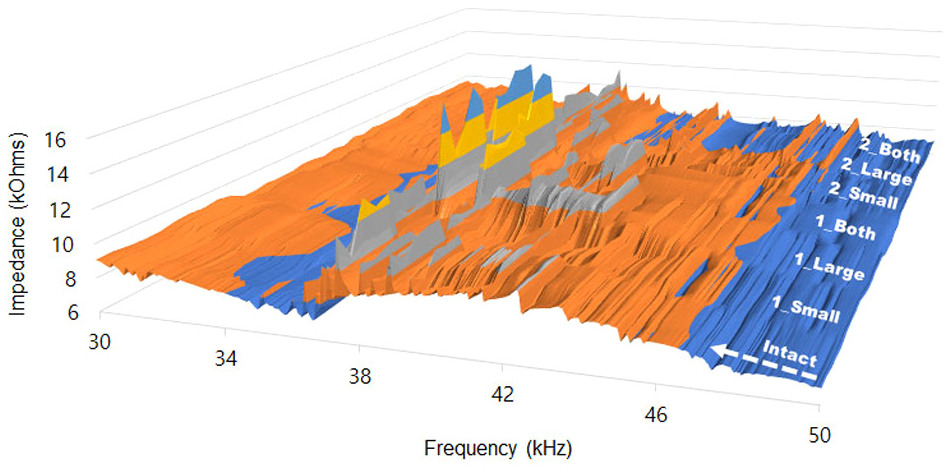
Thirty-five impedance signatures from all bolt loosening case with 3 mm Metal-PZT device.
Now to evaluate the performance of the proposed concept, RMSD values were calculated using all 35 impedance signatures and the results are shown in Table 1 where the lowest values at each row has been colored in bold(red) to indicate the prediction of the loosened bolt. The left side of Table 2 shows the prediction results for the experiment conducted for the intact case and by loosening “1_Small,”“1_Large,” and “1_Both” bolts. The table is created by calculating the RMSD values using the averaged signatures from Section 4 as reference signatures and the five new impedance signatures measured for this section as the corresponding signatures.
RMSD results from using the 3 mm Metal-PZT device.
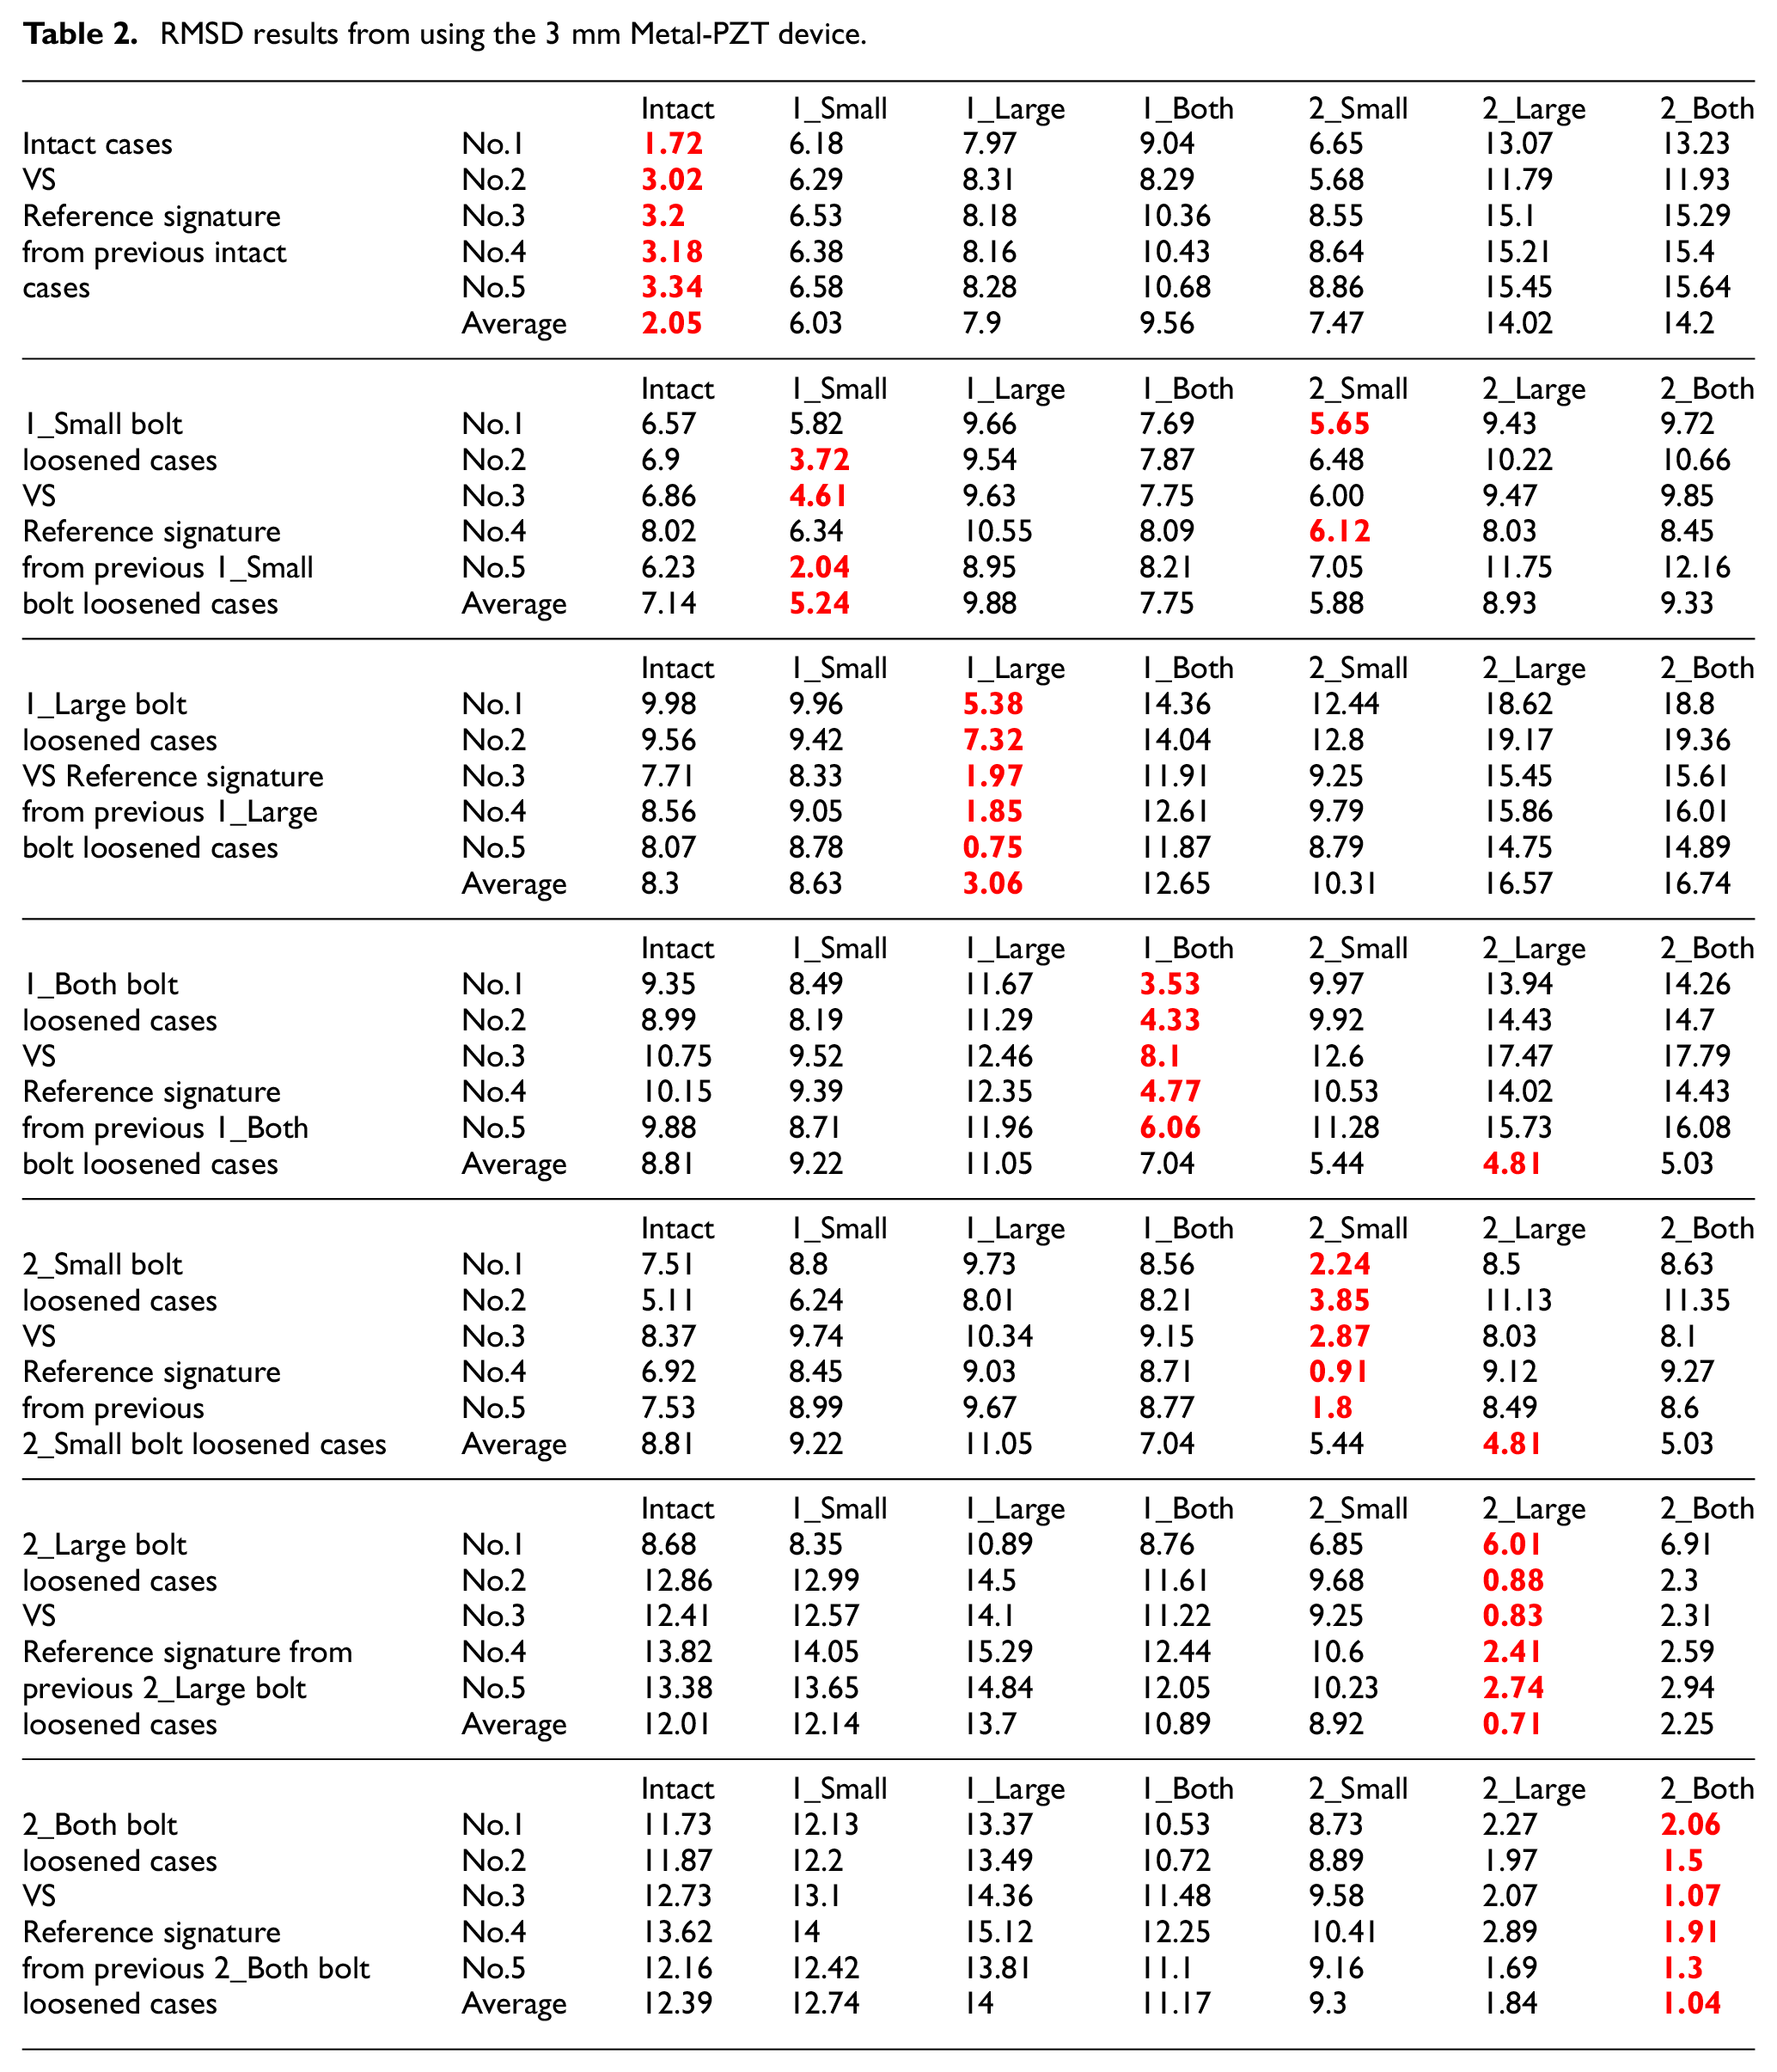
First, looking at the predictions for the intact case in the table (first column, “Intact case”), we can see that the RMSD values increase in the right direction. This is a positive outcome because the first set of test was to measure five impedance signatures at intact state and the first column of the table represents the RMSD values using the reference signatures acquired from the previous section. The RMSD values of the first column which are 1.72, 3.02, 3.20, 3.18, and 3.34 are the smallest values for each row and this means that all five impedance signatures indicate that the structure has no damage (intact case), resulting in 100% correct predictions. The averaged value of 2.05 in the first column was acquired by averaging the five impedance signatures and then calculating the RMSD value. Again, this value is the smallest from its row, once again indicating that the structure is at intact state. The reason for averaging the signatures is to find if averaging can improve the accuracy of the result. However, since all five signatures resulted in 100% correct prediction, the averaged value is not needed for this case. Next looking at the predictions for “1_Small” bolt loosening case, only three predictions are correct out of the five measurements where No.1 and No.4 has wrong prediction indicating that the small bolt on #2-1 is loosened. However, when the signatures are combined and averaged, the smallest RMSD value calculated is located in the second column with the value of 5.24 which correctly identified the location of the loosened bolt. Thus averaging the signatures can actually help correct identify damage location for this case. The third part of Table 2 with the “1_Large” bolt loosened shows 100% correct prediction with all the lowest RMSD values located in the “1_Large” column, including the averaged RMSD value of 3.06. The last part of the table by loosening both bolts on plate #1-1 shows interesting outcome where the five impedance signatures have correctly identified that both bolts have been loosened (with the values of 3.53, 4.33, 8.1, 4.77, and 6.06) but the averaged signature RMSD value gave wrong prediction that “2_Large” bolt has been loosened. This proves that simply averaging the signatures cannot always increase the accuracy of the result and perhaps selecting the column with the most frequent lowest RMSD value from individual results would lead to correct result (e.g. “1_Small” case where three lowest RMSD values were identified out of five cases).
The right side of Table 2 shows the remaining predictions for the tests conducted on loosening of bolts on #2-1 plate (“2_Small,”“2_Large,” and “2_Both”). Overall, the only wrong prediction made is for the “2_Small” case with the averaged signature RMSD value, predicting that “2_Large” bolt is loosened when actually it was the “2_Small” bolt that was loosened. This result once again shows that averaging the signatures then calculating the RMSD values can lead to a wrong prediction. In Section 4, the shape of the averaged impedance signatures (reference signatures) for “2_Large” and “2_Both” where virtually the same. Thus, the authors expected low accuracy when predicting the location of loosened bolt(s). Although that the results show 100% accuracy including the averaged signature RMSD values, the calculated RMSD values are very close to each other. For an example, the case for “2_Large” on No.4 and No.5 RMSD values for the two last columns are 2.41 versus 2.59 and 2.74 versus 2.94. With such small difference in the values, the accuracy of 100% would be difficult to achieve if we were to increase the number of measurements by a large number (e.g. additional 100 impedance measurements by attaching and re-attaching the Metal-PZT metal device). Nevertheless, selecting the column with the maximum number of lowest RMSD values could result in a prediction with 100% accuracy.
Overall with the prediction results from both Table 2, 33 correct prediction were made out of 35 measurements (excluding averaged signature RMSD values), showing a very high accuracy of 94.2%. The two wrong predictions came from “1_Small” bolt loosening case.
5.3. Performance of bolt loosening detection with 5 mm PZT-Metal device
Using the 5 mm Metal-PZT device, 35 impedance signatures were measured in total subjected to bolt loosening the four bolts (including the five measurements at intact case) and these is displayed in Figure 9. Due to the fact that most of the signatures are shaped like a “bell-curve” it is quite easy to see the difference between different bolts. In addition, there is virtually no difference between the signatures in the low and high frequency ranges for all signatures. Here, the highest amplitudes are generally observed for “1_Large” signatures where the second highest amplitudes are seen when the bolted structure is at intact state. This shows a different result compared to the previous section where “1_Both” had high amplitudes. Here, the amplitudes for “1_Both” and “1_Small” have similar maximum heights in general where this trend is also observed for the bolt loosening on #2-1 plate (“2_Small,”“2_Large,”“2_Both”).
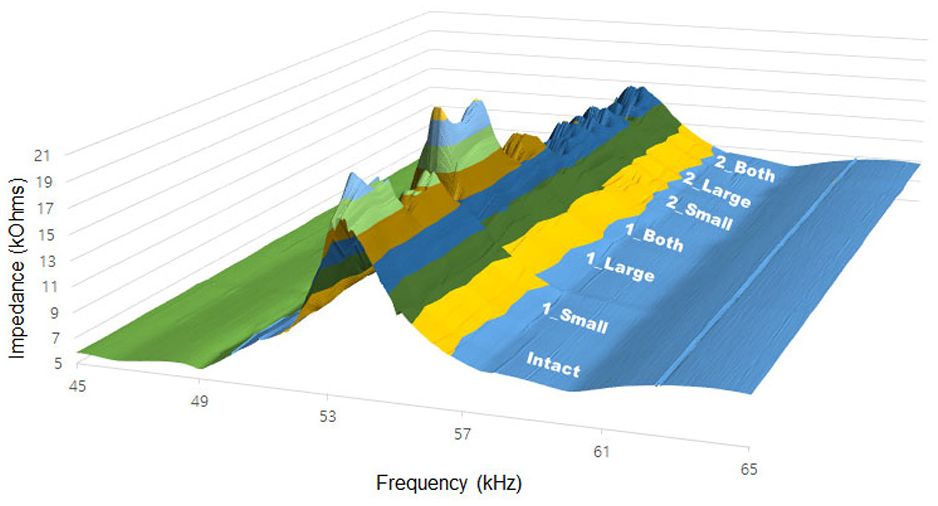
Thirty-five impedance signatures from all bolt loosening case with 5 mm Metal-PZT device.
Table 3 shows the prediction results for the experiment conducted using the 5 mm metal-PZT device. Similar to Tables 2 and 3 is created by calculating the RMSD values using the averaged signatures from Section 4 as reference signatures and five new impedance signatures measured for the actual test as corresponding signatures. First observing the intact case for the left side of Table 3, 60% (three out of five) accurate prediction was achieved with the No.2, No.4, and No.5 correctly identifying the location of the loosened bolt(s) with the RMSD values of 0.81, 0.98, and 0.74, respectively. The other two wrong predictions for No.1 and No.4 predicted that “1_Small” bolt and “1_Large” bolt was loosened, respectively. For the case with loosened “1_Small” bolt, again 60% accurate prediction was achieved with No.2, No.3, and No.4 with the RMSD values of 1.24, 1.13, and 3.1, respectively. Next, 100% correct predictions were made with the “1_Large” bolt loosening case where all the RMSD values are at its lowest compared to the values at each row. Lastly with “1_Both” case, again, 60% accurate prediction is made with correct predictions made for No.2 (2.78), No.3 (2.11), and No.5 (1.5). Overall, when looking at the RMSD values for the averaged impedance signatures, all four values of 0.55, 1.42, 2.3, and 1.4 were able to correctly identify the location of the loosened bolt(s).
RMSD results from using the 5 mm Metal-PZT device.
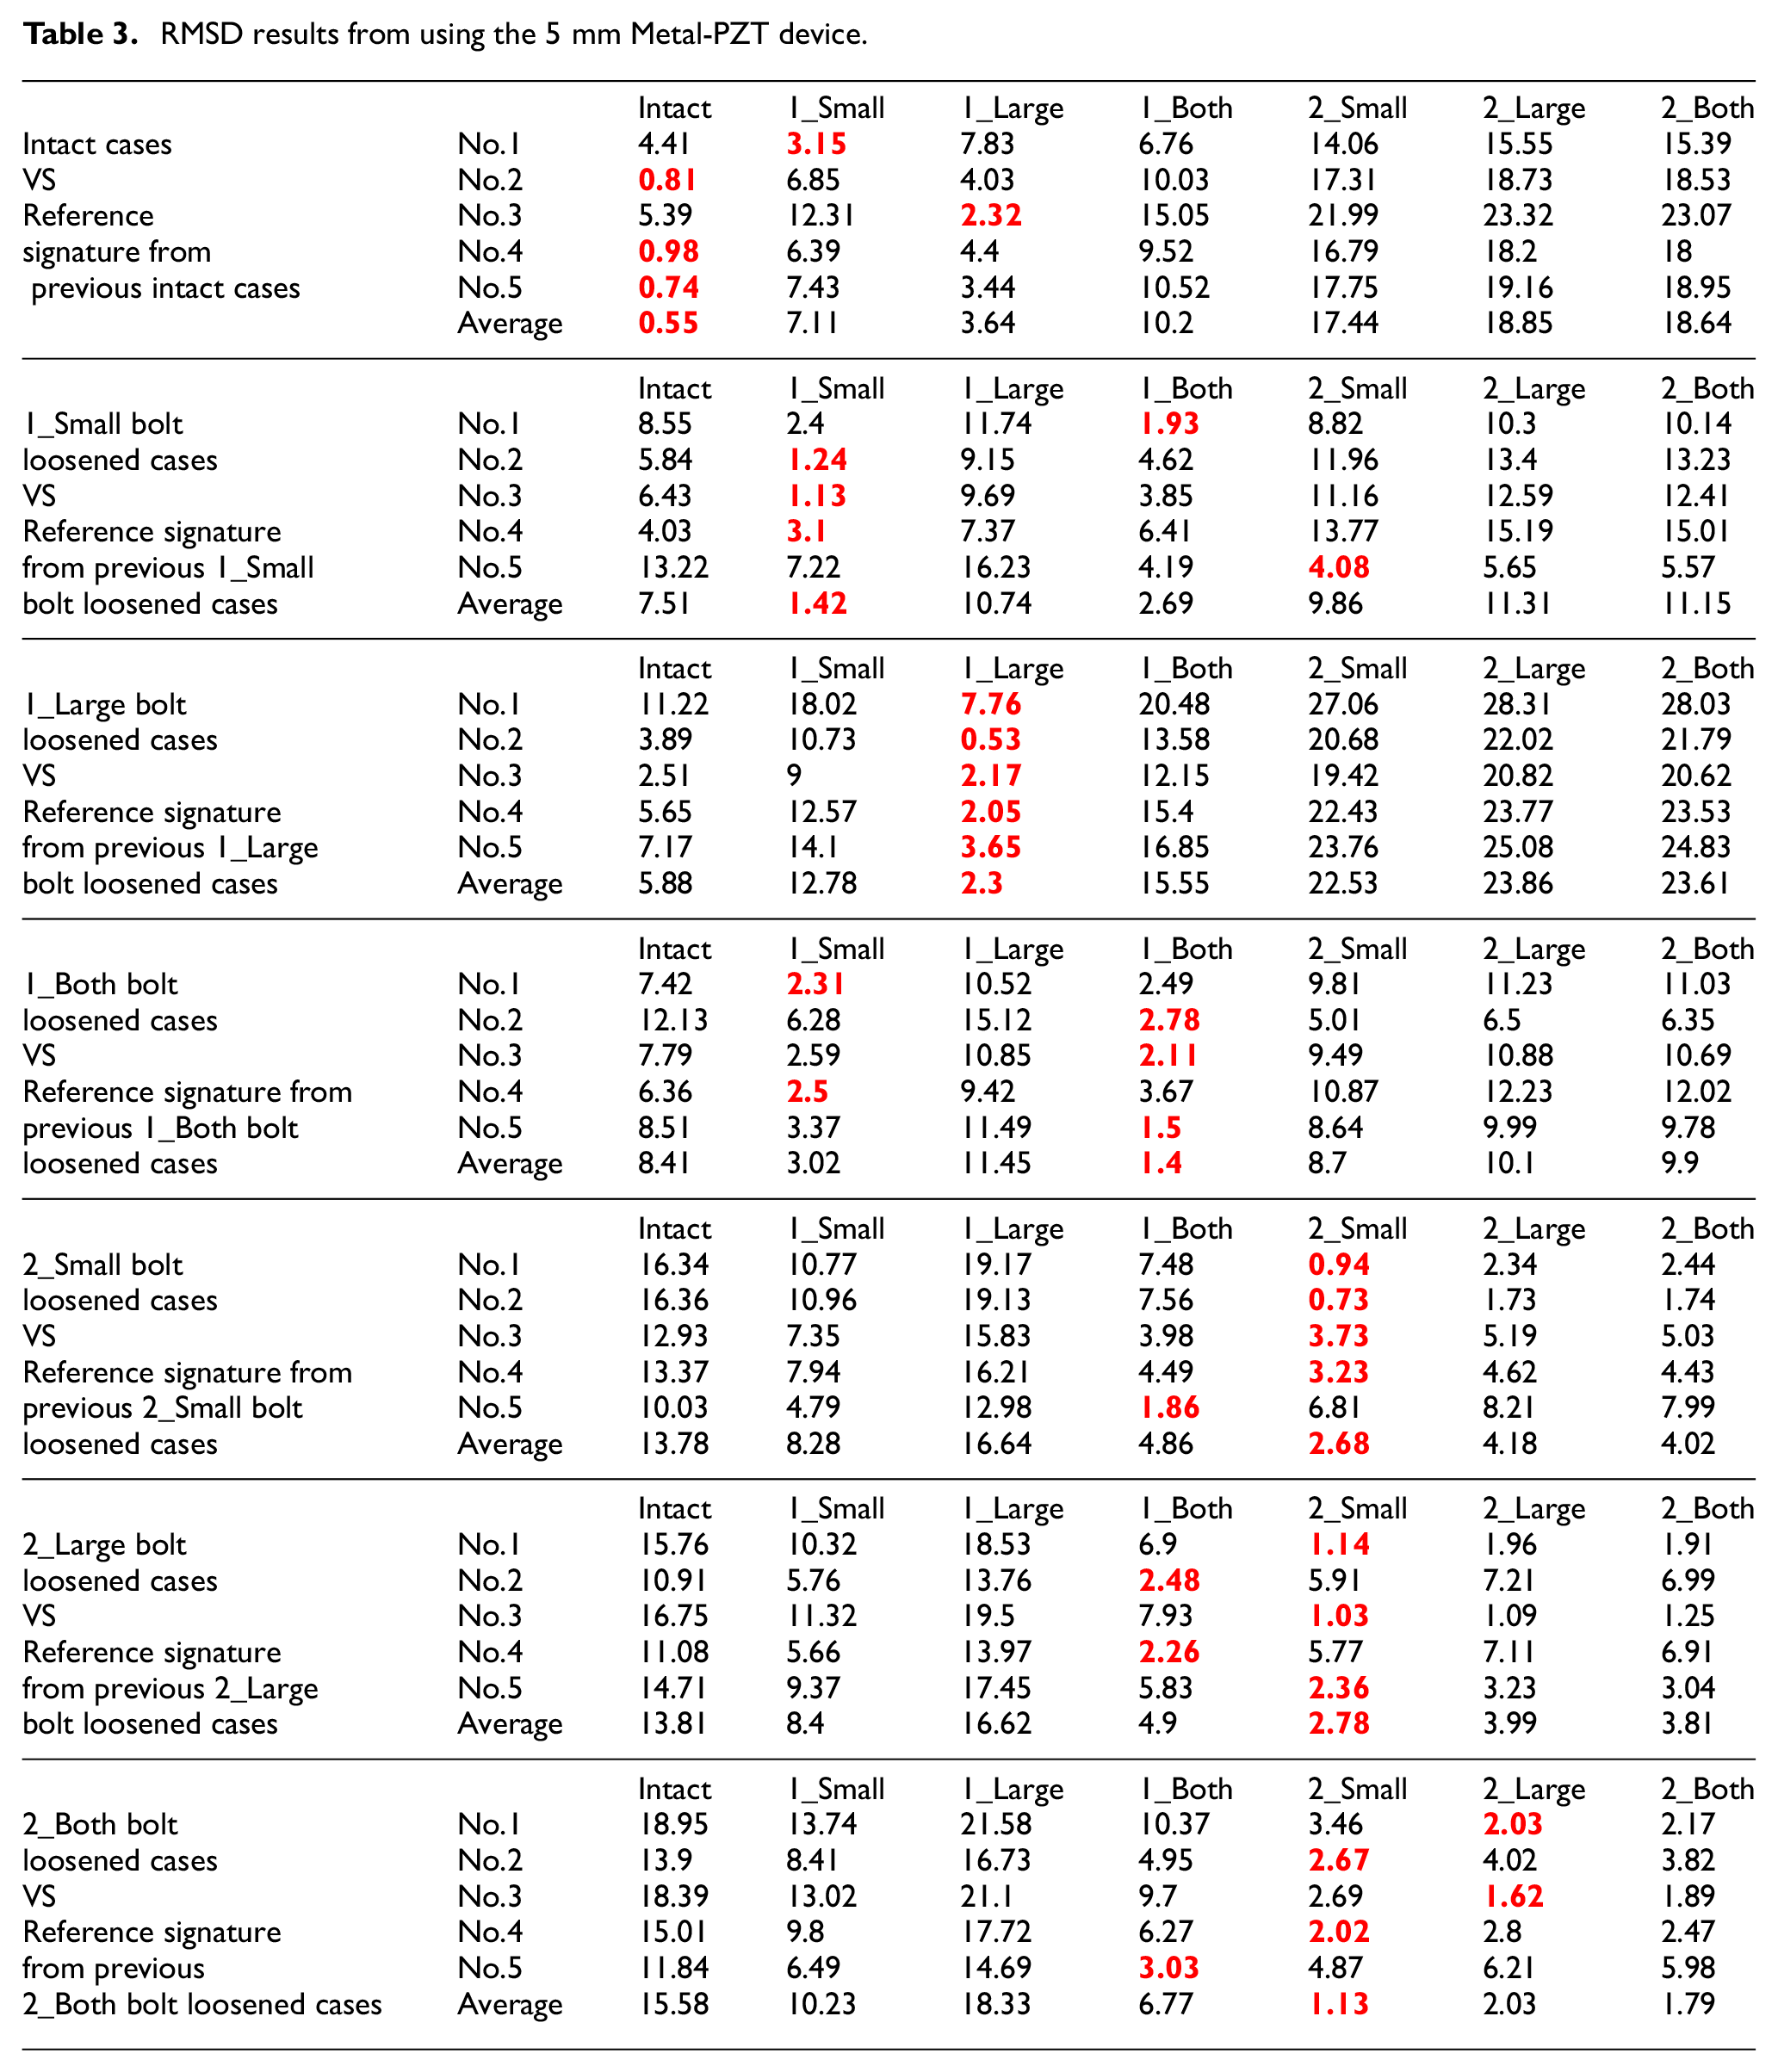
With the right side of Table 3, one can see that the performance of the predictions was quite poor in general. First with the “2_Small” case, although that 80% accurate predictions were made for No.1 to No.4, the predictions for the rest of the bolt loosened tests are very poor. With “2_Large” bolt loosened case predicting 100% wrong prediction indicating that “1_Both” and “2_Small” bolts have been loosened. With the last case with “2_Both” bolt loosened, no correct predictions were made again with the predictions indicating one of the “1_Both,”“2_Small,” or “2_Large” bolt has been loosened. Overall, these results show that using a thick metal (5 mm in this case) can have negative effect when identifying the location of loosened bolts compared to a thinner metal (e.g. 3 mm in the previous section). Out of 35 predictions for both Table 3, only 16 correct predictions were made and most these came from the bolt(s) loosened case for #1-1 plate. This low accuracy of 45.7% (16 out of 35) experimental proves that even a small difference in the thickness of metal (3 mm vs 5 mm) can have dramatic effect in the outcome. One way of possibly increasing the accuracy of the result would be to use a stronger PZT material to create a stronger vibration as 5 mm thickness metal is 5/3 times heavier than 3 mm thickness metal. A simple way of achieving this would be to use another type of PZT.
6. Conclusions
In this study, a concept of electromechanical technique based portable system for detecting bolt loosening is proposed. The conventional way of permanently attaching the PZT transducer is changed in a way to make temporarily attachment to the structure to transform the monitoring method into a portable damage detection system. By doing so, the problem of the impedance signatures changing every time with new attachment existed where a large variation in the signature could lead to a wrong prediction outcome.
Using the Metal-PZT device, experiments were conducted on a bolted structure with four different bolts where these bolt(s) were loosened for measuring impedance signatures. Using the 3 and 5 mm, Metal-PZT device in the frequency range of 30–50 kHz, five impedance measurements were conducted at intact case, 1_Small, 1_Large, 1_Both, 2_Small, 2_Large, and 2_Both bolt(s) loosened. For each case, variations in the impedance signatures existed with the re-attachment of the Metal-PZT device as re-attachment was done manually and even a slight displacement of the device meant change in impedance signature. Here, impedance signatures retrieved from using the 3 mm Metal-PZT device had more resonance compared to the signatures from 5 mm Metal-PZT in general. Since the EMI technique requires multiple number of resonance peaks for a successful damage detection process, signatures from 3 mm Metal-PZT device was predicted to perform better compared to the signatures from 5 mm Metal-PZT device at this stage.
The next step of the research was to average the five impedance signatures at each case to create reference signatures, which was one of the main concepts of creating a portable damage detection system using the AD5933 evaluation board. These reference signatures were used to predict the location of loosened bolt(s) by using the new measured impedance signatures (from the actual experiment) to calculate the RMSD value. Seven reference signatures from intact case to 2_Both case for each of PZT-Metal devices were used to evaluate the performance of the proposed idea. As expected, the 3 mm PZT-Metal device showed very high accuracy with 33 correct predictions out of 35 measurements resulting in 94.2% accuracy. On the other hand, 5 mm PZT-Metal device showed poor performance where only 16 out of 35 measurements (45.7%) were correctly predicted experimentally proving that even the 2 mm thickness difference of the metal disk thickness can have dramatic effect on the performance of the propose idea. Nevertheless, using the 3 mm PZT-Metal device, or even a thinner metal disk, a possibility exist of creating a portable damage detection system that could be used for real applications with further research in the near future.
Footnotes
Declaration of conflicting interests
The author(s) declared no potential conflicts of interest with respect to the research, authorship, and/or publication of this article.
Funding
The author(s) disclosed receipt of the following financial support for the research, authorship, and/or publication of this article: This study was financially supported by Seoul National University of Science and Technology.