
Abstract
Strains beyond the elastic limit of concrete cause cracks in concrete structures. This study analysed distributed optical fibre sensor (DOFS) network strain data to identify excessive strain readings, locations and strain patterns of four reinforced concrete (RC) beams. The strain variation inside the RC beams was investigated using a concrete damaged plasticity (CDP) based finite element analysis (FEA) model. The measured bottom surface and bottom rebar strain were considered for investigation. A three-point bending arrangement was used for the loading, and an optical backscatter reflectometer was used to measure the strain. By visual inspections, it has been found that the onset of hairline cracks at the locations of the higher strain readings. The maximum load applied was 16 kN and has not shown any yielding in strain reading acquired from bottom rebars. FEA results showed admissible agreement with the measured lower surface strain and lower rebar strain. Therefore, when developing a robust SHM system, a CDP-based FEA simulation is a valuable tool for data mining of strain data. Furthermore, the strain data extracted from CDP models can be used to train artificial intelligence based SHM models.
Keywords
1. Introduction
Construction and maintenance of civil infrastructures such as bridges, pipelines, dams and tunnels cost a substantial amount of taxpayers’ money. Generally, the design service life of these structures is typically 100 years (Knott et al., 2017; Li et al., 2010). Such structures are exposed to harsh environmental conditions and extreme operating conditions, and therefore damage accumulation is inevitable (Gul and Catbas, 2011; Magalhães et al., 2012; Min et al., 2012). This accumulated damage may lead to unforeseen catastrophic failures, leading to losses of life and social and economic harm to the country. Thus, the health and integrity of critical civil infrastructure need to be monitored frequently. Generally, visual inspections are most common to evaluate the extent of the damage for periodic maintenance. As such, a rigorous structural health monitoring (SHM) system is needed to reduce potential hazards, increase safety and reduce the operation and maintenance costs by early detection of the extent of the cumulative damage of such structures during their active service life (Diamanti and Soutis, 2010; Di Sante, 2015; Goyal and Pabla, 2016; Rodriguez et al., 2015; Ye et al., 2014).
Sensor type plays a significant role in assessing the structural behaviour (Li et al., 2004), and consequently, efficient signal processing becomes the following essential requirement of sensor networks (Mascarenas et al., 2010). SHM researchers were interested in piezoelectric transducers (PZTs), fibre optic sensors, strain gauges, vibration and acoustic sensors. The use of post-installed surface-mounted (externally epoxy bonded) piezoelectric transducers (PZTs) has recently been extended, not only for SHM applications of small-sized concrete specimens but also for damage detection/identification and assessment of their severity level, as well as the on-line monitoring of the possible damage evolution with time in RC structural members under shear/flexural monotonic and cyclic/seismic loading (Chalioris et al., 2020; Tian et al., 2017; Voutetaki et al., 2022; Zhang et al., 2018).
However, recent advances in optical fibre sensing technologies have shown greater potential due to their reliability and versatility (Afzal et al., 2011). Fibre optic sensors can be embedded into the structure or attached to the outer surfaces (Ye et al., 2014). It was reported that fibre optic sensors, often attached to the surface of the hardened concrete without any intermediate layer, obtain direct surface contact between the sensor and surface (Davis et al., 2017; Regier and Hoult, 2015). Generally, adhesives are used as the bonding agent between the concrete surface and the fibre sensor, and no extra intermediate layer is used. Fibre optic sensors have particular advantages over other sensors. They resist electromagnetic interference, have low losses in signal transmission, are free of corrosion, measure temperature and strain at any point along a single optical fibre length. Furthermore, it reduces the number of sensors and the number of cable lengths used inside the structure and, therefore, reduces the effect on structural integrity (Loupos and Amditis, 2017).
DOFSs provide more advantages than other optical fibre sensor systems. They offer the ability to effectively track physical variations such as temperature, strain and vibration along with the whole fibre (Barrias et al., 2016). DOFS can be employed with large scale concrete structures such as bridges, pipelines and buildings (Jayawickrema et al., 2022). In a DOFS, three separate scattering processes can occur Raman, Brillouin and Rayleigh scattering. Raman-based sensors can only measure temperature, whereas strain, temperature and vibration can be measured using Brillouin and Rayleigh-based sensors (Du et al., 2020). In order to provide millimetre-scale spatial resolution, optical frequency domain reflectometry (OFDR) based on Rayleigh scattering was used (Liang et al., 2015). The same technology is inside the optical backscattered reflectometer (OBR).
Several authors have detected the accurate location of load-induced cracking in RC structures by using fibre optics. These fibres with protective coatings have been embedded in the concrete (Bao and Chen, 2015; Henault et al., 2012; Imai et al., 2010). DOFS can be used to detect such crack formation at an early stage, locate the position of active, fully formed cracks by considering the strain distribution of the reinforcement and provide quantitative information about crack widths with the help of OFDR based DOFS (Berrocal et al., 2021). RC beam was instrumented with four equal segments of single polyimide DOFS externally glued to the bottom surface of the element, each segment using a different type of adhesive. For comparison, three strain gauges were also employed. This beam was then loaded, resulting in expected equivalent levels of strain in each of the fibre segments, allowing for a more direct comparison of the performance of the various adhesives. The impact of varying the spatial resolution is also investigated. In this exercise, in addition to comparing the DOFS readings to the other instrumented sensors, it is also critical to evaluate and analyse the corresponding spectral shift quality (SSQ) values (Barrias et al., 2019).
The post-yield behaviour of the bond in RC cantilever beams exposed to monotonic lateral loading was demonstrated and monitored with a distributed fibre-optic strain sensing system (DFOSSS). The DFOSSS provided precise monitoring of embedded reinforcing bar deformations and strains on the concrete surface. This enabled the determination of slip, steel stress, bond stress, bond degradation length and fracture locations. A model was suggested to predict pre- and postyield bond behaviour, including the steel strain impact, using the updated values for maximum bond stress. Finally, mean bond stress values were supplied to perform a basic evaluation of bond strength in both pre-and postyield regions (Malek et al., 2019).
Three large RC beams, JP-1, JP-2 and JP-3 – were tested in three-point bending with varied amounts of transverse reinforcement. The longitudinal and transverse reinforcement bars were fitted with distributed FOS, allowing the discovery and quantification of various behavioural mechanisms. Stirrup demands at all depths and locations in the member, longitudinal bar strain fluctuations at the support based on shear demand and longitudinal bar bending from stirrup hook anchorage was among them. The establishment and expansion of a plastic hinge in specimen JP-3 after longitudinal bar yielding was tracked under increasing plastic rotation. Simultaneously, while being subjected to a near-constant shear force, the stirrup strains increased, particularly at the critical section for shear (Poldon et al., 2019).
A methodology was developed for measuring distributed reinforcement strains in RC elements using fibre optic sensors that is more cost-effective and time-consuming than existing methods. In three-point bending, nine RC beams were tested, and the data were shown to be reliable compared to electrical strain gauges and theoretical expectations. This is the first time that dispersed fibre optic sensors have accurately assessed reinforcement strains after cracking; nevertheless, strains above yield could not be reliably quantified. The correlation of reinforcing strains to crack width measurements revealed variances in how cracks begin in a single specimen from crack to crack. Finally, the experimental results were used to investigate the feasibility of using existing models to estimate reinforcement strains from exterior crack width measurements for RC assessment. (Brault and Hoult, 2019)
Recent advances in computational techniques and extensions of constitutive models of materials to macro levels have produced precise and accurate numerical simulations under both static and dynamic loading conditions (Li et al., 2015; Othman and Marzouk, 2017). In addition to experimental investigations, FEA can be used to simulate behaviour under various operational conditions during the design of structures and structural components. The major challenge in the finite element simulation of concrete structures is the difficulties in including the nonlinear material behaviour, which leads to cracks’ growth under various loading conditions. Because concrete and steel are highly nonlinear materials, RC’s material nonlinearity is a complex combination. To date, published data on the nonlinear material effects of RC research is limited. Therefore, including nonlinear effects by specifying nonlinear material properties is tedious and needs substantial knowledge of concrete’s fracture and damage mechanisms (Benin et al., 2020).
Many commercial software packages such as ABAQUS, ADINA, ANSYS and NASTRAN have a specific module for nonlinear analysis. Based on the fundamental understanding of the CDP model, ABAQUS uses the key failure mechanisms for concrete: cracking under tension and crushing under compression. Much published research has reported that the ABAQUS package has been used to nonlinearly analyse RC beams’ bending failure simulations, with results validated by experimental findings (Sihua et al., 2015). A specific RC beam experiment using a CDP model was verified and the FEA model could predict the RC beam’s overall behaviour (Revanna et al., 2020).
Accordingly, by using DOFS networks, many studies were conducted to contribute new knowledge in crack initiation and the propagation of RC structures. However, less attention was paid to assessing the behaviour of the strain patterns in the structure when concrete starts to crack. This study aims to compare the strain patterns in the structure by strain monitoring with DOFS and the strain readings extracted from the FEA. The combination of FEA simulation and experiments employed in this study presents an alternate SHM methodology to the research community. Recent studies has also addressed this combined technique, which includes a initial numerical investigation of the inspected, undamaged existing RC structure to provide numerical damage indices. In this way, the combination of experimental and numerical results could produce more reliable conclusions regarding the effectiveness of the suggested method to monitor and identify strain data locations and patterns in RC beams (Ai et al., 2019; Chalioris et al., 2021; Jiang et al., 2017; Voutetaki et al., 2022).
The research is unique because it suggests that generating concrete beam strain data for strain data mining via concrete damaged plasticity modelling is acceptable. The generated strain data can be used to train deep learning (DL) based AI algorithms to predict structural health. DL models can automatically learn the representation required for detection or classification without human intervention and excel at discovering relationships in complex, high-dimensional data, making it applicable to various experimental data-based predictions such as structural health monitoring of civil infrastructures. Generally, DL models need a large amount of data during the training process. This data can be generated in two ways: experimentally or numerically. However, generating many experimental data to train a DL model is not economically viable and time-consuming. Consequently, the most efficient method for generating a large amount of data through a FEA of a correlated model of a structures. Therefore, the training data can be generated after conducting a series of planned experiments and FEA model validation. A validated FEA model can be extended to predict structural performances of the structure under different loading conditions, provided that the model strictly follows the validated conditions.
In future studies, the authors intend to follow the proposed method for strain data mining, and the generated stain data will be used as training data for DL models to predict structural health in complex cases.
2. Materials and experimental methods
One of the objectives of this study is to extract strain measurements via fibre optic sensors by using OBR distributed sensing technology in reinforced concrete structures and validate an FEA model of concrete beams using experimental results. The comparison between rebar strain and surface strain of each beam is not considered an objective of this study. For this purpose, four RC beams were casted, and in two of them, the fibre optic sensors were surface-mounted (B1 and B2), while the other two were instrumented with fibre optic sensors bonded with rebar (B3 and B4). Here, beams are not instrumented with surface and rebar attached sensors, considering the ease of fabrication and handling process. Beams were loaded monotonically up to a predefined load limit.
2.1. Specimen geometry and materials
The beam definition is shown in Figure 1, and the dimensions of the casted beams were 1400 mm in length and a cross-section of 100 mm × 250 mm. Each beam was reinforced with 8 and 10 mm diameter rebars for its top and bottom, respectively. A clear concrete cover of 25 mm was maintained for all the beams. Stirrups spacing was used as 165 mm during the construction of reinforcements to minimise the shear failure. Grade 25 concrete premix was used to cast the beams, after which the beams were kept for 7 days in wet conditions and 21 days under room conditions. The beams were then tested after 28 days from casting. Characteristic cylinder compressive strength (Fck) was experimentally tested for the concrete and found 18 MPa. The geometrical, mechanical and reinforcement characteristics were selected to match the dimensions to test the beam at MTS Sans Testing Machine and ease of handling. Similitude methods can be used to scale up the RC structures. (Casaburo et al., 2019)
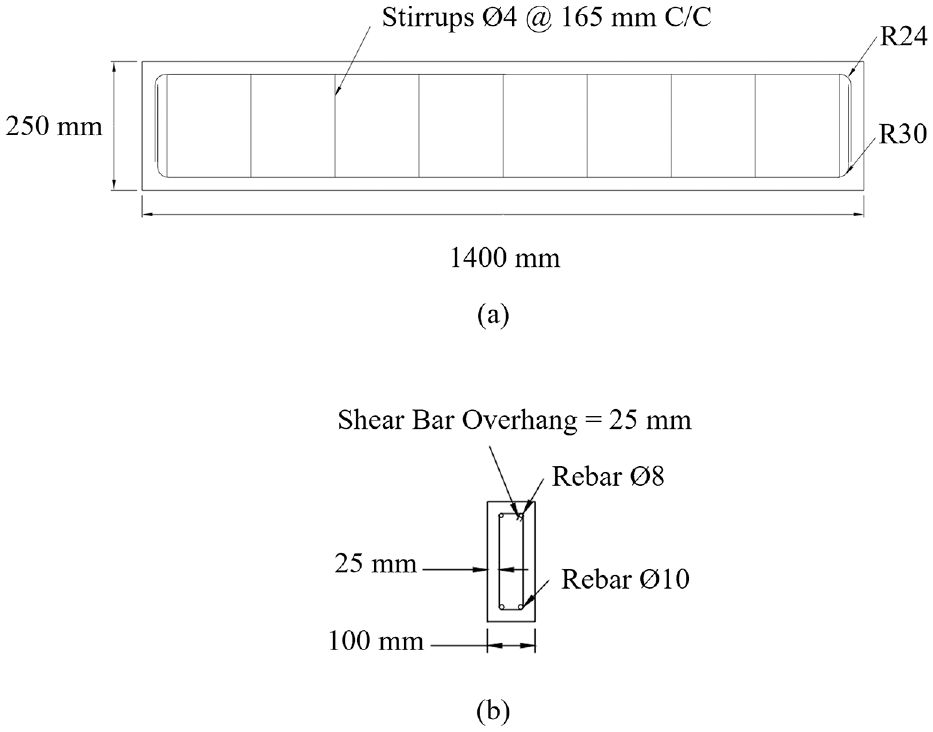
(a) Reinforcement details of the beam (b) sectional view of the beam.
2.2. Sensor installation and strain monitoring
The optical fibre SMF-28 with a cladding diameter of 125 µm were used to measure strain. TECHNIGLUE R60 and H60S mixed in a 2:1 ratio were used for the surface mounting of sensors at the bottom surfaces of beams B1 and B2. Figure 2(a) shows the sensor layout and the mounted sensor length was 1000 mm.
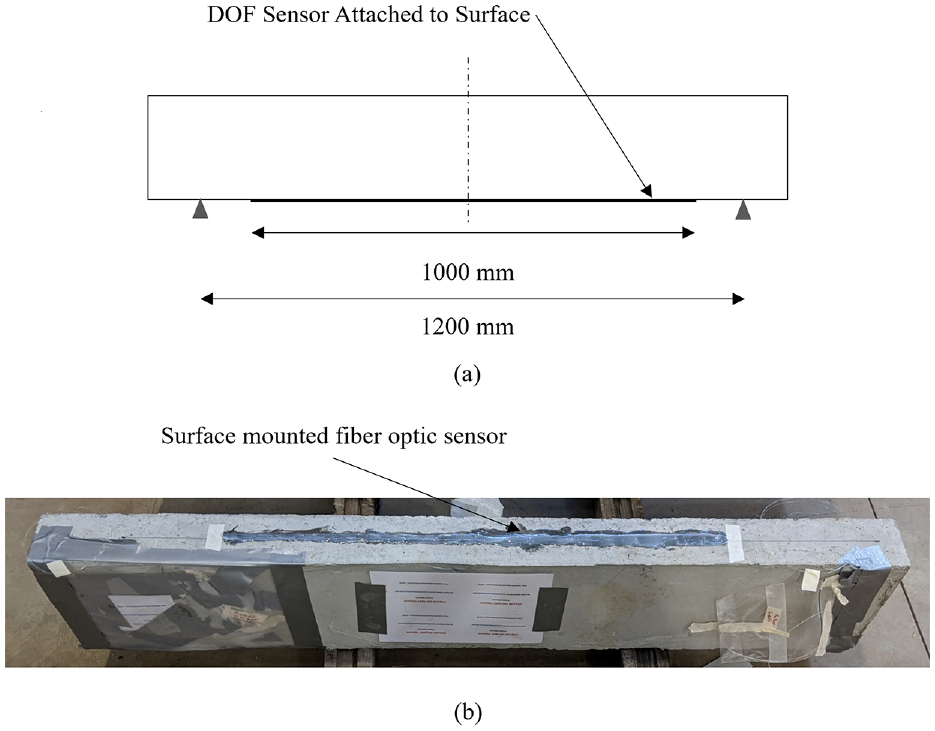
(a) Schematic diagram of the sensor arrangement of the beam (b) surface-mounted fibre optic sensor to the beam B1.
Beams B3 and B4 were used to measure the strain variation of the bottom rebars. A groove of 1 mm × 1mm along the rebar length of 1350 mm was machined using a milling machine. Then the optical fibre sensor was placed along the groove. TECHNIGLUE R15 and H15S mixed in a 2:1 ratio were used to attach the fibre optic sensor to the rebars. In order to detect the highest strain of the bottom rebar, the side with the fibre optic cables was placed facing the bottom of the beam. Figure 3 shows the fibre optic sensor attached to the rebars. The reinforcement cage was made as per the arrangement shown in Figure 1. The cage with attached sensors were placed in position before the casting. Surface mounting of the sensors was done after 28 days of curing the beam.
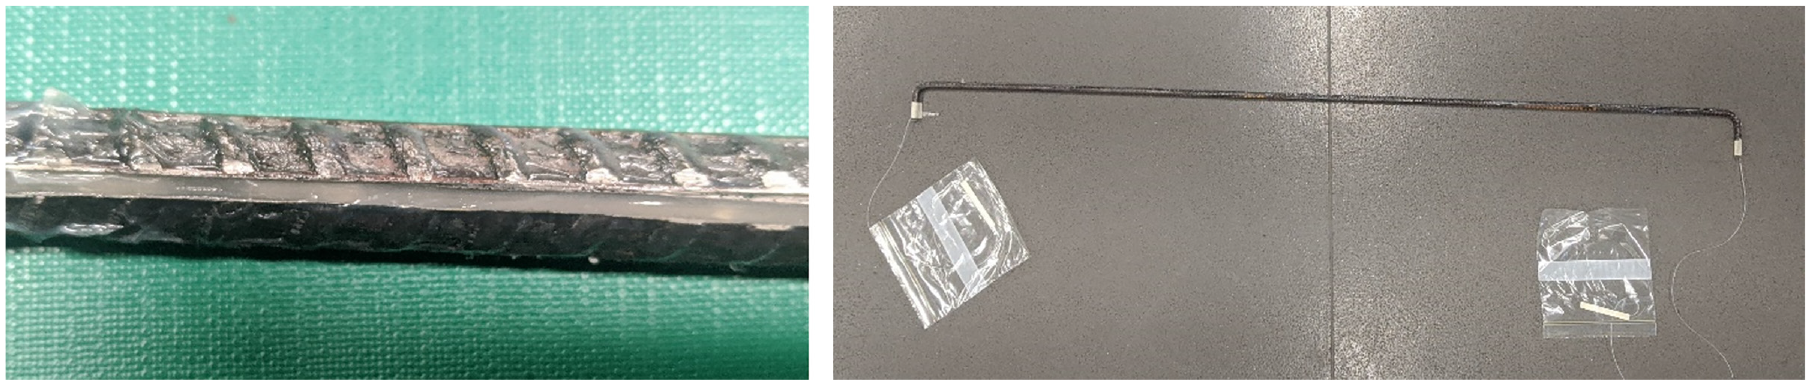
Bottom rebar with fibre optic sensor attached.
An OBR 4600 optical backscattered reflectometer was used to monitor and record the strain variation along the surfaces and rebars during the flexural testing. All tests were conducted under the time domain and the scan range was set from 1555.870 to 1577.155 nm. The spatial resolution of the fibre sensor was set to 0.038428 mm and the gain was set to 24 dB. Both sensor length and sensor spacing were set to 1 cm by using the software. The fibre’s physical length and index of refraction are intrinsically sensitive to environmental parameters: temperature and strain, and to a lesser extent, pressure, humidity (if the fibre coating is hydroscopic), electromagnetic fields, etc. In most instances, temperature and strain will dominate the spectral response of Rayleigh backscatter. Consequently, temperature change can contribute to noise during the measurement of strain. The methods of temperature compensation can be implemented to reduce these noises.
2.3. Loading setup
An MTS SANS Testing Machine, which has a capacity of 2000 kN, was used to test the beams, as shown in Figure 4. All the beams were simply supported, and a three-point bending arrangement was used for the loading. The beams’ loading span was 1200 mm and the beams were loaded at the mid-span on the middle centerline. B1 and B3 were loaded up to 11.0 kN, while B2 and B4 were loaded up to 16.0 kN. The design load of the beam is 25 kN and the ultimate load is 35 kN. The loads used for the experiment as a percentage of ultimate are 31% and 45.7%, while the ratios of the applied bending to the bending capacity of the beams were 29.2% and 41.9%. The design was conducted according to the British standards BS 8110 – Part 1:1985 and BS 6399 – Part 1: 1984. The project’s scope was to study the strain patterns below the design load of the beam and not to strain the rebar plastically. Therefore, applied load levels were selected below the design load limit. The testing machine was set up to a 1 mm/min crosshead movement rate.
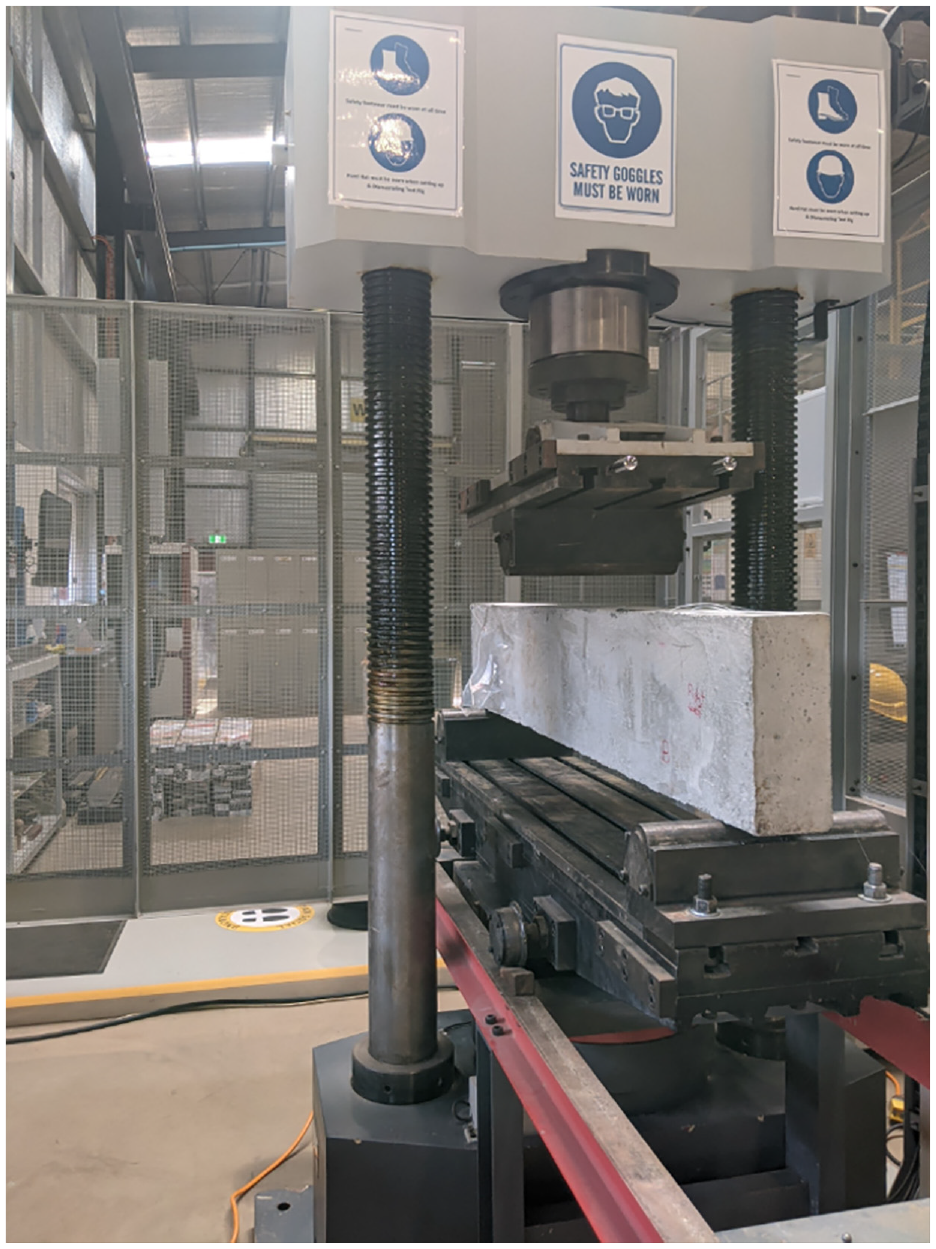
Testing of the beam by MTS SANS Testing Machine.
3. FEA modelling of short reinforced concrete beams
FEA analysis of reinforced concrete has been done with many approximated methods using commercially available software packages. ABAQUS/Explicit Version 2019 was used to perform the FE analysis. Since it has a greater likelihood of numerical convergence, an explicit analysis is more suitable where strong discontinuities can be seen in the geometry or the material properties. However, most commonly used damage modelling techniques in ABAQUS, such as XFEM and Cohesive Element modelling (Park et al., 2010; Zhao et al., 2020), have not been provided results closer to experimental results. Therefore, CDP Model has been selected for analysis and detailed in the following sections (Sümer and Aktaş, 2015).
A model should produce critical and essential results such as stress, strain and displacements. Simpler models can produce erroneous outcomes. The model’s accuracy for estimating behaviour should be an acceptable level of accuracy to use the data. Otherwise, low accuracy results may lead to inaccurate conclusions. However, it should not be too complex since the computational time increases with the model’s complexity. In this study, because of the high nonlinearity of the model, all the modelling jobs were performed by using a high-performance computer (HPC) at the University of Southern Queensland. A total number of 60 simulations were conducted at the HPC and the time taken for each simulation was approximately 30 min with 10 CPUs.
3.1. FEA model details
The concrete was modelled as a homogeneous solid material. A Standard 8 node linear brick element (C3D8R) with reduced integration and hourglass control was used to model the concrete beams. The use of this element type prevents the shear locking. Tetrahedral elements have a wide range of geometrical features. A decent mesh of hexahedral elements (C3D8R) typically yields a solution with comparable precision at a lower cost. In general, truss elements were used to model the rebars (Lee et al., 2020; Milligan et al., 2020; Raza and Ahmad, 2019). Truss elements can carry only tensile or compressive loads. The top two rebars and stirrups were modelled as truss elements to minimise the computational time by reducing the complexity of the model with Standard 2 node linear 3D truss elements (T3D2). However, for the bottom rebars, eight-node linear brick element (C3D8R), reduced integration and hourglass control were used since the truss elements (T3D2) do not provide the logarithmic strain variation direction-wise. As a common fact, during casting, the top rebars are used to place the shear reinforcements (stirrups) in the correct orientation (vertically). A loading arrangement was proposed here to mimic the loading in the experiment and it was modelled as a discrete rigid shell with three node 3D and four-node 3D bilinear rigid quadrilateral elements (R3D3 and R3D4), respectively. Element type and the number of elements used in the model are given in Table 1.
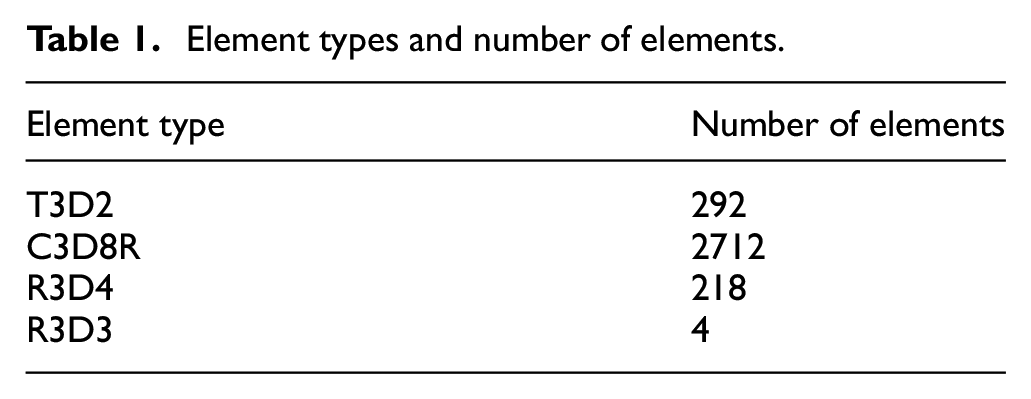
Element types and number of elements.
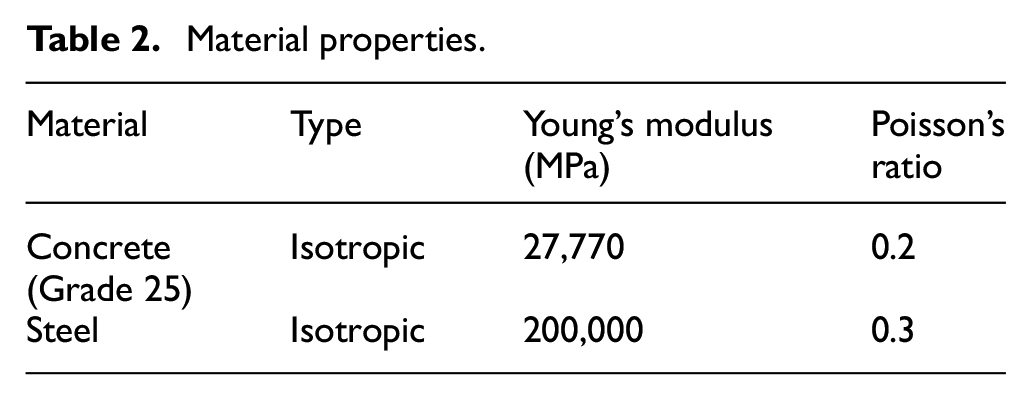
The embedded region feature in ABAQUS was used to model the constraint between the reinforcement and the concrete beam for modelling simplicity. A perfect bond was assumed here between the reinforcement and concrete during the analysis. The contact interaction property between the loading arrangement and concrete beam was selected as a hard contact in the normal behaviour, and for the friction coefficient, 0.3 was selected in the tangential behaviour (Lee et al., 2020). The exact experimental loading magnitude with respect to the time was used in the FEA analysis. Boundary conditions were applied to the support locations of the beam. One end of the support was modelled as pinned, while the other was modelled as roller support. The concrete’s material properties: stress-strain data for compressive and tensile behaviour and compressive and tensile damage parameters were computed using the model code provided by International Federation for Structural Concrete (CEB-FIP model code), and steel properties are tabulated in Table 2.
Material properties.
3.2. CDP model
In order to accurately capture the response of concrete, nonlinearity has been considered in constitutive modelling. Using elastic damage models or elastic-plastic laws to model concrete’s constitutive behaviour is extremely difficult, and irreversible strains cannot be captured in an elastic damage model (Sümer and Aktaş, 2015). The concrete smeared cracking model, concrete damaged plasticity (CDP) model and brittle cracking concrete model are the constructive models that can define the inelastic behaviour of concrete. Compared to other models, CDP provides better accuracy (Raza and Ahmad, 2019). The CDP model is based on physical parameters with explicit physical interpretations (Kmiecik and Kamiński, 2011). Thus, for modelling the nonlinear behaviour of RC, the CDP model is widely accepted (Alfarah et al., 2017; Piscesa et al., 2017; Youssf et al., 2014). The CDP model consists of the concrete’s plastic behaviour, compressive behaviour and tensile behaviour. The CDP model assumes that the concrete material is uniform, isotropic and continuous (Qingfu et al., 2020).
Dilation angle (ψ), flow potential eccentricity (ε), the ratio of the compressive strength under biaxial loading to uniaxial compressive strength (fb0/fc0), shape factor (K), viscosity parameter (μ), elasticity modulus of concrete (Ec), concrete compressive behaviour, concrete tensile behaviour and density were the main parameters considered in this study. The default values for ε, fb0/fc0 and K were assigned (Milligan et al., 2020). Table 3 shows the CDP properties for the beams. Since ABAQUS/Explicit has been used for the simulation, a viscosity parameter is not required, and hence the value of the viscosity parameter was considered zero.
CDP properties of RC beams.
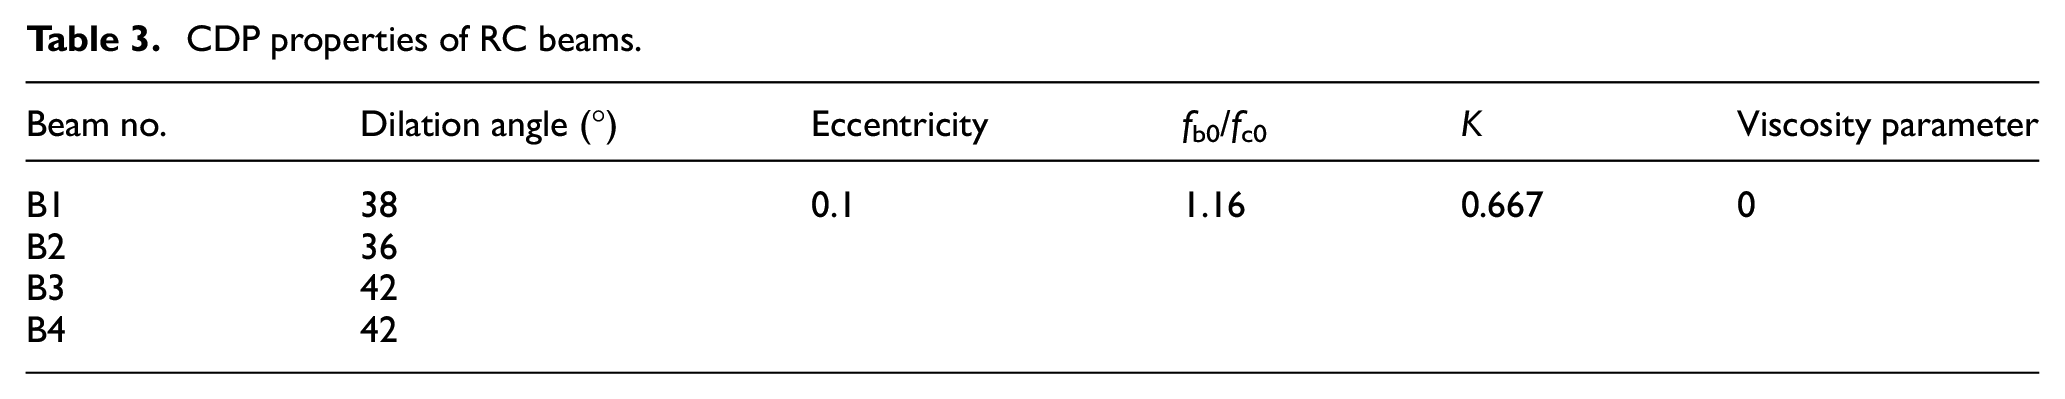
The mechanical properties of concrete and strain rate effects for compression and tension were calculated based on the International Federation for Structural Concrete. Usually, the dilation angle of concrete varies between 25° and 45° (Genikomsou and Polak, 2015). The dilation angle is one of the most critical parameters in the CDP model, and the material is brittle for smaller values while it is stiffer for larger values (Behnam et al., 2018). In this study, a series of simulations were performed on a case-by-case basis in the HPC by varying the dilation angle from 30° to 45° (with an increment of 1°) to find the most appropriate dilation angle for the model. After the simulations, three different dilation angles were used to obtain a close correlation between the FEA model and the experimental results (Genikomsou and Polak, 2015). This can be attributed to the human errors that happen in the pouring and compacting during the casting of the beam, which has caused this discrepancy. The most appropriate dilation angles and other respective CDP properties are presented in Table 3 for all four beams.
Logarithmic strain data along the z-direction of the bottom surface of the beam and the bottom rebar were extracted. Further, the extracted strain values from the model were compared with the experimental strain data. Mesh size smaller than 25 mm was not considered since the mesh should be larger than the aggregate size of 20 mm. The parametric analysis for mesh size selection (convergence study) demonstrated that the use of finite elements with a mesh size of 25 mm provides the most accurate simulation of the experimental behaviour; hence, 25 mm mesh was selected for the FEA. Figure 5 shows the model’s mesh, loading and boundary conditions.
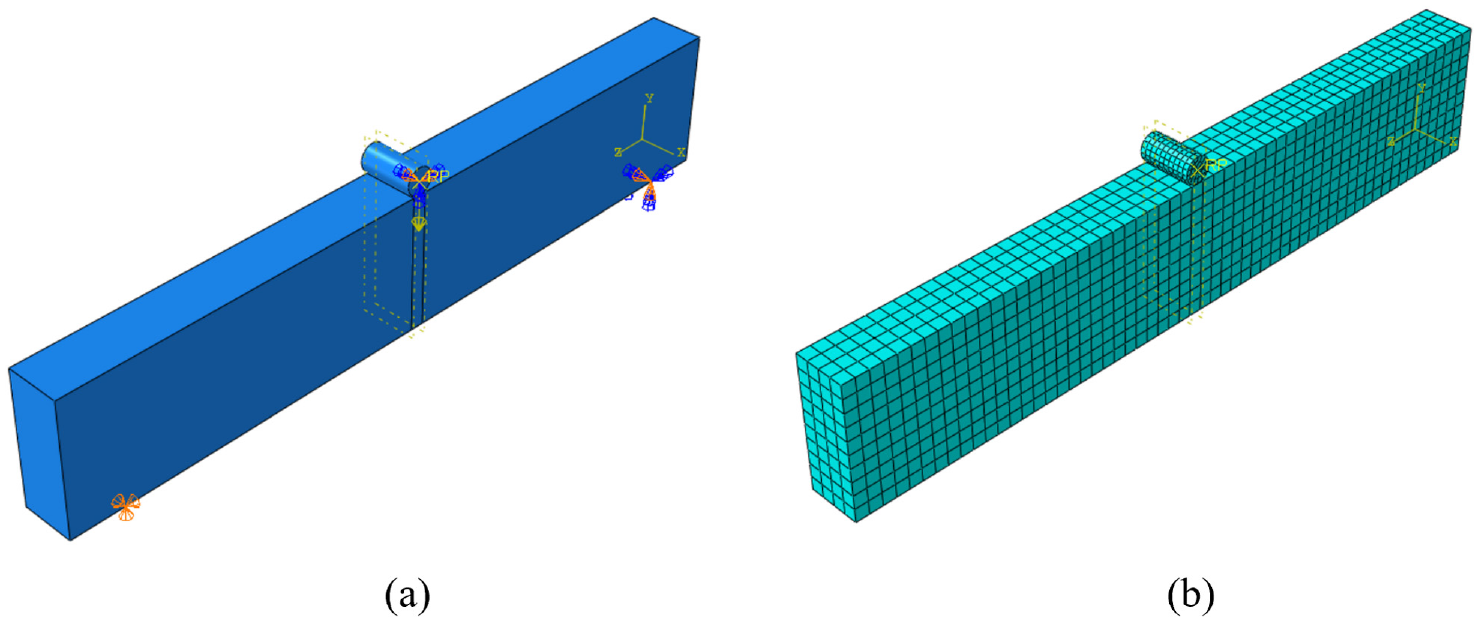
(a) Loading and boundary condition (b) mesh configuration.
4. Results and discussion
The experimental and simulated results of strain variations along the beam surfaces and rebars were compared. The main focus was to understand the ability of DOFS to provide valuable quantitative information on strain in RC elements under flexural loading. Furthermore, the locations of the peak strain occurrences and the strain patterns were identified and are discussed in this section.
4.1. Analysis of surface strain
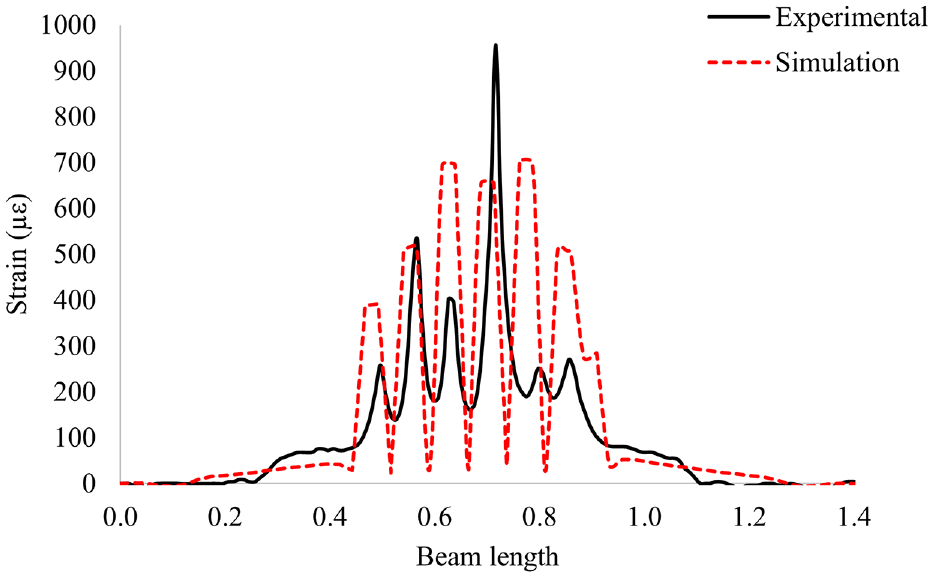
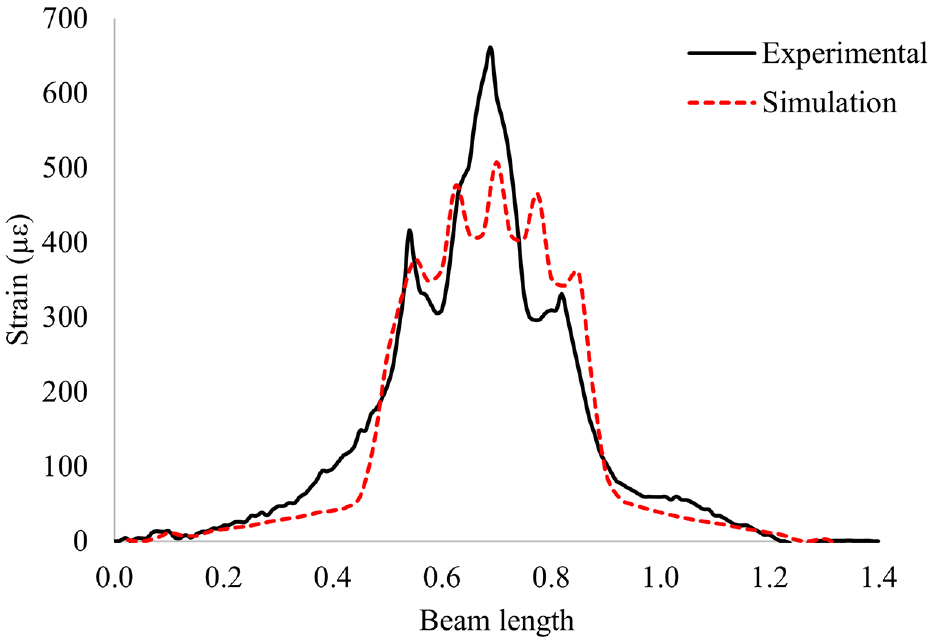
The strain measurements given by the concrete surface-mounted optical fibre sensors were used to verify the extracted strain values from the simulation for beams B1 and B2 (see Figures 6 and 7, respectively). Figure 6 shows six peak values in the experimental strain curve, with the highest peak strain observed as 957 µε at the mid-span. In the simulation strain curve, the highest peak value of the six is 697 µε. The peaks are between 0.4 and 1.0 m (Cracked length) along the beam length for both curves.
Experimental surface strain results versus simulation surface strain results of the beam B1 at 11 kN load.
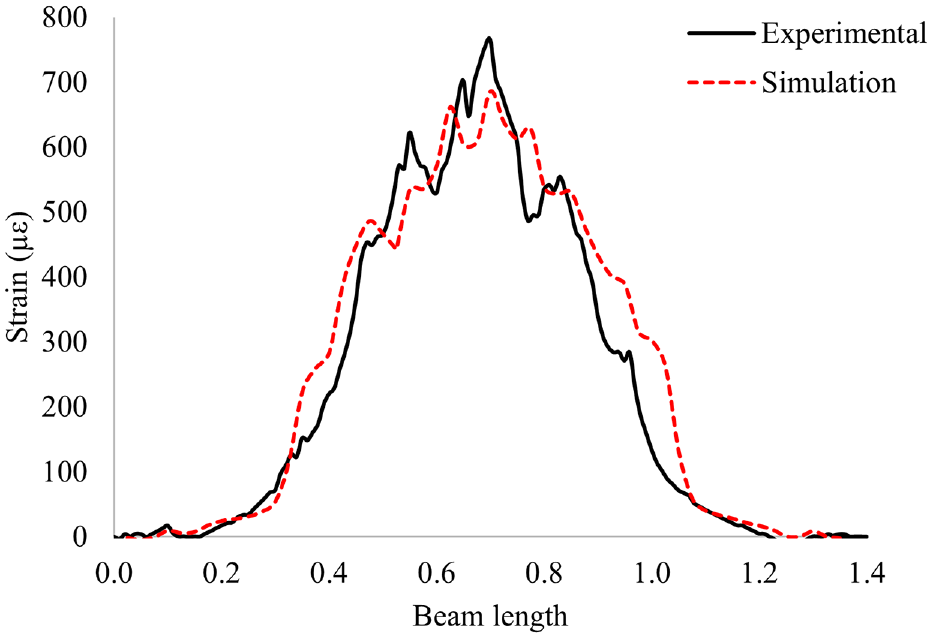
Experimental surface strain results versus simulation surface strain results of the beam B2 at 16 kN load.
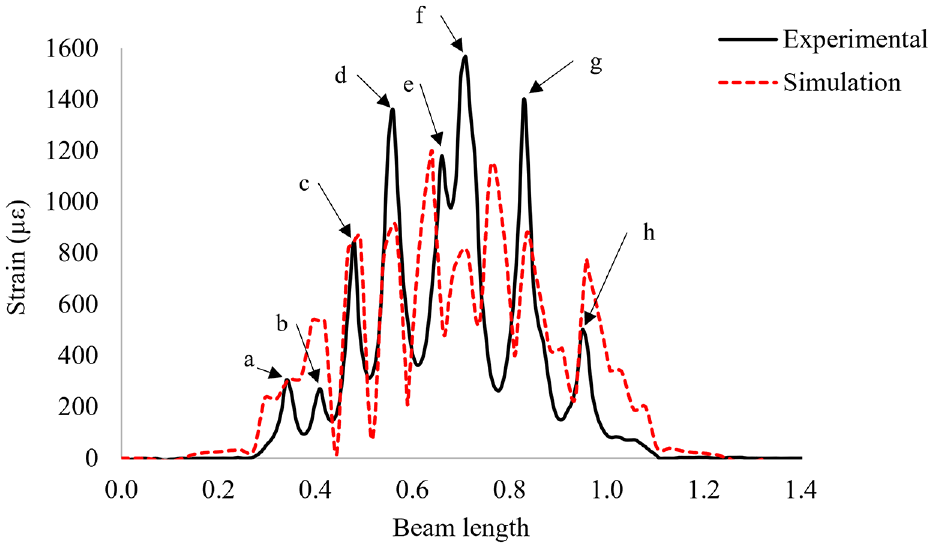
Figure 7 shows eight peak values along the beam length for the experimental strain curve, the highest peak strain recorded as 1566 µε at the mid-span. The simulation strain curve shows the highest of eight peak values at 1196 µε. All the peaks are between 0.2 and 1.2 m along the beam length for both curves.
The two main concrete failure mechanisms are cracking in tension and crushing in compression. Concrete cracks occur when the tensile stress is greater than the tensile strength of concrete, which is one of concrete’s most significant weaknesses. In RC, rebars help to keep these cracks minimal. These cracks provide an enormous amount of information about the damage inside the concrete structures.
The oscillations of experimental and simulated strain data can be seen in Figures 6 and 7. Usually, the appearance of strain spikes indicates the development of cracks at that location because of tension where the valleys suggest that the concrete strain is lower. Generally, concrete cracks if the tensile strain exceeds 100 to 120 µε (Leonhardt, 1988). There is a significant difference between the experimental and simulation strain values along the beam length. This may be due to possible debonding of the fibre with the concrete surface due to hairline crack initiation, which causes the fibre to elongate independently, showing the unusual higher strain. Hairline cracks were visible after the experiment. Figure 8 shows the visible hairline cracks on the fibre at the bottom surface of beam B2 at load 16 kN. Figure 9 shows a fibre optic sensor on a cracked concrete surface. An admissible agreement was found between the optical fibre strain readings and the FEA results. Moreover, the experimental results shown in Figure 7 were in good agreement concerning the locations where hairline cracks are visible, as shown in Figure 8.
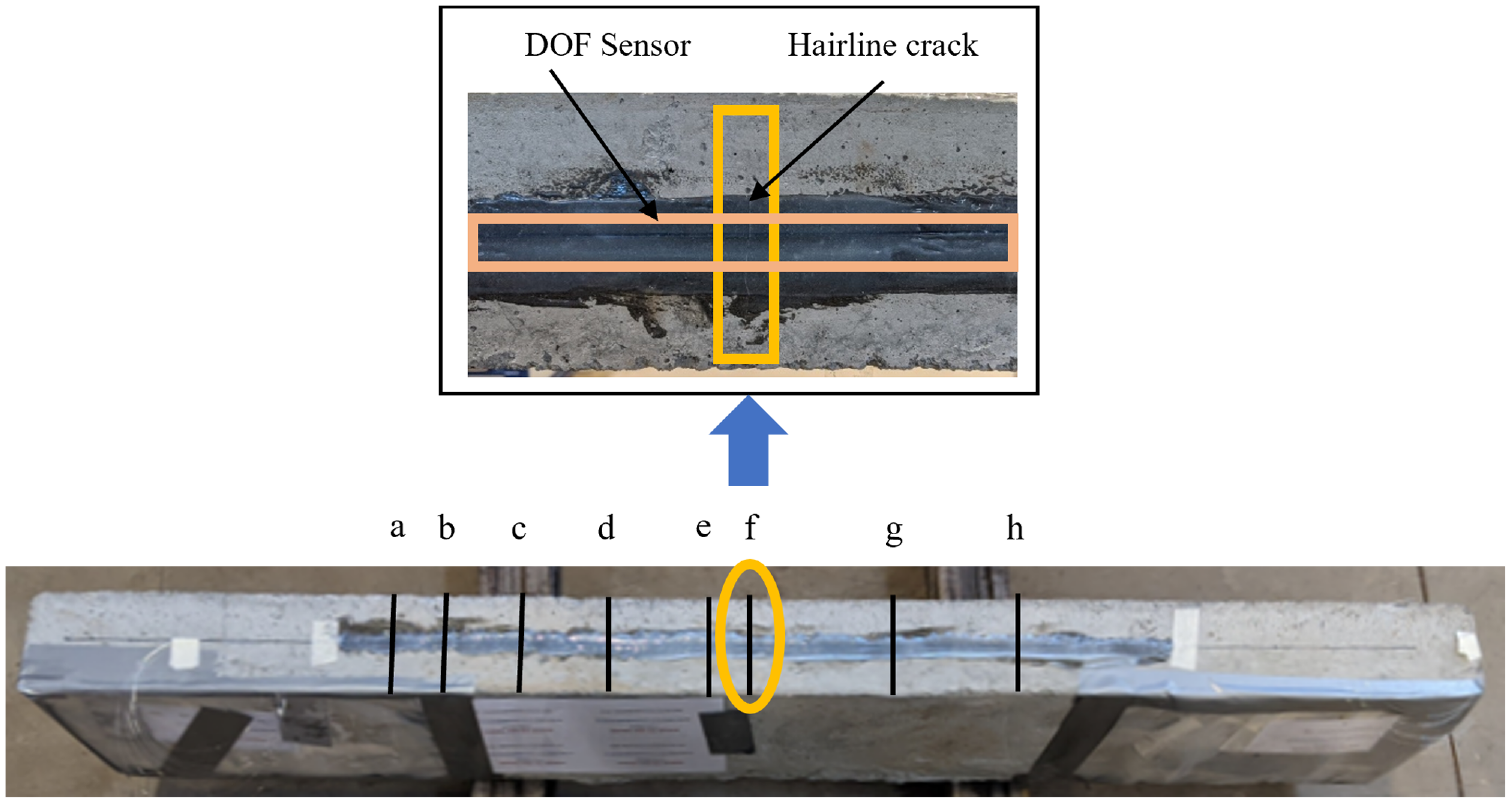
Hairline crack locations appeared on the bottom surface of the beams.
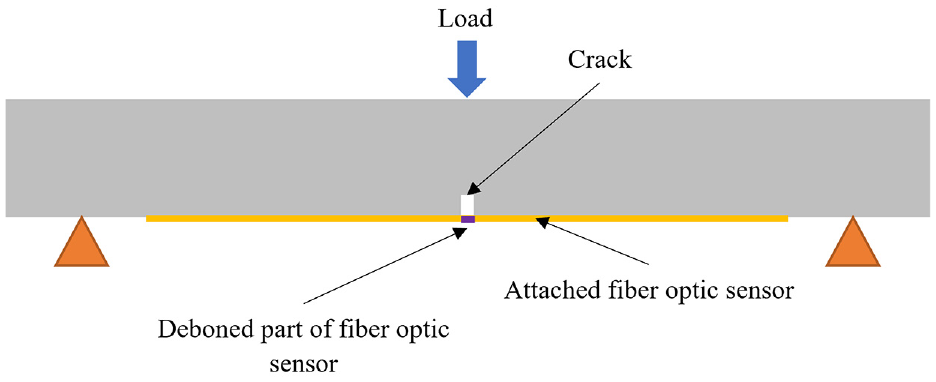
Fibre optic sensor in a cracked concrete surface.
The concrete damage contour for tensile stress of B1 and B2 are shown in Figures 10 and 11, respectively. These damage contours correspond to the damage exceeding the concrete crack strain in tension. Principal tensile stress can be used in ABAQUS to present cracking patterns, but plastic strains better visualise cracks (Raza and Ahmad, 2019); thus, Figures 12 and 13 are presented for B1 and B2. It was discovered and verified that patterns of cracking/damage visualised by simulation closely agree with the experimental fibre optic strain patterns depicted in Figures 6 and 7.
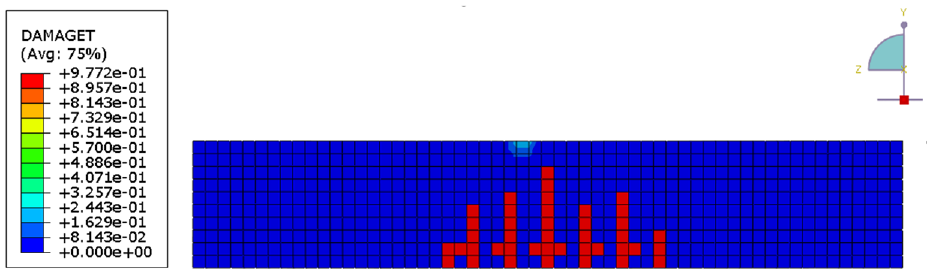
Field output of tensile damage variable of the beam B1.
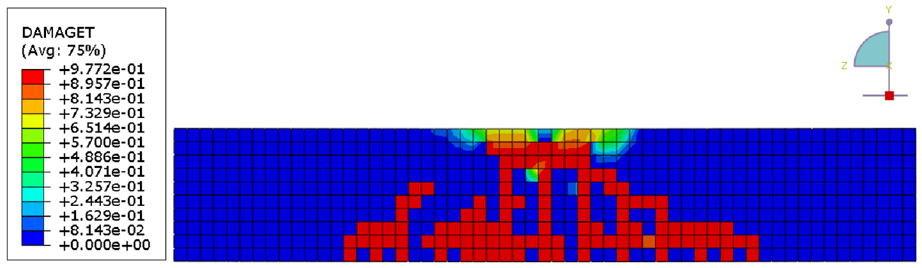
Field output of tensile damage variable of the beam B2.
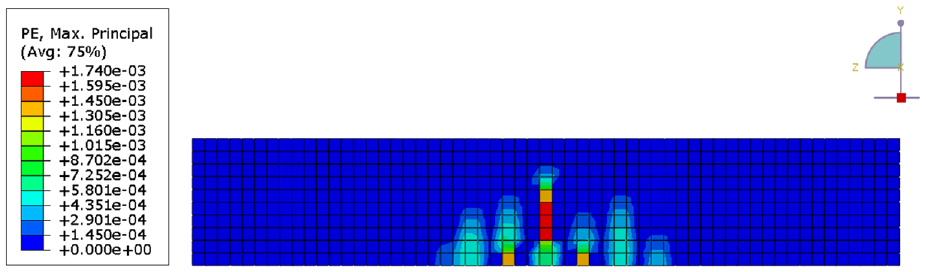
Field output of plastic strain of the beam B1.
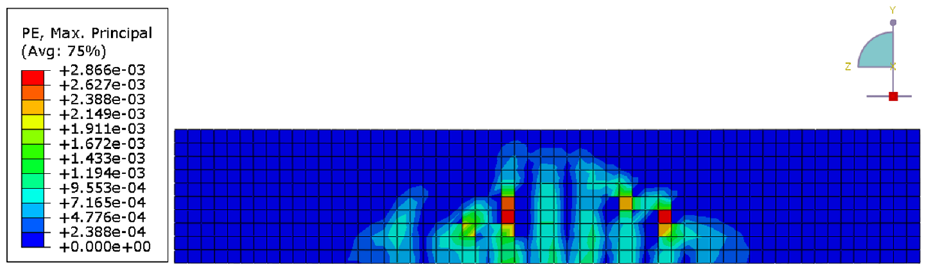
Field output of plastic strain of the beam B2.
Figures 10–13 have not shown 100% symmetry about the centerline. This is due to the two different boundary conditions (Pinned and roller) used at the supports of the beams. The same phenomenon has been reported in references (Al-Gasham et al., 2020; Hanif et al., 2016; Shafieifar et al., 2018; Singh et al., 2017).
4.2. Analysis of rebar strain
The strain measurements from the rebar-attached DOFSs were analysed against the respective simulation strain results for beams B3 and B4. The comparison of experimental and simulated bottom rebar strain results for beams B3 and B4 is illustrated in Figures 14 and 15.
Experimental strain results versus simulation strain results of the bottom rebar of the beam B3 at 11 kN load.
Experimental strain results versus simulation strain results of the bottom rebar of the beam B4 at 16 kN load.
According to Figure 14, the experimental strain curve shows three peak values along the rebar length, with the highest peak strain recorded as 660 µε at the mid-span. The simulated strain curve shows five peak strain values, with the highest peak value of 507 µε. The experimental peaks may be due to microscale disbands of fibre and the rebar. The positions of three out of five peaks of the simulation curve, including the peak at mid-span, are in close agreement with the experimental results. In general, the experimental and simulation strain patterns are in considerable agreement. All the peaks can be visualised between 0.5 m am 0.9 m along the rebar length for both curves.
Figure 15 shows the highest experimental peak strain recorded as 766 µε at the mid-span and the highest simulated peak strain as 686 µε. The two curves’ experimental and simulation strain patterns are in good agreement. Higher experimental peak strains than simulated strain results may be due to either microscale fibre debonding from the rebar or micro-cracks at the rebars and concrete interface that cause the fibre to be strained independently, which will lead to higher strain values measured from the fibre optic sensor. Since the recorded maximum rebar strain values for both experiments were significantly less than the 2000 microstrain limit (Elastic deformation limit), the rebars have not reached the yield strain of the steel and have not entered the plastic region under the applied maximum load. Therefore, the beams are in good health at 11 and 16 kN loading levels. The above assumption is based on a design yield stress of 400 MPa and a modulus of elasticity of 200 GPa for steel (Sinaei et al., 2012).
4.3. Possibility of FEA strain data extraction for the training of SHM systems
The distributed strain data from DFOS can drive SHM algorithms to make decisions regarding structural integrity. Nowadays, AI techniques such as deep learning can be used for the same purpose. However, data points in the order of thousands or hundreds of thousands may be required to train these deep learning models since more data for training will increase the model’s accuracy. However, conducting thousands of experiments for data extraction is not time feasible nor economically viable. Nevertheless, FEA models can resolve this since they can be used to extract thousands of distributed data items by changing the model parameters such as loads, loading conditions, boundary conditions and loading rates. In this study, the created finite element model was studied to extract distributed strain data with respect to load variations.
Figures 16 and 17 show the strain variation obtained from FEA simulations of surface (B2) and rebar (B4), respectively, under an increase of load. The dilation angles were kept constant at 36° and 42° for B2 and B4, respectively. Although the simulations were conducted in 20 steps, the strain changes were presented in 10 steps for clarity (see Table 4).
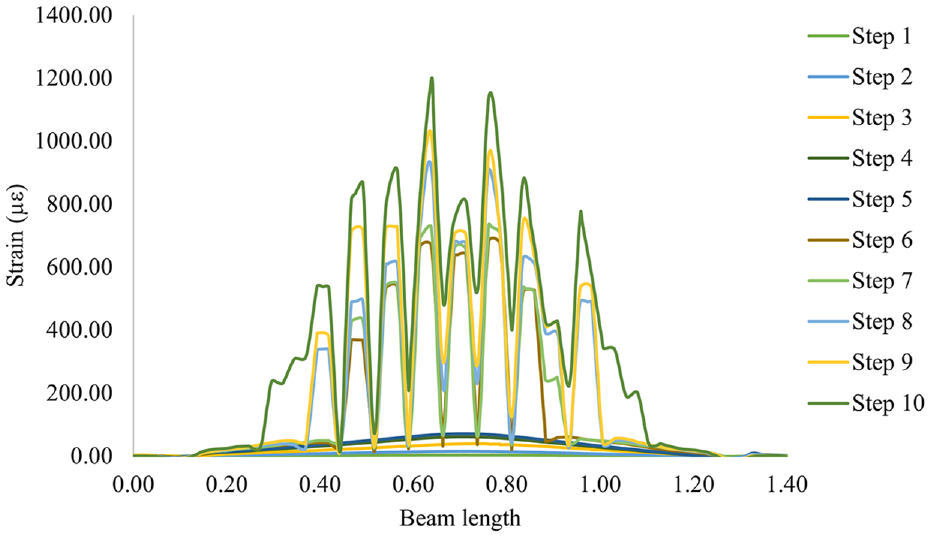
Surface strain against beam length obtained from simulation under increasing load: Beam B2.
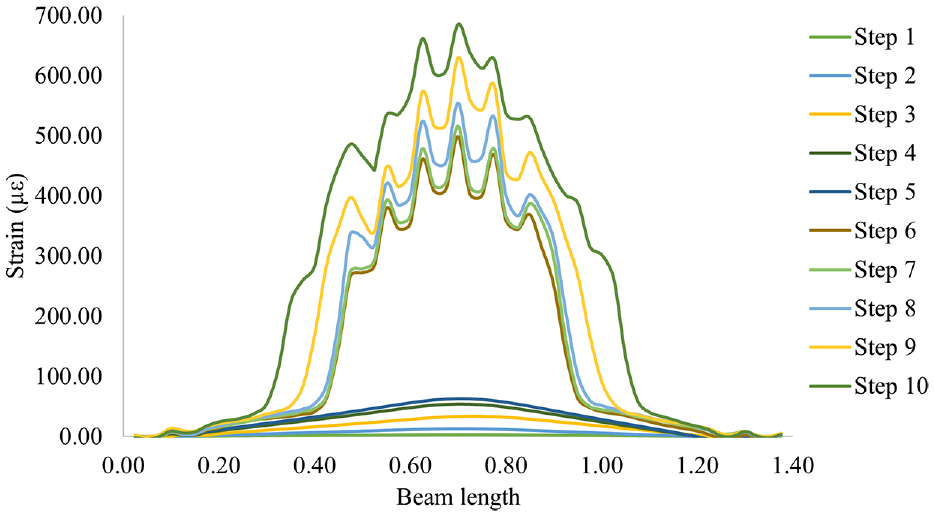
Rebar strain against beam length obtained from simulation under increasing load: Beam B4.
Load with respect to step.

From Figures 16 and 17, it is observed that the strain of both surface and rebar increased with the step increment. However, a significant variation occurred between step 5 and step 6 because the crack initiation commenced after step 5. The corresponding loads are for step 5 and step 6 are 10 and 10.5 kN, respectively.
The proposed experimental and simulation approaches can be extended further by considering different beam geometry, concrete grades, reinforcements and loading conditions to mimic the general usage of reinforced structures. Furthermore, during the modelling, mesh sizes, element types and mesh element types can be changed, and, accordingly, the complexity of the model may increase. Therefore, using an HPC will reduce the time needed for these simulations.
4.4. Use of FEA extracted surface strain data to predict structural health
Deep learning (DL) has increasingly attracted significant attention among researchers in recent years because of its improved ability to detect damage and defects in civil engineering structures. DL can analyse damage in a variety of civil engineering structures using clustering, regression and classification. Artificial Neural Networks (ANNs) are computer systems that mimic the biological learning mechanisms found in human brains. The processing components of an ANN are termed neurons, and they are comparable to biological neurons in that they are highly interconnected (Fukushima and Miyake, 1982). Pattern recognition, function approximation, optimisation and forecasting are typical applications for these networks. The three primary layers in a conventional ANN construction are the input, hidden and output layers. The input layer neurons insert data from the environment, the output layer neurons get the output and the hidden layer neurons are situated between the input and output layers (Hossain et al., 2017).
The application of FEA extracted strain data to train a DL model and DOFS based strain data to classify the rebar strain of the beam was demonstrated in this study using a classification-based DL model. A feedforward neural network with backpropagation learning, which is consisting of an input layer, two hidden layers and an output layer, was employed in this investigation. The ANN has 25 input neurons, 15 neurons in the first hidden layer, 10 neurons in the second hidden layer and 1 output neuron. The FEA based input dataset had 28,099 records, of which 80% were used to train the network, and the remaining 20% were used to test the model. The output layer consists of one node, where the value ‘1’ stands for the 500 µε limit exceeded in the rebar and ‘0’ for the case the 500 µε limit is not exceeded in the rebar. The DL model has been trained to classify the rebar strain using beam surface strain data as an input. The Relu function is utilised as the transfer function between the first three adjacent layers, whereas the sigmoid function is used between the last two adjacent layers. Training accuracy for the trained model was 99.91%, while validation accuracy was 99.85%. Figure 18 shows the plot of model accuracy.
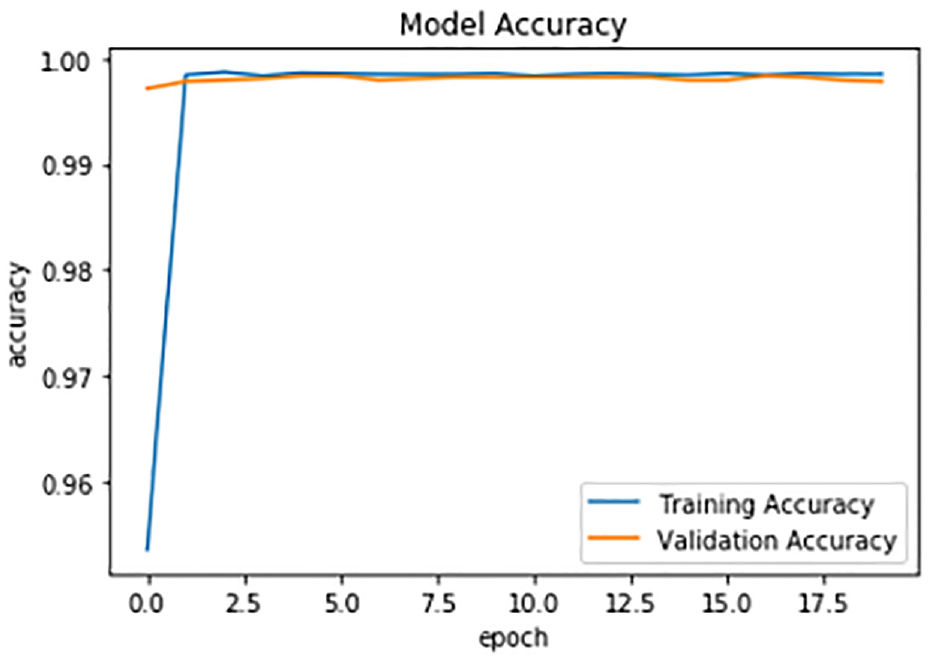
DL model accuracy.
Processed experimental strain data were used to test the predictions of the developed DL model. The results are presented in Table 5. It can be observed that the developed DL model can classify the rebar strain correctly.
Comparison of experimental outcome from DOFS versus predicted the outcome of the DL model.
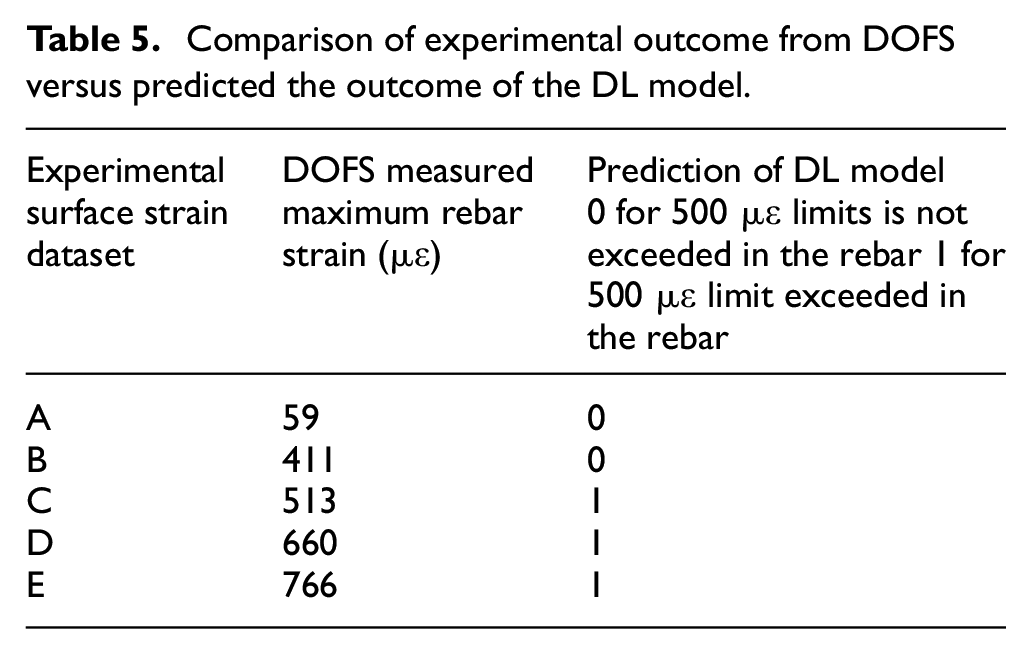
The importance of this DL model is that it uses surface strain data to classify the rebar strain and can be done without measuring the rebar strain physically. This study has provided fundamental insight into the structural response of internal elements of a concrete beam and demonstrated how surface strain data could be used to classify rebar strain measurements to predict structural health ultimately. Although the DOFS can be mounted on rebars in laboratory conditions, it is challenging to place a sensor along with the rebar during an industrial application due to the harsh environmental conditions. Therefore, the authors believe that the proposed method (Experimental procedure, finite element modelling and data generation and DL model for predictions) will be helpful to predict the structural health (by rebar strain predictions) in real-life existing structures via surface strain measurements by DOFS. Furthermore, it is planned to conduct a series of experiments to validate FEA models and develop a framework for DL structural health prediction models.
5. Conclusion
Through a series of laboratory experiments and FEA simulations, the authors compared the strain readings from DOFS with respect to FEA strain readings to monitor and identify strain patterns in RC beams. Due to surface crack formation, high peak strain measurements were observed in data streams. The strain pattern and positions of peak strains in the bottom surface of the concrete beam and the bottom rebar were found to be in admissible agreement with the FEA results. As a consequence, strain data mining is possible with CDP-based FEA. The possibility of using FEA based surface strain data to train a DL model was assessed, and inserting experimental strain data made predictions. The classification-based DL model performed well with a training accuracy of 99.91%. However, more relevant experimental and FEA studies are warranted to develop complex and reliable SHM systems for civil infrastructures.
Footnotes
Acknowledgements
The first author is indebted to the University of Southern Queensland Australia for offering an international PhD fees scholarship. Furthermore, the first author acknowledged the paid leaves from the Uva Wellassa University of Sri Lanka to carry out this work. Moreover, the authors are indebted to Ms Julie Martyn (Professional Member, Institute of Professional Editors) for proofreading support.
Declaration of conflicting interests
The author(s) declared no potential conflicts of interest with respect to the research, authorship, and/or publication of this article.
Funding
The author(s) received no financial support for the research, authorship, and/or publication of this article.