
Abstract
Establishment of an analytical technique that considers nonlinear piezoelectricity, nonlinear damping, and the connections to the self-powered synchronized switch circuit represents a challenging but practical issue in the development of piezoelectric vibration energy harvesters. The two-way coupled analysis method, which combines numerical software with a circuit simulator, can simulate the performance of the harvester, but it imposes a high computational load. We develop a numerical analysis technique that is more readily implemented to allow us to produce accurate predictions of the output power, displacement, and frequency response characteristics of this harvester with the switch circuit. First, we derive the electromechanical equation required for the miniature harvester, and we then determine the parameters in this equation using the harmonic balance method. Finally, the governing equation coupling the piezoelectric vibration energy harvester with the self-powered synchronized switch circuit is simplified, taking the form of a quartic equation with respect to the displacement. The simulation replicated a reduction in the displacement at higher resistive loads, wider variations in the resonance frequency, and the nonlinear stiffness softening characteristics that were observed experimentally. This paper provides a practical method for predicting the performance of the nonlinear piezoelectric vibration energy harvester with the synchronized switch circuit.
Keywords
1. Introduction
The piezoelectric vibration energy harvester (PVEH) is a promising power source for battery-less wireless sensor nodes because of its high power density and high adaptability to miniaturization. One major technical issue in the attempt to reduce the intervals between sensing data transmissions is maximization of the PVEH’s output power while maintaining miniaturization. To increase the efficiency of the PVEH’s circuit, approaches called synchronized switch harvesting on inductor (SSHI) or on a bias-flip circuit (Guyomar et al., 2005), which uses an active switch and an inductor, have been proposed. The parallel (Guyomar et al., 2005) and series (Badel et al., 2006) SSHI circuits flipped and magnified the piezoelectric voltage by switching to the inductor at voltages around the maximum/minimum piezoelectric voltage, thereby increasing the device’s harvesting power. The synchronous electric charge extraction (SECE) circuit (Lefeuvre et al., 2005) can reduce the load dependence of the output power by temporarily storing harvested energy in the inductor. Subsequently, the self-powered switching technique (Richard et al., 2007), which uses a proportion of the harvested energy to control the switch, was developed. Based on this technique, the self-powered SSHI (Lallart and Guyomar, 2008; Liang and Liao, 2012) and SECE (Zhao and Yang, 2015) were proposed. For analysis of these circuits, Lallart et al. (2012) and Chen et al. (2019) indicated the importance of switching delays induced by nonnegligible parasitic components in the discrete circuits. In addition to use of these self-powered switch circuits, use of a microcontroller unit with low energy consumption to control the switch represents another promising approach (Hara et al., 2019, 2020).
Unlike the simple waveform for a harvesting circuit consisting of a single resistive load, the piezoelectric voltage waveform for the switch circuits includes nonlinear (or precipitous) changes caused by switching, which makes it difficult to analyze the electromechanically coupled equation required. An analysis assuming the tip velocity of the PVEH and the external force are assumed to be in-phase (Badel et al., 2006; Guyomar et al., 2005; Lefeuvre et al., 2005) provides an effective methodology to determine the output power and the displacement at resonance, although the PVEH’s frequency response characteristics cannot be obtained because the assumption above does not hold outside the resonance. Shu et al. (2007) derived an analytical solution for the frequency response curves of a PVEH connected to SSHI circuits. They reported that the SSHI can only increase the output power significantly when the value of ke2/ζm is much less than 1, where ke and ζm are the effective electromechanical coupling coefficient and the mechanical damping ratio, respectively; otherwise, the SSHI cannot boost output power because the increased piezoelectric coupling force produced by the SSHI reduces the displacement and thus reduces the output power. To overcome this limitation of the SSHI, Makihara et al. (2015) and Makihara and Asahina (2017) proposed an intermittent switching technique to increase the output power by easing the increased piezoelectric coupling force. Morel et al. (2018) proposed the N-SECE technique with use of multiple and regenerative (or intermittent) switching to broaden the frequency bandwidth of a PVEH with a high electromechanical coupling coefficient. Similarly, the tunable (Lefeuvre et al., 2017) and frequency-tuning (Brenes et al., 2020a) SECE techniques can achieve wide frequency bands by using highly coupled states. A thorough review of the derived techniques can be found in the literature (Brenes et al., 2020b).
The electromechanically coupled equation based on linear piezoelectricity is widely accepted for use in analysis of the displacement and piezoelectric voltage characteristics of a PVEH connected to the aforementioned switch circuits. However, recent studies have shown that the material nonlinearities of the piezoelectric elements embedded in the structure should be included when modeling PVEHs, actuators, or piezoelectric attenuation devices to predict the frequency response characteristics accurately. Nonlinear piezoelectricity appears when high stress or strain is applied to piezoelectric elements. The nonlinear piezoelectricity primarily causes nonlinear stiffness softening, which affects the peak frequency, peak magnitude, and shape of the frequency response curve significantly, even when the displacement of the PVEH is small enough to ensure geometric linearity (Yang and Upadrashta, 2016). Through consideration of the nonlinearity in the relationship between the displacement and the excitation voltage of the piezoelectric actuator, Wagner and Hagedorn (2002) formulated the nonlinear enthalpy density and the nonlinear constitutive equation to derive the equation of motion for the actuator. The nonlinear terms of the enthalpy density were expressed as a polynomial form with respect to the strain. Mahmoodi et al. (2008) considered both the nonlinear piezoelectricity and the geometric nonlinearity when modeling the piezoelectrically actuated microcantilever sensor. By plotting a backbone curve that traced the peak values of the frequency response curves at different excitation levels, they showed that the degree of stiffness softening caused by the nonlinear piezoelectricity exceeded the degree of stiffness hardening caused by the geometric nonlinearity within the specific excitation level. Based on the polynomial model proposed by Wagner and Hagedorn (2002), an analysis of a PVEH connected to a single resistive load circuit (Meesala and Hajj, 2018; Stanton et al., 2010a, 2012), a finite element simulation of a simple unimorph PVEH connected to an SSHI circuit (Hegendörfer et al., 2022), and an analysis of a piezoelectric attenuation device connected to an autonomous SSD circuit (Asanuma and Komatsuzaki, 2020) were reported. In another viable model of nonlinear piezoelectricity, Goldschmidtboeing et al. (2011) considered the ferroelastic hysteresis phenomena observed within the strain-stress relationship of piezoelectric materials and derived the equation of motion by incorporating the hysteresis into the model. Leadenham and Erturk (2015) formulated the nonlinear enthalpy density based on the work of Goldschmidtboeing et al. (2011) and then derived a distributed parameter model for a piezoelectric actuator and a PVEH. Unlike the polynomial model proposed by Wagner and Hagedorn (2002), the nonlinear terms of the enthalpy density based on the ferroelastic hysteresis are dependent on the absolute value (or the signum function) of the strain, which is characterized by the hysteresis loop. Recent studies of a multimodal PVEH (Machado et al., 2020), a PVEH with segmented electrodes (Hu et al., 2021) connected to a single resistive circuit, and a PVEH connected to a diode bridge rectifier circuit (Leadenham and Erturk, 2020) validated the model proposed by Leadenham and Erturk (2015) by replicating the experimental results well. In addition to nonlinear stiffness softening, some studies also reported the importance of including nonlinear damping in the modeling process to explain the experimentally observed result that the displacement magnitude decreased when the excitation level increased. Several studies proposed models of nonlinear damping caused by a hysteresis damping (Goldschmidtboeing et al., 2011), nonconservative relations in nonlinear piezoelectricity (Stanton et al., 2012), or by structural energy dissipation (Asanuma and Komatsuzaki, 2020; Stanton et al., 2010b; Yang and Upadrashta, 2016). As methodologies to determine the nonlinear coefficients numerically, the harmonic balance method (Ito et al., 2020; Leadenham and Erturk, 2015; Stanton et al., 2010a; Wagner and Hagedorn, 2002), the method of multiple scales (Meesala and Hajj, 2018; Stanton et al., 2012), and the Bayesian updating technique (Poblete et al., 2021) were used. As noted by Shivashankar and Kandagal (2019) when determining the nonlinear coefficients, the applied nonlinear model should also be able to replicate the experimental results for the short-circuited frequency response curves of the displacement, in which the piezoelectric coupling force vanishes and thus only the nonlinear elastic terms affect the frequency response. In accordance with this observation, Asanuma (2021) reported that the model by Leadenham and Erturk (2015) provided a better fit to the experimental results for the frequency response curves of the piezoelectric attenuation device, while the model by Wagner and Hagedorn (2002) exhibited jumping phenomena caused by excessively strong nonlinear elastic terms that were not observed in the experiments.
The nonlinear piezoelectricity, the nonlinear damping behavior, the nonlinear change in the piezoelectric voltage caused by switching, the switching delay, and/or the phase difference between the displacement of the PVEH and the external force should be considered during modeling to provide accurate predictions of the output power, displacement, and frequency response characteristics of the PVEH when connected to the self-powered synchronized switch circuit. The two-way coupled analysis method, which combines numerical software with a circuit simulator (Asanuma et al., 2018, 2019), can simulate the real performance of a PVEH connected to synchronized switch circuits. However, use of the two-way coupled analysis involves a high computational load. In this study, we develop a more readily implemented numerical analysis technique that allows us to predict the output power, displacement, and frequency response characteristics of a PVEH when connected to a synchronized switch circuit. First, we derive the electromechanical equation for a miniature PVEH with a tip mass while considering both the nonlinear piezoelectricity and the structural discontinuity. Then, we determine the parameters for this equation using the harmonic balance method. Finally, we derive a governing equation to couple the harvester with the self-powered synchronized switch circuit and then verify that the solution to the governing equation replicates the experimental results.
2. PVEH structure and model
2.1. Modeling a miniature PVEH
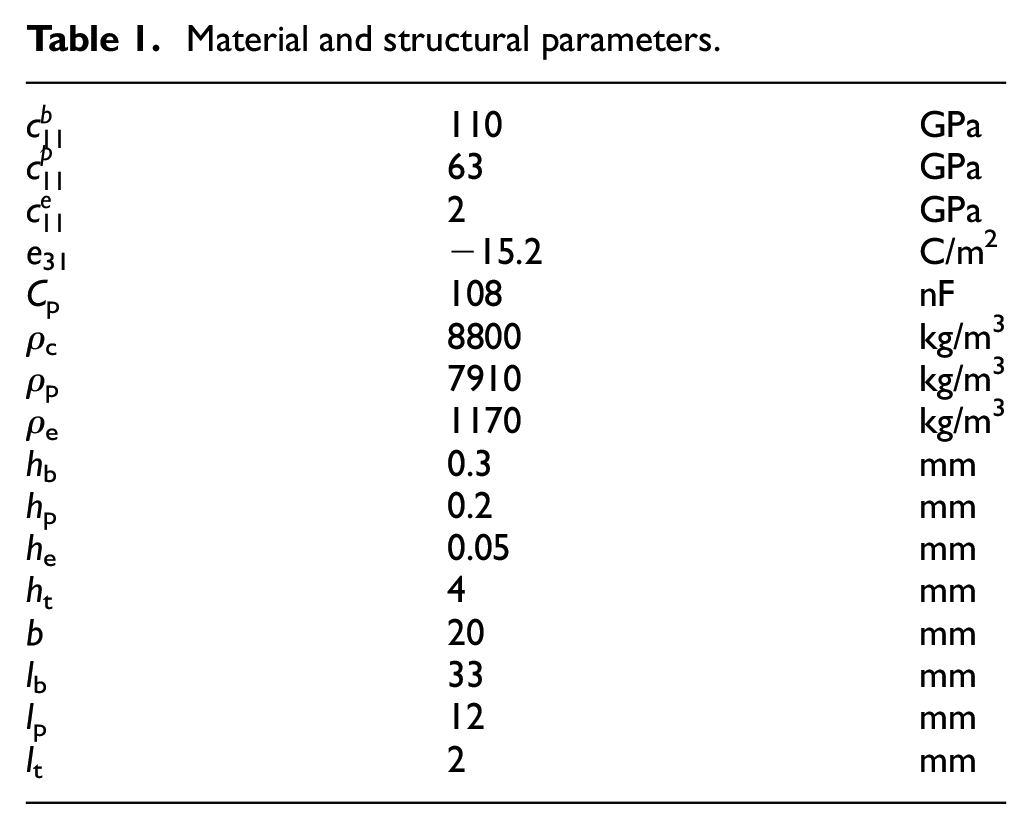
We derive the electromechanical equation for the PVEH based on Hamilton’s principle and a Galerkin method. Figure 1 shows the structure of the miniature PVEH with a tip mass that is considered in this study. The PVEH consists of a beam (with a phosphor bronze strip for a spring), two tip masses (tough pitch copper), and two thin piezoelectric materials (lead zirconate titanate (PZT)-based soft ceramic C-93, Fuji Ceramics, Fujinomiya, Japan) that were bonded manually using epoxy adhesive on both sides. For simplicity, the beam and the tip masses were assumed to be made from the same copper alloy, thus meaning that they had the same mass density. The x, y, and z spatial axes were aligned with the length, width, and height directions of the PVEH, respectively. The terminals of the piezoelectric materials were connected in parallel. In the figure, b is the width of the PVEH, lb is the length of the gap between the fixed edge of the PVEH and the left-side edge of the tip mass, lt is half the length of the tip mass, lp is the length of the piezoelectric material layer and the epoxy adhesive layer, and ht, hp, he, and hb are the heights of the single tip mass, the piezoelectric material, the epoxy adhesive, and the beam, respectively. In a miniature harvester structure, the point mass approximation may not be applicable if the length of the tip mass is nonnegligible when compared with the beam length; therefore, in a manner similar to previous studies (Mak et al., 2011; Wang et al., 2020), this study considers a tip mass dimension to determine the kinetic energy. Additionally, this study incorporates an epoxy adhesive layer during modeling of the PVEH because the epoxy adhesive layer thickness increases the piezoelectric coupling coefficient when 2he is nonnegligible in comparison to hb + hp (Asanuma and Komatsuzaki, 2020). wext(x,t) and w(x,t) are the absolute displacement imposed externally by the shaker and the relative displacement from the stationary condition at position x on the beam, respectively. The material and structural parameters used in this work are summarized in Table 1. The material parameters of the custom-ordered piezoelectric material were evaluated based on the inspection report measurements provided by the manufacturer.
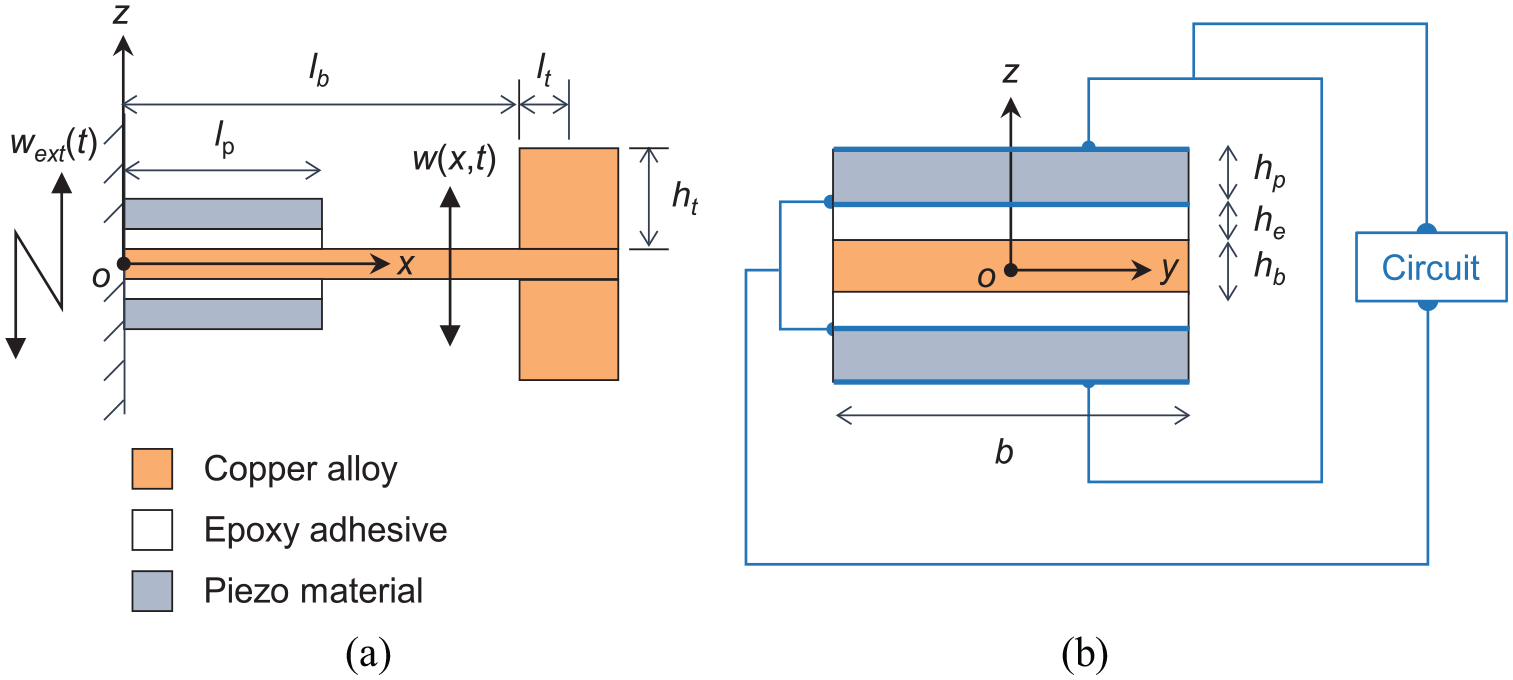
(a) Structure of the miniature piezoelectric vibration energy harvester (PVEH) and (b) sectional view of the energy harvesting components.
Material and structural parameters.
The kinetic energy T of the PVEH system can be obtained from the following equation.
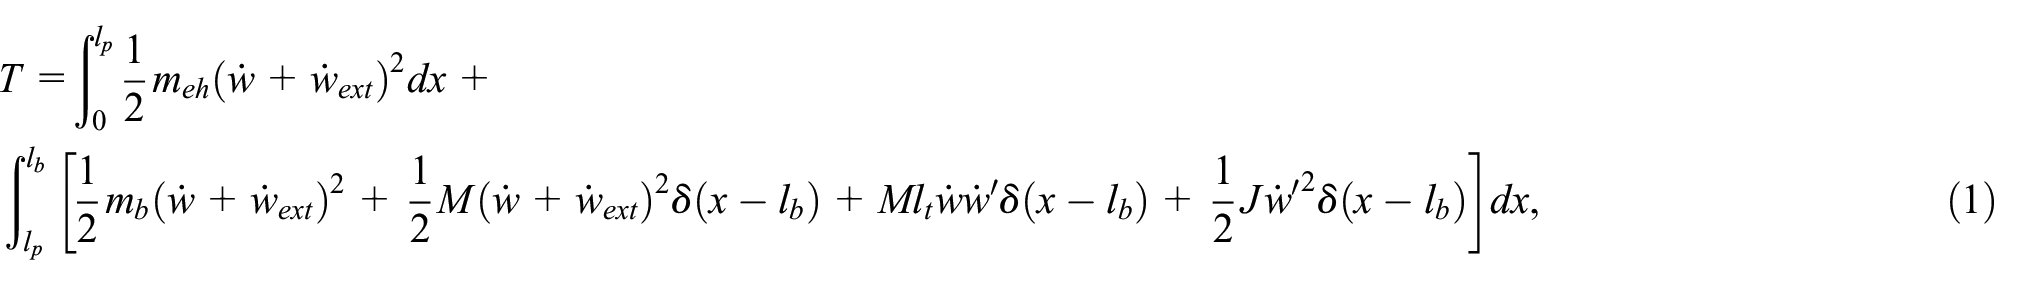
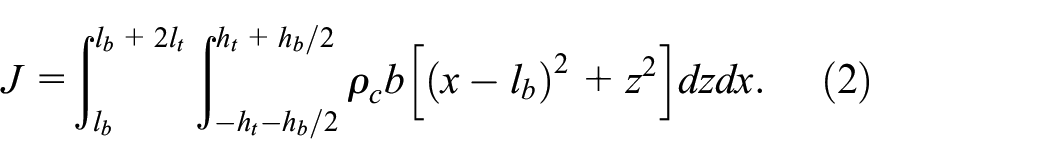
where meh and mb are mass per unit length of the energy harvesting components and the bare beam, respectively. M and J are the total tip mass and the mass’s inertia moment around the free end of the beam, respectively, δ is the Dirac delta function, and the dot and the prime above w and wext represent the time-derivative and the partial differential
The displacement magnitude of the PVEH used in this study is within the range of the geometric linearity, and we thus assume that the strain S1 along the x-axis can be approximated using
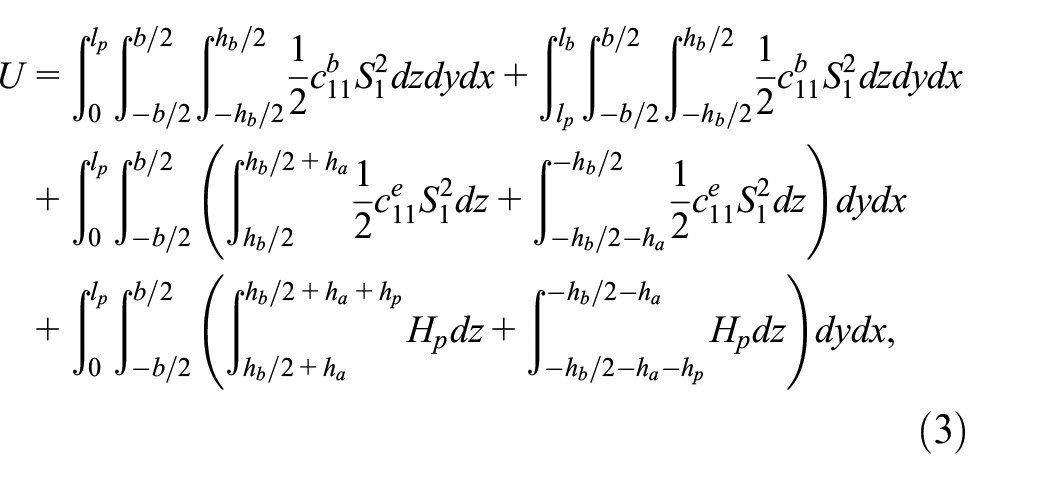
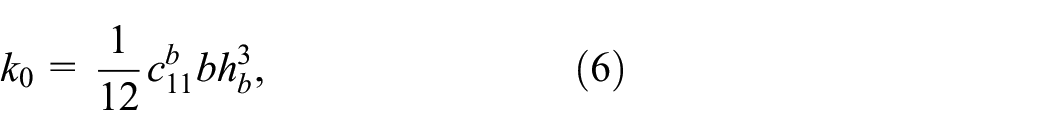
where
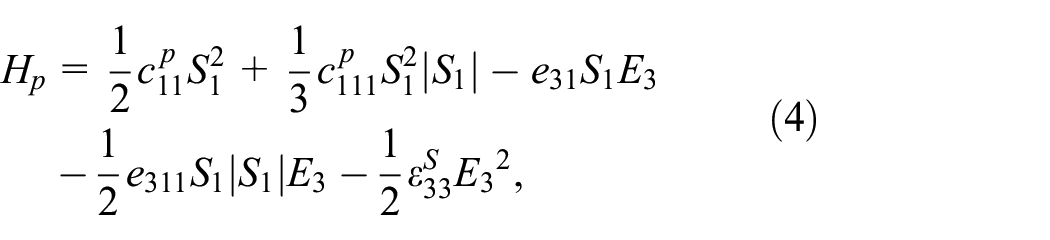
where
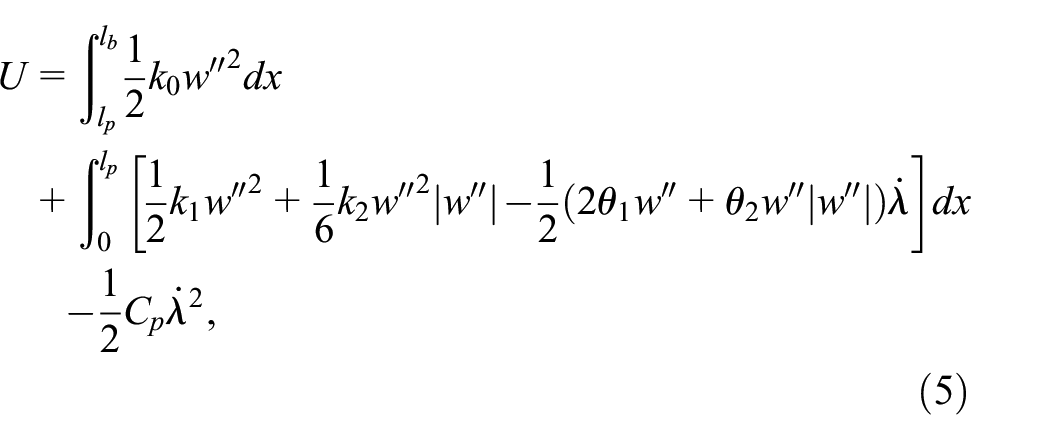
where k0, k1, k2, θ1, and θ2 are all constant coefficients, λ(t) is the flux linkage, which is defined as a time-integral of the piezoelectric voltage v(t), and Cp is the capacitance of the parallel-connected piezoelectric materials. The five constant coefficients and Cp are written as follows:

By considering the variables with respect to w and λ in equations (1) and (5), the variation in the Lagrangian L (=T−U) of the system can be expressed as (Leadenham and Erturk, 2015; Stanton et al., 2012):

In this study, the variation in the work by the nonconservative term is written as:
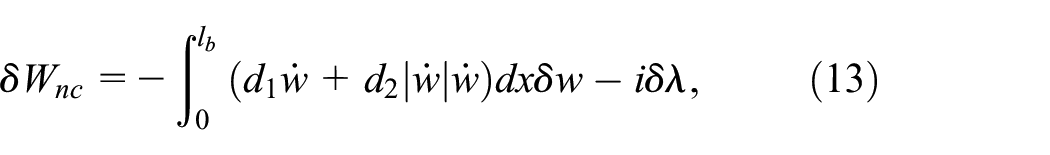
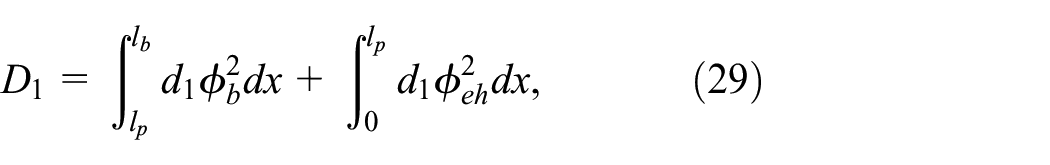
where d1 and d2 are the linear and nonlinear damping coefficients, respectively, and i is the electric current flowing to the circuit. A quadratic damping term with respect to the velocity is introduced in this study to replicate the previously reported experimental results in which the growth rate of the displacement decreased when the external acceleration increased (Asanuma and Komatsuzaki, 2020). The nonlinear damping can be attributed to an air-drag force acting on an elongated cantilever structure (Chen et al., 2017). Based on Hamilton’s principle (Leadenham and Erturk, 2015), δL and δWnc satisfy the following relational equation between the given times t1 and t2.
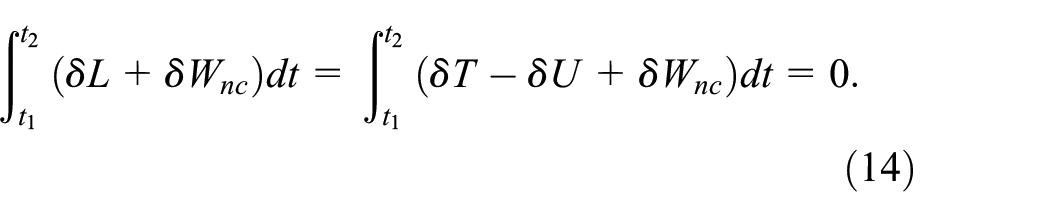
By solving equation (14) using the integration by parts approach, the electromechanical equations of the system can be derived and are expressed as follows:
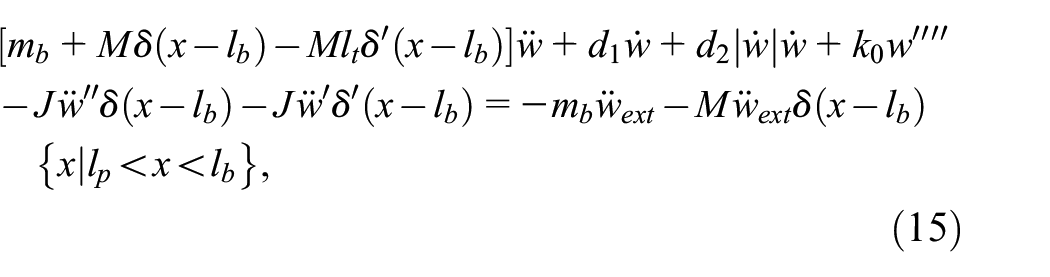
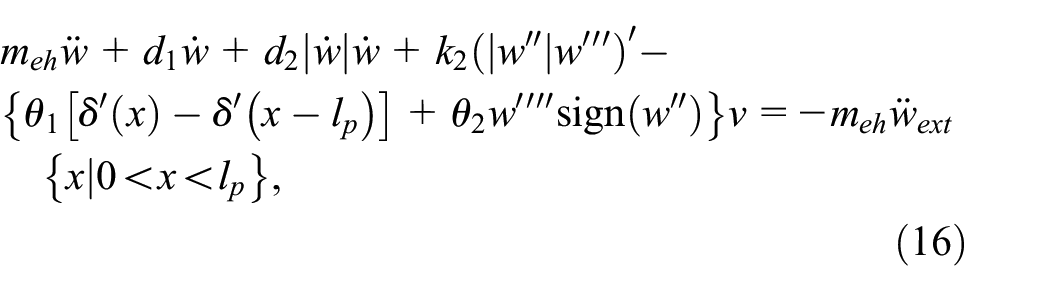
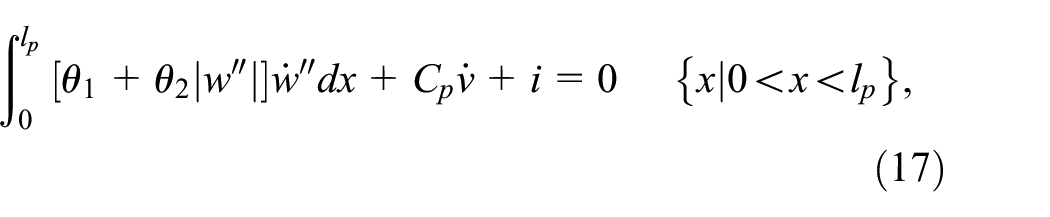
where equations (15) and (16) represent the equations of motion for the bare beam (lp < x < lb) and the energy harvesting components (0 < x < lp) of the PVEH, respectively, and equation (17) indicates the conservation law of electric current for the piezoelectric materials, where the sign is the signum function.
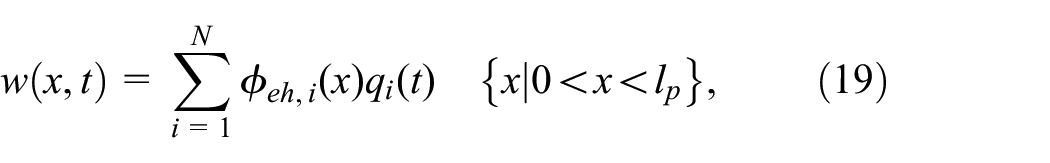
This study uses a discretized w(x,t) to simplify the electromechanical equation and considers a stiffness difference between the bare beam and the energy harvesting components. Therefore, w(x,t) is divided at the boundary between the bare beam and the energy harvesting components, and w(x,t) can be expanded as follows using a Galerkin method (Meesala and Hajj, 2018).

where


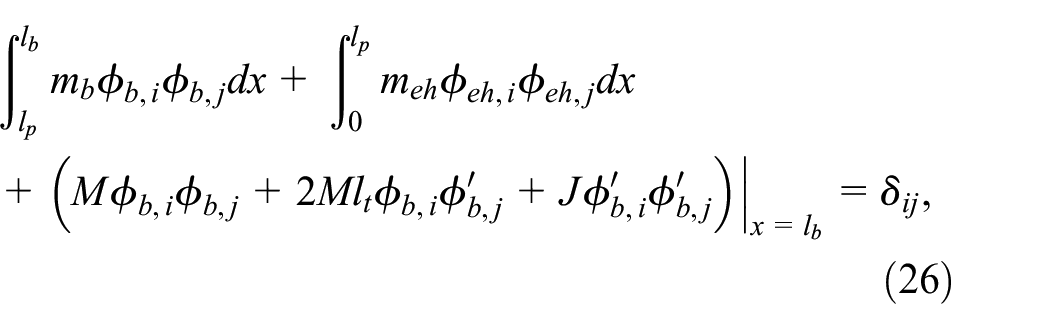
By substituting equations (18) and (19) into equations (20) and (21), respectively, and by using the equation
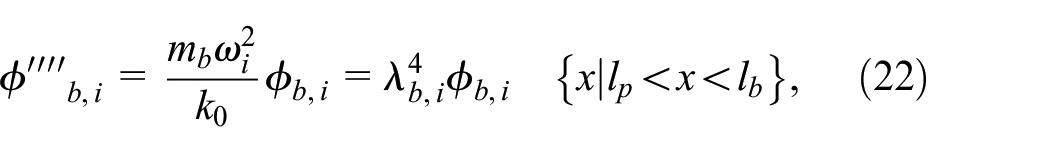
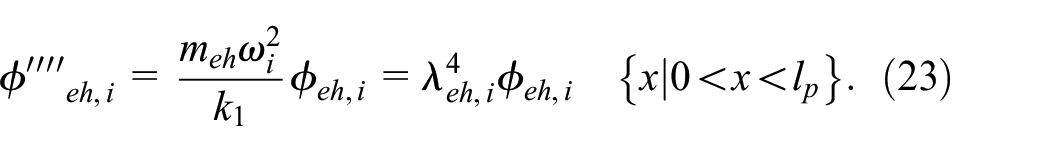
As a general solution,

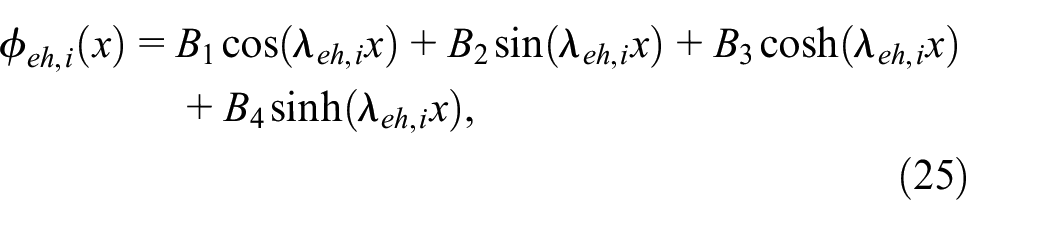
where A1–A4, B1–B4,
where
Next, we combine the equations of motion given as equations (15) and (16) into a simpler single equation. The PVEH considered in this study is designed to generate power from the first vibrational mode. Hereafter, to simplify the notation, we omit the subscript mode number i from
Similarly, by considering the first vibrational mode only, equation (17) can be re-expressed as follows:

The parameters above are expressed as follows:
2.2. Determination of parameters
Based on the approaches of previous studies (Ito et al., 2020; Leadenham and Erturk, 2015; Shivashankar and Kandagal, 2019), the harmonic balance method (HBM) was used to determine the parameters of equations (27) and (28) systematically. Following the important observations reported in previous studies (Asanuma, 2021; Shivashankar and Kandagal, 2019), the peak values of the frequency response characteristics for both short and open circuits were used to determine the parameters. q(t) and v(t) are assumed to be expressed using the following trigonometric functions under the harmonic excitation


where ω is the angular frequency of the external excitation, q0–q2 and v0–v2 are the amplitudes, which have relationships based on the addition theorem of the trigonometric function (q1 = q0cosμ, q2 = q0sinμ, v1 = v0cosν, and v2 = v0sinν), and μ and ν are the corresponding phase differences with respect to

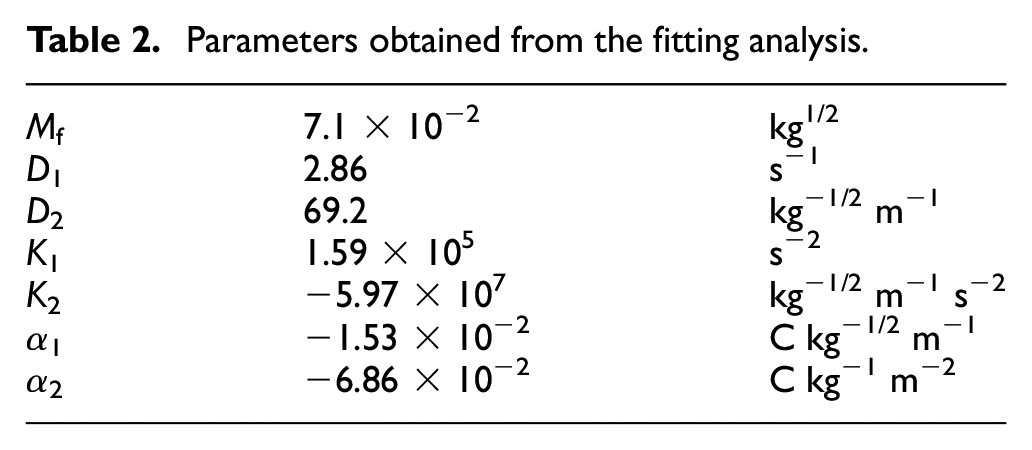
The simultaneous equations for the short circuit case can be derived by setting v1 and v2 to zero in equations (38) and (39). The parameters D1, D2, K2, and α2 were obtained numerically by fitting the simultaneous equation to the peak values of the experimentally-obtained frequency response curves. We used MATLAB® (MathWorks) and its nonlinear least-squares solver to perform the fitting analysis (Asanuma, 2021). The parameters obtained from this analysis are listed in Table 2. Figure 2 shows the simulated (solid lines) and experimental (dots) results for the typical frequency response curves for the displacement and the open-circuit voltage voc at four different acceleration magnitudes (0.5, 1, 3, and 5 m/s2), along with the resonance frequency fr, the displacement, and the open-circuit voltage at resonance versus the acceleration magnitudes. Increments in the frequency of 0.1 Hz were used in the frequency response curves around the resonance. Note that, as shown in Figure 2(e), the simulation results obtained for the short and open circuit cases were indistinguishable because the displacement magnitude at resonance was identical in the two cases. Overall, as shown in Figure 2, the simulation replicated the nonlinear stiffness softening behavior, the location of the resonance frequencies, and the magnitudes of the displacements and the voltages obtained in the experiments.
Parameters obtained from the fitting analysis.
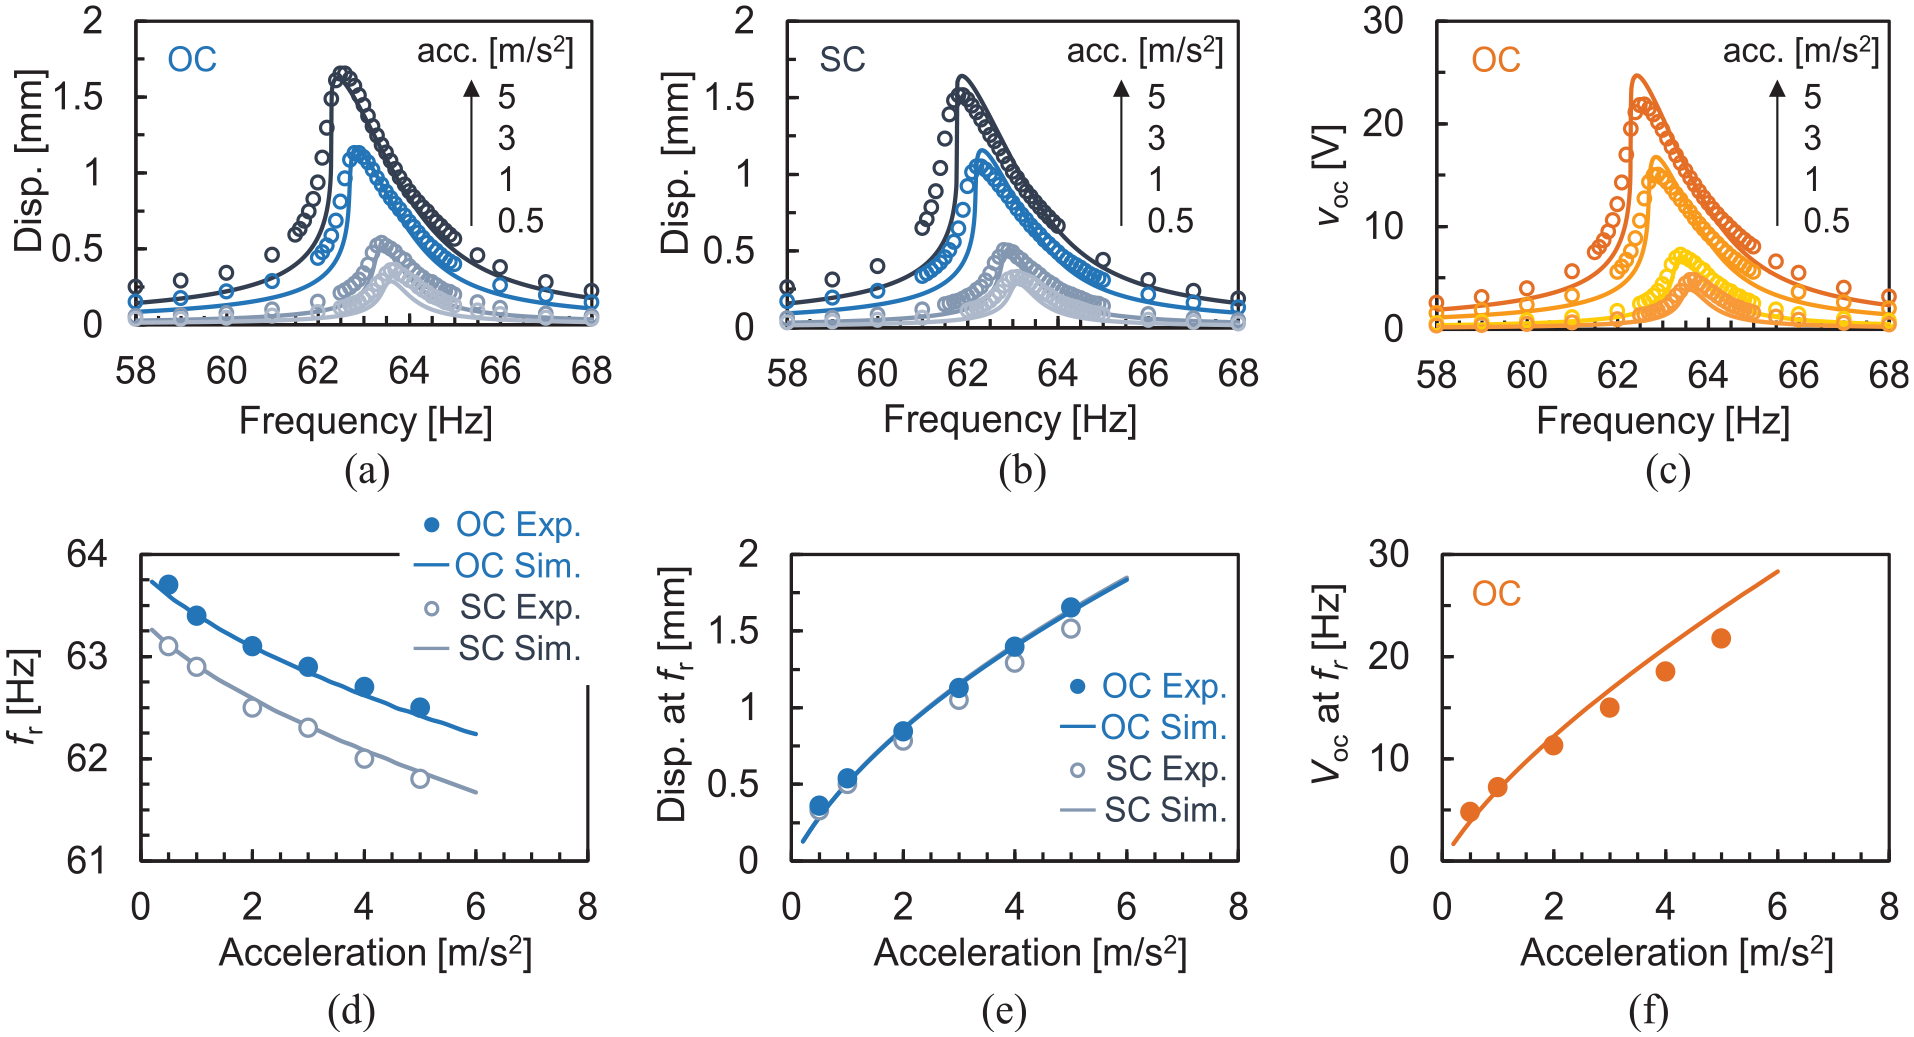
Simulated (solid lines) and experimental (dots) results for the typical frequency response curves of the displacements for the (a) open (OC) and (b) short (SC) circuits and for (c) the open-circuit voltage voc at four different acceleration magnitudes (0.5, 1, 2, 3, and 5 m/s2), and (d) the resonance frequency fr, (e) the displacement, and (f) the open-circuit voltage at fr versus the acceleration magnitudes.
2.3. Analysis coupled with circuits
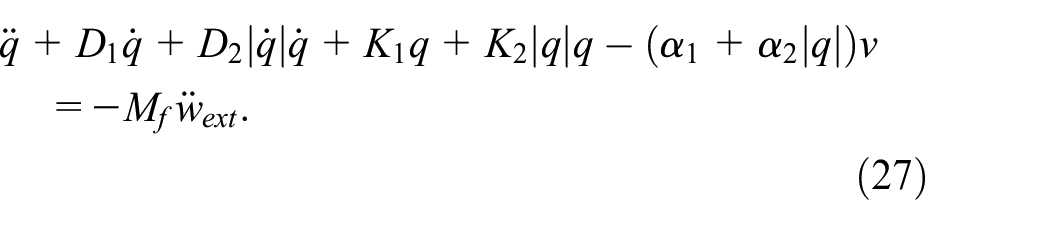
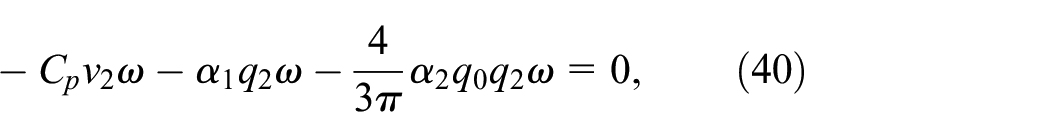
The magnitude of q(t) was at most of the order of 10−4 within the excitation level range used in this study, and the nonlinear electromechanical coupling of the designed harvester, where the piezoelectric materials did not cover the beam fully, was low. Therefore, the magnitude of the term α2|q| in equations (27) and (28) was negligibly small when compared with the magnitude of α1. Accordingly, these two equations were simplified as follows:
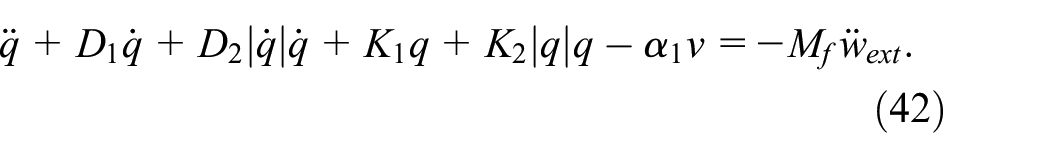

Figure 3 shows the standard (STD) circuit and the self-powered parallel SSHI (SP-SSHI) circuit (Richard et al., 2007) considered in this work. The STD and SP-SSHI were selected as classical but widely accepted circuits in the community working on the PVEHs. In addition, within this study using a low-coupled PVEH, the SP-SSHI is the best candidate in terms of power increase because the SECE or series SSHI may create a larger piezoelectric coupling (or damping) force and thus decrease the output power (Zhao and Yang, 2017). The STD circuit consists of a full bridge diode rectifier (BAT 48, STMicroelectronics), a smoothing capacitor Cs (10 μF), and a resistive load RL to evaluate the output power. vDC is the voltage across the RL-Cs parallel circuit. The SP-SSHI circuit uses a self-powered switch circuit and an inductor Li (47 mH) with an intrinsic resistor r, which were connected in parallel to the components that were used in the STD circuit. The detailed workflow for the self-powered switch can be found in the literature (Liang and Liao, 2012), and thus the lengthy explanation of this workflow is omitted here for brevity. The self-powered switch circuit was built using pnp (Tr1 and Tr4; NSS1C200L, onsemi) and npn (Tr2 and Tr3; MMBT8099LT1G, onsemi) bipolar transistors, Schottky diodes (BAT 48, STMicroelectronics), base resistors denoted by rb (3.3 kΩ), and envelope-detecting sub-circuits consisting of a resistor red (300 kΩ) and a capacitor Ced (1 nF). When compared with the corresponding integrated circuits (Li et al., 2022), the self-powered switch constructed from discrete circuits can be designed easily and is resistant to high voltages/currents. However, the switching delay, which is caused by parasitic resistors and capacitors among the discrete circuit components, affects the harvester’s performance and increases the complexity of the coupled analysis.
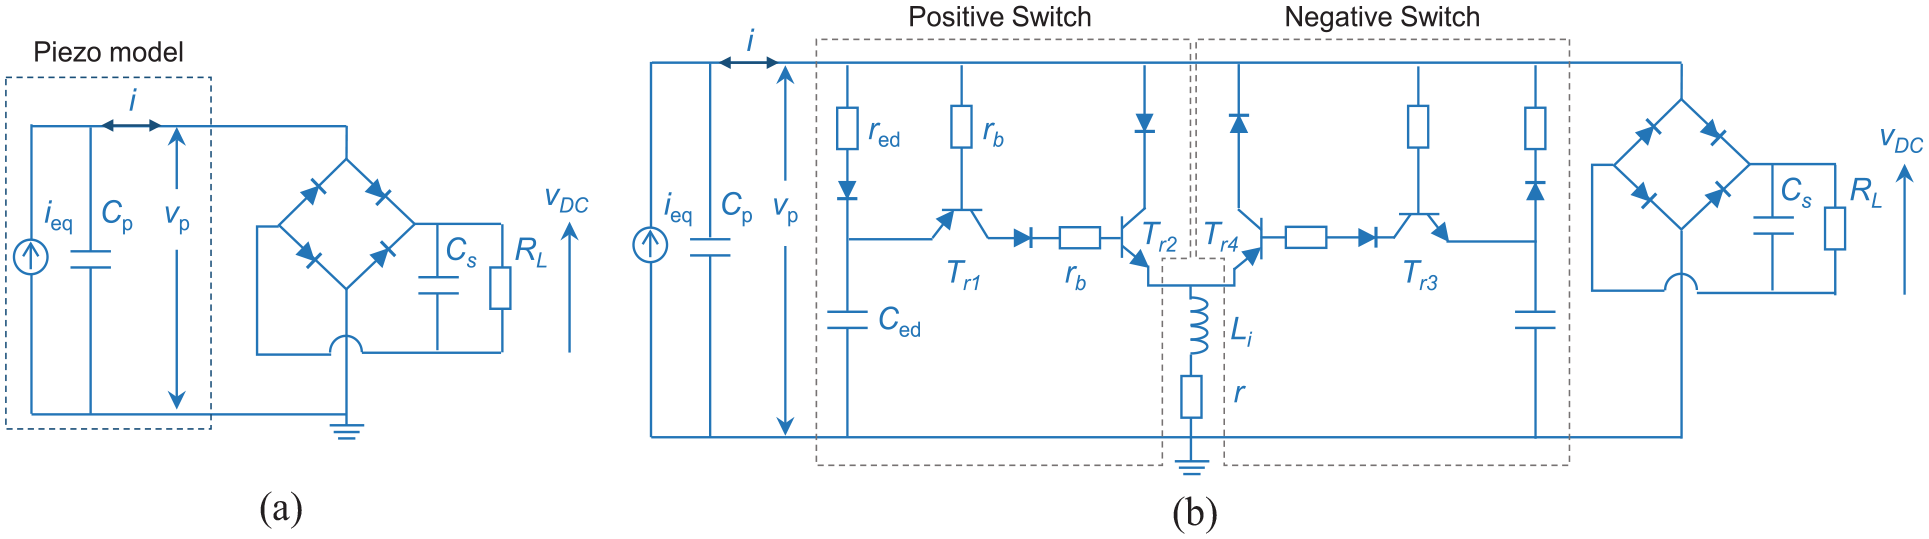
(a) Standard (STD) circuit and (b) self-powered parallel SSHI (SP-SSHI) circuit (Richard et al., 2007).
Next, we consider the coupled analysis between the nonlinear model of the PVEH and the STD and SP-SSHI circuits based on use of the analytical technique developed for the linear model of the PVEH (Shu et al., 2007; Zhang et al., 2021). Figure 4 shows schematics of typical waveforms for the modal coordinate q(t) and the piezoelectric voltage v(t) for (a) the STD circuit and (b) the SP-SSHI circuit. This study considers a specific waveform for the switch circuit to realize more accurate prediction of the frequency response characteristics when compared with the results obtained from previous studies, in which the waveform was approximated by using the signum function (Asanuma, 2021; Asanuma and Yamauchi, 2022).
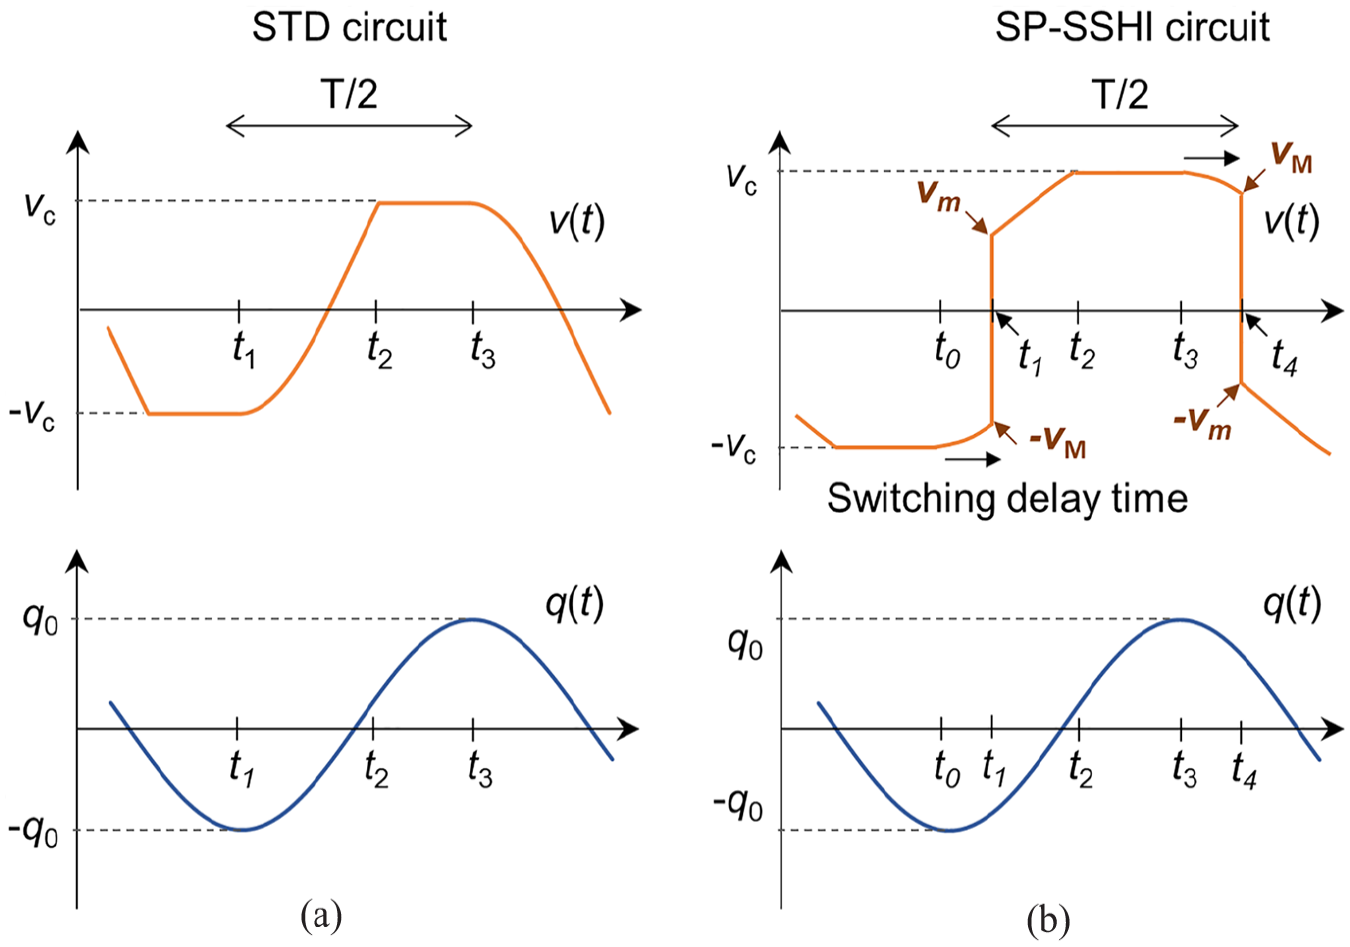
Schematics of waveforms for the modal coordinate q(t) and the piezoelectric voltage v(t) for (a) the STD circuit and (b) the SP-SSHI circuit.
First, we analyze the frequency response characteristics of the STD circuit by referring to the waveforms shown in Figure 4(a), and we then explain the corresponding analysis of the SP-SSHI circuit characteristics in a similar manner. When an external excitation, which is expressed as a sinusoidal function here, is applied to the PVEH, the terms


where F0 and q0 are the amplitudes, ω is the angular frequency of the external excitation, and τ is the phase difference with respect to the external excitation. As shown in Figure 4(a), the time interval between t1 and t3 is equal to one-half of the vibrational period T of q, during which q varies from a minimum (q(t1) = −q0) to a maximum (q(t3) = q0). The electric current outside the piezoelectric materials remains at zero when |v(t)| is less than vc. When the piezoelectric voltage exceeds vc at time t2, the electric current begins to flow through the diode rectifier into the RL-Cs parallel circuit. In reality, vc is equal to the sum of vDC and 2vd, where vd is the voltage drop across a single diode. To simplify the numerical analysis, it is assumed in this study that vDC is much larger than 2vd and is thus equal to vc. Additionally, when the capacitance of the smoothing capacitor is large enough to allow the ripple of vDC to be ignored and the time constant of RLCs is much greater than the vibrational period of q, vDC is assumed to remain constant. Based on these assumptions, the electrical current i outside the piezoelectric materials satisfies the following equation (Shu et al., 2007):
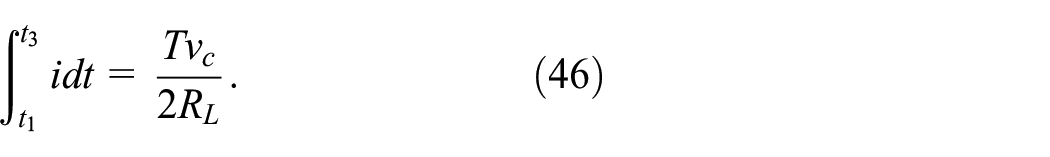
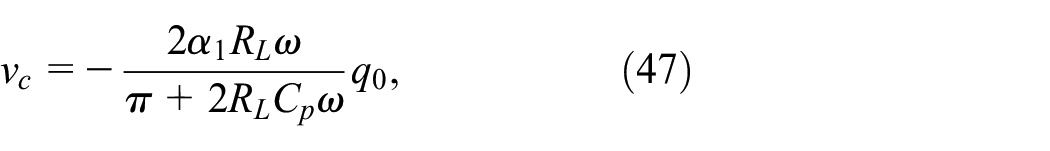
By solving equation (46) with reference to the waveforms shown in Figure 4(a), the following relational equation is derived with respect to vc:
where T/2 was rewritten as π/ω. Subsequently, we consider the energy balance of the system over the half vibration period from t1 to t3. By integrating over the half vibrational period after multiplying both sides of equation (42) by
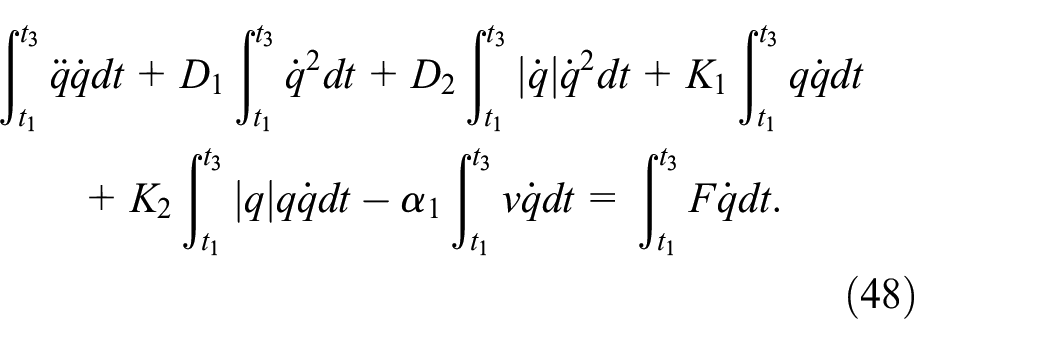
By referring to the waveforms shown in Figure 4(a) and substituting in equations (43)–(45), equation (48) can be calculated as follows:
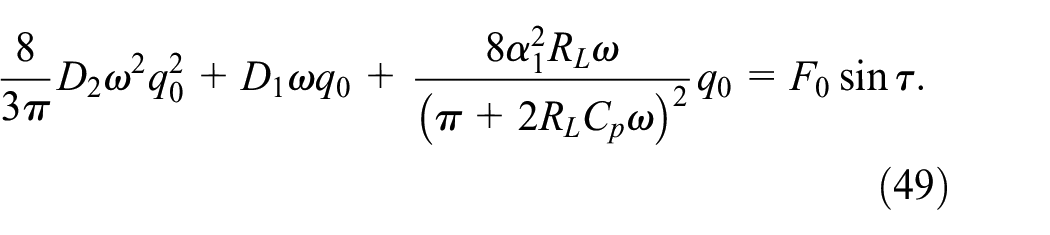
We must now eliminate the phase difference τ on the right side of equation (49) to derive an equation in which the only independent variable is q0. To derive another equation with respect to the phase difference τ (Shu et al., 2007), we calculated the time-derivative of equation (42), followed by calculation of the time-integral over the half vibrational period. The resulting equation is expressed as:
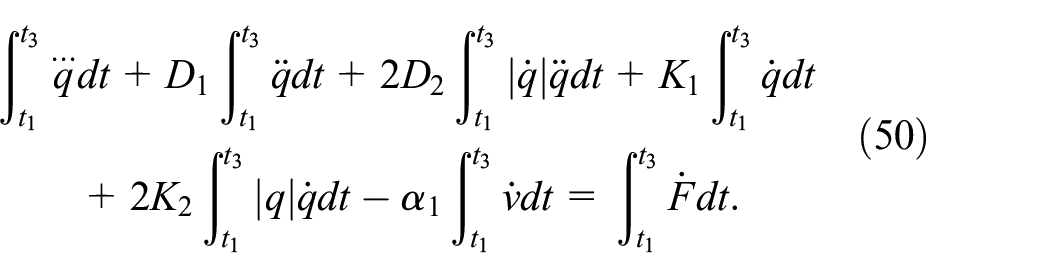
Similarly, by referring to the waveforms shown in Figure 4(a) and substituting in equations (43)–(45), equation (50) can be calculated as follows:
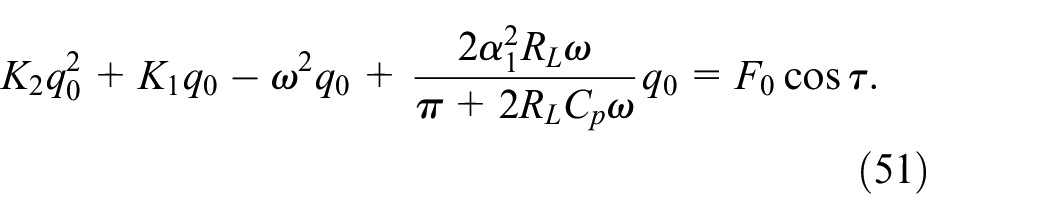
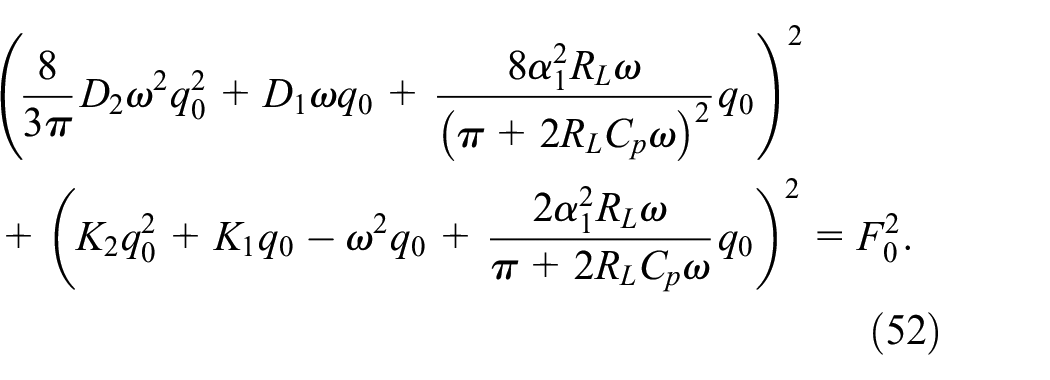
Therefore, by adding the squares of equations (49) and (51) and eliminating τ, the following equation, which is dependent on q0 alone, was derived:
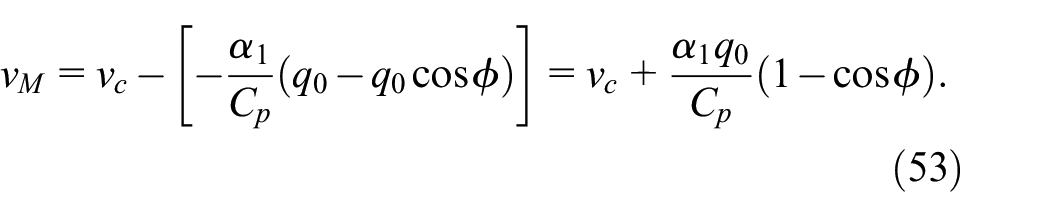
Second, we derive a similar q0-dependent equation for the SP-SSHI circuit while considering the switching delay φ (Lallart et al., 2012). As shown in Figure 4(b), q(t) reaches a minimum (−q0) at t0 and a maximum (q0) at t3. In this analysis, the time interval from t1 to t4 was defined as the half vibrational period T/2 because of the discontinuity of v(t) caused by switching. In addition, q(t1) and q(t4) are expressed as −q0cosφ and q0cosφ, respectively. The electric current i can flow through the diode rectifier into the RL-CS parallel circuit during the period from t2 to t3. vM and vm are the magnitudes of the piezoelectric voltage before and after switching, and the ratio of vm/vM is called the voltage inversion coefficient γ. By considering the voltage difference between v(t3) and v(t4), as shown in Figure 4(b), vM can be expressed as follows:
Similarly, by calculating equation (46) over the half period from t1 to t4 by substitution of equation (53), vc can be expressed as follows:
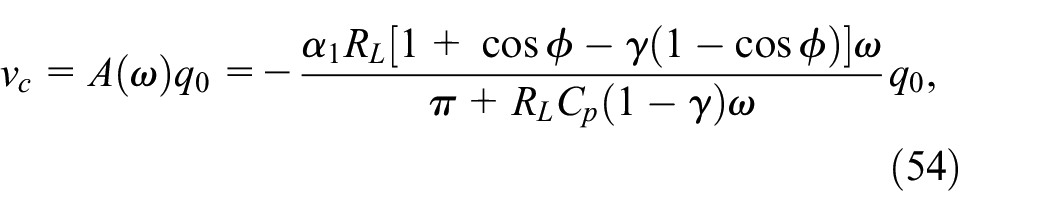
where A(ω) is the coefficient that is dependent on ω. Using a similar approach to the methodologies applied when performing the analysis for the STD circuit, by calculating and simplifying integral equations (48) and (50) over the half period from t1 to t4, the following two equations can be derived.
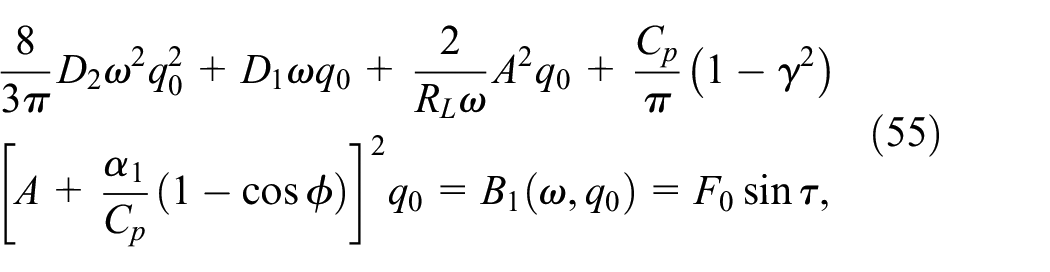
where B1(ω, q0) and B2(ω, q0), which represent the left-hand sides of equations (55) and (56), respectively, are the functions that are dependent on ω and q0. By adding the squares of equations (55) and (56) to eliminate τ, the following equation was derived:
q 0 can be determined for the STD and SP-SSHI circuits by solving equations (52) and (57), respectively, after substituting in specific values for the parameters. vc was then calculated for the STD and SP-SSHI circuits from equations (47) and (54), respectively, by substitution of the resulting q0. The output power Pout was calculated as vc2/RL. Note that, by expanding and simplifying, equations (52) and (57) finally form the required quartic equation with respect to q0, which can be solved analytically using Ferrari’s method (Weisstein, 2022). The analytical solution has quite a lengthy expression; therefore, we determined q0 numerically in this study, based on considerations that the value of q0 was real, positive, and close to the value determined at one frequency step ahead.
The tip displacement of the PVEH must be small enough to satisfy the condition of geometric linearity because we derived the quartic equation based on the geometric linearity. Figure 5 shows the results of a finite element analysis (FEA) of the restoring force versus the displacement of the PVEH based on the geometric nonlinearity and linearity. Comsol Multiphysics® FEA software was used to perform this analysis. The structural model used in the FEA was identical to the structure shown in Figure 1. The displacement at the boundary between the mass and the beam was evaluated by applying a static force. The FEA indicated that the two results showed no differences at displacements smaller than 2 mm, whereas the nonlinear increase in stiffness caused by the geometric nonlinearity was clearly observed at displacements greater than 4 mm. Therefore, geometric linearity was ensured at displacements of less than 2 mm, and we thus proceeded with the numerical analysis while considering a geometrically linear range.
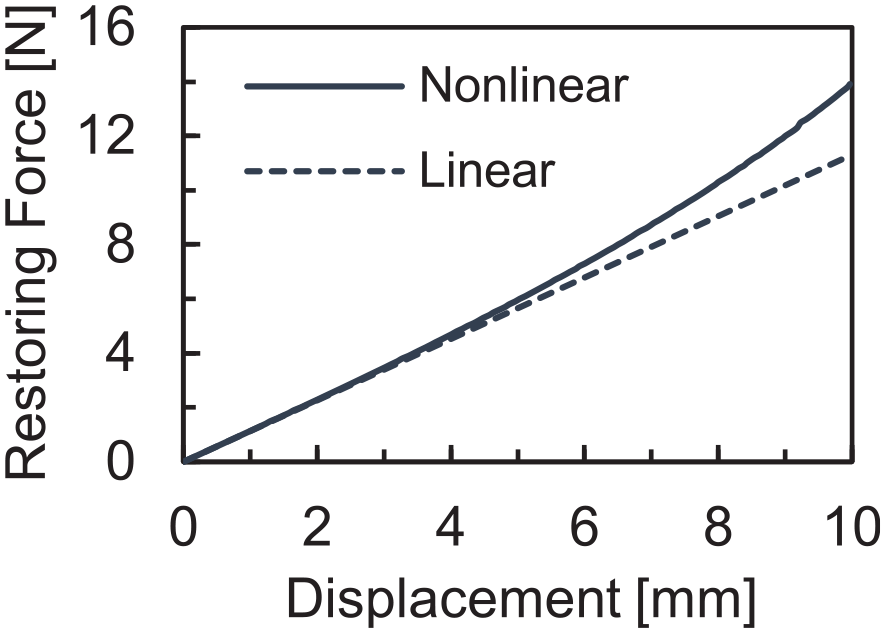
Results of FEA of the restoring force versus displacement of the PVEH based on the geometric nonlinearity and the geometric linearity.
Figure 6 shows the numerical simulation results for the output power Pout, the displacement, and the resonance frequency fr versus the resistive load RL and versus the acceleration applied externally for the (a), (c), (e) STD and (b), (d), (f) SP-SSHI circuits. The output power and displacement values were acquired at the resonance frequency. The open circles connected by a white solid line represent the points at which the maximum of the output power was obtained for each given acceleration. The displacement was evaluated at the boundary between the mass and the beam, that is, where x = lb. For simplicity and consistency, the inversion coefficient γ (=0.66) and the switching delay φ (=0.42 rad) were set to be constant in the analysis; these values are empirically attainable at high acceleration. As shown in Figure 6(a) and (c), the maximum output power for the STD circuit was obtained at the minimum displacement, and RL remained approximately constant at the maximum output power. In contrast, as shown in Figure 6(b) and (d), the displacement of the SP-SSHI circuit continued to decrease as RL increased, and RL increased slightly at the maximum output power from 20 to 40 kΩ as the acceleration increased. This occurred because the SP-SSHI’s piezoelectric coupling force (−α1v in equation (42)), which increases at larger values of RL, suppressed the displacement significantly and thus reduced the output power, particularly at lower accelerations. Although the simulation located the maximum output power value successfully, we assume that experimental identification of a true maximum point may be difficult because, as illustrated in Figure 6(a) and (b), the shape of the distribution near the peak was rounded at RL values between 20 and 60 kΩ. As shown in Figure 6(e) and (f), the resonance frequency for the SP-SSHI varied more widely when compared with that of the STD circuit, because the reduced displacement at larger RL values reduced the stiffness softening caused by the nonlinear piezoelectricity, and connection to the SP-SSHI increased the stiffness, as shown in equation (56).
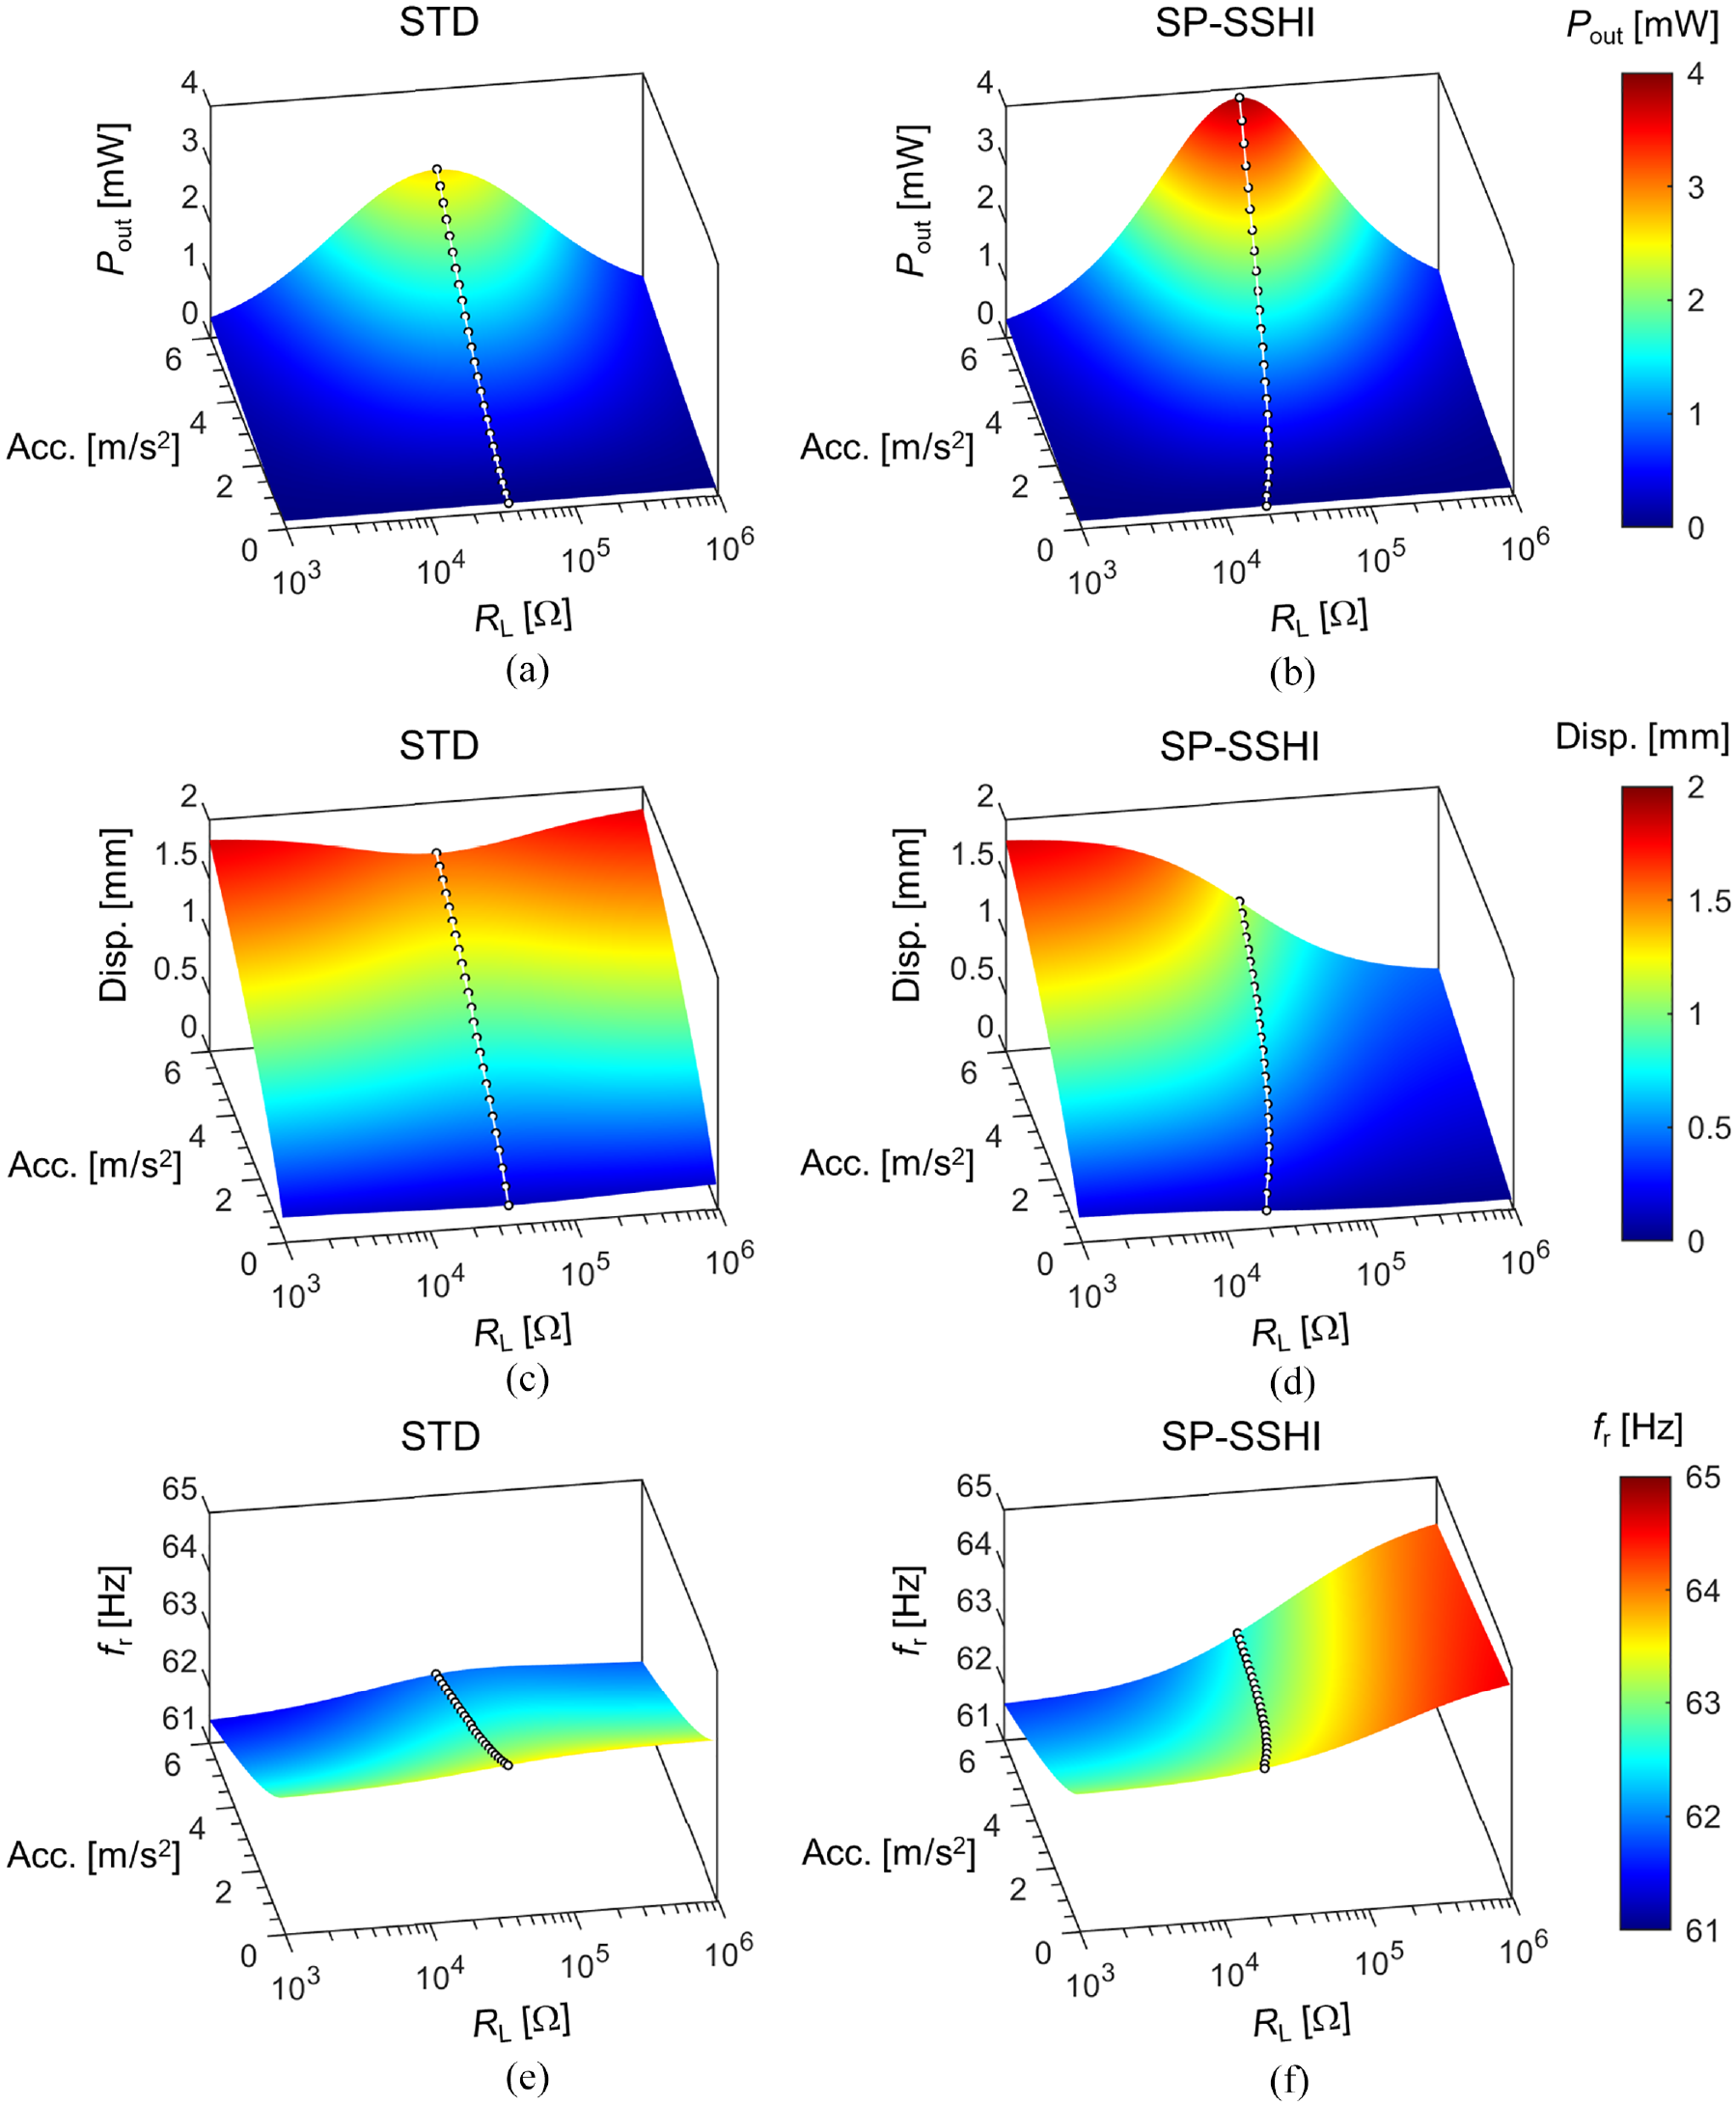
Numerical simulations of output power Pout, displacement, and resonance frequency fr versus the resistive load RL and versus the externally applied acceleration for the (a, c, and e) STD circuit and the (b, d, and f) SP-SSHI circuit. The open circles connected using a white solid line represent the points at which the maximum output power was obtained at a given acceleration.
Figure 7 shows the results of numerical simulation of the output power Pout and the displacement versus the frequency and versus the acceleration that was applied externally for the (a), (c) STD circuit and (b), (d) the SP-SSHI circuit. To enable a fair comparison, the same resistive load of 36 kΩ was used in this case. Similar to Figure 6, the open circles connected using a white solid line represent the maximum output power values at each given acceleration. As shown in Figure 7, the resonance frequency shifted toward a lower frequency when the acceleration increased, and its asymmetric distribution with respect to the peak was clearly observed. Therefore, the stiffness softening behavior caused by the nonlinear piezoelectricity affects the frequency response characteristics significantly, and thus this softening cannot be neglected in the analysis. When compared with the STD circuit, use of the SP-SSHI circuit provided an increase in the output power, a reduction in the displacement, and alleviated the lower shift in the resonance frequency.
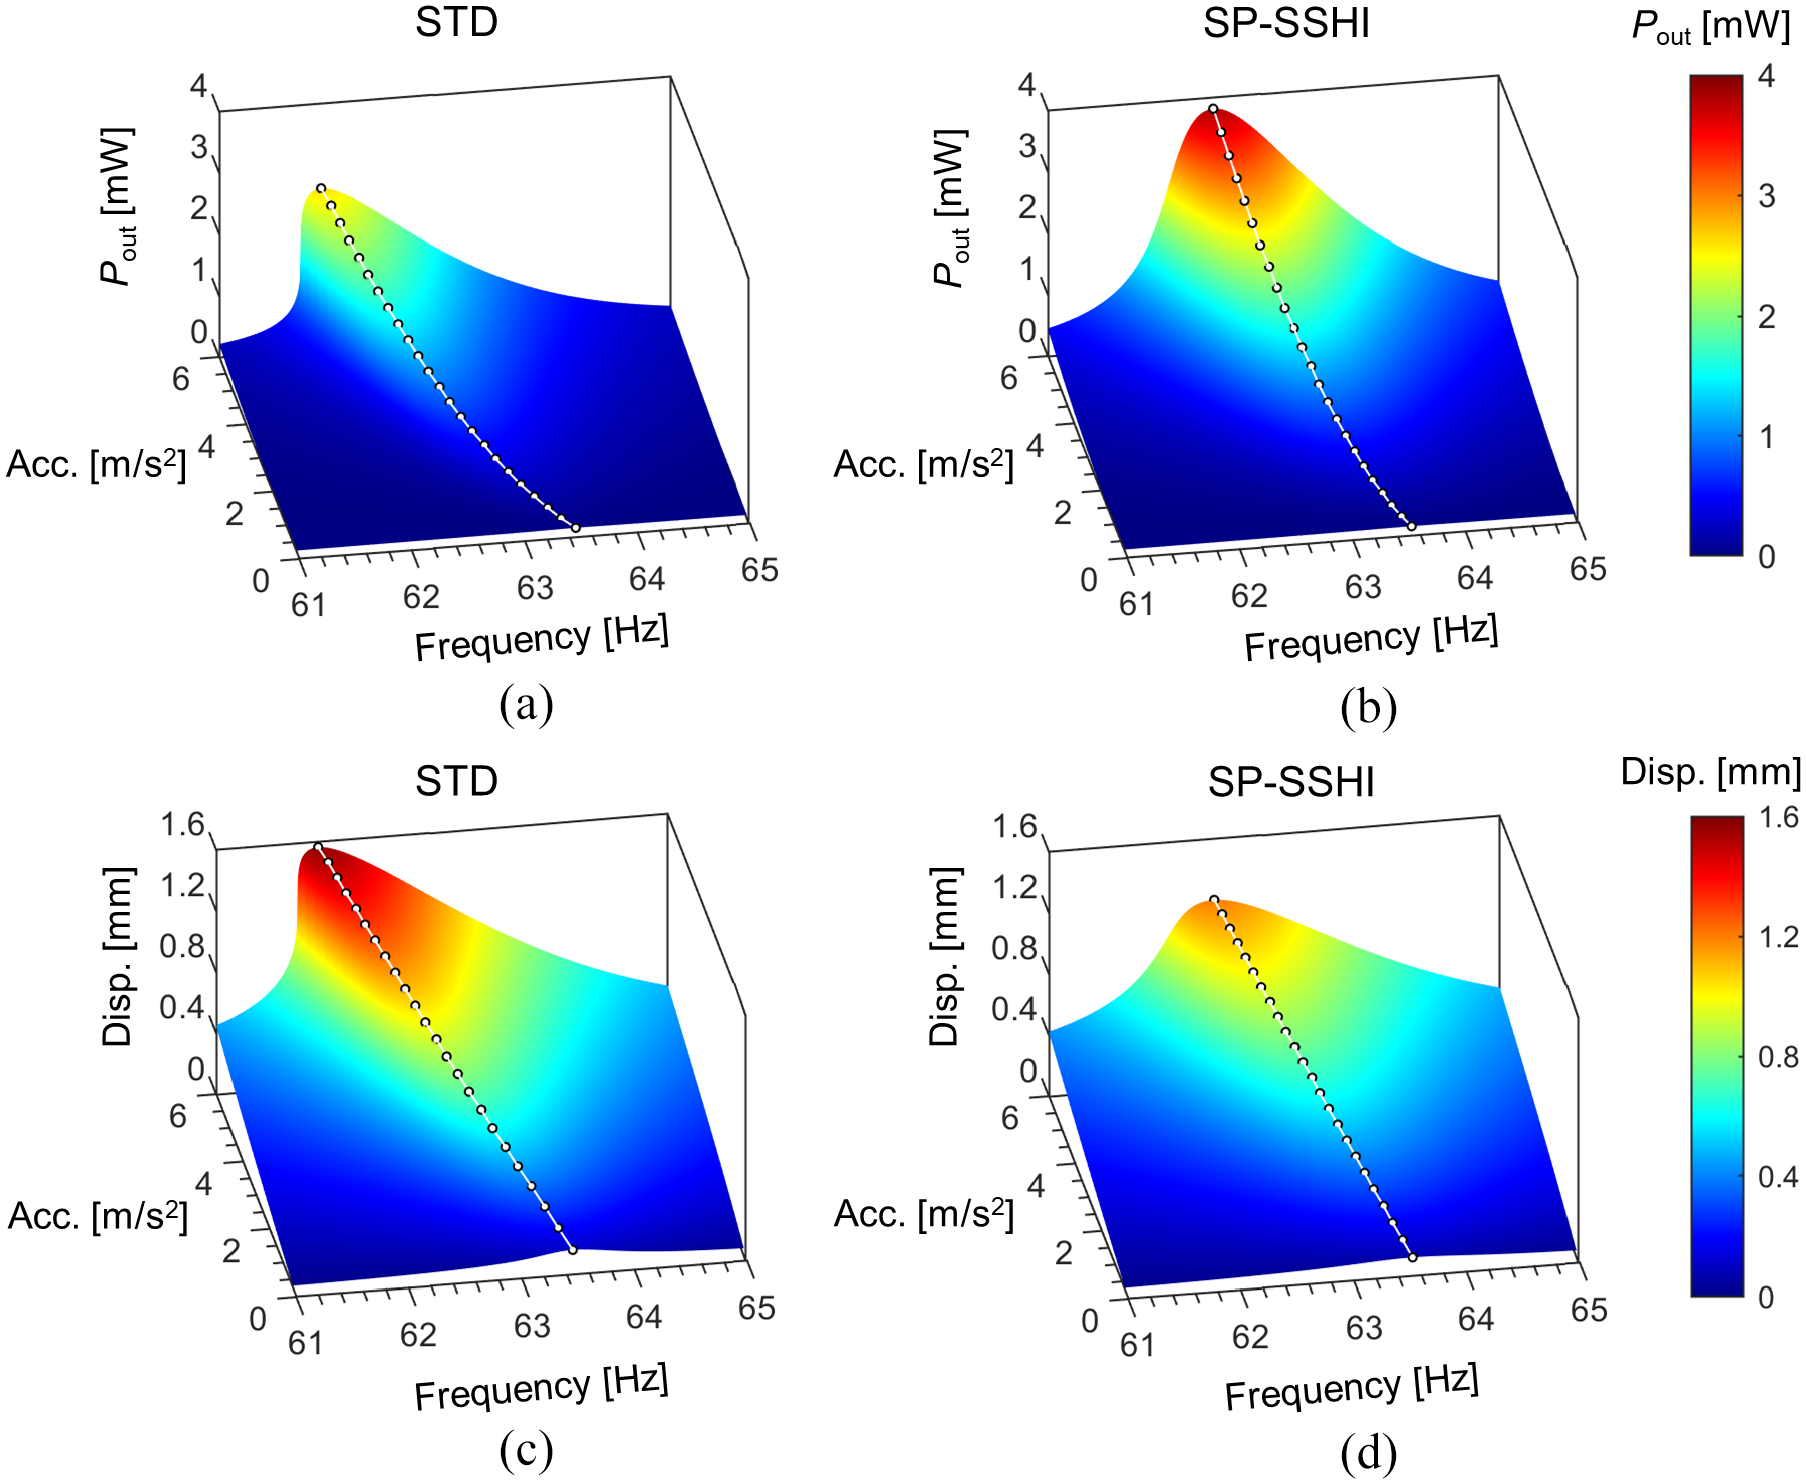
Numerical simulation results for output power Pout and displacement versus frequency and versus the acceleration applied externally for (a and c) the STD circuit and (b and d) the SSHI circuit. The open circles connected using a white solid line represent the points at which the maximum output powers at a given acceleration were obtained.
3. Experimental results
In this section, we validate the established numerical analysis method via comparison with the experimental results. Figure 8 shows an experimental setup for measurement of the voltages and displacements of the piezoelectric harvester when connected to the STD and SP-SSHI circuits. A shaker system (shaker: SW-2015; controller: APD-200FCG; Asahi Seisakusyo) was used to apply a sinusoidal vibration, which was oriented perpendicular to the longitudinal direction of the piezoelectric harvester. Similar to the approach used in the simulation, the displacement was evaluated close to the boundary between the mass and the beam using a laser displacement sensor system (LK-H150 and LK-G5000, Keyence). The signals for the piezoelectric voltage v, the DC voltage vDC across the resistive load, the displacement, and the acceleration applied by the shaker were collected through a four-channel differential oscilloscope (HS6-DIFF USB oscilloscope, TiePie Engineering), and the signals were then processed using a personal computer (PC). As shown in Figure 9, the inversion coefficient γ and the switching delay φ exhibited dependences on the acceleration (or the piezoelectric voltage) during the experiments because of the voltage-dependent parasitic elements present in the SP-SSHI circuit (Asanuma and Komatsuzaki, 2020). The parameter values of γ and φ obtained in this step were used in the numerical analysis. The other parameters used in the numerical analysis were found in Tables 1 and 2. All parameters of the PVEH are the same value as used in the numerical analysis.
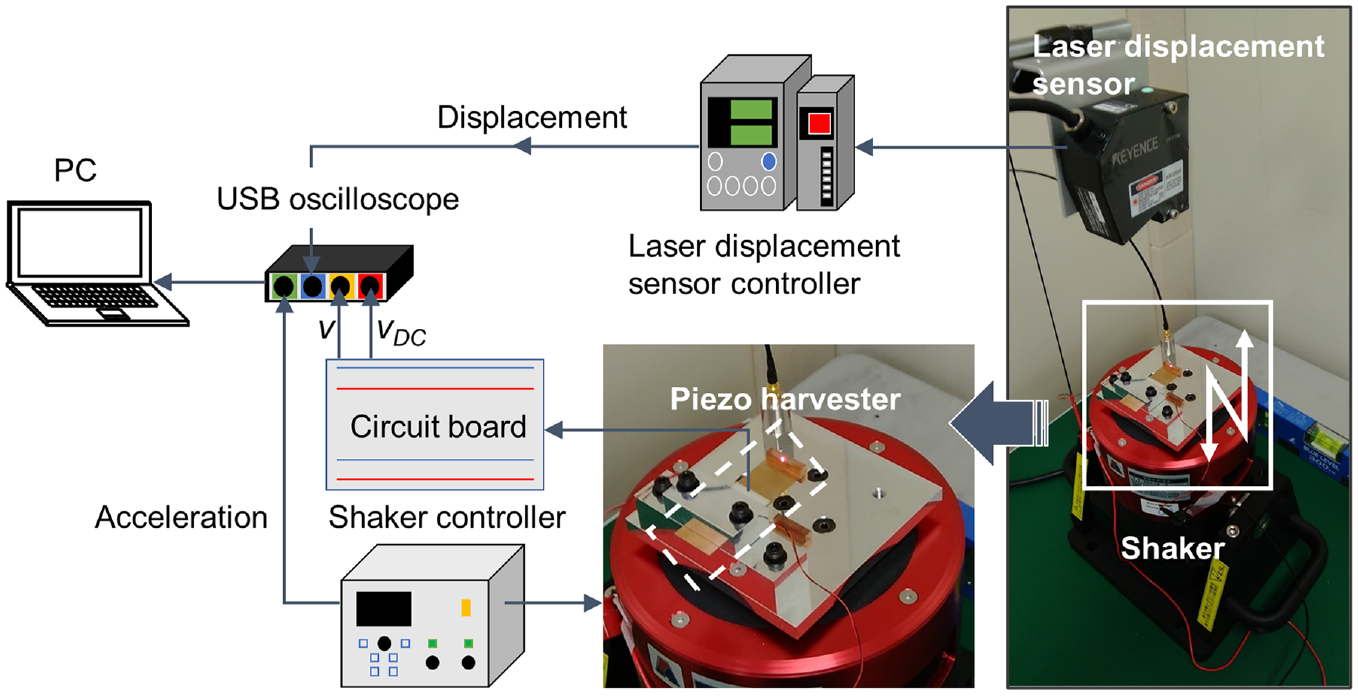
Experimental set-up for measurement of the voltages and displacement of the piezo harvester.
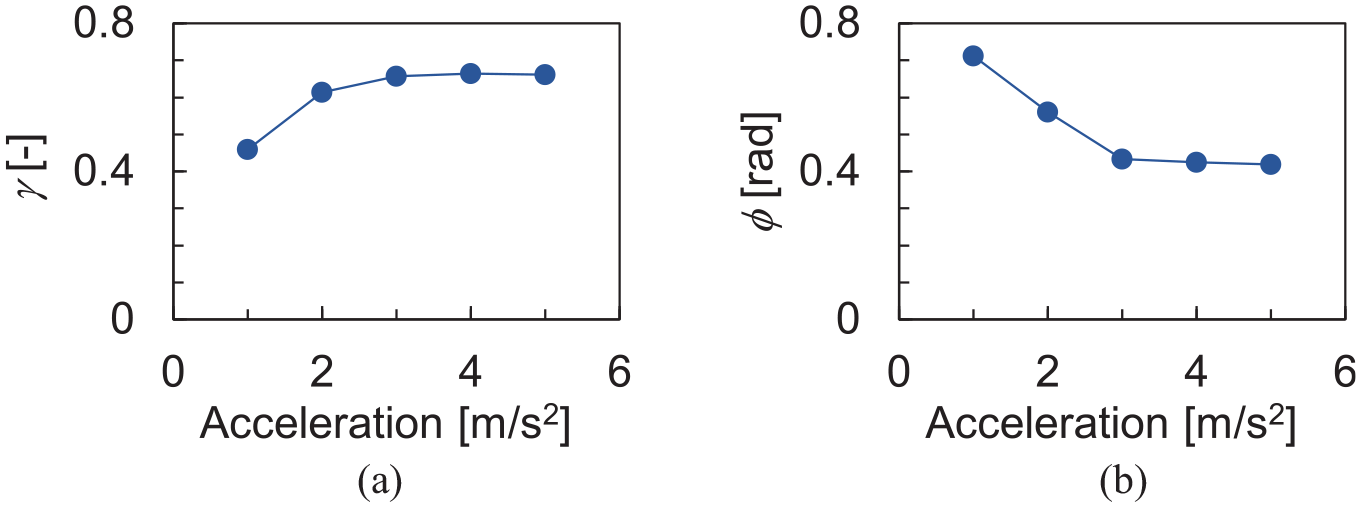
Experimental results for the acceleration dependences of (a) the inversion coefficient γ and (b) the switching delay φ.
Figure 10 shows the resistive load RL dependences of the output power Pout, the displacement, and the resonance frequency fr at three different acceleration magnitudes (i.e. 1, 3, and 5 m/s2). Figure 11 shows the acceleration dependences of the output power Pout, the displacement, and the resonance frequency fr. Figure 12 shows typical frequency response curves acquired at the three different acceleration magnitudes (1, 3, and 5 m/s2). To ensure a fair comparison, the same resistive load of 36 kΩ was used during evaluation of both the acceleration dependence and the frequency response. As predicted in subsection 2.3, the reduction in the displacement at larger values of RL, a wider variation in the resonance frequency, and nonlinear stiffness softening were all observed experimentally, and the simulations replicated these phenomena well. Therefore, by using the established numerical analysis process, we can predict the electromechanical properties of a piezoelectric harvester connected to the SP-SSHI circuit with a lower computational load when compared with the two-way coupled analysis method using a combination of numerical software and a circuit simulator. For the SP-SSHI, a discrepancy between the experimental and numerical results was found at a larger RL and/or a high acceleration of 5 m/s2. The discrepancy for the SP-SSHI may be attributed to a higher vibrational mode induced by an increased piezoelectric coupling (or damping) force. After the switch closes at a large piezoelectric voltage (or, a high acceleration and/or a large RL), a high current flows to the circuit and thus the impulsive damping force acts on the PVEH. The impulsive damping force may induce a higher vibrational mode, which triggers an unwanted switching and a reverse current. Figure 13 shows experimental results of waveforms of the piezoelectric voltage v, the DC voltage vDC across the resistive load RL, and the displacement for (a) RL of 36 kΩ and (b) RL of 1 MΩ at the acceleration of 5 m/s2. As shown in Figure 13, a higher vibrational mode affected the displacement waveforms, and the unwanted weak switching was clearly observed as a ripple in the piezoelectric voltage waveform at RL of 1 MΩ. Therefore, the presence of the higher vibrational mode may result in the discrepancy.
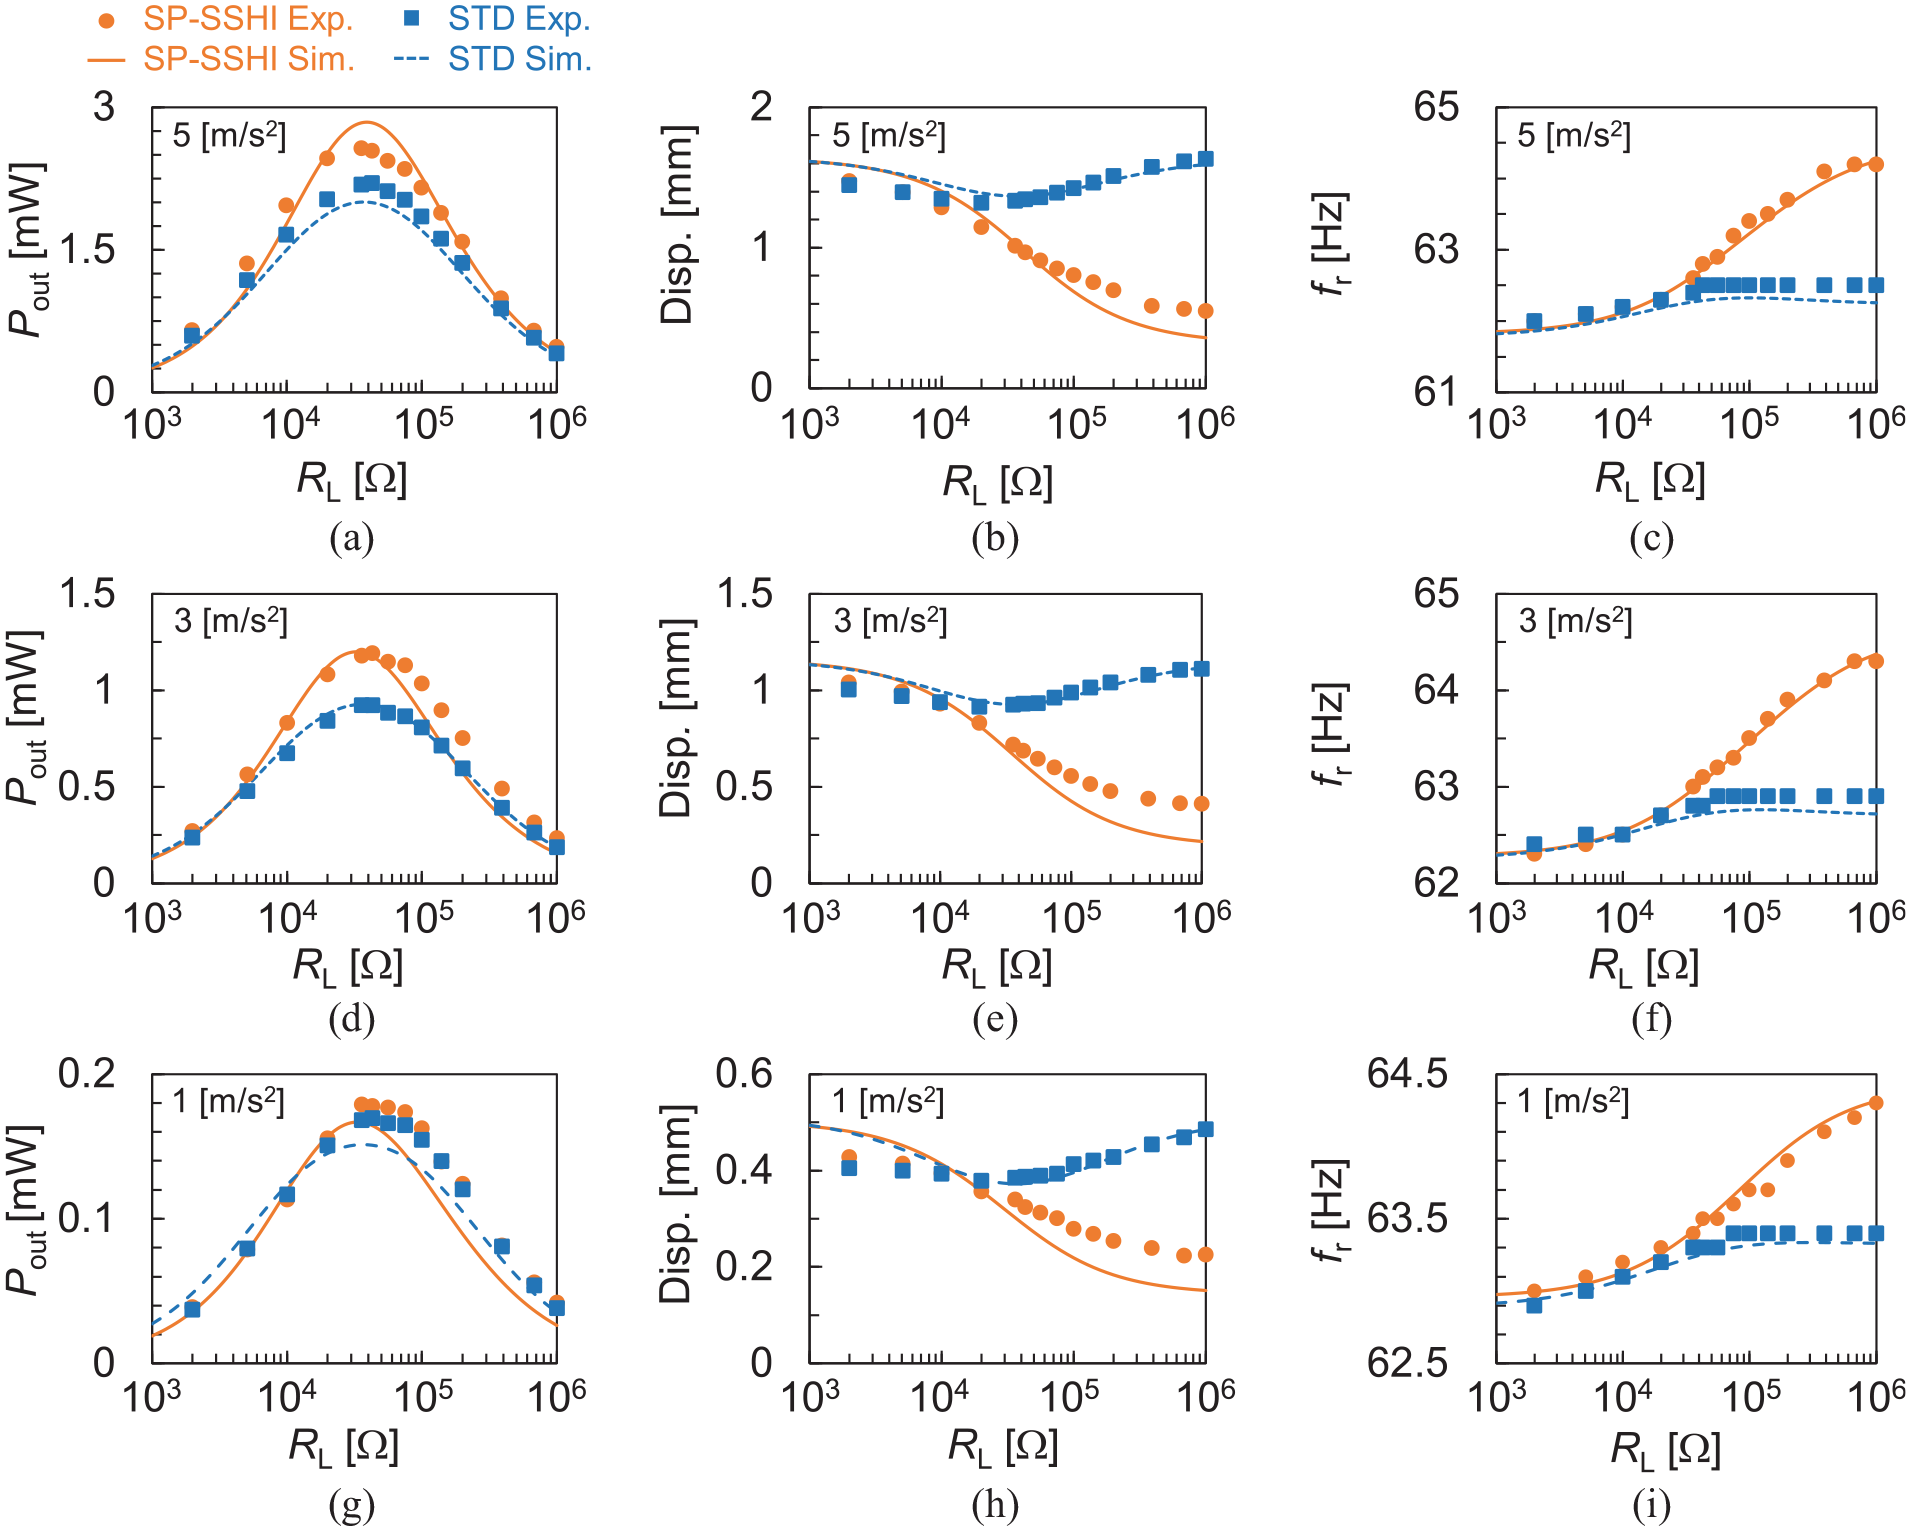
Simulated and experimental results for the resistive load RL dependences of (a, d and g) the output power Pout, (b, e and h) the displacement, and (c, f and i) the resonance frequency fr at three different acceleration magnitudes (1, 3, and 5 m/s2).
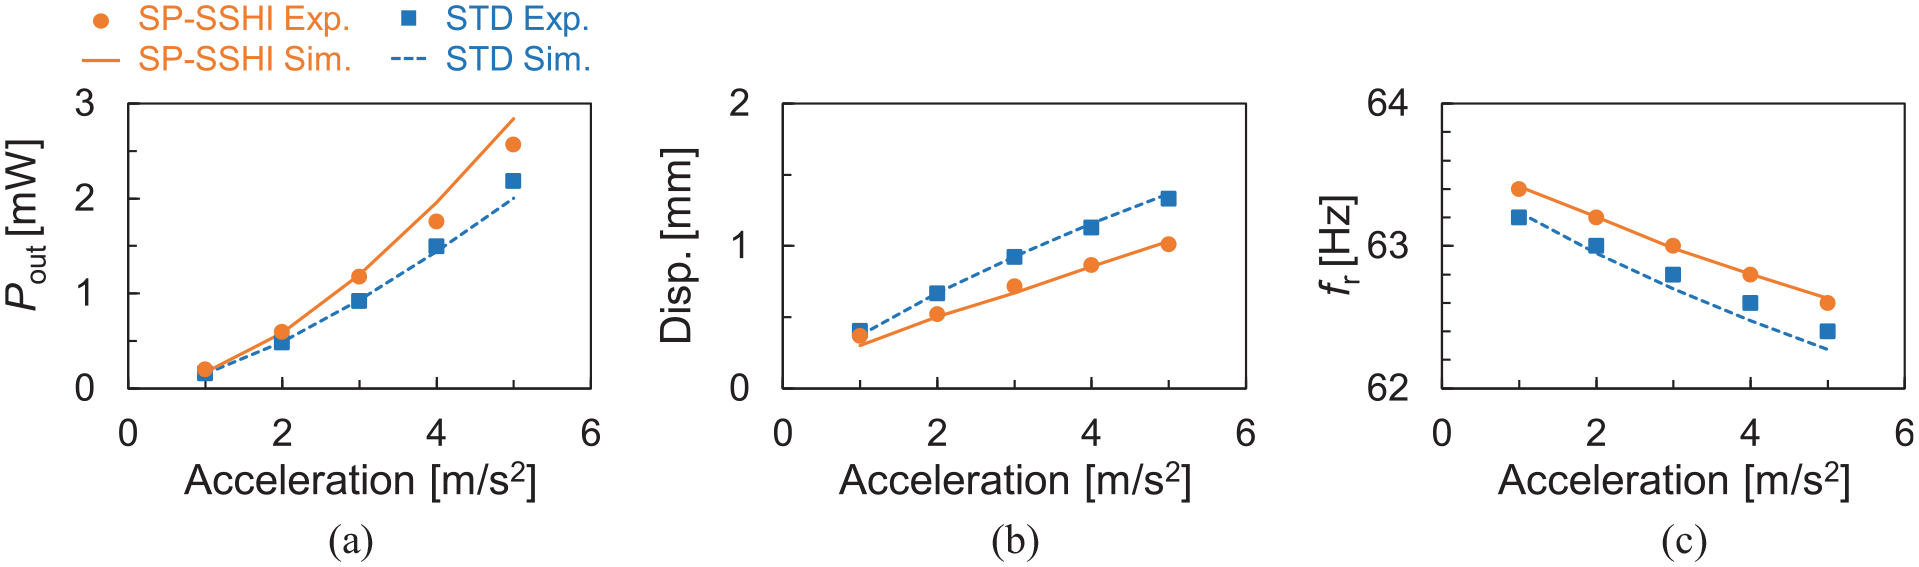
Simulated and experimental results for (a) the acceleration dependence of the output power Pout, (b) the displacement, and (c) the resonance frequency fr at a resistive load of 36 kΩ.
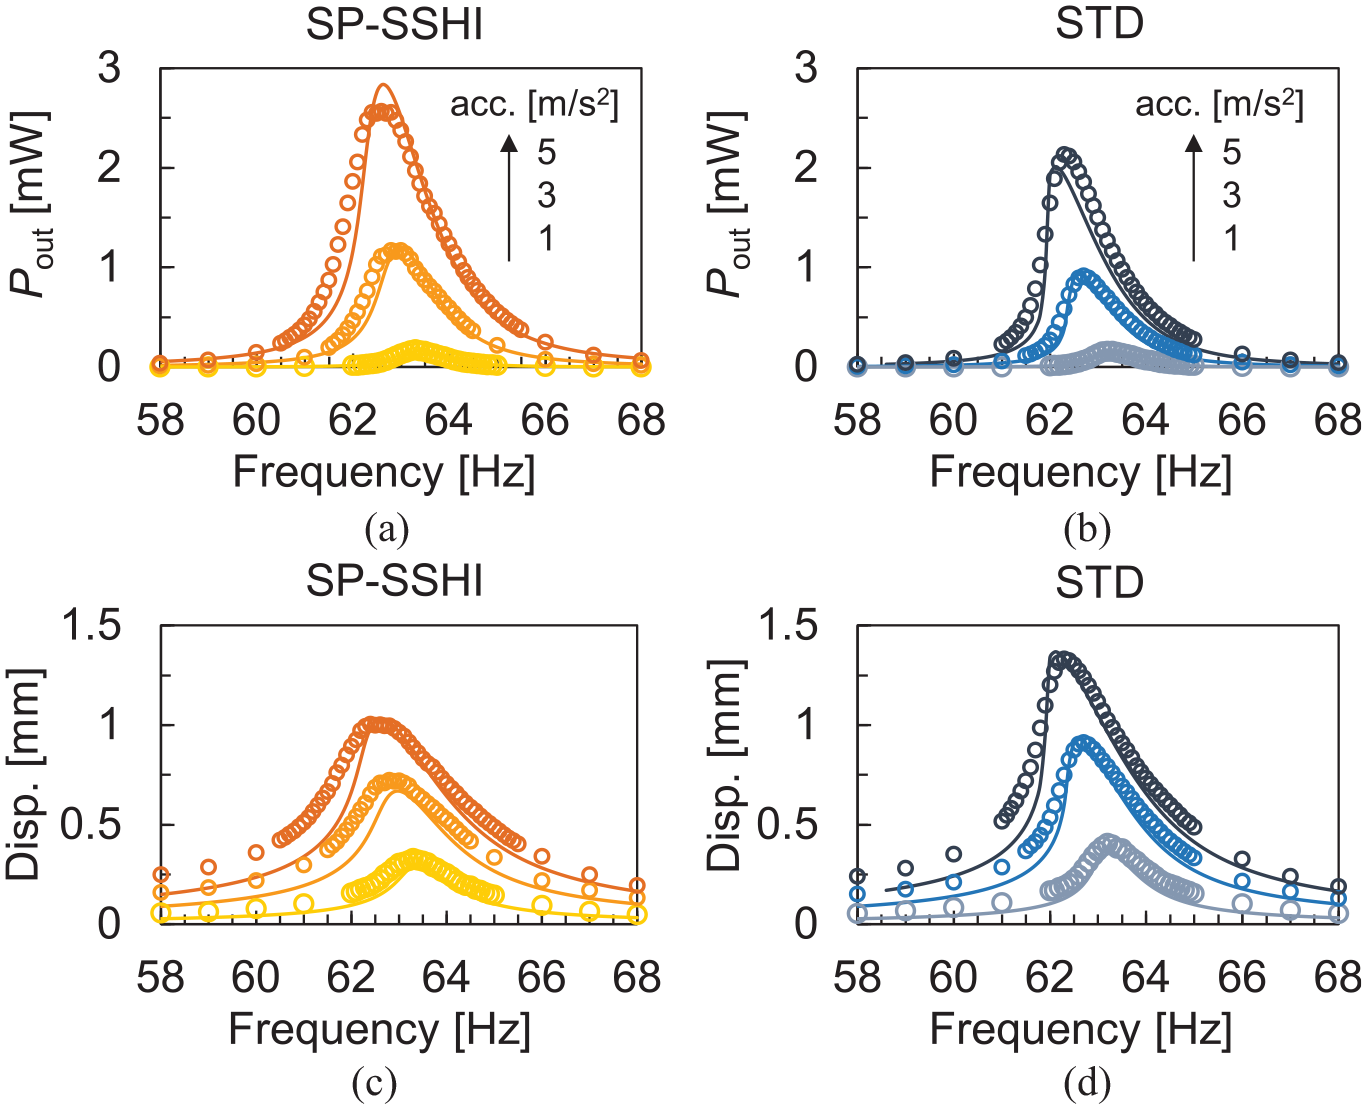
Simulated (solid lines) and experimental (dots) results for typical frequency response curves of (a and b) the output power Pout and (c and d) the displacement at three different acceleration magnitudes (1, 3, and 5 m/s2).
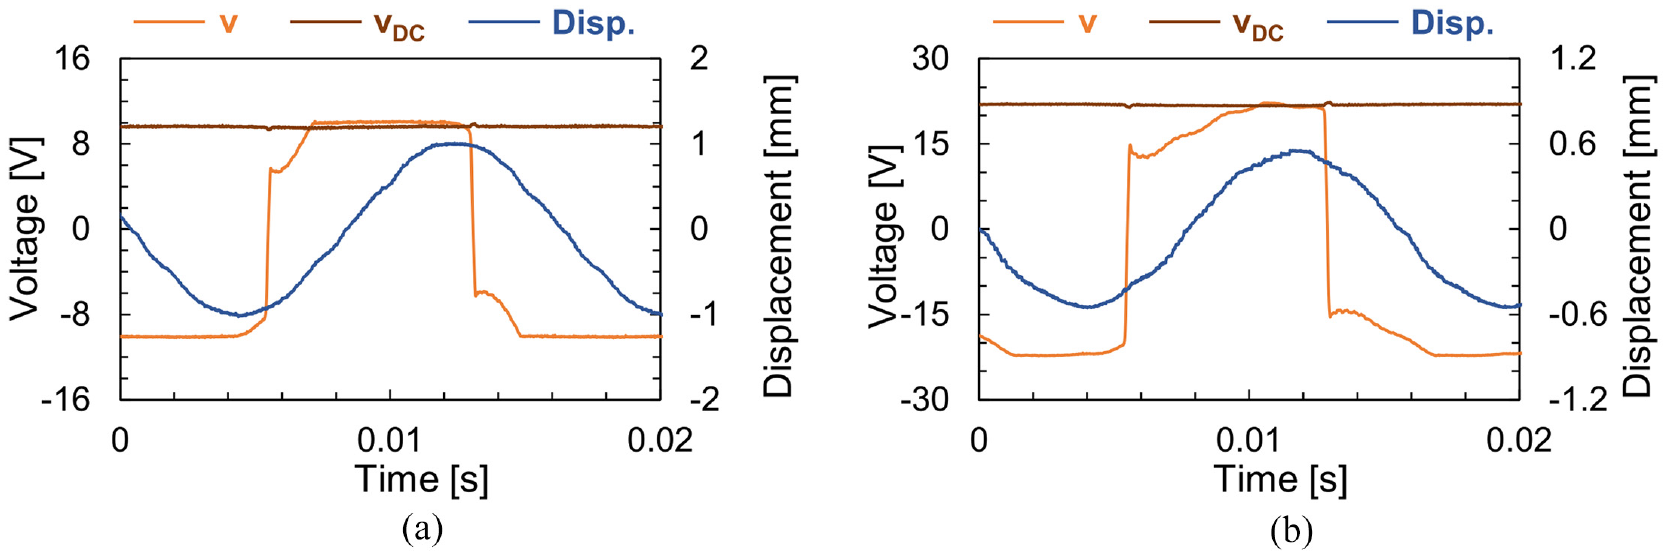
Experimental results of waveforms of the piezoelectric voltage v, the DC voltage vDC across the resistive load RL, and the displacement for (a) RL of 36 kΩ and (b) RL of 1 MΩ at the acceleration of 5 m/s2.
For simplicity, the voltage drops in the diode rectifier (Leadenham and Erturk, 2020; Yang et al., 2020) and the dielectric and piezoelectric losses of the piezoelectric materials (Gibus et al., 2022) which become significant for a PVEH with a high electromechanical coupling at a large piezoelectric voltage were not considered in this study. For accurate predictions, these factors should be incorporated into the model depending on the electromechanical coupling states, the magnitude of piezoelectric voltage, and/or acceleration level.
4. Conclusion
To replace the existing two-way coupled analysis method, which involves a high computational load, we have developed a numerical analysis technique that is more easily implemented to allow us to predict output power, displacement, and frequency response characteristics for a PVEH connected to a self-powered synchronized switch circuit. First, we derived the electromechanical equation required for a miniature PVEH, and we then determined the parameters in this equation using the harmonic balance method. Finally, the governing equation coupling the PVEH with the self-powered synchronized switch circuit can be simplified using the form of a quartic equation with respect to the displacement. The simulations successfully replicated the experimentally-observed phenomena, including a reduction in the displacement at higher resistive loads, a wider variation of the resonance frequency value, and nonlinear stiffness softening. Therefore, using the established numerical analysis technique, we can predict the electromechanical properties of a PVEH connected to a self-powered synchronized switch circuit with a reduced computational load. This study revealed that the piezoelectric coupling force increased by the self-powered synchronized switch circuit alleviates the nonlinear stiffness softening caused by the nonlinear piezoelectricity, thus those two factors cannot be ignored for designing a PVEH connected to a synchronized switch circuit. The governing equation, parameter determination, and numerical analysis technique are useful tools for designing a PVEH connected to a synchronized switch circuit. For simplicity, this study did not consider the voltage drops in the diode rectifier and the dielectric and piezoelectric losses of the piezoelectric materials in modeling. For accurate predictions, these factors should be incorporated into the model depending on the electromechanical coupling states, the magnitude of piezoelectric voltage, and/or acceleration level.
Footnotes
Appendix
Acknowledgements
I thank David MacDonald from Edanz for editing a draft of the manuscript.
Declaration of conflicting interests
The author declared no potential conflicts of interest with respect to the research, authorship, and/or publication of this article.
Funding
The author disclosed receipt of the following financial support for the research, authorship, and/or publication of this article: The author received financial support from JSPS KAKENHI [grant number 20K04347].