
Abstract
This work presents a hassle-free rheological assessment of fluidic media using the frequency response of a self-sensing and self-actuating piezoelectric cantilever sensor. Firstly, an analytical modelling approach for a unimorph-based cantilever sensor is derived and validated. Afterwards, the sensing performance of a rectangular cantilever sensor is improved by modifying its profile to a stepped shape. Frequency response parameters of the cantilever sensors are tracked in vacuum as well as in water, glycerin and varying concentration glycerin solution. These parameters are used to develop the calibration curves for the density and viscosity assessment of the water-glycerin solutions. The calculated density and viscosity utilizing the cantilever sensors are in good agreement with the respective values given by the standard instruments. This implies that the presented sensors can be successfully used for density and viscosity measurement of range 1000–1270 kg/m3 and 12.82–41.35 cP, respectively. The presented method is capable to simultaneously estimate the density and viscosity of the fluidic media without fully immersing the sensor in that media, which can tackle many operational troubles.
1. Introduction
Fluidic density and viscosity are the most important rheological properties, which require online monitoring to control the production, quality and fluidic behaviour aspect in the oil, food, chemical and biomedical industries. In the medical industry, the rheological measurement of biofluids is necessary to examine health conditions. In lubrication, the condition of the lubricating oil helps in determining the amount of component wear, in which the oil was supplied for the lubrication. Thus, the ability of the measuring system to measure the rheological properties of the small fluidic sample is important. The conventional technique and instruments of measurement are generally not suitable for the online monitoring of fluidic properties because of their less portability and sensitivity due to environmental difficulties. The cantilever-based sensors can provide an easy and effective way for online fluidic properties estimation in different applications. The MEMS technique of fabrication enables these devices to deal with small fluidic samples (Belmiloud et al., 2008; Bircher et al., 2013; Ghatkesar et al., 2008; Hur and Lee, 2013; Lee et al., 2007; Maali et al., 2005; Ramos et al., 2008; Rust et al., 2013; Vančura et al., 2008; Youssry et al., 2011).
The cantilever sensor in dynamic mode responds through the frequency response change and different resonant modes can be used for the sensing purpose (Boskovic et al., 2002; Martin et al., 1994; Mather et al., 2012; Niedermayer et al., 2016; Oden et al., 1996; Shih et al., 2001; Tan et al., 2016; Wilson et al., 2007). The four vibrational modes of cantilever used in different sensing applications are transverse, torsional, lateral and longitudinal. In the fluidic application, the lateral and longitudinal mode of vibration sustains high quality factor compared to the transverse mode, because of the lesser fluidic resistance in that condition. Thus, the transverse mode of cantilever vibration is more suitable for the practical fluidic application point of view (Cox et al., 2012; Youssry et al., 2011). The interaction of the fluid and vibrating structure forms the basis of the fluidic properties (density and viscosity) determination (Green and Sader, 2002; Heinisch et al., 2014). The surrounding fluidic media directly affects the frequency response of the vibrating structure and changes its resonance frequency as well as the quality factor (Maali et al., 2005; Shih et al., 2001). The fluid loading effect on the vibrating cantilever can be considered the combination of an inertial and dissipative viscous load of the fluid. The inertial loading is caused by the density of the fluidic media while the dissipative effect is because of the fluidic viscosity, mainly (Chauhan and Ansari, 2021a, 2021b; Wilson et al., 2007). Thus, the density and the viscosity of the fluidic media affect the resonant frequency and quality factor of the vibrating cantilever in a coupled manner (Belmiloud et al., 2008; Maali et al., 2005).
Several efforts are made by researchers to separate the coupled relation of density and viscosity of the fluidic media (Belmiloud et al., 2008; Vančura et al., 2008). This approach of density and viscosity estimation is most widely adopted in different fluidic applications (Ghatkesar et al., 2008; Hur and Lee, 2013; Rust et al., 2013). The precise tracking of the frequency response of the sensor and the accurate determination of the resonant frequency and the quality factor is required to decouple the density and viscosity relation. Also, this approach requires frequency sweeping in high resolution to maintain the high sensitivity of the cantilever sensor. MEMS-based micro-cantilevers can provide high sensitivity in fluidic measurement but their quality factor depreciate drastically in the fluidic environment because of the fluid viscosity. The cantilever geometry can also play an important role in sensitivity improvement (Ansari and Cho, 2016; Wahid et al., 2014) as well as in determining the fluidic force acting on it (Korayem and Sharahi, 2011; Vančura et al., 2008).
Further, the majority of the fluidic interaction models developed and the work presented in the literature are for the fully immersed condition of the cantilever. This causes operating difficulties in various applications. Also, these models are mathematically complex, require frequent calibration, and demand more instrumentation. The presented methodology gives a simple approach for the fluidic assessment using just an impedance analyser and addresses the need for the development of the operational method of the cantilever vibrating partially immersed in fluidic environments.
In this research work, firstly the analytical modelling of a unimorph-based piezoelectric cantilever sensor is presented and validated. Afterwards, the rectangular and stepped-rectangular-shaped steel-piezo cantilever sensors are designed and fabricated. These cantilever sensors are operated in dynamic mode and their frequency response is used for the real-time density and viscosity estimation of the operating fluidic media. The proposed fluidic assessment is independent of the immersed length of the cantilever in that fluidic media. The presented millimetre-sized PZT-steel cantilever sensor can sustain its quality factor under a fluidic environment, unlike a small-size cantilever. Also, the density measuring sensitivity is improved by 29.5% by modifying the profile of the cantilever sensor into a stepped-shaped. This improved cantilever profile also provides a more accurate viscosity assessment.
2. Analytical analysis
This research presents a piezoelectric cantilever sensor having an unimorph-based structure, in which the substrate layer is extended in length. The schematic of the cantilever sensor is given in Figure 1. The operation of this sensor is based on its self-sensing and self-actuating properties, so the analytical analysis of the bending curvature and deflection on the application of the voltage is important. When a voltage is applied on the piezo patch in its poling direction (which is upward z-direction), the patch contracts laterally. The lateral contraction of the piezoelectric patch causes its axial expansion. The piezo patch is perfectly bonded with the substrate so the bottom face of the piezo patch could not deform, because of which the top face of the patch experiences a shear deformation. This shear deformation causes the cantilever to curve like hogging and deflects it in the downward transverse direction. Thus, the application of the electric field to the piezo layer causes its extension or contraction which results in the bending of the composite structure. The analytical expression for the bending curvature and deflection of the piezoelectric cantilever sensor is derived in this work, which is important for understanding its operational physics.
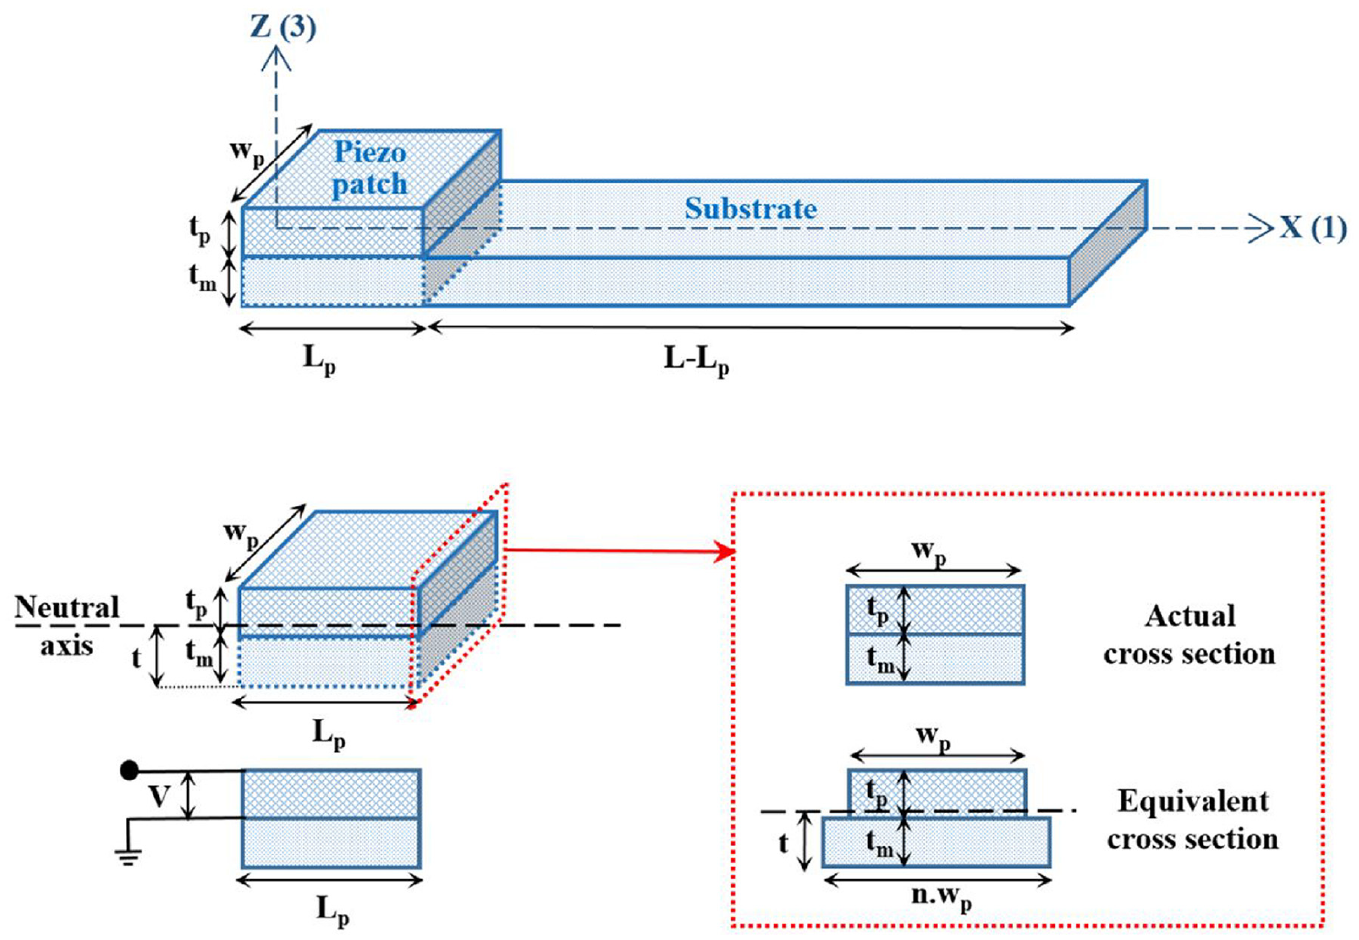
Piezoelectric cantilever sensor in form of extended substrate unimorph (top), piezoelectric cantilever’s equivalent cross-section (bottom).
This analysis focuses on the composite part (piezo and substrate) of the cantilever sensor, which is up to the length Lp of the unimorph as shown in Figure 1. The elastic modulus of piezoelectric material in one-direction is Y1 and the isotropic elastic modulus of the substrate is Ym. Considering the perfect bounding between piezo and substrate and the neutral axis of the composite structure at a distance t from the bottom of the substrate. Then, the constitutive equations for the composite part can be written as follows (Leo, 2007):
where,

On combining the equations (1) and (2), the following relations can be obtained:


The equilibrium condition for the moment can be obtained by multiplying the equations (3A) and (3B) by z and integrating them over the domain y and z. This results in the following equations (4A) and (4B), respectively:
Adding the results of two domains (active piezo and substrate) obtained in equations (4A) and (4B) yields the following equation (5):
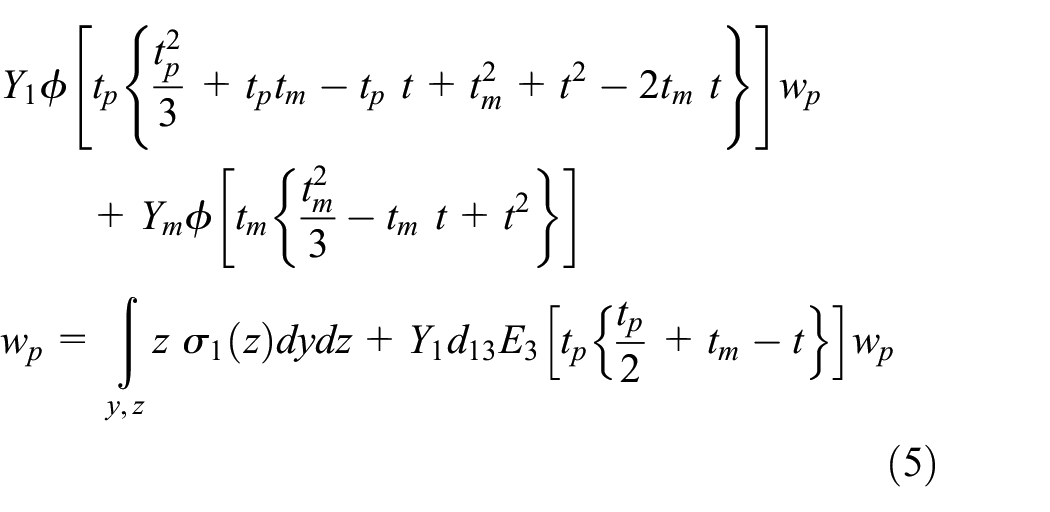
The integration of the stress component on the right side of the expression (5) is defined as the moment resultant from the externally applied loads. If this moment resultant of the externally applied loads is zero, then the curvature function can be solved as follows:
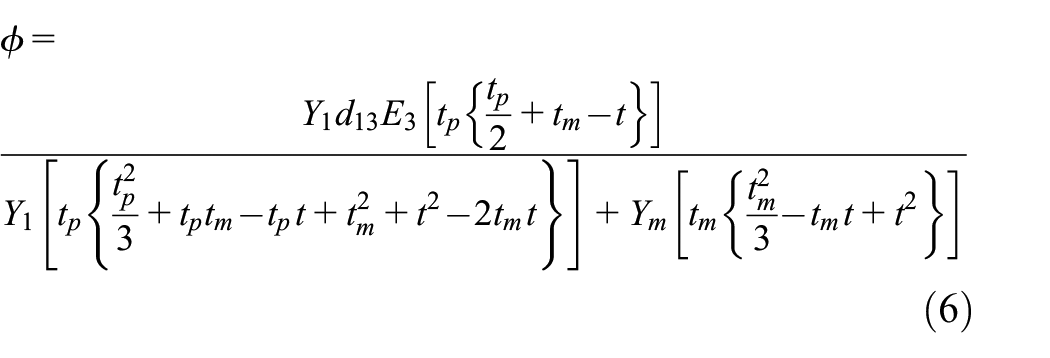
This is the expression of the curvature of the cantilever sensor on applying the electric field on its active part. This expression does not contain any length-term of the cantilever, so it can be inferred that the curvature is constant throughout the length Lp. In this derived expression of curvature, the position of neutral axis t can be calculated by converting the actual cross-section of the composite cantilever into the equivalent cross-section with the same modulus of elasticity. The neutral axis of the composite cantilever will pass through the centroid of the equivalent cross-section and Figure 1 shows this conversion of the equivalent cross-section. The position of neutral axis t can be defined as follows:
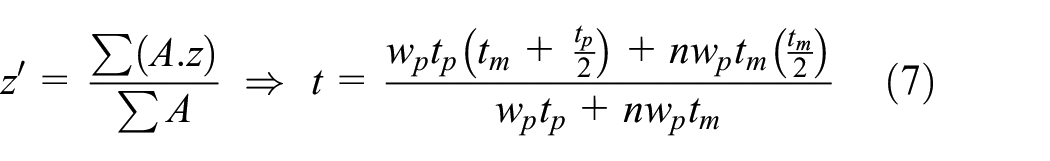
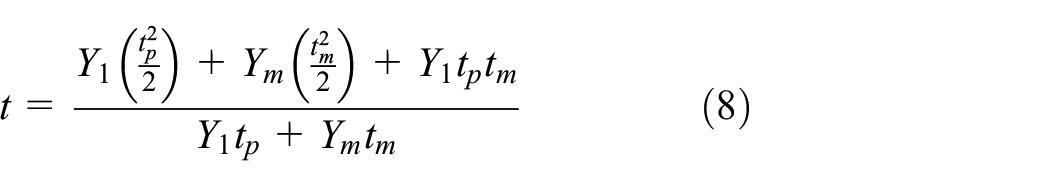
where, wp is the width of the piezo and substrate layer and n is the ratio of the elastic modulus of the substrate to the elastic modulus of the piezo patch (Ym/Y1). Putting the value of n in equation (7), the following value of t in terms of Young’s modulus of the constituents of the composite cantilever can be obtained:
Further, the deflection of the cantilever sensor on the application of voltage on its active part can be derived in two parts (part AB and part BC in Figure 2). In the first part, the deflection of the composite part of the cantilever sensor up to length Lp can be calculated and in the second part, the deflection of the extended substrate can be obtained.
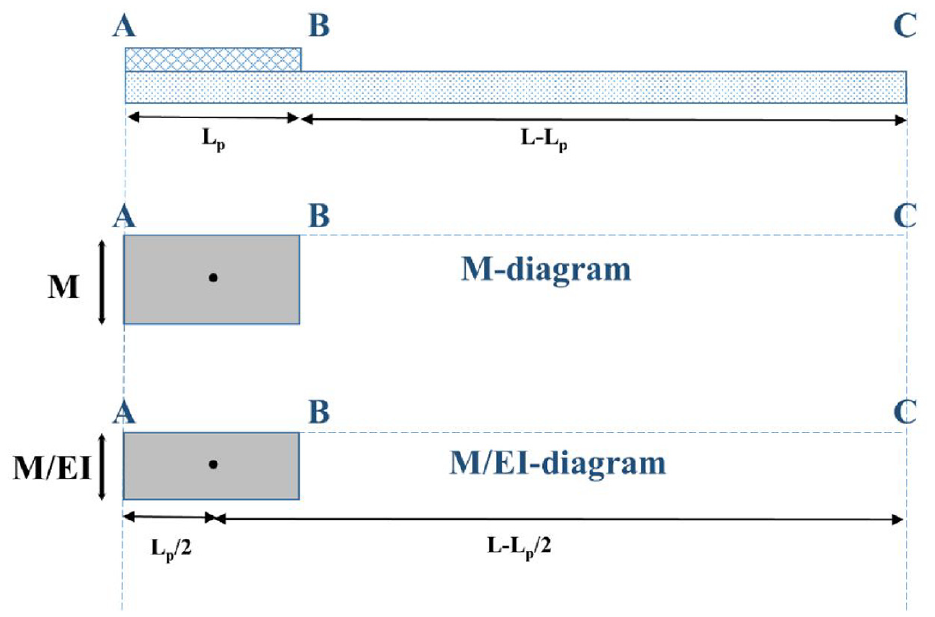
Moment-area diagram.
For composite part up to length Lp, let the deflection of the beam in the z-direction is w. Then, the second-order derivative of deflection will define the bending curvature as follows:
At x = 0 ⇒ slop,
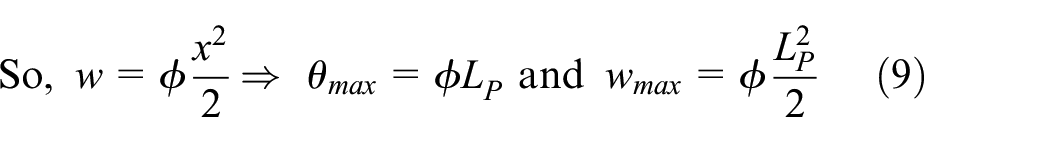
The expressions in equation (9) are the maximum values of the slope and deflection of the composite part of the sensor. These maximum values are corresponding to point B of Figure 2.
For the calculation of the deflection of the extended substrate, a pure moment at point B is assumed as the curvature of the Lp portion is constant. Then the following entities can be obtained through the moment-area diagram of Figure 2:
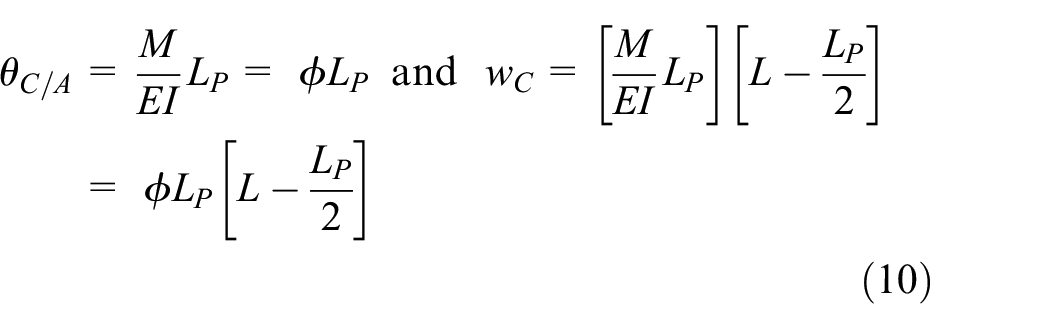
Equation (10) governs the slope and deflection of the extended substrate. It should be noticed here, that these expressions for the extended substrate are calculated considering the extended part as rigid body rotation because the actuating force from the piezo patch is only acting on the AB portion of the cantilever.
3. Fabrication and experimental set-up
3.1. Fabrication of PZT-steel cantilever sensors
The presented millimetre size unimorph cantilever sensors are fabricated with stainless steel (grade 304) base substrate material and PZT-5H (Doon Ceratronics Pvt. Ltd., India) as the sensing and actuating material. The pooling is along the thickness of the piezo patch which controls its piezoelectric properties. The base stainless steel plate and the PZT-5H patch are cut in dimension through micro-milling. The steel plate is having constant thickness throughout the length in the case of the rectangular cantilever sensor, but this plate is made step-shaped by reducing the thickness up to half of its length to fabricate the stepped cantilever sensor. Further, the piezo patch is bonded over the steel plate at one end with a highly conductive silver epoxy (MG Chemicals 8331, Canada). The wire soldering is done on it for electrical connection. The dimensions of these fabricated steel-piezo cantilever sensors are shown in the schematic Figure 3.
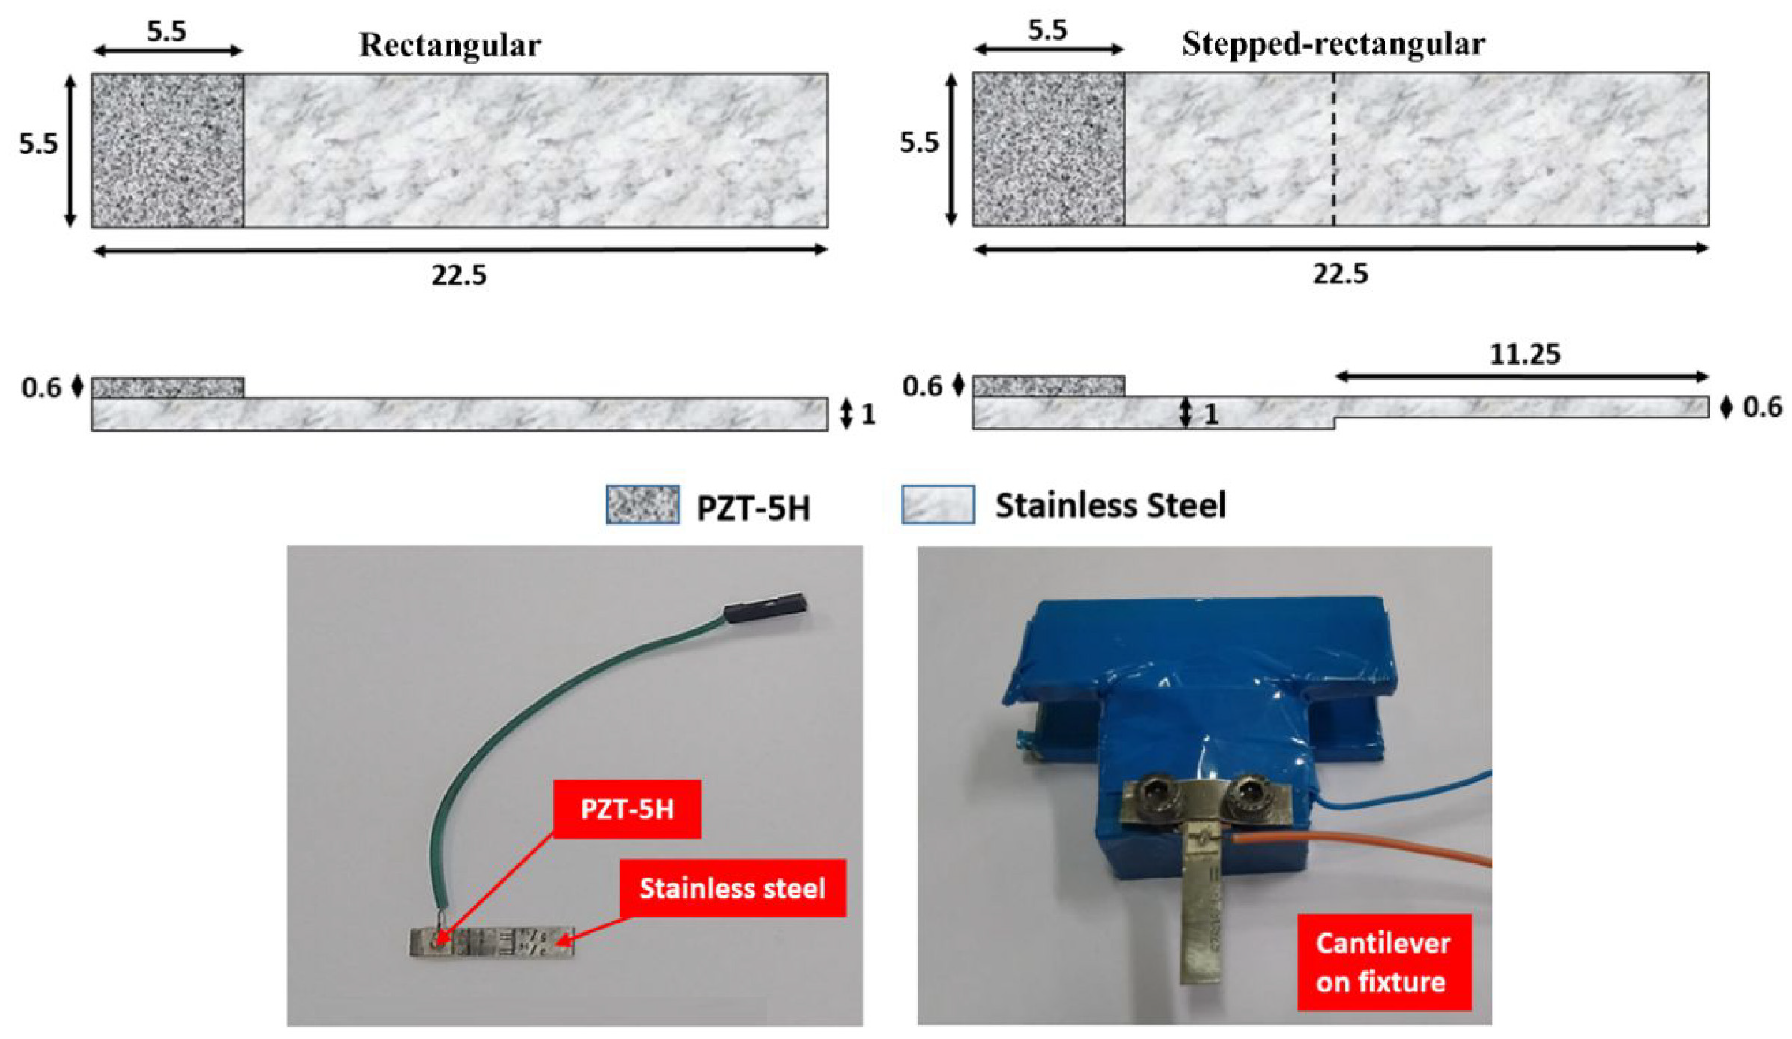
Schematic diagram and fabricated cantilever sensors.
Fabricated cantilever sensors are mounted on the fixture to perform the experiments. The piezoelectric actuating patch provides the cantilever sensors with a feature of self-vibration on providing the excitation frequency.
3.2. Experimental set-up
The fabricated cantilever sensors are operated in their dynamic mode for experimental analysis and study. This experimental set-up consists of a Wayne Kerr 6500B impedance analyser, a fluid container filled with the testing fluid and the fabricated steel-piezo cantilever sensors mounted on the fixture. The mounted cantilever sensor on the fixture is connected to the impedance analyser (Wayne Kerr 6500B) and the excitation frequency is swept. The series LCR circuit is selected for the analysis with 20 VDC bias voltages during the frequency sweeping and the detailed actuation phenomenon is explained in section 2. The frequency response of the cantilever sensors, in form of frequency versus phase angle, is obtained from the impedance analyser. The experimental setup is shown in Figure 4. Firstly, the cantilever sensors are operated in the vacuum and air. The experiments are performed in the approximate vacuum condition by putting the cantilever sensors in the vacuum chamber. A vacuum of approximately 60 torr is obtained with the help of a vacuum pump as shown in Figure 4.
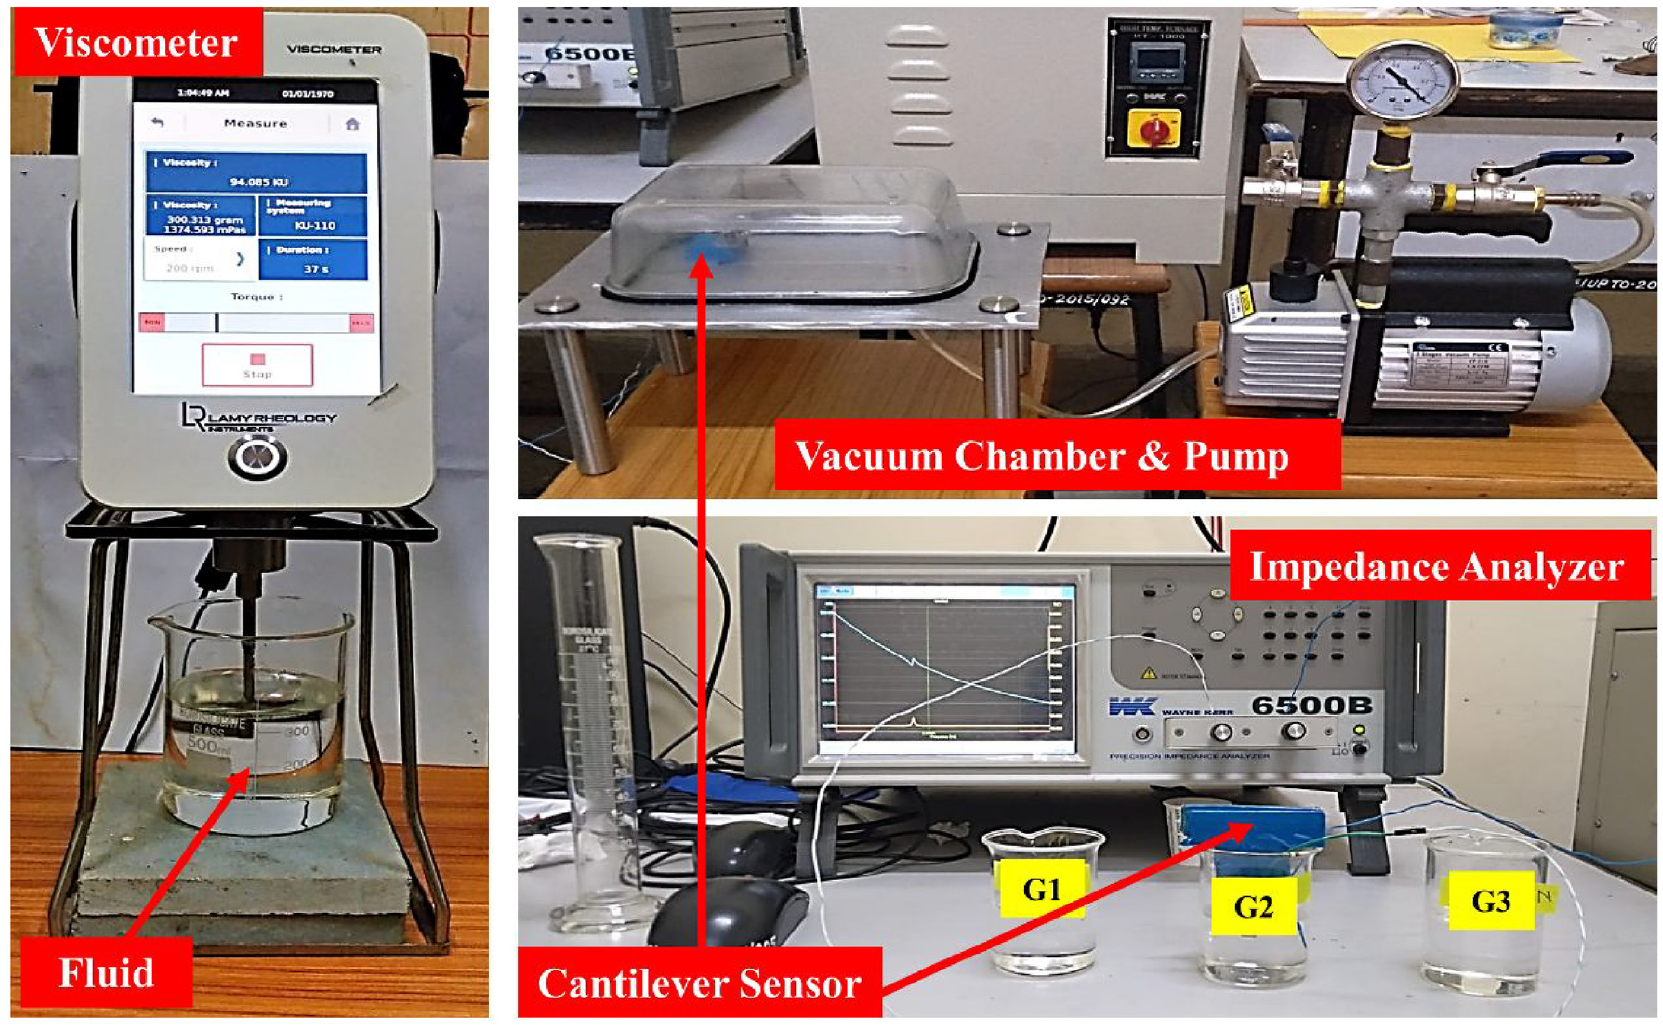
Experimental set-up showing viscometer, vacuum pump and impedance analyser.
For fluidic experiments, the cantilever sensors are operated in pure water and pure glycerin first. Afterwards, for further experiments, the mixtures of water and glycerin are prepared with varying concentrations of glycerin in them. The three mixtures G1, G2 and G3 contain 25% water + 75% glycerin, 50% water + 50% glycerin and 75% water + 25% glycerin by volume, respectively. The experiments are performed in these glycerin solutions to verify the frequency response of the cantilever sensors concerning density and viscosity change. All the fluids along with G1, G2 and G3 water-glycerin mixture are first characterized for their density and viscosity at room temperature of 25°C. The actual density (ρa) of all the fluid samples is defined by measuring their mass and volume directly and verified using a precise hydrometer. Further, the actual viscosity (ηa) of the fluids is checked on a rotating viscometer (B-one Touch, Lamy Rheology Instruments).
The obtained frequency response of the cantilever sensors in different fluidic media is utilized to calculate the density and the viscosity of the respective fluidic media, which are further compared with their actual values.
4. Results and discussions
4.1. Validation of the analytical approach
The derived analytical approach in this work is validated with numerical simulation. The numerical analysis is performed to calculate the deflection of the cantilever sensor on the application of voltage on its active part. The cantilever deflection obtained using curvature derived in the analytical method is compared with the numerical results of the cantilever sensor deflection. For these comparisons the design parameters of the cantilever sensor are as follows: Y1 = 60,606 MPa, Ym = 200,000 MPa, d13 = 2.74 × 10⁻⁷ mm/V, wp = 5.5 mm, tp = tm = 0.6 mm, Lp = 5.5 mm. For the numerical modelling, the material properties of the piezo patch (PZT-5H) are supplied from the material library and the same is used for the analytical analysis. The substrate material (stainless steel) is considered an isotropic material. The analysis is performed for the voltage range of 10–50 V and the variation of substrate length in a range of 5.5–26 mm. All the combinations of the applied voltage and substrate length are analysed for sensor deflection. Figure 5 shows the numerical analysis performed corresponding to the 10 and 20 V applied on the active piezo part of the cantilever sensor.
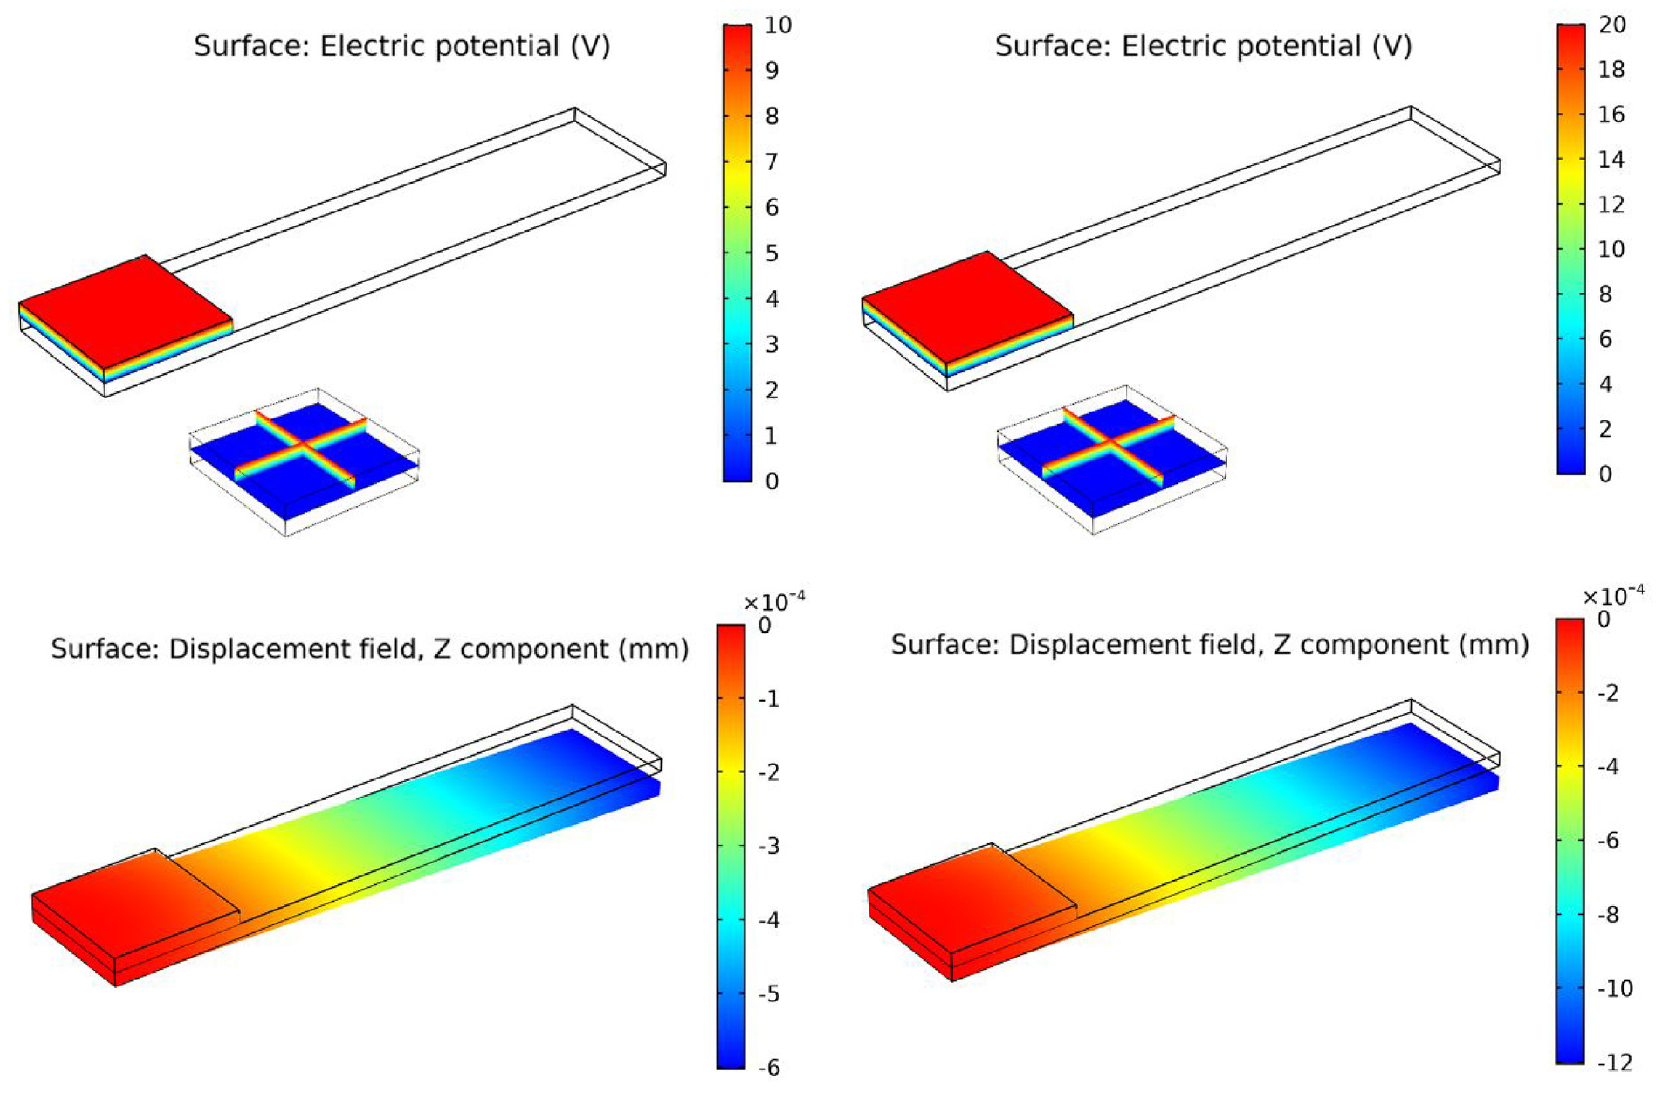
Numerical analysis.
Figure 6 shows the maximum deflection of the composite part of the cantilever sensor on the application of the different voltages on it. The increasing length of the substrate does not affect the deflection of the composite part. The maximum tip deflection of this part increases in the same proportion as the voltage applied to it. It can also be observed referring to analytical equations (9) and (6), which show that the deflection is proportional to the curvature and the curvature is directly affected by the electric field applied to the active part of the sensor. In short, the voltage on the active part directly affects the curvature or deflection of the sensor.
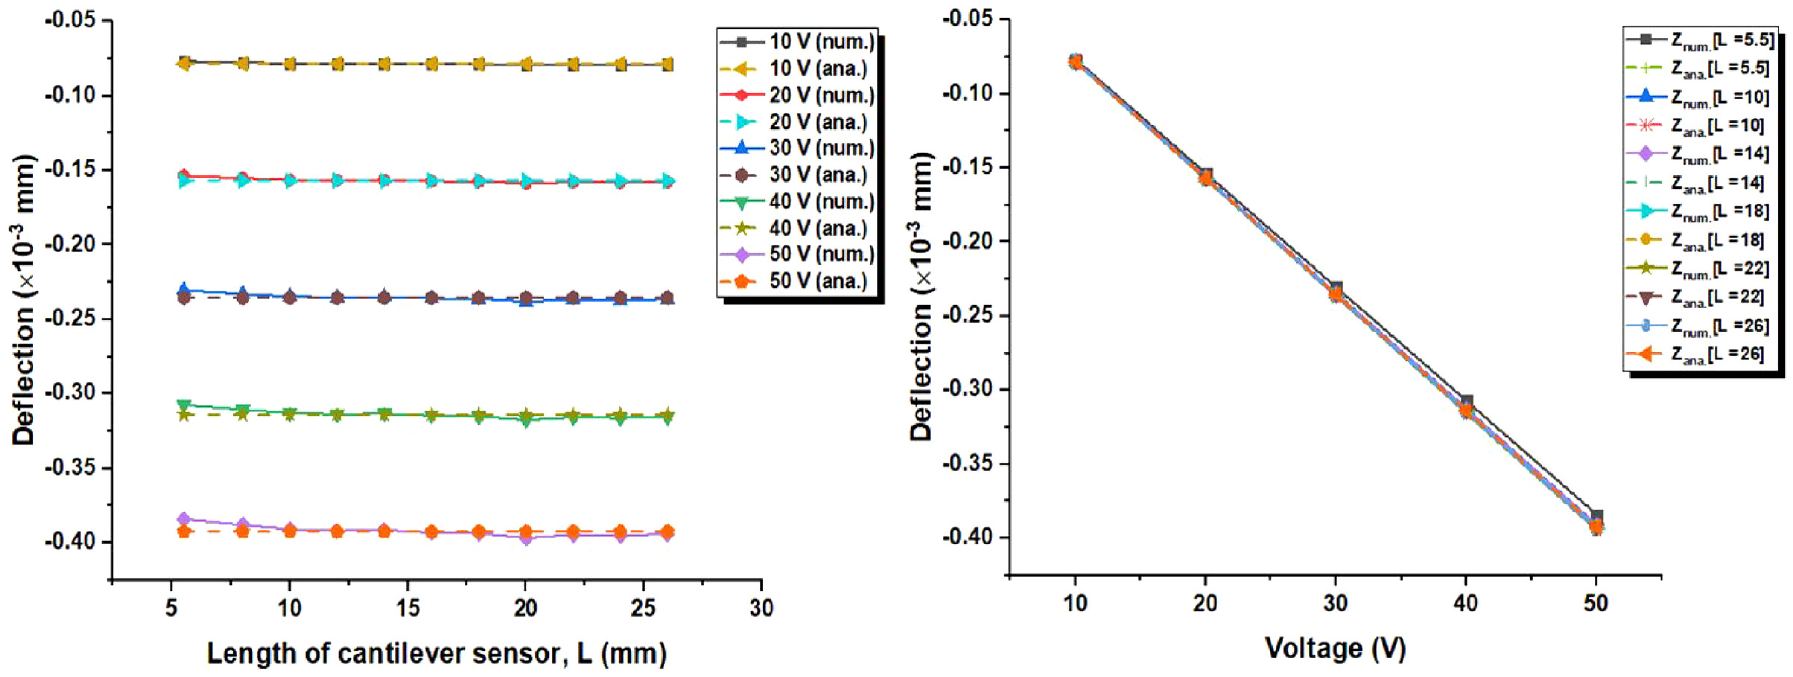
Numerical and analytical results comparison for piezo tip deflection.
The analytical and numerical results for the composite part tip deflection caused by the applied voltage are also compared in Figure 6. The maximum deviation between analytical and numerical results is 2.14%, which validates the analytical formulation. The analytical and numerical results are verified at different voltages and different substrate lengths, and the deviation between the two is observed independent of the applied voltage and the substrate length of the cantilever sensor.
4.2. Frequency response in fluidic media
The frequency response of the cantilever sensors in different fluidic media is obtained in form of phase angle variation with the excitation frequency, using the impedance analyser. These frequencies versus phase angle plots represent the resonance spectra of the cantilever sensors at room temperature (25°C) as shown in Figure 7.
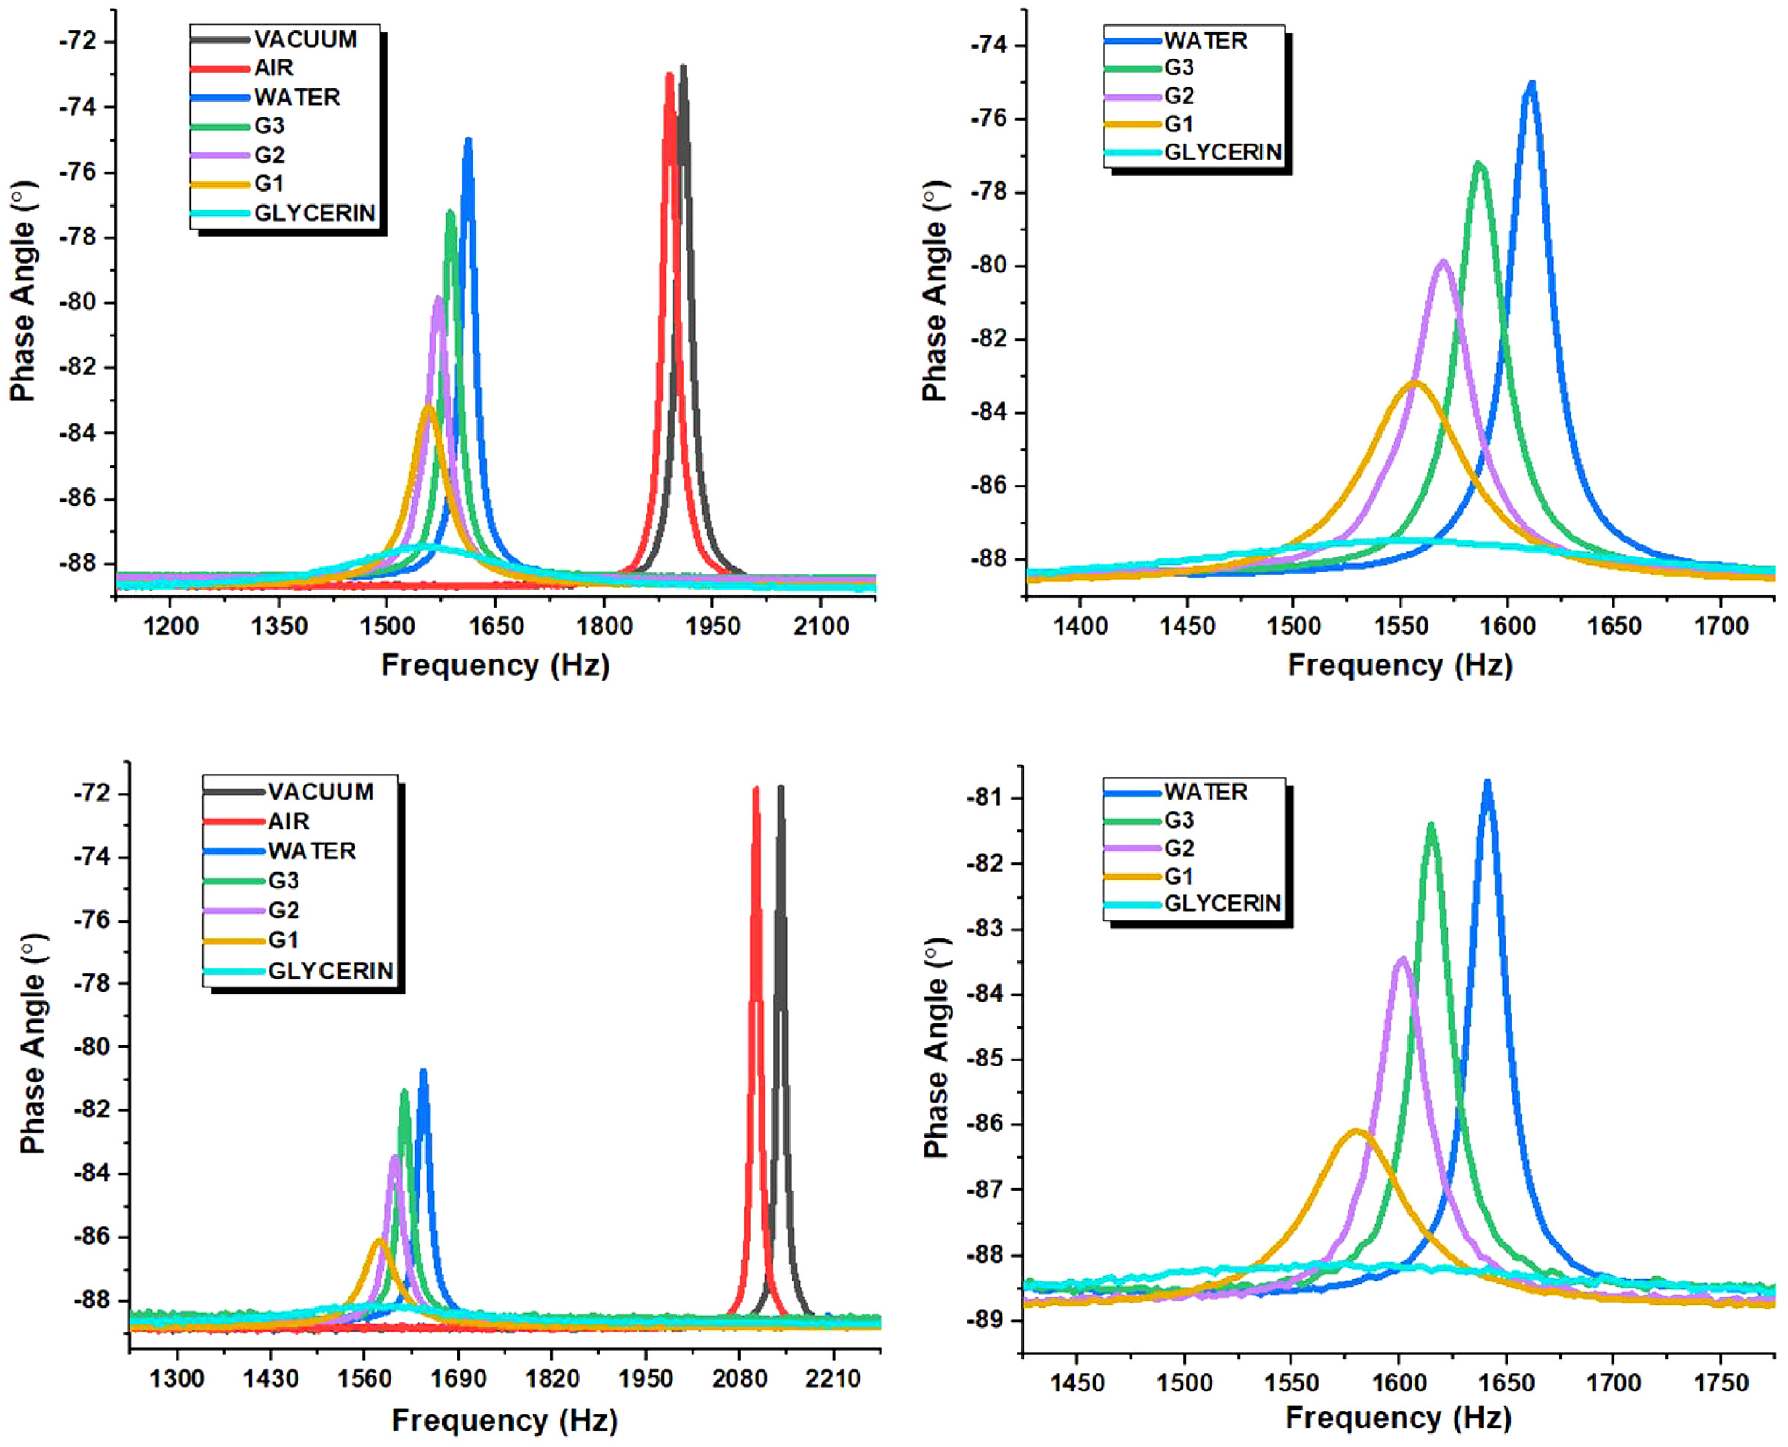
Resonance spectra of the cantilever sensors in different fluidic media (rectangular cantilever (top), stepped cantilever (bottom)).
The peak in the frequency response under different fluidic media represents the resonance peak and the frequency corresponding to the resonance peak is the resonant frequency of the cantilever sensor in that fluidic media. In the resonance spectra of the cantilever sensors, the shift of the resonance peak, peak height and peak width at the half height is significantly important for sensing with the cantilever. The peak width at half height is defined as the full width at half maximum (FWHM). Further, the FWHM and resonant frequency (fe) collectively define the quality factor (Q-factor) of the frequency response of the cantilever sensor as Q =fe/(2. FWHM). Thus, as soon as the height of the peak decreases its FWHM increases and the Q-factor decreases.
The resonance spectra of the cantilever sensors change on changing the operating fluidic media. This happens because the distinct fluidic properties of different fluidic media affect the resonant frequency as well as the Q-factor of the cantilever sensors. The density of the operating fluidic media offers an inertial load to the vibrating cantilever. This inertial load is responsible for the shift in resonance peak and change in the resonant frequency. On the other hand, the viscosity of the operating fluidic media offers a viscous loading to the vibrating cantilever. This viscous loading changes the height and width of the resonance peak and controls the FWHM and the Q-factor of the cantilever frequency response. The viscous loading also affects the resonant frequency of the cantilever, but very less in comparison to the inertial loading.
The cantilevers are first operated in the approximate vacuum condition to get the reference fundamental resonant frequency of the sensors. As the operating media of the cantilever sensors is changed from vacuum to air, a minor shift in the resonance peak is observed because the air molecules exerted inertial loading on the cantilevers and therefore reducing the frequencies a bit. In this case, the change in the Q-factor is negligible because of the very low viscous loading of air. Further on changing the operating condition from air to water and other fluidic media, a major shift in the resonance peak and significant change in the Q-factor of the cantilever sensors is observed because of the previously mentioned fluidic loads (Figure 7). Increasing the glycerin concentration in the fluidic mixture increases its density and viscosity as well. The higher density and the viscosity of the fluid offer higher inertial and viscous loads to the vibrating cantilever, respectively. The peaks shift towards the left (lower frequency) as soon as the concentration of the glycerin in the operating media increases. This happens because of the higher inertial loading on the cantilever due to the higher density of the surrounding operating media. Also, the height of the peaks (which is directly related to the quality factor) reduces with the increment of the glycerin concentration in the operating media because of the higher viscous loading to the cantilever due to the viscosity increment of the operating media. The resonance peak height of both the cantilever sensors in the vacuum and air is higher as compared to the water and glycerin operating media. And, these peaks are very dull in the pure glycerin because of the high viscous loading applied by the glycerin on the vibrating cantilever sensors.
The frequency response of the cantilever sensors in the water, glycerin and varying concentration glycerin solution are shown separately on the right side of Figure 7 for more clarity of the vibrational behaviour of the cantilever sensors. The resonant frequency (fe), FWHM and Q-factor of the cantilever sensor’s resonance spectra in vacuum and different fluidic media are found and tabulated in Table 1.
Resonance spectra outcomes of the rectangular and stepped cantilever sensor in different media.
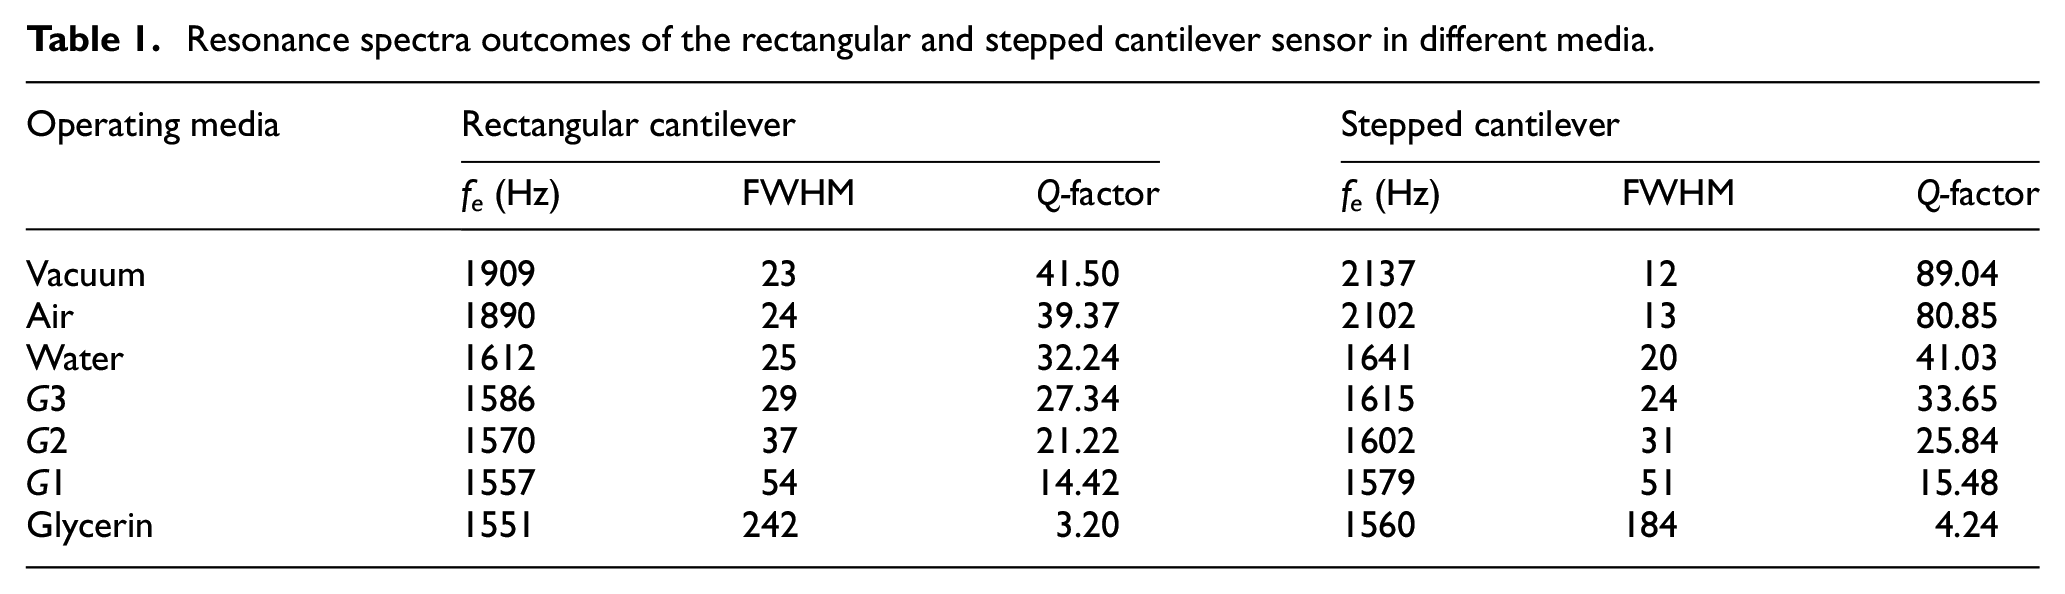
The resonant frequency of both the cantilever sensors is highest in the air operating condition compared to the other denser fluids, while the FWHM is minimum in this case. Pure glycerin operating medium reflects the highest FWHM and lowest resonant frequency of the cantilever sensors. The resonant frequency of the stepped cantilever sensor is higher compared to the rectangular cantilever sensor in all the operating conditions because of its higher base stiffness to mass ratio. The stepping of the cantilever is done from its free end side and the fixed base of the cantilever is not changed geometrically. So this type of stepping of the cantilever reduces its mass effectively but it hardly affects its base stiffness, which in turn increases its resonant frequency. This stepped cantilever design can also maintain a better Q-factor in all operating conditions compared to the rectangular cantilever sensor.
The repeatability of both the cantilever sensors is checked under vacuum and water operating conditions. These experiments are repeated five times with an interval of 1 min under the same operating state. The presented resonance frequencies of both the cantilevers in this work show approximately 0.02%–0.05% deviation (in the case of vacuum and water operating conditions) from the mean value of all the repeated experiments. The values of the standard deviation (S.D.) for the set of experimental resonant frequencies are 0.811 and 1.109 for the rectangular cantilever in vacuum and water operating conditions, respectively. These values of S.D. are 1.048 and 1.212 in the case of the stepped cantilever sensor. The presented values of S.D. reflect good repeatability of both the cantilever sensors.
4.3. Density assessment
The frequency response of the cantilever sensors is used for the density assessment of the operating fluidic media. The resonant frequency of the cantilevers is the main required frequency response parameter for the density estimation of the operating media. As soon as the vibrating cantilever is moved from vacuum to a fluidic media or from a low dense fluidic media to a higher-dense fluidic media, its resonant frequency shifts down. This phenomenon occurs because of the reason that the density of the operating media put an inertial loading on the vibrating cantilever. The inertial loading offered by the fluid is directly proportional to its mass density. This inertial load acts as an added mass on the cantilever, which shifts down its resonant frequency.
The resonant frequency of the cantilever sensors is highest in the air operating condition compared to the other denser fluids and the pure glycerin operating medium reflects the lowest resonant frequency of the cantilever sensors. The actual densities of all the fluidic media are first checked before the experiments were performed. The actual density of glycerin is measured first, which is found 1270 kg/m3. The density of prepared water-glycerin solution is found in a range of 1088–1225 kg/m3. Figure 8 shows the density variation of the operating fluidic media with the glycerin concentration in it. Pure water and pure glycerin are represented as 0% and 100% of the glycerin volume percentage. The other three mixtures of the water and glycerin (G1, G2 and G3) have 75%, 50% and 25% of glycerin volume, respectively. The density of the mixture is directly increasing linearly with the increment of the glycerin concentration in the mixture. Figure 8 also shows the resonant frequency variation of the cantilever sensors in the different fluidic media tested. The resonant frequency of both the cantilever sensor is observed to decrease linearly with the increment of the glycerin concentration in the fluidic media. In Figure 8, the green data points show the density variation with the glycerin concentration variation in the fluidic mixture and the red data points represent the resonant frequency decrement with the glycerin concentration increment in the mixture. As soon as the glycerin concentration increase in the mixture its density increases which results in the decrement of the resonant frequency of the vibrating cantilever sensors.
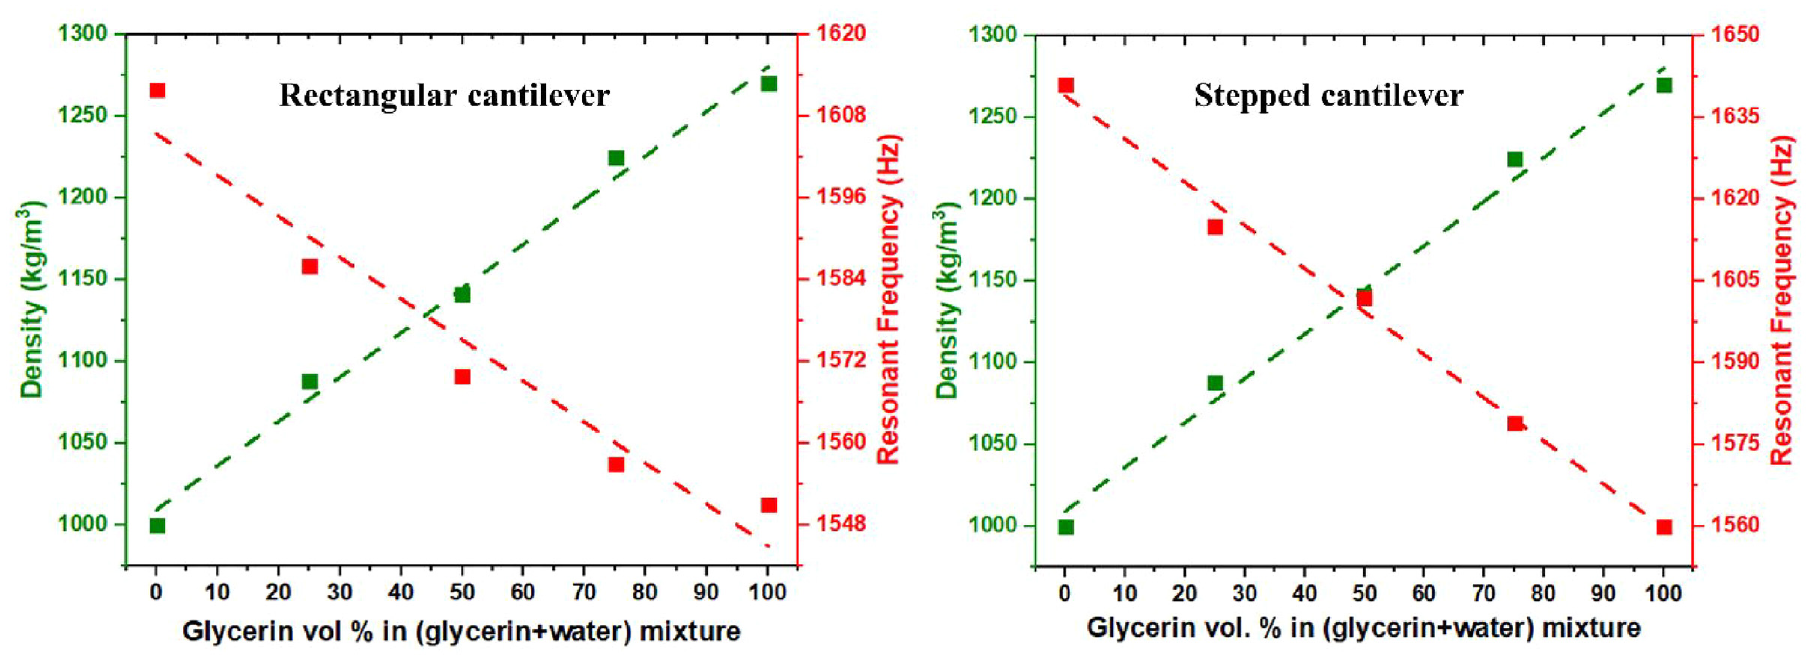
Density of the media and resonant frequency of the cantilever sensors corresponding to glycerin concentration in fluidic media.
The resonant frequency of the rectangular cantilever sensor in vacuum and air operating conditions is found 1909 and 1890 Hz, respectively. The resonant frequency shifts down by 297, 323, 339, 352 and 358 Hz when the operating condition are changed from vacuum to glycerin passing through water and water-glycerin solution operating conditions. Similarly, the resonant frequency of the stepped cantilever sensor in vacuum and air operating conditions is found 2137 and 2102 Hz, respectively. The resonant frequency shifts down by 496, 522, 535, 558 and 577 Hz when the operating condition are changed from vacuum to glycerin passing through water and water-glycerin solution operating conditions. The higher resonant frequency shift of the stepped cantilever in comparison to the rectangular cantilever in all the cases reflects its higher sensitivity.
The shift in the resonant frequency of the cantilever sensors occurs in such a way that provides a linear fitting between the density of the operating fluidic media and the resonant frequency of the cantilever sensors (Figure 9). The density of the air is considered 1 kg/m3 and the resonant frequency of the rectangular and the stepped cantilever sensor in air operating condition are 1890 and 2102 Hz, respectively. These data points representing the air density and the corresponding resonant frequency are far away in the fitting plots from the other operating media data points. So, the water and glycerin operating media plots are highlighted in Figure 9 separately (right side) for more clarity.
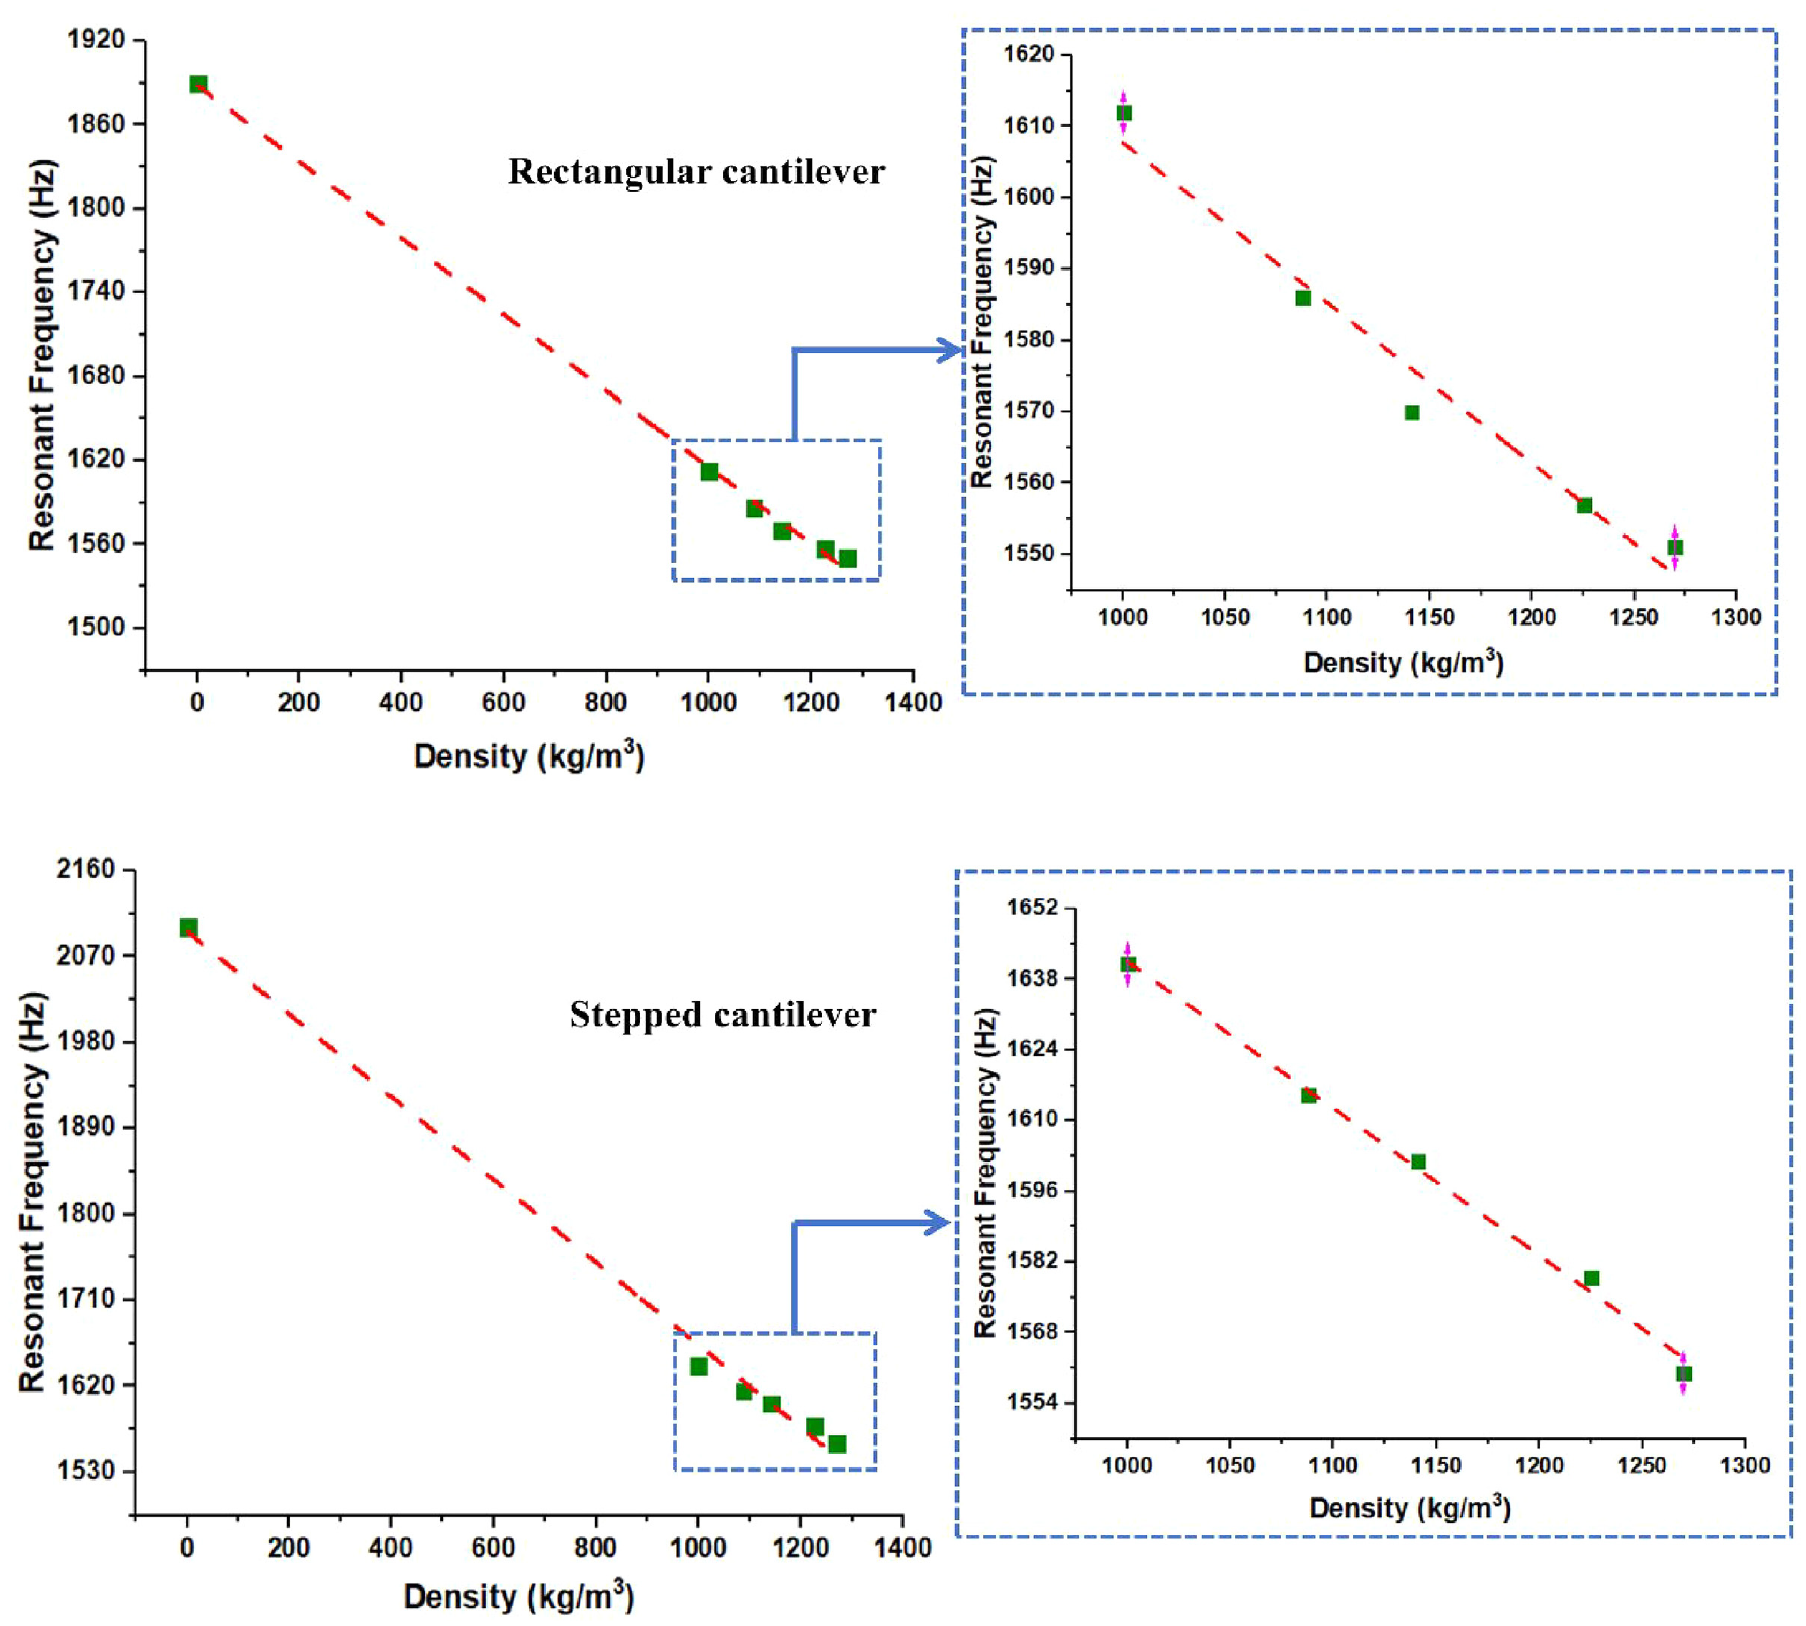
Linear fitting between the density of the operating media and the resonant frequency of the cantilever sensors.
The linear fitting between the cantilever sensor resonant frequency (fe) and the operating fluid density (ρc) is defined as follows:

where, a and b are the linear fitting constants. The value of a is 1832.56 and 1932.81, respectively for rectangular cantilever and stepped cantilever sensors. And, the value of b is −0.22481 and −0.29124, respectively, for the two cantilever sensors.
The densities of the mentioned operating fluidic media are calculated using the correlations obtained from the presented linear fitting. The calculated densities using the correlation are found quite closer to the actual measured values with a maximum error of less than 2.5% as shown in Table 2.
Density assessment results.
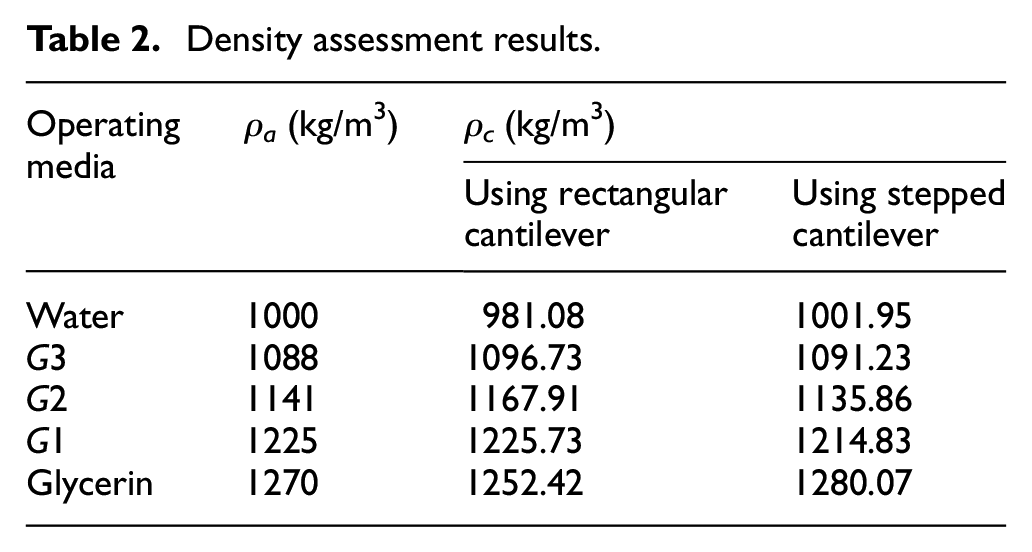
The slope of the fitted straight line for the stepped cantilever sensor is larger compared to the slope of the fitted straight line for the rectangular cantilever sensor. This represents the larger variation of the resonant frequency of the stepped cantilever with the same density variation. Thus, the density measurement sensitivity is better in the case of the measurement with the stepped cantilever sensor compared to the rectangular one. The sensitivity of the density measurement (Δfe/Δρ) of the stepped cantilever sensor is found approximately 29.5% higher compared to the rectangular cantilever sensor. Overall, the stepped cantilever sensor is found more sensitive for the density estimation of the different operating media in a density range of 1000–1270 kg/m3.
4.4. Viscosity assessment
The viscosity assessment of the water-glycerin solutions is done using the FWHM and Q-factor of the frequency response of the rectangular and stepped cantilever sensors. As soon as the vibrating cantilever is moved from vacuum to a fluidic media or from a low viscous fluidic media to a higher viscous fluidic media, the FWHM of the vibrating cantilever increases. This phenomenon occurs because of the reason that the viscosity of the operating media put a dissipative viscous loading on the vibrating cantilever. This dissipative loading offered by the fluid is directly proportional to its viscosity, which reduces the vibrational energy of the cantilever by offering viscous damping. The resonant peak height of the cantilever sensor is reduced because of this dissipative load and its FWHM increases. The Q-factor of the cantilever sensor decreases with the increment of FWHM.
The viscosity of all the fluidic mediums is first checked on the viscometer before the experiments with the cantilever sensors are performed. The actual viscosity of the glycerin is measured first, which is found 1368.24 cP. Further, the viscosity of prepared water-glycerin solutions (G3, G2 and G1) is found in a range of 12.82–41.35 cP. The FWHM and Q-factor of the two cantilever sensors are obtained from the frequency response in different operating conditions. It is found that the FWHM of the cantilever sensors is lowest in the air operating condition compared to the other denser fluids and the pure glycerin operating medium reflects the highest FWHM of the cantilever sensors. Figure 10 shows the change in the FWHM of the frequency response of the two cantilever sensors with the glycerin concentration increment in the operating fluidic media. The variation of the viscosity of the fluidic media with the glycerin concentration is also shown in Figure 10. It can be observed from this figure that the mixing of water in glycerin drastically reduces its viscosity because the water has a very low viscosity (
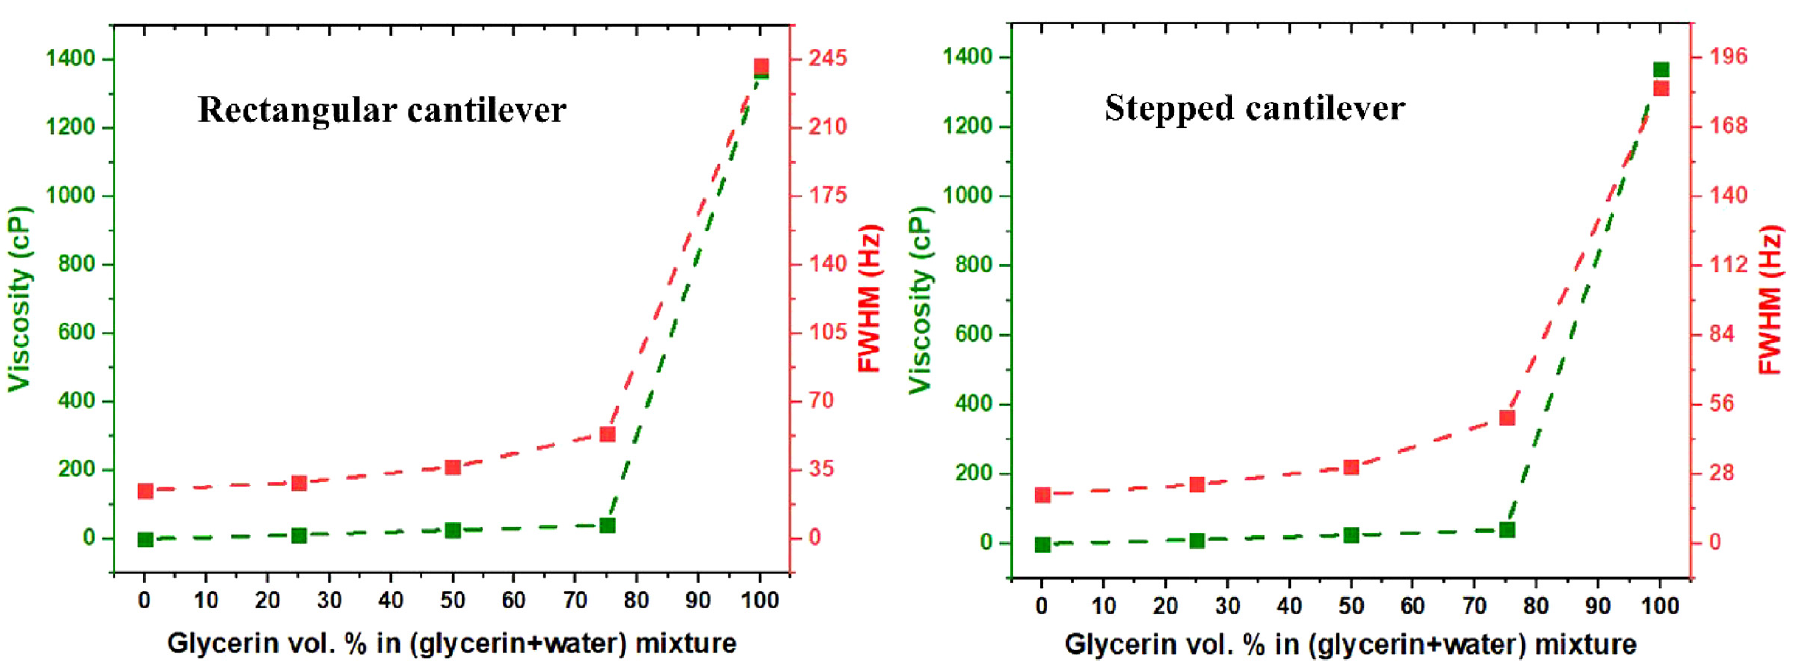
Viscosity of the media and FWHM of the cantilever sensors corresponding to glycerin concentration in fluidic media.
For the viscosity assessment, the normalized values of the FWHM and Q-factor corresponding to the operating media are plotted against the viscosity of the respective media as shown in Figure 11. The normalized values (FWHM n and Qn) are obtained by considering the water as a reference. As the FWHM and Q-factor reflect the opposite trend with the viscosity increment of the operating media, the FWHM n and Qn are also defined differently as shown in Figure 11. The normalized parameters are curves fitted with the viscosity of the three glycerin solutions. And, the viscosity of these solutions is estimated through the curve-fitting analysis of the presented graph. FWHM n and Qn reflect the linear correlation with the viscosity of the operating media. The normalized values of FWHM and Q-factor are used as these values can be easily linear fitted with the viscosity of the operating media and make the viscosity estimation easy utilizing the linear relations.
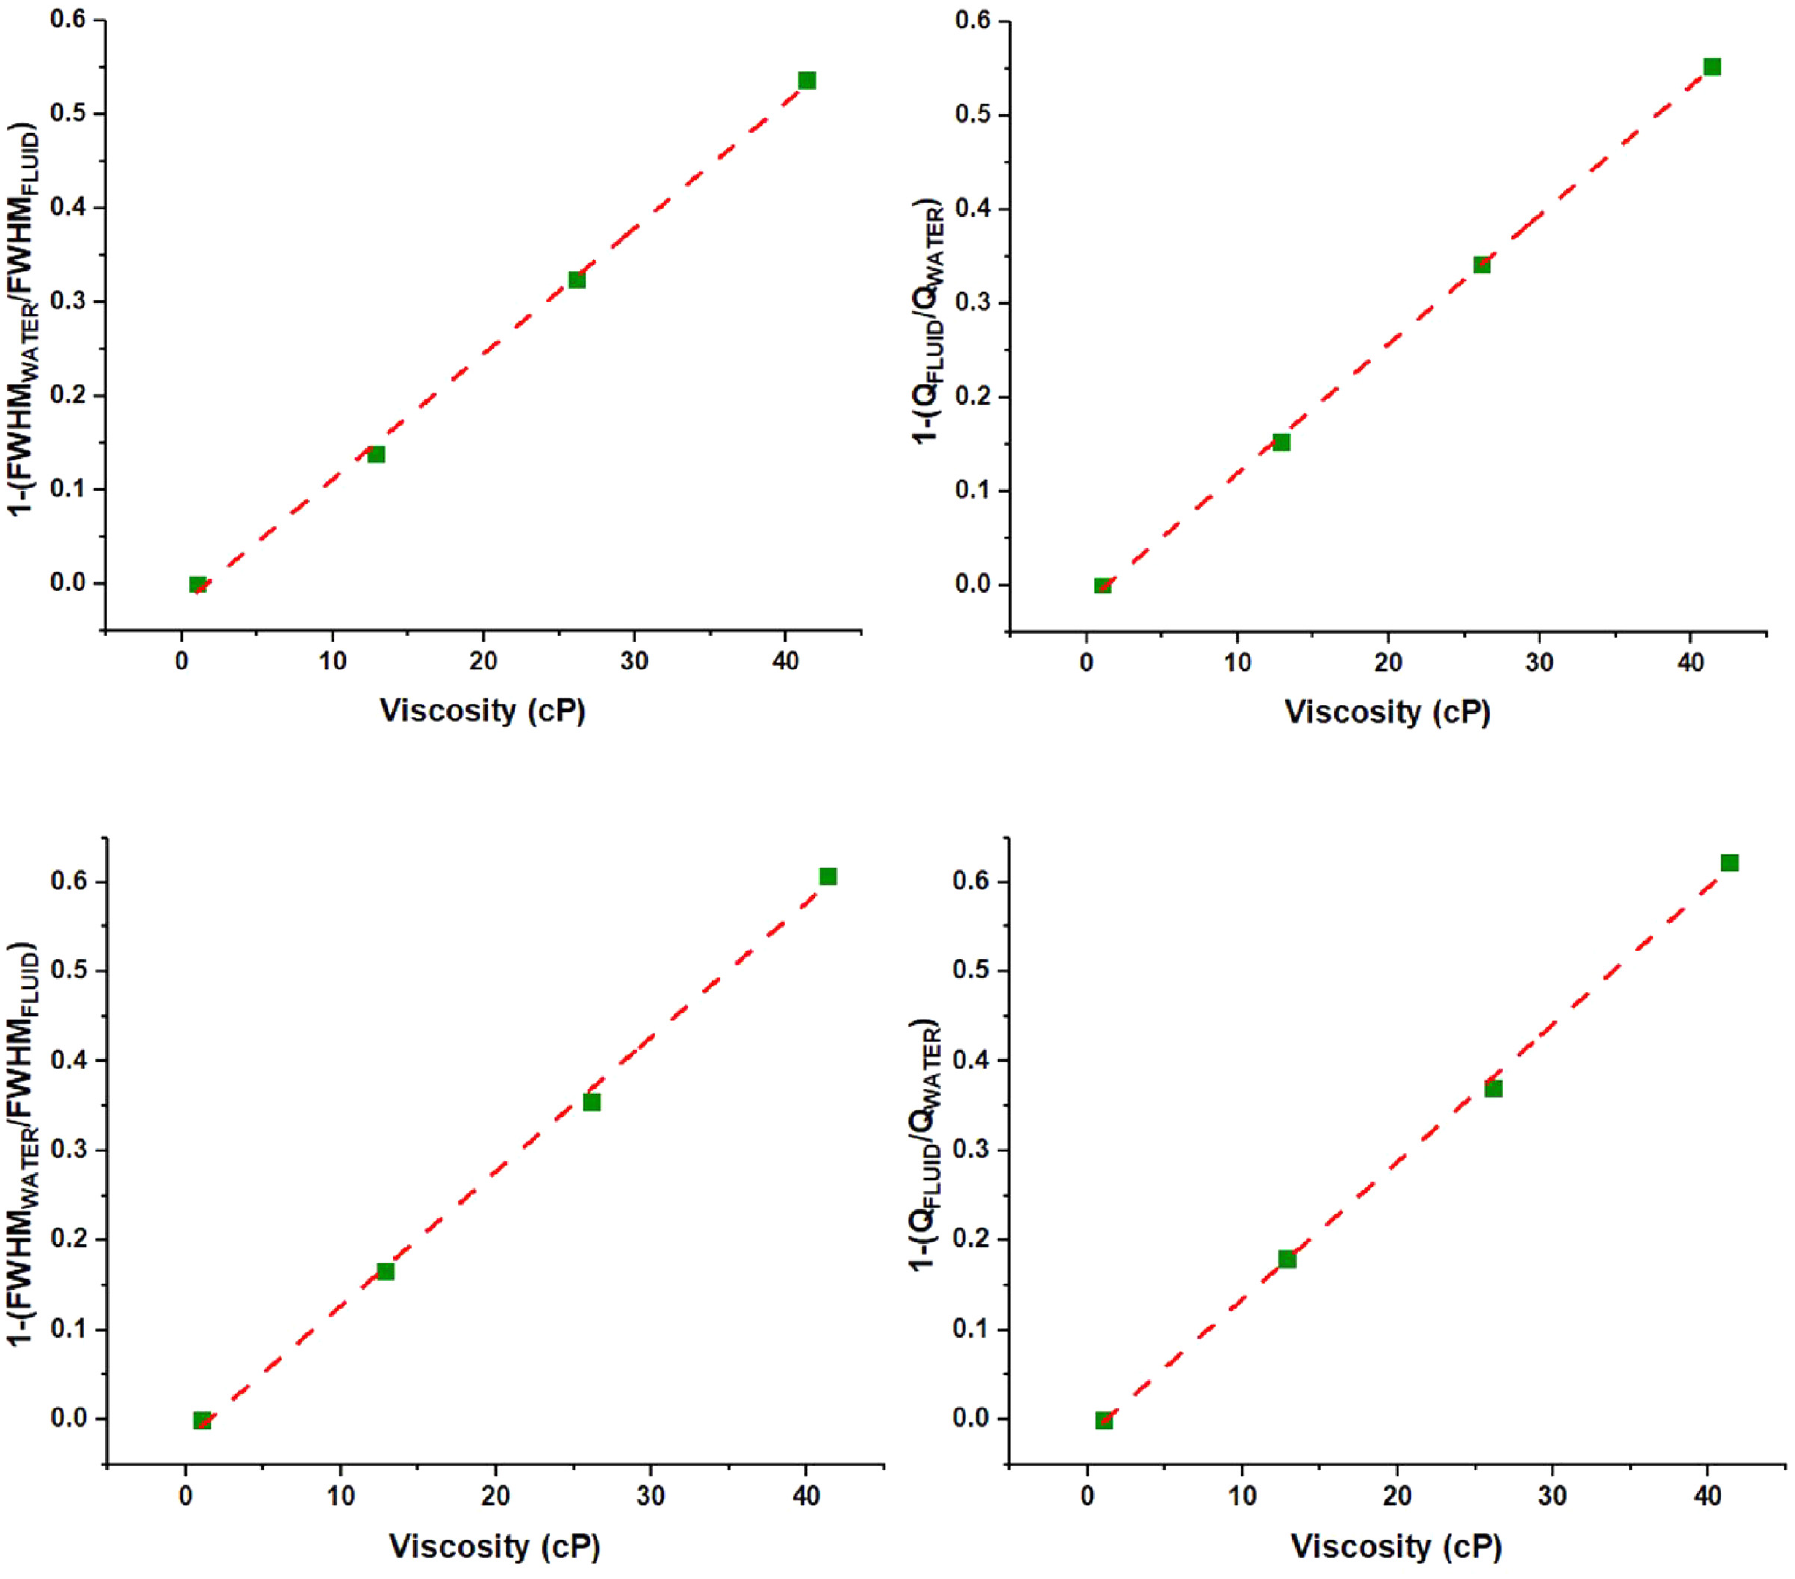
FWHM n and Qn plots corresponding to the viscosity of the operating media (rectangular cantilever (top), stepped cantilever (bottom)).
The linear curve fitting relation between the normalized frequency response parameters (FWHM n and Qn) and the viscosity of the fluidic operating media is given by equations (2) and (3) as follows:


where, η1 and η2 are the viscosity of the operating media calculated using FWHM n and Qn of the cantilever sensors, respectively. α, k, β and m are the linear fitting constants.
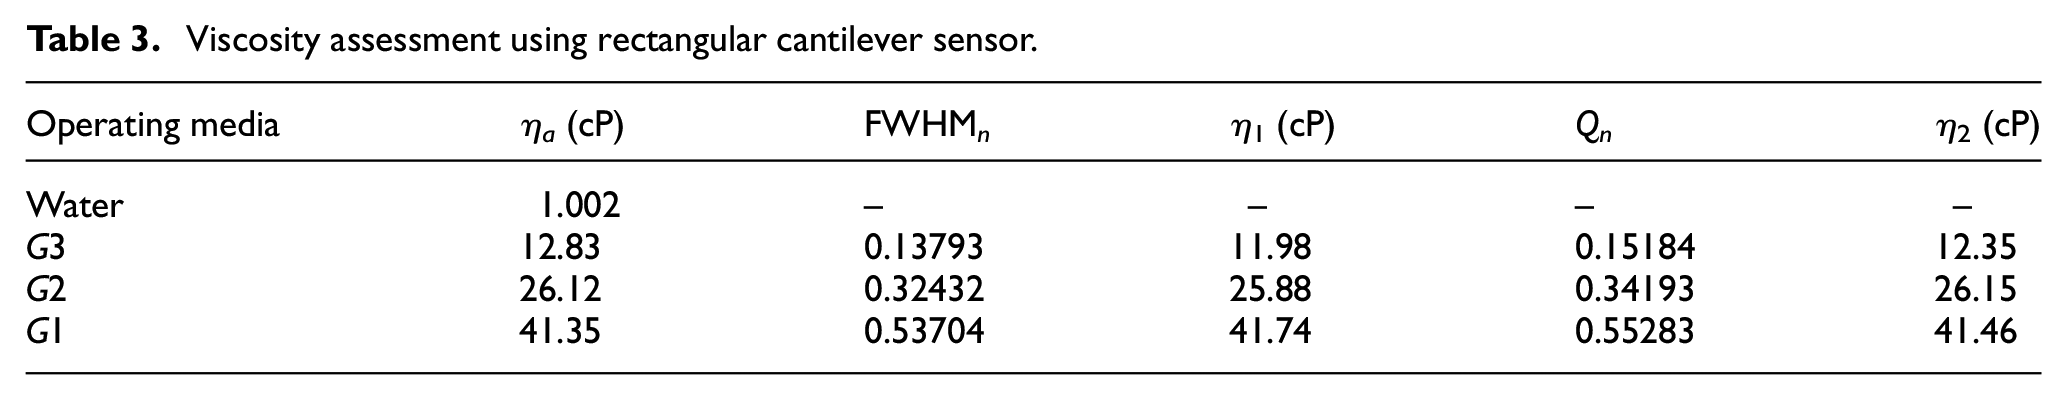
The viscosity calculated using the curve fitting relations is given in Tables 3 and 4. These calculated viscosities are compared with the actual values of the viscosity. Both, the calculated and actual viscosity of the water and glycerin solutions, are in quite good agreement with each other.
Viscosity assessment using rectangular cantilever sensor.
Viscosity assessment using stepped cantilever sensor.
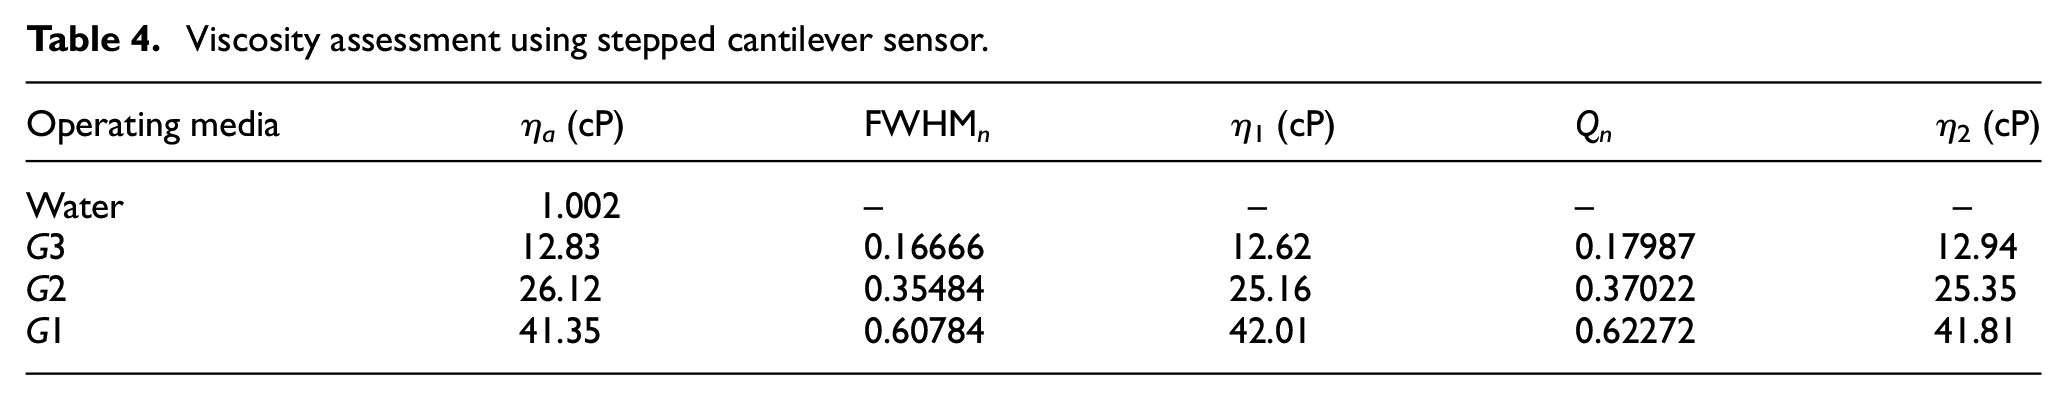
Table 3 shows the viscosity calculated with the rectangular cantilever sensor’s frequency response parameter and Table 4 shows the same for the stepped cantilever sensor. The viscosity assessment with the stepped cantilever sensor is more accurate and closer to the actual measured value of the fluidic viscosity. On the other hand, the viscosity calculated using normalized Q is more accurate and closer to the actual viscosity value compared to the viscosity calculated using the normalized FWHM. The reason behind this is that the viscosity calculated using normalized Q includes the effect of the FWHM as well as the resonant frequency because the Q-factor is calculated involving the FWHM and the resonant frequency of the respective cantilever sensor.
Overall, this research presents a new unimorph-based analytical modelling for a piezoelectric cantilever sensor and the rheological assessment of the fluids using the frequency response of the cantilever sensor. The presented assessment of the properties of the fluidic media is independent of the cantilever immersed length in that media. Further, there is no need to fully immerse the cantilever in the fluidic media which can resolve many operational troubles. The improved profile of a millimetre-size cantilever designed and fabricated in this work can sustain its quality factor in viscous media with improved sensitivity. The novel outcome of the research produces a fluidic sensing device with an improved design for online fluidic measurement at a low fabrication cost and an easy and quick procedure of operation. The application of the presented cantilever sensors is limited to liquids which are not hazardous to the metals for a short time of contact.
5. Conclusions
The analytical expression for the bending curvature and deflection of a piezo-based unimorph cantilever sensor is derived in terms of the constituent properties and the electric field applied. The analytical formulation is further validated with the numerical results. The work also presents a hassle-free simultaneous assessment of the fluidic density and viscosity using the frequency response of piezoelectric cantilever sensors. The rectangular cantilever sensor profile is modified to a new stepped profile, for better performance. The resonant frequency and Q-factor of the stepped cantilever sensor are found quite higher compared to the rectangular one, in all the operating conditions. Further, an effort is made to correlate the difference in the resonant frequency to the fluidic density, and the difference in the FWHM (and Q-factor) to the fluidic viscosity. The density measuring the sensitivity of the stepped cantilever sensor is found approximately 29.5% higher compared to the rectangular cantilever sensor. Also, the viscosity assessment with the stepped cantilever sensor is more accurate compared to the viscosity obtained using rectangular cantilever sensor. On the other hand, the viscosity calculated using the normalized Q-factor is more accurate compared to the viscosity calculated using the normalized FWHM. The reason behind this is that the normalized Q-factor method includes the effect of the FWHM as well as the resonant frequency. Overall, the sensing performance of the stepped cantilever sensor is found better, and they can be successfully used for density and viscosity measurement of range 1000–1270 kg/m3 and 12.82–41.35 cP, respectively.
Footnotes
Declaration of conflicting interests
The author(s) declared no potential conflicts of interest with respect to the research, authorship, and/or publication of this article.
Funding
The author(s) received no financial support for the research, authorship, and/or publication of this article.
Ethical approval
This article does not contain any studies with human participants or animals performed by any of the authors.