
Abstract
The current research on piezoelectric energy harvesting in the field of rail transport mainly focuses on the structural design of piezoelectric energy harvesters (PEHs). The effect of installation of PEHs on the dynamics of the vehicle-track system has not been fully understood, which, however, is critical for ensuring operational safety due to the additional devices attached to the track structure. On the other hand, these PEHs may have lower performance with improper design parameters without the understanding of the coupled dynamics of the vehicle-track system. In this paper, employing the piezoelectric smart backing ring (PSBR), a dynamic model of the vehicle-floating slab track-energy harvester coupled system is developed to study the effect of installations on its dynamic behavior. In the model, the energy harvester is introduced by only considering its equivalent stiffness. Both single and multiple energy harvesters are considered. The results indicate that when the equivalent stiffness exceeds 1×10⁹ N/m, the installation of the harvester has almost no effect on the dynamic performance. Further, with the guidance of the developed model, two kinds of improved designs are proposed based on the piezoelectric tube stacks (PTSs) for performance enhancement. The improved design I is realized by decreasing the cross-sectional area and the number of piezoelectric stacks (PSs), and the improved design II is realized by further increasing the layer number of the PS on the basis of improved design I. The energy harvesting performance (EHP) of two improved designs is tested under both harmonic and steel-spring fulcrum forces, and comparisons are also made with the experimental results of the previous design. The results demonstrate that, in comparison to the previous design, both of the improved designs exhibit enhanced electrical outputs, notably in terms of the open circuit voltage amplitude (OPVA) and maximum average power (MAP) under harmonic force conditions, as well as the voltage peaks, power peaks, root mean square (RMS) power and maximum total energy (MTE) across ten cyclic steel-spring fulcrum force signals. In particular, for the improved design II, the MTE can reach up to about 2.4129 J for ten cyclic signals, marking a significant enhancement of roughly 2.86 times compared to the previous design. The present work provides a valuable guidance for the optimization design and installation of PSBRs.
Keywords
1. Introduction
In recent years, piezoelectric energy harvesting technique has received wide attention in the railway system (Bosso et al., 2021; Qi et al., 2022; Zuo et al., 2023). A main aim is to solve the power supply problem of the wireless monitoring systems along the railway line. Compared to the electromagnetic energy harvesting technique that usually has the harvesters with complicated construction and relatively larger volume and mass (Hou et al., 2018; Hou et al., 2020; Lin et al., 2018a; Lin et al., 2018b; Wang et al., 2015; Zhang et al., 2017), the piezoelectric vibration energy harvesting technique has the harvesters with simple structure, small volume, no electromagnetic interference, easy miniaturization and easy integration with the wireless sensor network node (Hou et al., 2021; Wang et al., 2015). However, the power level of piezoelectric-based harvesters is lower, making it difficult for them to achieve the power output of electromagnetic-based harvesters, which can reach several Watts, or even tens of Watts (Hou et al., 2018; Hou et al., 2020; Lin et al., 2018a; Lin et al., 2018b). Such limitation will hinder the development and application of this technique. The performance enhancement of piezoelectric energy harvesters (PEHs) is a hot research area.
At present, many achievements have been obtained about the structural design of the harvesters. The earlier forms mainly include piezoelectric patch (Cahill et al., 2014; Wang et al., 2015), piezoelectric cantilever (Dong et al., 2022; Gao et al., 2016; Yang et al., 2021; Zhang et al., 2018), piezoelectric drum (Yuan et al., 2014) and piezoelectric stack (PS) (Cao et al., 2023; Cao et al., 2022; Wang et al., 2015). Among them, the piezoelectric patch, piezoelectric cantilever, and piezoelectric drum mainly utilized the d31 mode, therefore the conversion efficiency from mechanical energy to electrical energy is not high. The piezoelectric stack (PS) can utilize the d33 mode for larger electromechanical conversion efficiency, but due to the very small loading input, the generated power level is relatively small.
Recently, some methods have been tried to enlarge the loading input. One is to adopt the combination of the PS and the force amplifying frame. Min et al. (2023) developed a novel of arch beam piezoelectric stack energy harvester (PSEH), which can be placed below the rail to harvest the vehicle-induced vibration energy. The energy harvester is capable of generating an output power of approximately 193 mW. Min et al. (2024) designed a bridge-shaped PSEH based on the track vibration characteristics, specifically targeting large loads and low frequencies. This design is capable of achieving a maximum output power of 42.76 mW. Shan and Zhu (2022) proposed a rhombus with hinges-type PSEH based on the frequency up-conversion mechanism. This device can be attached to the rail to scavenge energy from railway track vibrations. The energy harvester boasts a maximum output power of 495.74 mW. Sheng et al. (2022) designed an efficient dynamic-magnified PEH by combining four rhombus-type PSEHs with a dynamic amplifier that comprises of a mass block and tuning springs. This system can be arranged at the bottom of the railway bridge and inside the box girder to harvest vibration energy from railway bridges. The PEH can output the maximum power of 0.728 W. The other is to aim the installation position of high loading characteristics. Wang et al. (2022a) proposed a piezoelectric smart backing ring (PSBR), which is based on piezoelectric stack array (PSA) and embedded into the steel-spring isolator. This PSBR is capable of scavenging energy from the steel-spring fulcrum force. Under actual operating conditions, with a force amplitude of 25 kN and a force frequency of 10 Hz, the PSBR can output a maximum average power of approximately 500 mW. The third is to combine the advantages of the former two ones. Hou et al. (2021) developed a cymbal transducer (CT) based on PSA and mechanically arranged it in series with the steel spring to capture energy from the steel-spring fulcrum force, which can exhibit large force peaks of up to tens of kN. The energy harvester is capable of generating a maximum power peak of 1.09 W. Such considerable output power levels provide the possibility for powering the trackside wireless sensor nodes with the main power consumption range from 10 to 200 mW (Gao et al., 2018; Qi et al., 2022; Wang et al., 2022b). There has been significant progress in structural design of the high power output PEHs used in the field of rail transport.
However, the previous studies mentioned above have mainly focused on the structural design of the harvester. Generally speaking, in practical engineering, the PEHs need to be installed into the track structure as additional devices, which may affect the dynamic performance of the vehicle-track system and even threaten its operation safety. Nonetheless, the related research concerning the installation effects of PEHs has not been studied in depth. Furthermore, due to the lack of guidance regarding the installation effects, the structural design parameters of PEHs may not be optimized, resulting in lower performance.
In our previous study, it has been proven that the PSBR based on PSA possesses high bearing capacity and high power output. This has been experimentally verified by the fact that the fabricated prototype can work steadily under a force level of approximately 40 kN (Wang et al., 2022a), and is very promising to develop the self-powered wireless sensing system for monitoring the service status of steel springs (Wang et al., 2022a). Similarly, the installation effect is also not clear, which hinders its further development and application in practical engineering. Based on this, the effect of the installation of PSBRs on the dynamic performance of the vehicle-floating slab track system is investigated, and the improved designs of the harvester are proposed based on the effect analysis for performance enhancement. The ultimate goal is to provide helpful guidance for the optimization design and installation of PSBRs.
The main innovations of the present work are as follows. Firstly, prior research has primarily concentrated on the structural design of PEHs deployed within railway systems, yet the impact of these PEHs’ installation on the dynamic performance of the vehicle-track system have been reported rarely. This work constructs a dynamic model of vehicle-floating slab track-energy harvester coupled system by introducing the equivalent stiffness of the PSBR, and analyzes the effect of equivalent stiffness on the dynamic performance of the vehicle-floating slab track system, which provides a comprehensive understanding for the installation effect of the PSBR. Secondly, the previous work fabricated a PSBR prototype based on piezoelectric stacks and given the improving design rule based on the simplified theoretical framework (Wang et al., 2022a). However, the installation effect of PSBR has not yet considered, which may lead to the lower electrical outputs. This study thoroughly integrates both the design improvement principle and installation considerations to fabricate two improved PSBR prototypes by employing piezoelectric tube stacks. The experimental results show that the improved prototypes possess the remarkable ability to enhance electrical outputs while simultaneously preserving the robust assembly stability of the harvester structure, which offers invaluable insights for future PSBR design optimization.
The other sections of this article are organized as follows. Section 2 establishes a dynamic model of vehicle-floating slab track-energy harvester coupled system by introducing the equivalent stiffness of energy harvester into the vertical vibration equations of the floating slab. Section 3 verifies the reliability of developed model by comparing its theoretical results to those of the special case in the open literature. Section 4 analyzes and discusses the effect of installation of the PSBR on dynamic performance of vehicle-floating slab track systems. Section 5 introduces the improved designs of the PSBR and sets up the energy harvesting performance (EHP) test system to measure the harvester performance. Section 6 compares the EHP of the improved designs and the previous design under harmonic force. Section 7 compares the EHP of the improved designs and the previous design under the steel-spring fulcrum force. Section 8 compares the power supply capacity based on the ViPSN 2.0 Internet of Things (IoT) sensor node. Section 9 summarizes the main conclusions.
2. A dynamic model of vehicle-floating slab track-energy harvester coupled system
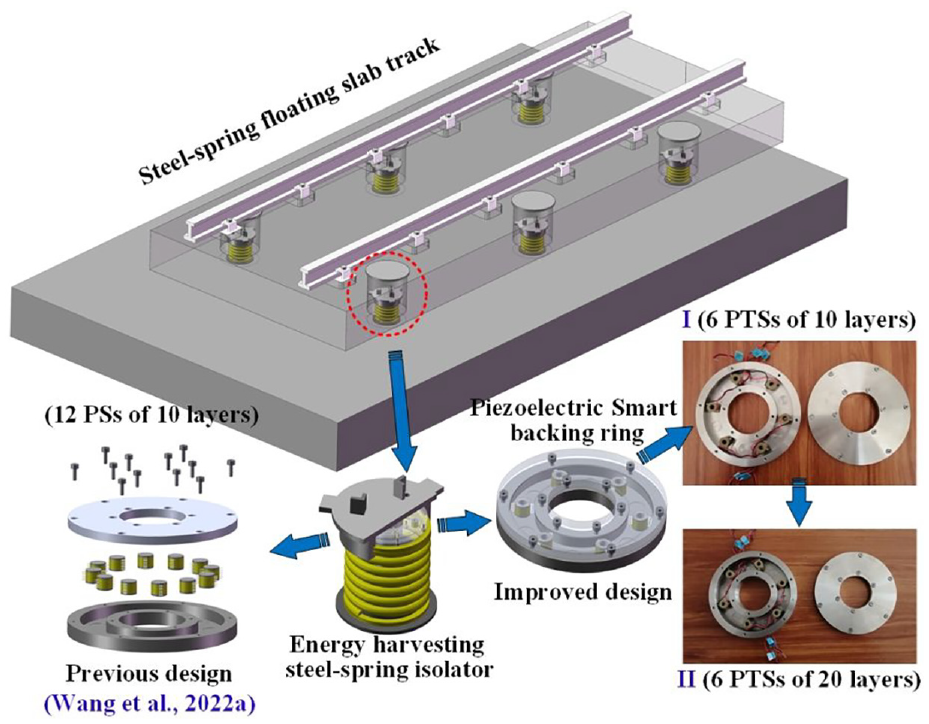
As reported in our previous work (Wang et al., 2022a), the PSBR is easily embedded into the traditional steel-spring isolator to harvest energy from the steel-spring fulcrum force, which is mechanically in series with the steel-spring. In this work, two installation types for the PSBR are considered, as shown in Figure 1. One is that only a steel-spring isolator is installed with a single energy harvester, as shown in Figure 1(a). The other is that each steel-spring isolator is installed with an energy harvester, thus multiple energy harvesters will be installed under the floating slab, as shown in Figure 1(b).
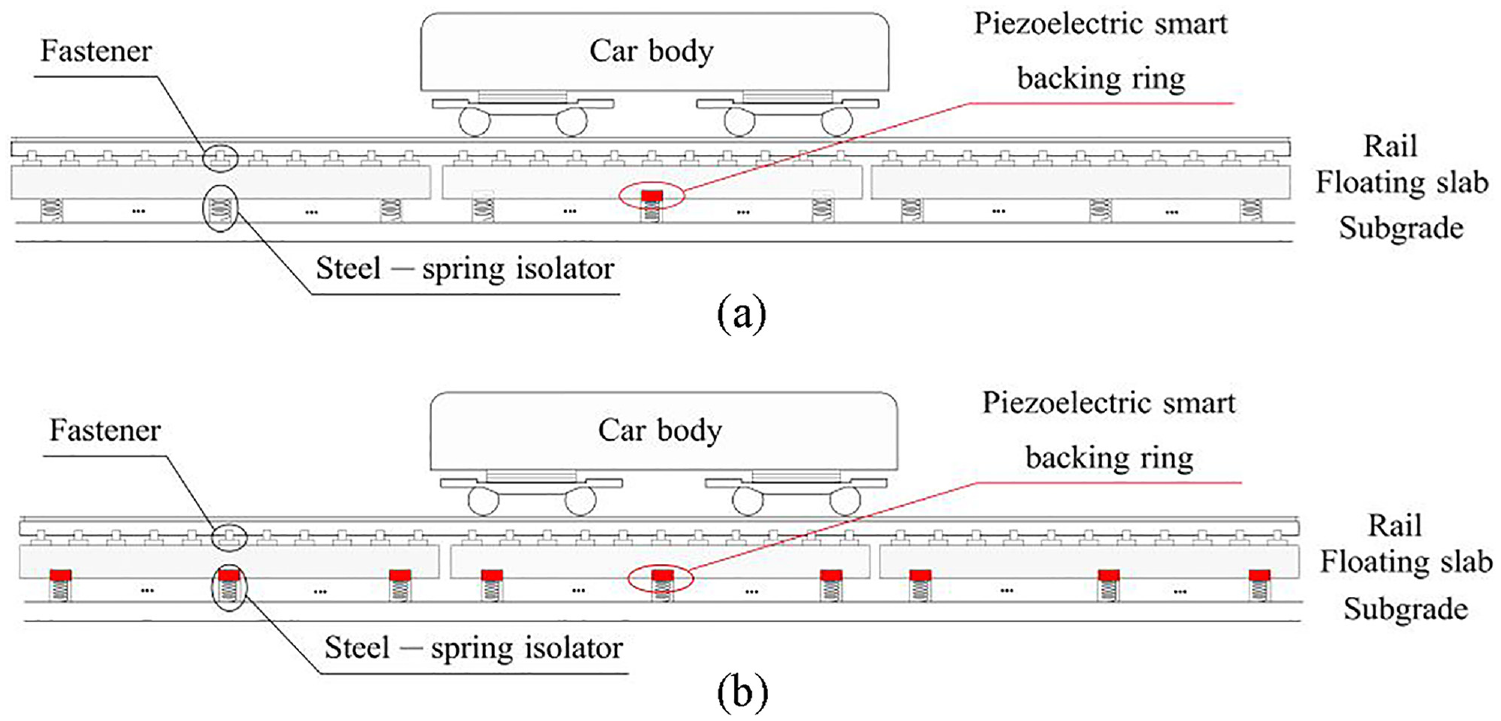
Two installation types of the PSBR in the floating slab track: (a) Track with installed single energy harvester and (b) Track with installed multiple energy harvesters.
Furthermore, in order to investigate the impact of harvester installation on the dynamic performance of the vehicle-floating slab track system, based on Zhai (2018)’s work, the equivalent stiffness of the PSBR is introduced into the traditional vehicle-floating slab track coupled system to develop a dynamic model of vehicle-floating slab track-energy harvester coupled system, as shown in Figure 2. Within the model, two distinct installation types are considered. Specifically, Figure 2(a) depicts the scenario where a single energy harvester is installed on the track, whereas Figure 2(b) showcases the case where multiple energy harvesters are installed. Additionally, in the figure, the spring enclosed in the red dashed box signifies the equivalent stiffness of the PSBR.
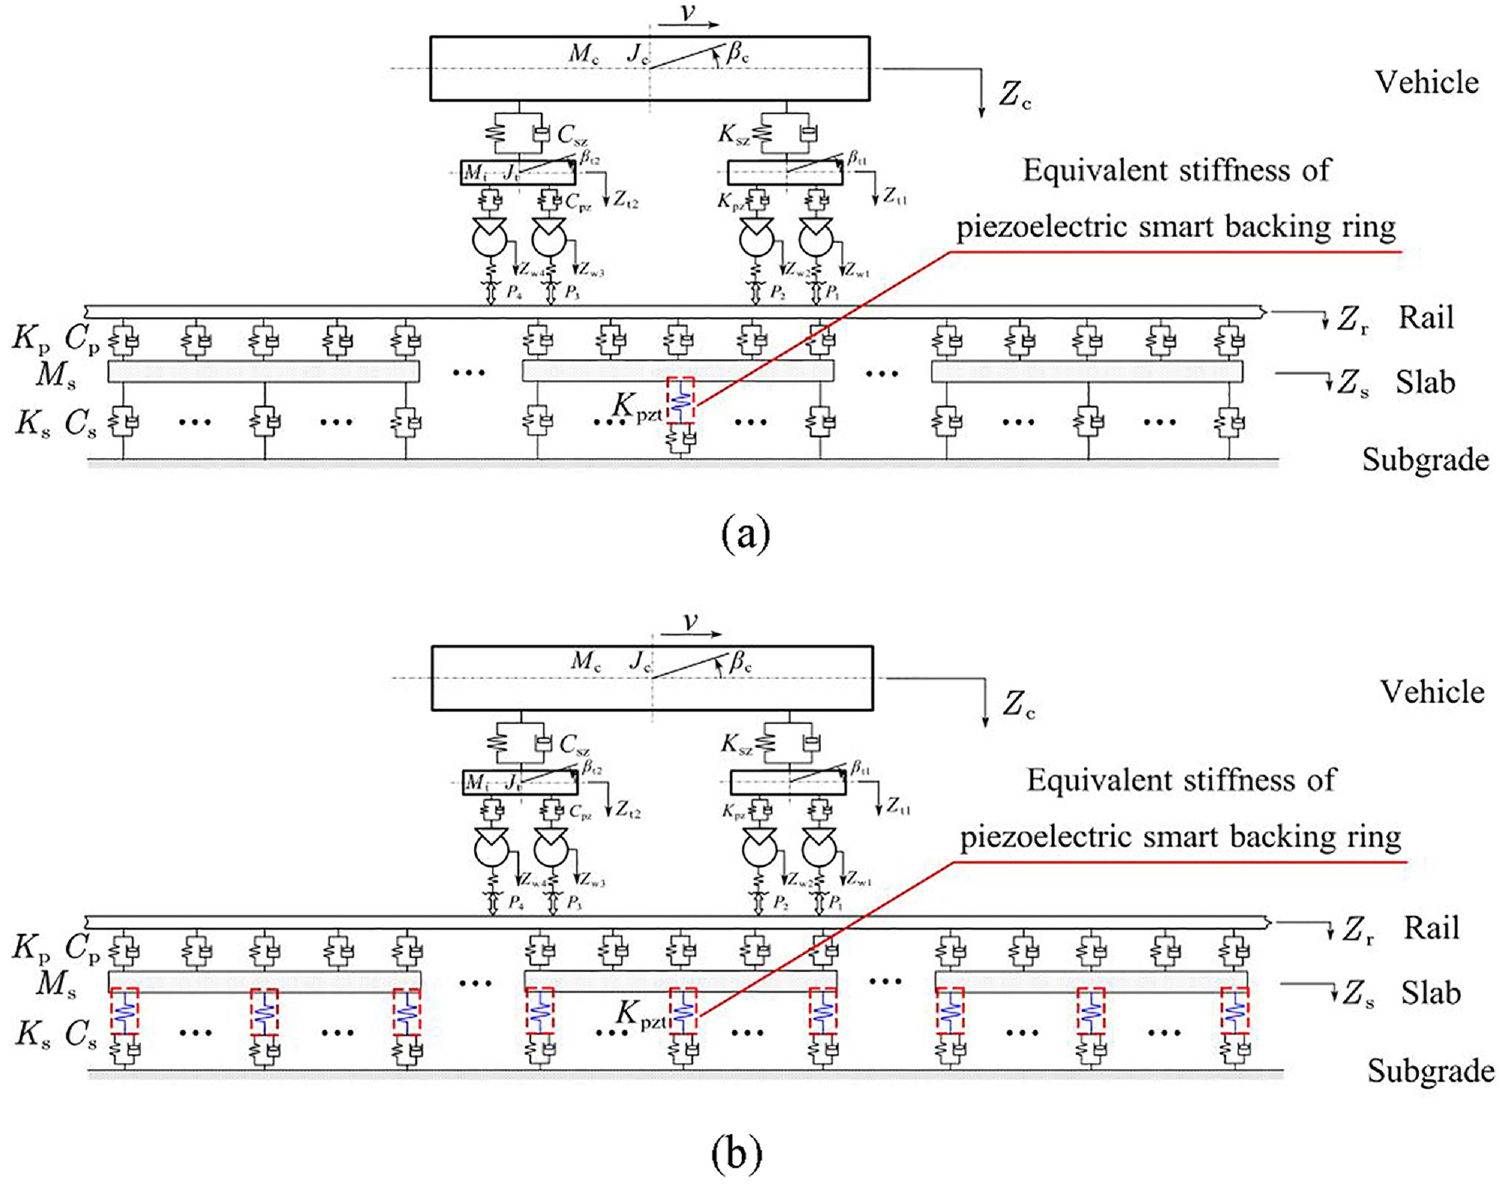
Dynamic model of vehicle-floating slab track-energy harvester coupled system: (a) Track with installed single energy harvester and (b) Track with installed multiple energy harvesters.
Referring to the literature by Zhai (2018), the vehicle is modeled as a multi-rigid-body system that moves along the track at a train speed v, the rail is modeled as an Euler beam, the floating slab is simplified as a finite length free beam, the rail fasteners and steel-spring isolators are modeled as equivalent spring-damping units. In Figure 2, the vehicle model consists of 10 Degrees of Freedom (DOFs): the carbody’s vertical (Zc) and pitch (βc) motions, the lead and rear bogie frames’ vertical (Zt1, Zt2) and pitch (βt1, βt2) motions, and the four vertical motions (Zwi, i = 1∼4) of the four wheelsets, so the vehicle model can also be called 10 DOFs model. Mc and Mt represent the mass of the car body and bogie frame, respectively. Jc and Jt represent the pitching moment of inertia of the car body and the lead and rear bogie frames, respectively. Kpz and Cpz are the vertical stiffness and damping of the primary suspension, respectively. Ksz and Csz are the vertical stiffness and damping of the secondary suspension, respectively. Pi represents the corresponding wheel-rail forces (i = 1∼4). Zr and Zs represent the vertical motions of rail and floating slab, respectively. Kp and Cp are the stiffness and damping of the floating slab fasteners, respectively. Ks and Cs are the stiffness and damping of the steel-spring isolators, respectively. Ms represent the mass of a single floating slab. Kpzt represents the equivalent stiffness of the PSBR.
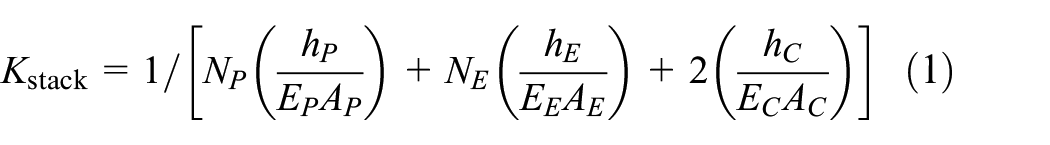
During the calculation, the equivalent stiffness of the PSBR can be approximately considered as that of the piezoelectric stack array (PSA). As shown in Figure 3, the harvester primarily comprises a base, a cover plate, twelve piezoelectric stacks (PSs) and twelve screw bolts (Wang et al., 2022a). Among them, the base and cover plate are equivalent to the rigid bodies, thus the equivalent stiffness of the harvester is dependent on that of the PSA. For the previous design with 12 PSs (Wang et al., 2022a), its equivalent stiffness is about 3.77 × 10⁹ N/m, which can be obtained according to the provided geometric and material parameters in the previous work (Wang et al., 2022a), as well as the following formula.

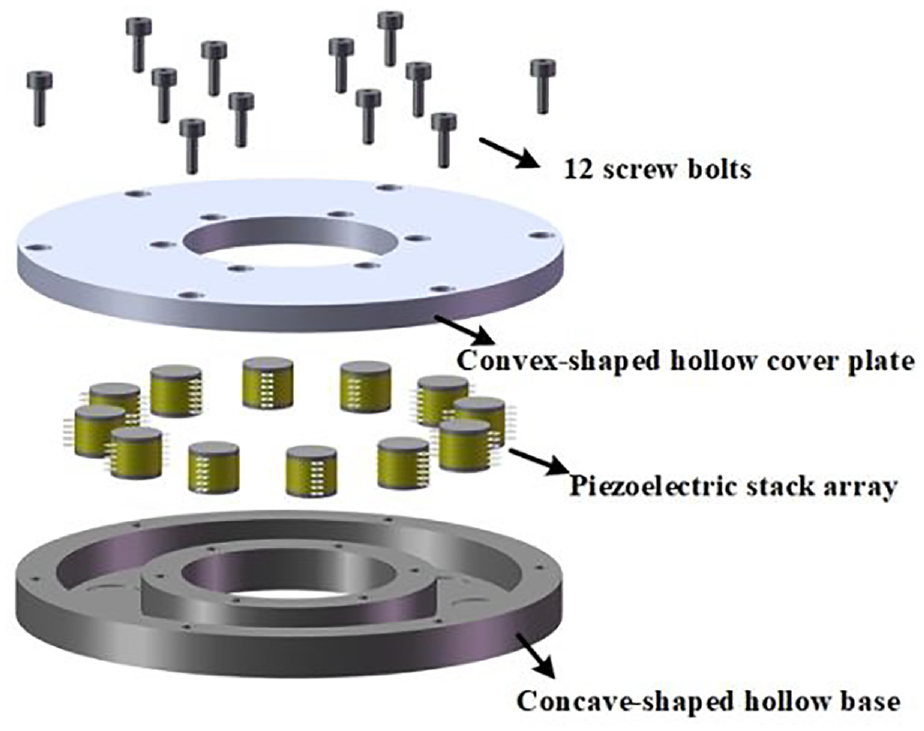
Structural diagram of the PSBR.
In equations (1) and (2), Kstack represents the equivalent stiffness of single piezoelectric stack (PS) consisted of NP piezoelectric layers, 2 ceramic protective layers and NE (NE = NP + 1) electrode layers. EP, EE, EC, AP, AE, AC, hP, hE, and hC represent the elastic modulus, area and thickness of the piezoelectric layers, electrode layers and ceramic protective layers, respectively. Kpzt represents the equivalent stiffness of the PSA consisted of Mstack PSs. For a single PS, its stiffness is equivalent to the series combination of the stiffness of every layer. For the PSA, its stiffness is the parallel combination of the stiffnesses of every PS. In addition, the previous theoretical results have indicated that the maximum average power (MAP) can be increased greatly by improving the design parameter of PSs, such as increasing the layer number of the PS, decreasing the PS radius (i.e., the cross-sectional area of PS) and the PS number (Wang et al., 2022a). These improved design strategies, however, will result in a decrease in the equivalent stiffness of the energy harvester. Nonetheless, it is crucial to consider the appropriate dimensions during the design process to ensure the reasonableness of the harvester’s equivalent stiffness.
When the vehicle is traveling on the track, the vehicle’s vibration equations are identical to those in Zhai (2018)’s work. The rail is subjected to wheel-rail force and fastener force, while the floating slab is subjected to fastener force and steel-spring fulcrum force. The wheel-rail force can be calculated using Hertzian elastic contact theory (Zhai, 2018). The fastener force Frs and steel-spring fulcrum force Fss can be expressed as follows:


where, Kp and Cp represent the fastener stiffness and damping, respectively; Zr and Zs are the displacement of rail and floating slab, respectively; Ks and Cs are the stiffness and damping of steel-spring isolator, respectively.
It should be noted that the installation of the energy harvester will change the stiffness of the steel-spring isolator, which in turn will affect the steel-spring fulcrum force here. In order to introduce the equivalent stiffness of energy harvester, the equivalent stiffness Keq at installation location needs to be calculated by the series stiffness formula:
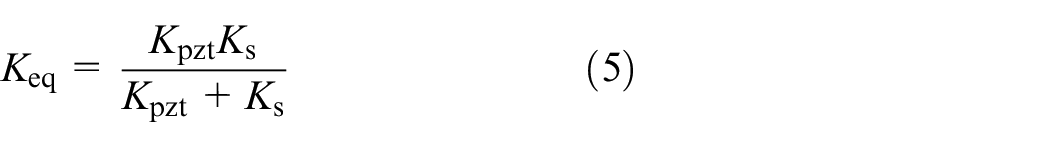
where, Kpzt and Ks represent the stiffness of PSA and steel-spring isolator, respectively. Thus, the formula for calculating steel-spring fulcrum force after the PSBR installation has changed from equation (4) to equation (6).

Based on the Euler-Bernoulli beam theory and the forces described previously, the vibration differential equations for the rail and the mth floating slab can be derived, respectively (Zhai, 2018), as follows.
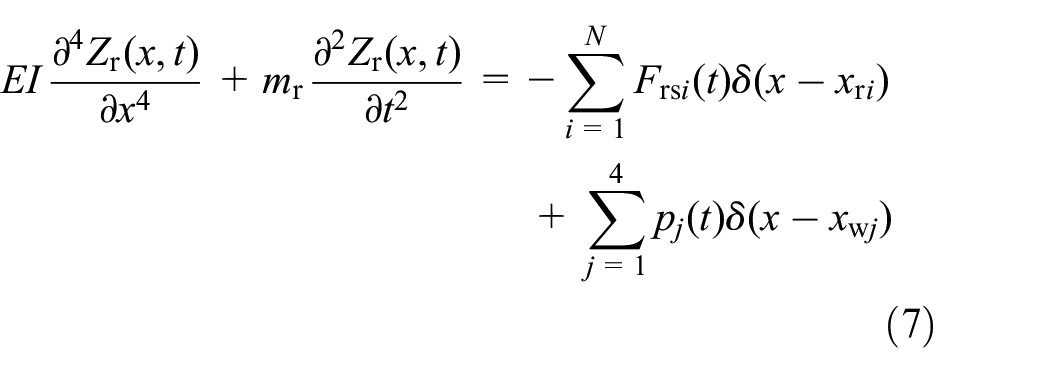
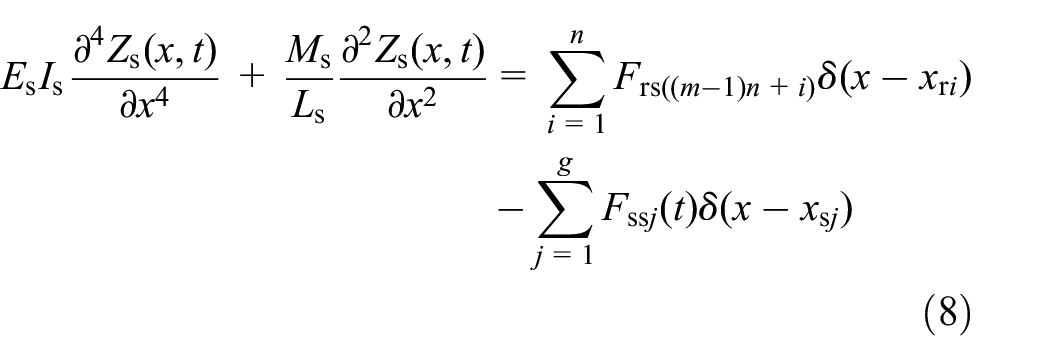
where, E and Es are the elastic modulus of the rail and slab, respectively. I and Is are the moment of inertia of the rail and slab, respectively. Zr and Zs are the displacements of rail and slab, respetively. mr is the mass per unit length of the rail, Ms and Ls are the mass and length of a single floating slab, respectively. Frs and Fss are the fastener force and steel-spring fulcrum force calculated by equations (3) and (6). pj is the wheel-rail force. N is the number of fasteners in the rail. n and g are the number of fasteners and steel-spring isolators under a single slab. xr, xw, and xs are the position of fastener, wheel and steel-spring isolator, respectively. δ(x-xri) and δ(x-xwj) are Dirac functions.
In order to facilitate the numerical analysis, the Ritz method is employed to represent the displacements of the rail and the slab, which are then substituted into the vibration differential equations. Utilizing the character of the Dirac δ function and the modal orthogonality, the aforementioned two fourth-order vibration partial differential equations can be transformed into the second-order ordinary differential equations (Zhai, 2018).
In addition, the track random irregularity is taken into account when calculating the wheel-rail force by using the Hertzian elastic contact theory (Zhai, 2018). After performing the inverse Fourier transform on the six-grade track irregularity PSD from the US Federal Railroad Administration (Zhai, 2018), the time-domain samples can be obtained, as shown in Figure 4.
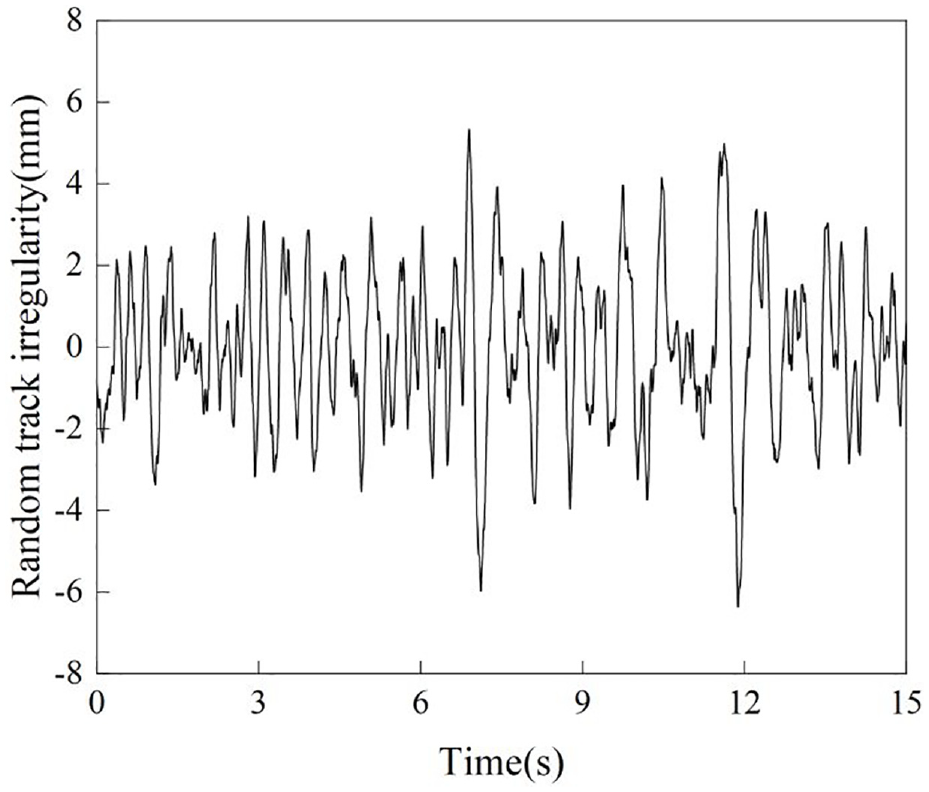
Simulation result of random track irregularity time-domain samples.
Finally, the vibration equations of the vehicle-floating slab track-energy harvester coupled system can be expressed as a unified matrix form Zhai (2018):

where,
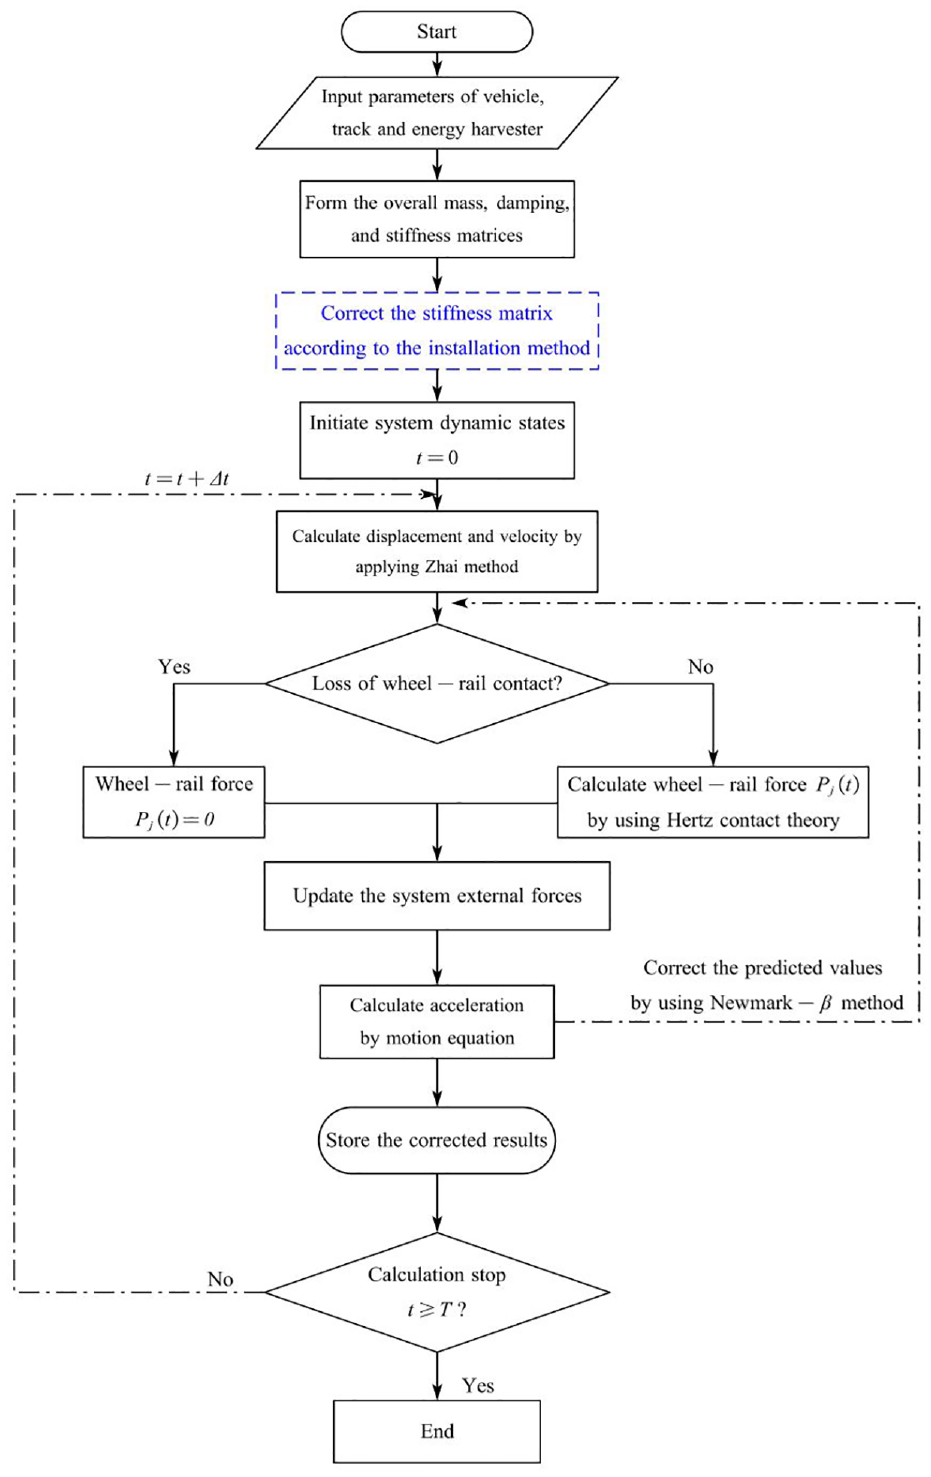
Simulation calculation flowchart of dynamic equation.
By solving equation (9) using the Predictor-Corrector method and employing the modal superposition method, the dynamic performances of the vehicle-floating slab track-energy harvester coupled system can be derived. Here, it should be pointed out again that the proposed model has the capability to investigate the effect of various installation types on the dynamic performance of vehicle-floating slab track systems. For example, when a single energy harvester is installed, as depicted in Figures 1(a) and 2(a), the stiffness at the corresponding installation position in the stiffness matrix of the steel-spring isolator needs to be changed from Ks to Keq. Similarly, when multiple energy harvesters are installed, as shown in Figures 1(b) and 2(b), all the Ks in the stiffness matrix of the steel-spring isolator need to be altered to Keq.
In a word, the calculation process in this work is similar to that in Zhai (2018)’s work. The difference is that the equivalent stiffness Keq at the installation location in equation (5) is introduced as the correction terms into the steel-spring fulcrum force under the floating slab, therefore, the calculation formula of steel-spring fulcrum force becomes equation (6) after the PSBR installation.
3. Model validation
Firstly, to validate the reliability of the theoretical solution process, the dynamic model of vehicle-floating slab track coupled system without the energy harvester is solved, and its results are compared with those presented in the existing literature.
In Ma and Liu (2018), a numerical model based on the periodic-Fourier-modal method was proposed for the dynamic analysis of a vehicle-floating slab track coupled system with random track irregularity. This model was validated using the measured data. In the analysis, the train was modeled as a composition of six vehicles, each sharing identical parameters, and operated at a speed of 60 km/h. The random track irregularity was simulated utilizing the six-grade American track spectrum function. The study primarily focused on dynamic responses, encompassing rail displacement, rail acceleration, slab displacement, and slab acceleration. In the present work, by adopting the same vehicle and track parameters as used in Ma and Liu (2018)’ work, the dynamic responses can also be calculated utilizing the dynamic model of vehicle-floating slab track coupled system without the energy harvester. The rail displacement, rail acceleration, slab displacement, and slab acceleration obtained at the 24 m position of the sixth floating slab are presented in Figure 6. These results exhibit a high degree of consistency with those reported in the work (Ma and Liu, 2018), thereby verifying the reliability of the dynamic model established in the present study.
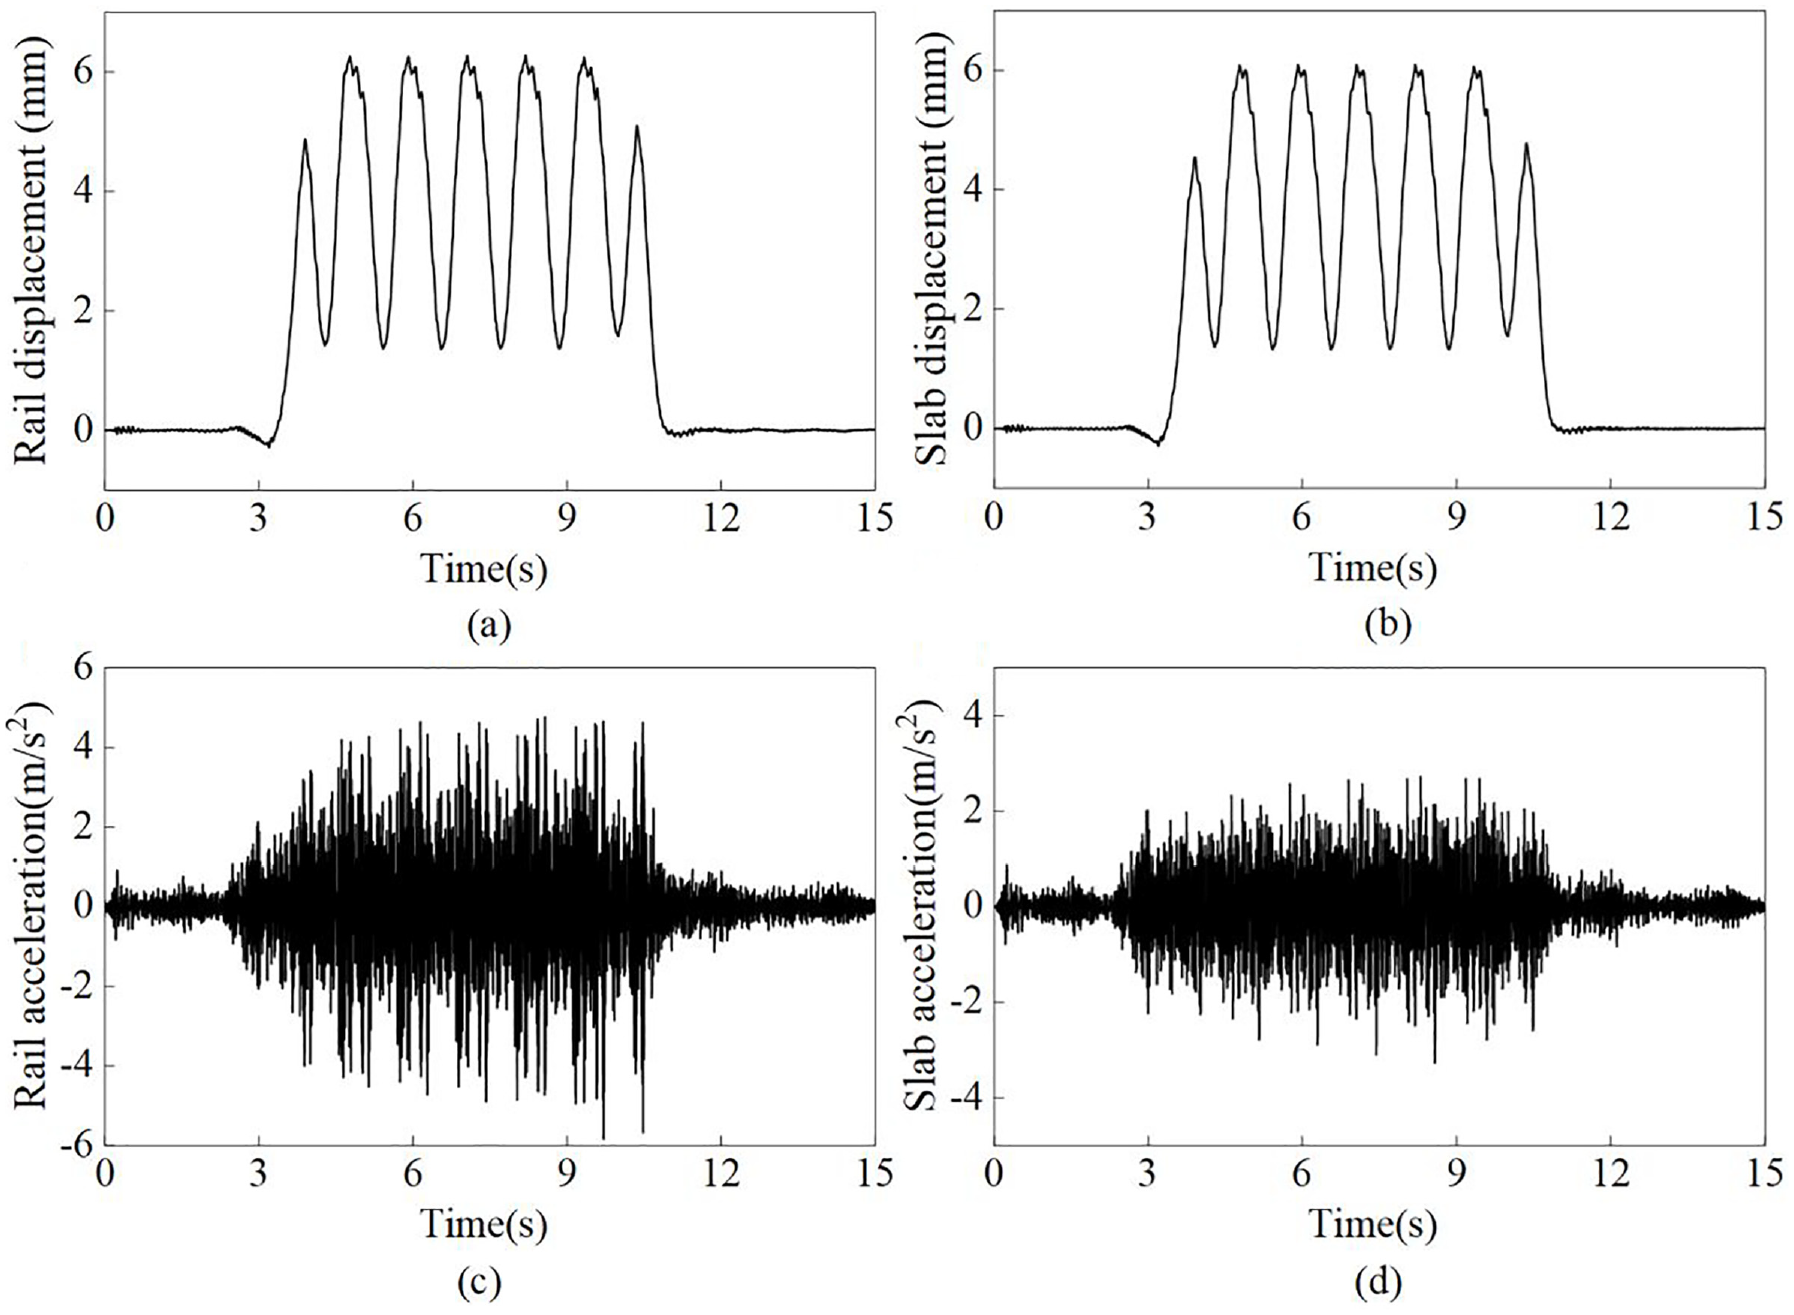
Validation of the dynamic model of vehicle-floating slab track coupled system.
Further, the discrepancies between of the present work and Ma and Liu (2018) regarding the maximum vertical rail displacement, floating slab displacement and rail acceleration are presented in Table 1. The maximum discrepancy (Discrepancy= (Ma and Liu’s data-present results)/Ma and Liu’s data) is no more than 4%, thus verifying the correctness of the theoretical program.
Comparison of maximum vertical rail displacement, floating slab displacement and rail acceleration.
Secondly, comparisons are presented among the results obtained from model programs: one without the energy harvester, another with a single energy harvester, and a third with multiple energy harvesters. These comparisons aim to ensure the reliability of the dynamic model for the vehicle-floating slab track-energy harvester coupled system. Since the energy harvester is in series with the steel-spring isolator, therefore when the equivalent stiffness of the harvester is very large, the whole stiffness in series approximates that of the steel-spring isolator. In the calculations, the equivalent stiffness of the energy harvester 1 × 10¹² N/m is adopted. The calculated rail displacement, slab displacement, rail acceleration and slab acceleration for three cases are plotted in Figure 7. It can be observed that the results for all three cases are basically consistent, further confirming the correctness of the dynamic model.
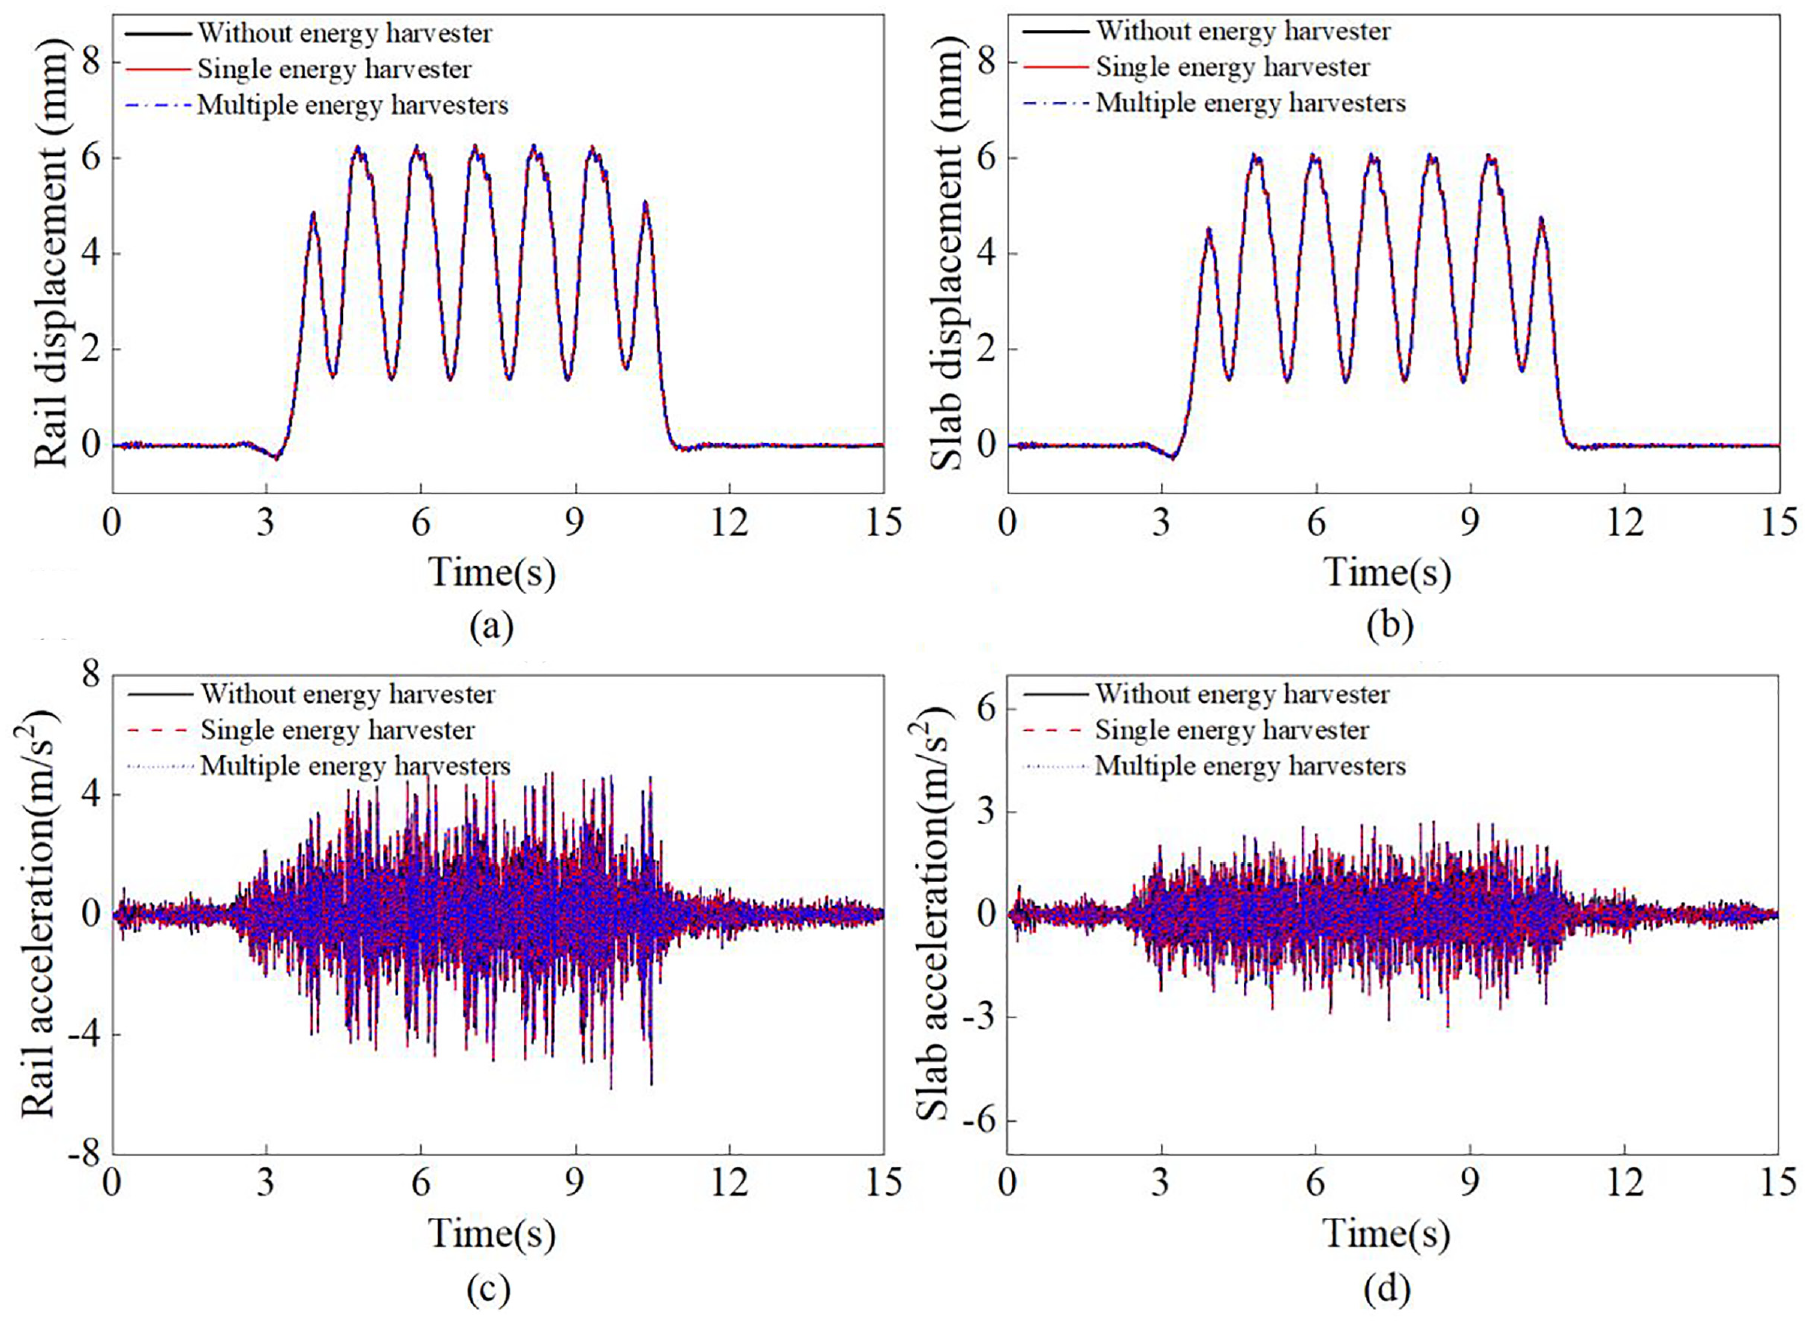
Validation of the dynamic model of vehicle-floating slab track-energy harvester coupled system.
4. Effect of installation of the energy harvester on dynamic performance of vehicle-floating slab track systems
4.1 Parameters selection
In the calculation, the parameters of vehicle and floating slab track used in Hou et al. (2021)’ work are adopted, as shown in Tables 2 and 3, respectively. Six marshalling train operating at 100 km/h are considered. The rail length is selected as 540 m, and the selection reason is that the rail length can hardly affect the calculation results when the rail length exceeds 100 m (Zhai, 2018). The number of slabs is 30, the material used for the slabs is C40 concrete. The spacing between fasteners is 0.6 m, and two different isolators are used at the end and middle of the slab. The detailed arrangement of the isolators and fasteners is illustrated in Figure 8. It should be noted that shear hinges between the floating slabs are not considered in this configuration.
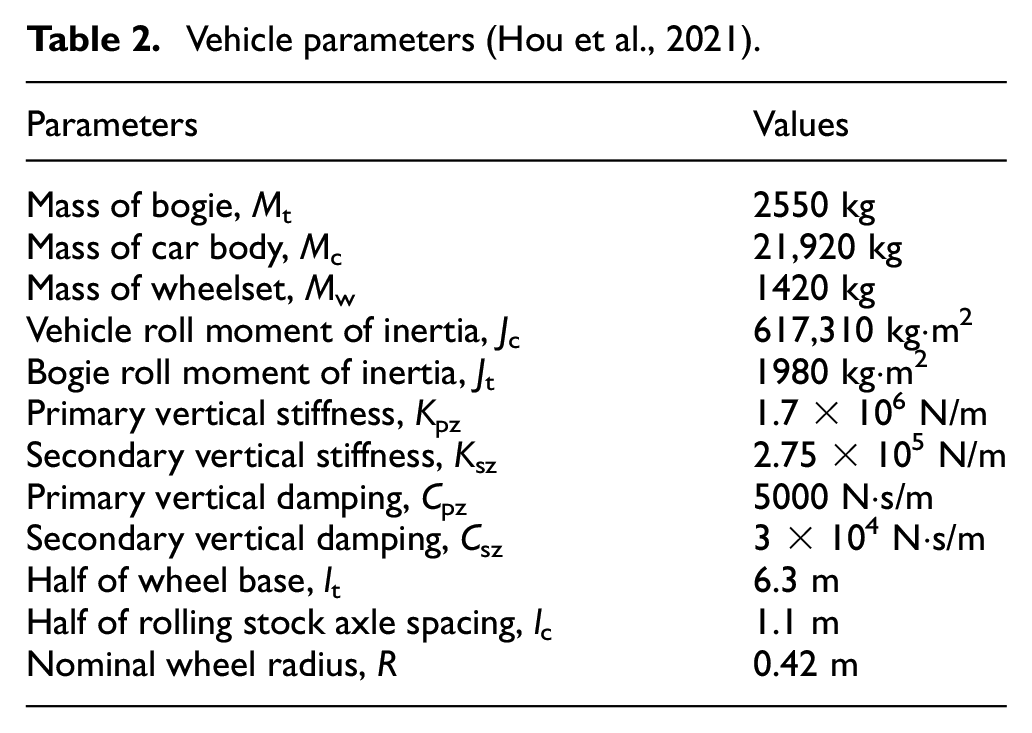
Vehicle parameters (Hou et al., 2021).
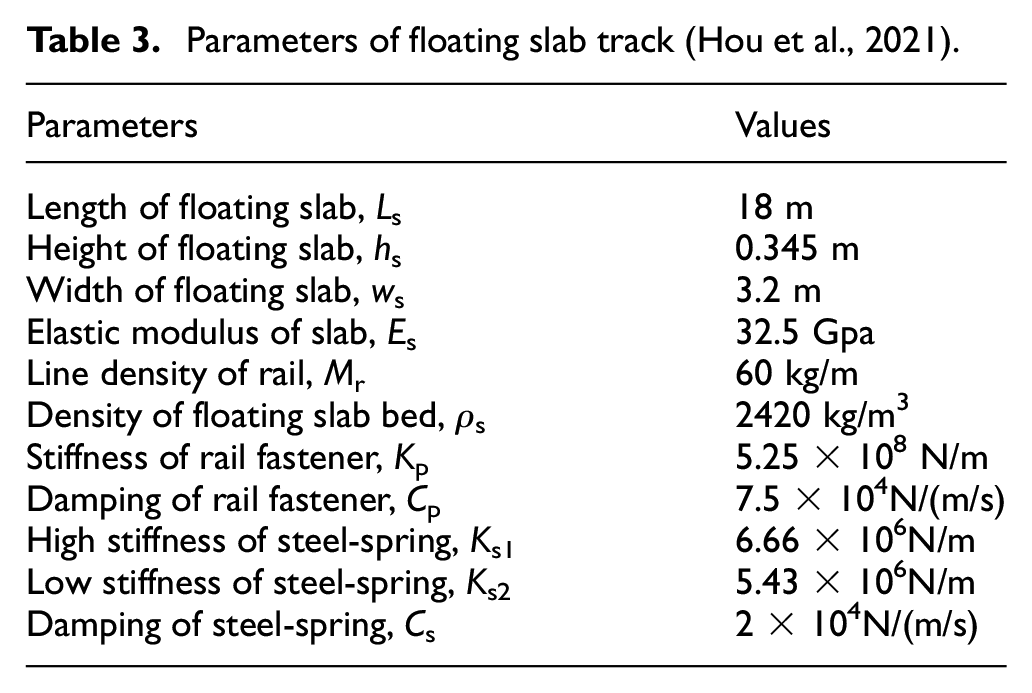
Parameters of floating slab track (Hou et al., 2021).
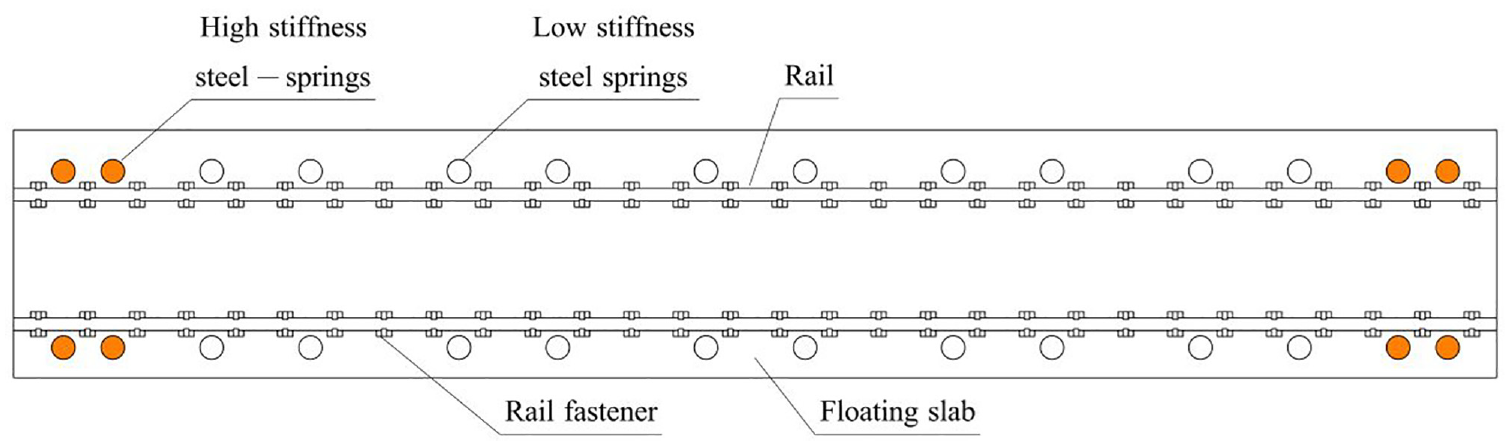
The arrangement of the isolators and fasteners.
4.2 Analysis of installation effect
Given the potential variation in dynamic performance between the head and middle of the slab, three installation methods have been considered to more accurately depict the installation effects, as follows. The installation method 1 involves installing a single energy harvester solely at the head of the slab, precisely at the location of the first steel-spring isolator. The installation method 2 entails installing a single energy harvester exclusively at the middle of the slab, specifically at the location of the seventh steel-spring isolator. The installation method 3 comprises installing energy harvesters into all steel-spring isolators beneath the slab. During the calculations, the under-rail stiffness matrix is modified solely to determine the dynamic performance of the vehicle-floating slab track-energy harvester coupled system for these three installation methods. In the analysis, attention is primarily focused on the important parameters, including rail displacement, floating slab displacement, rail acceleration, floating slab acceleration, fastener force and steel-spring fulcrum force. In addition, the equivalent stiffness of the energy harvester varies within the range of 1 × 10⁷ N/m to 2 × 10⁹ N/m. The reason is that the order of magnitude for the steel-spring stiffness is about 107N/m (Ding et al., 2022; Hou et al., 2021; Ma and Liu, 2018; Yuan et al., 2023), whereas the order of magnitude for the equivalent stiffness of the PSBR is around 109N/m. In addition, when the equivalent stiffness of the energy harvester exceeds 2 × 10⁹ N/m, the obtained results remain virtually unchanged.
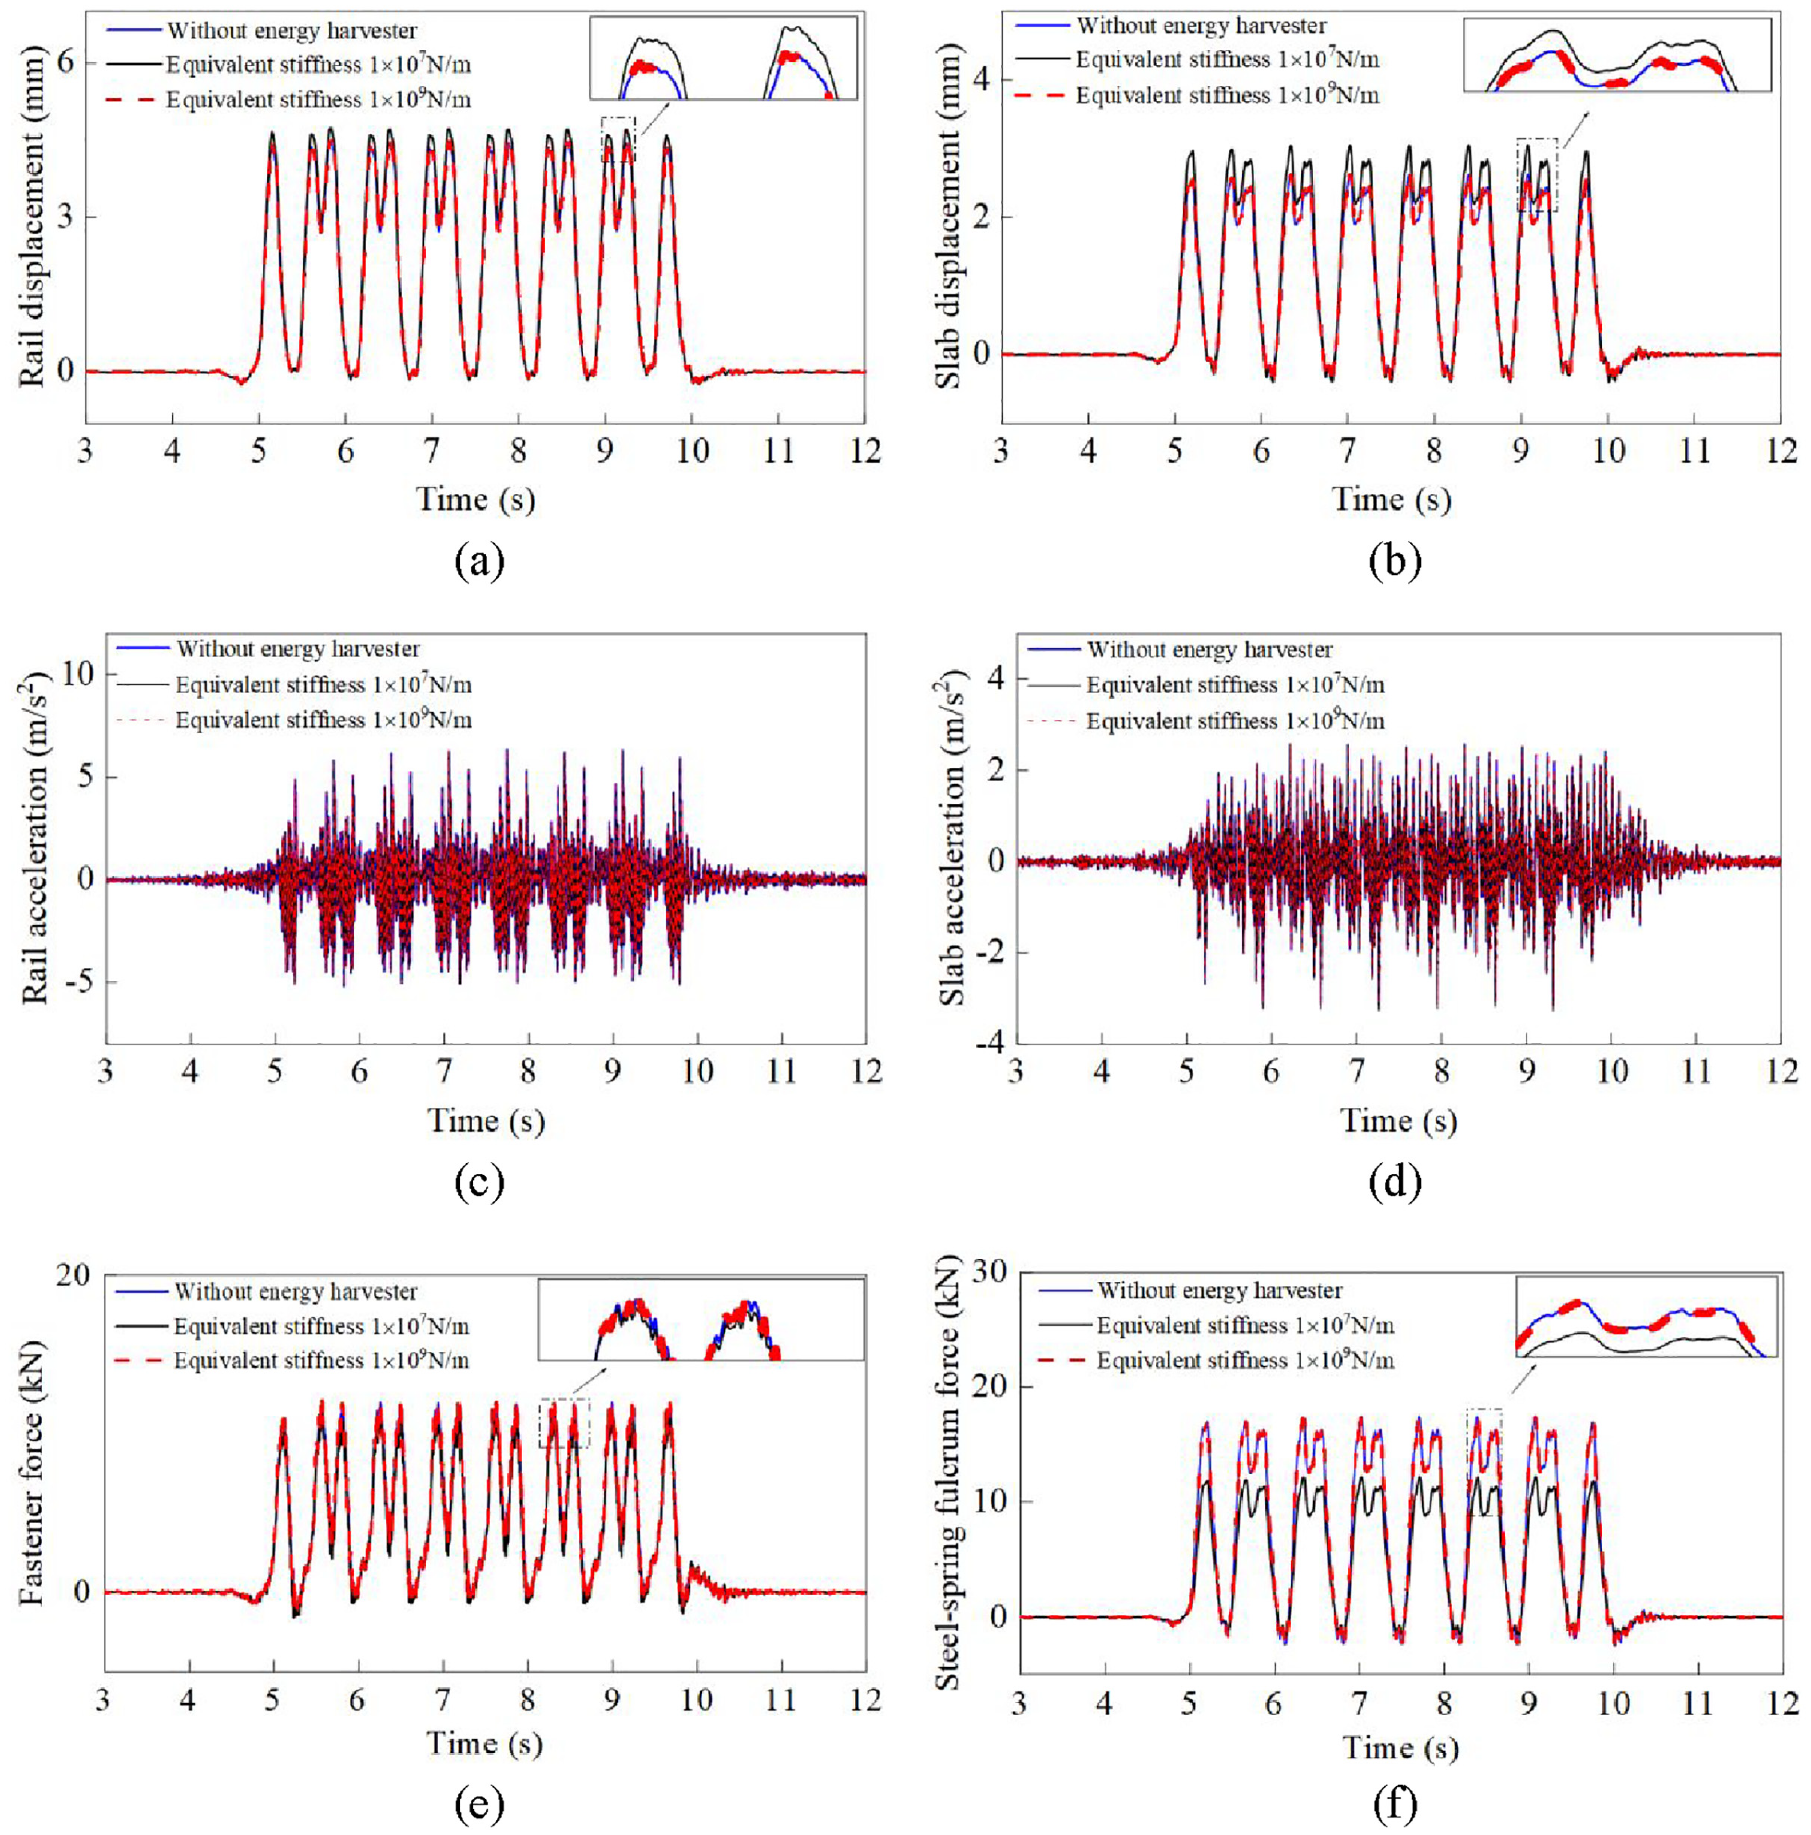
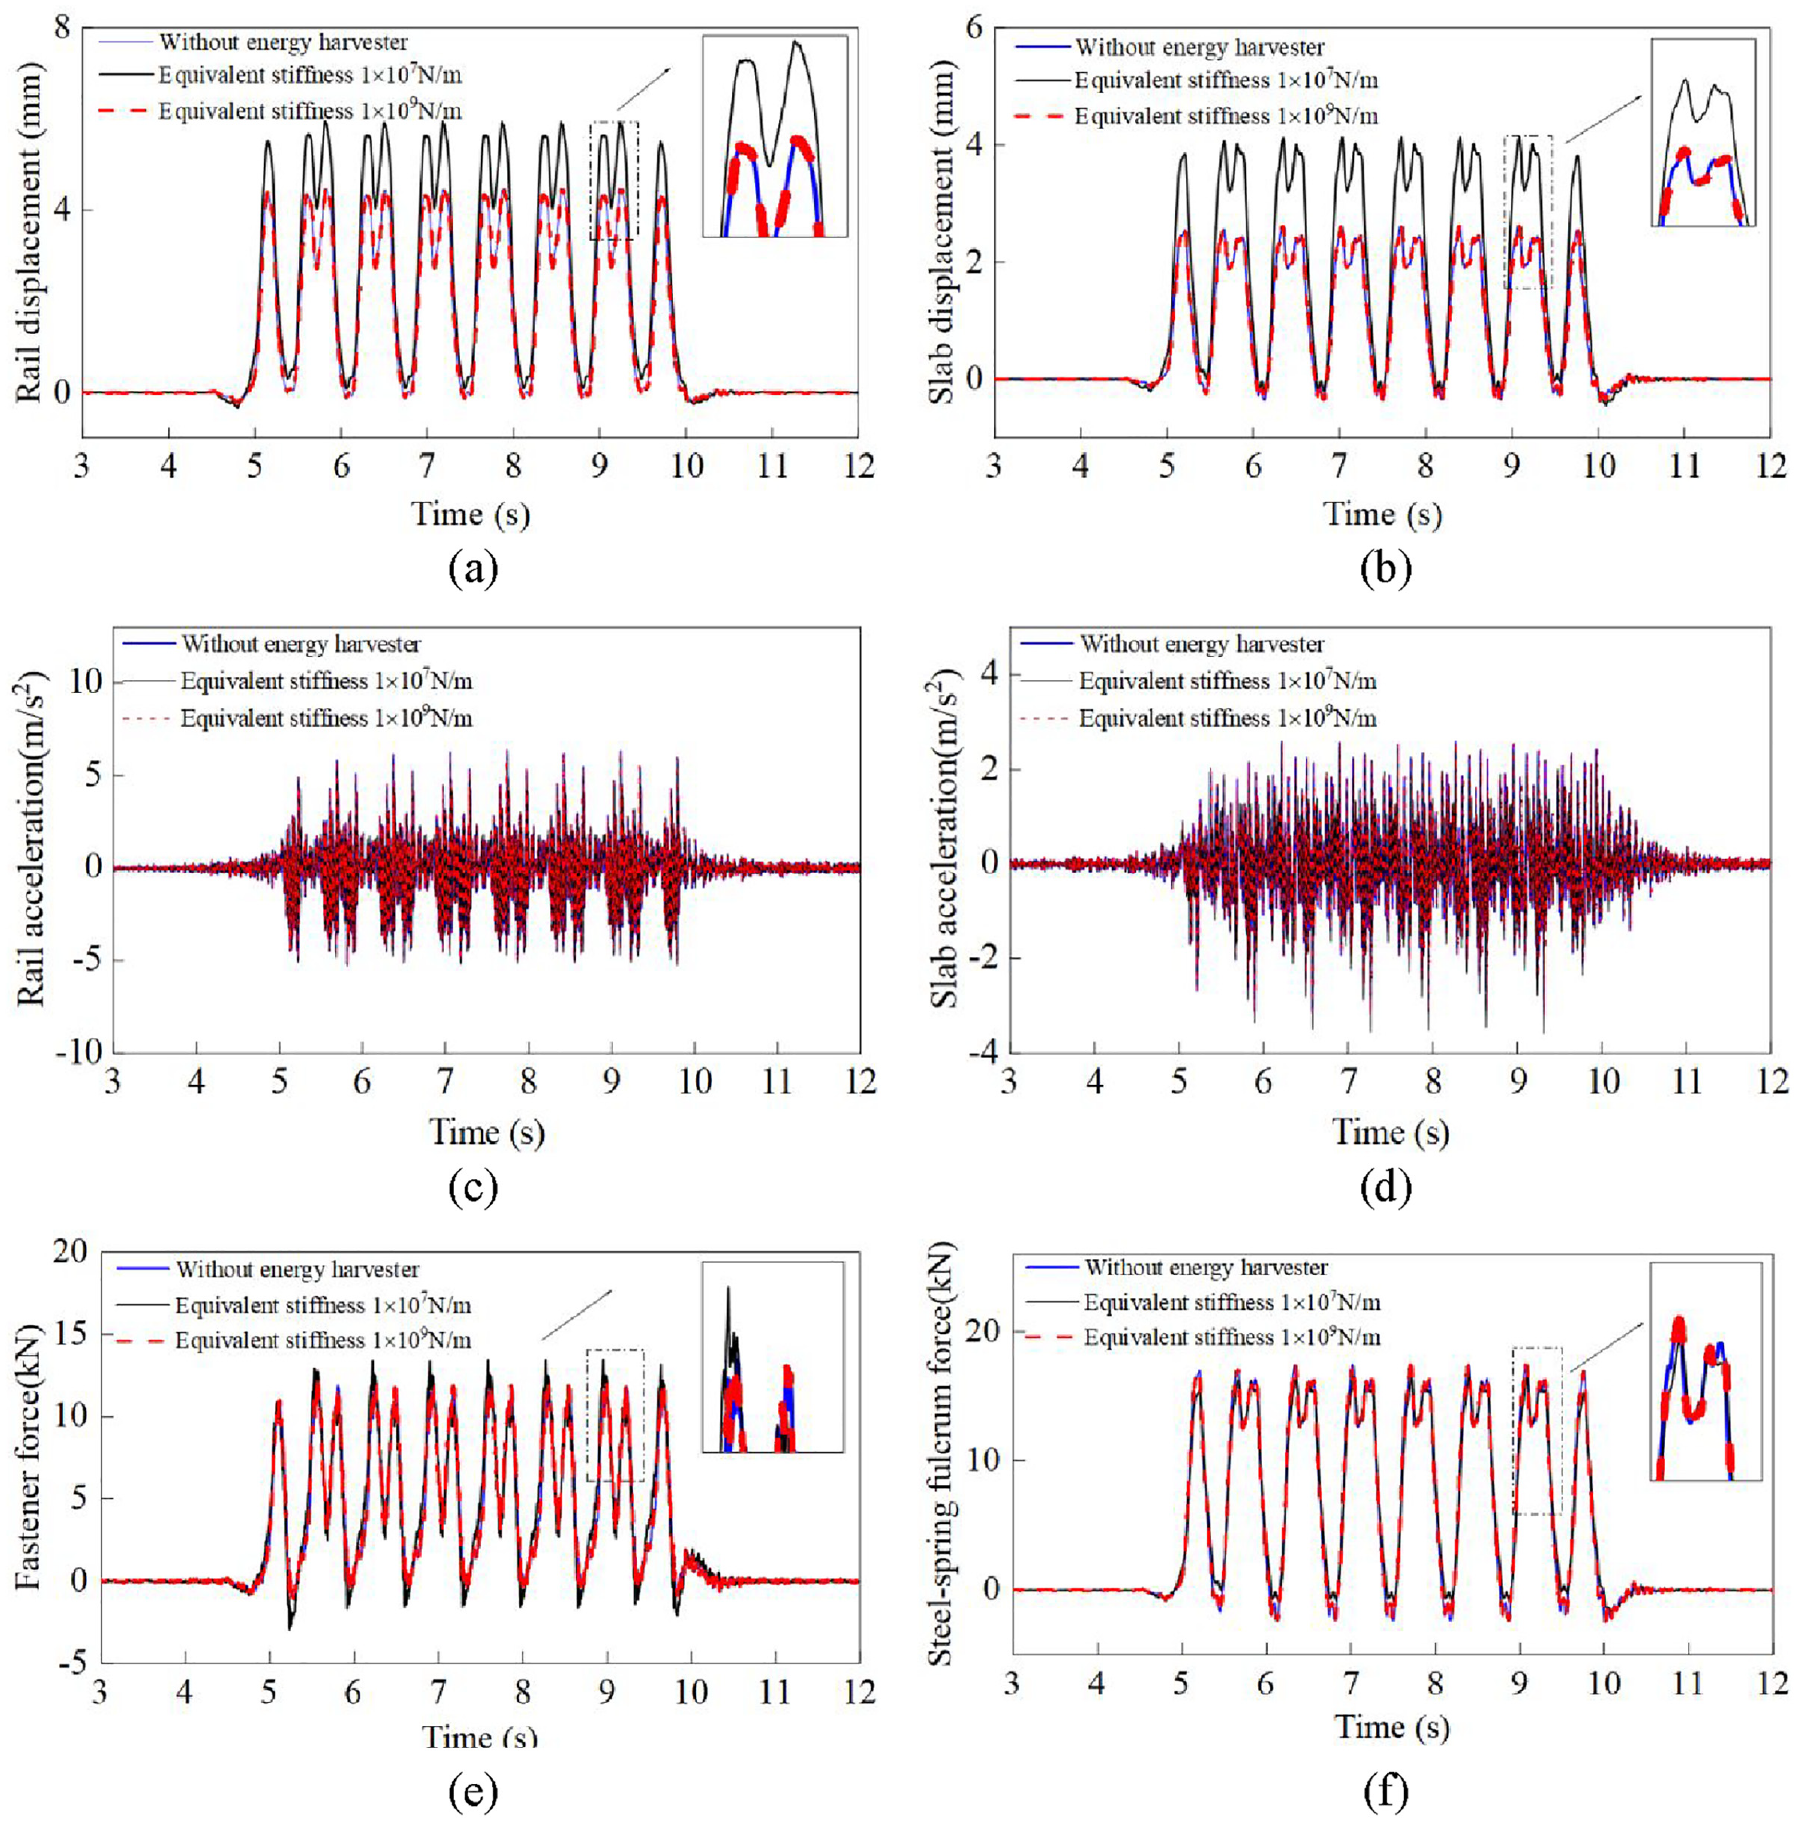
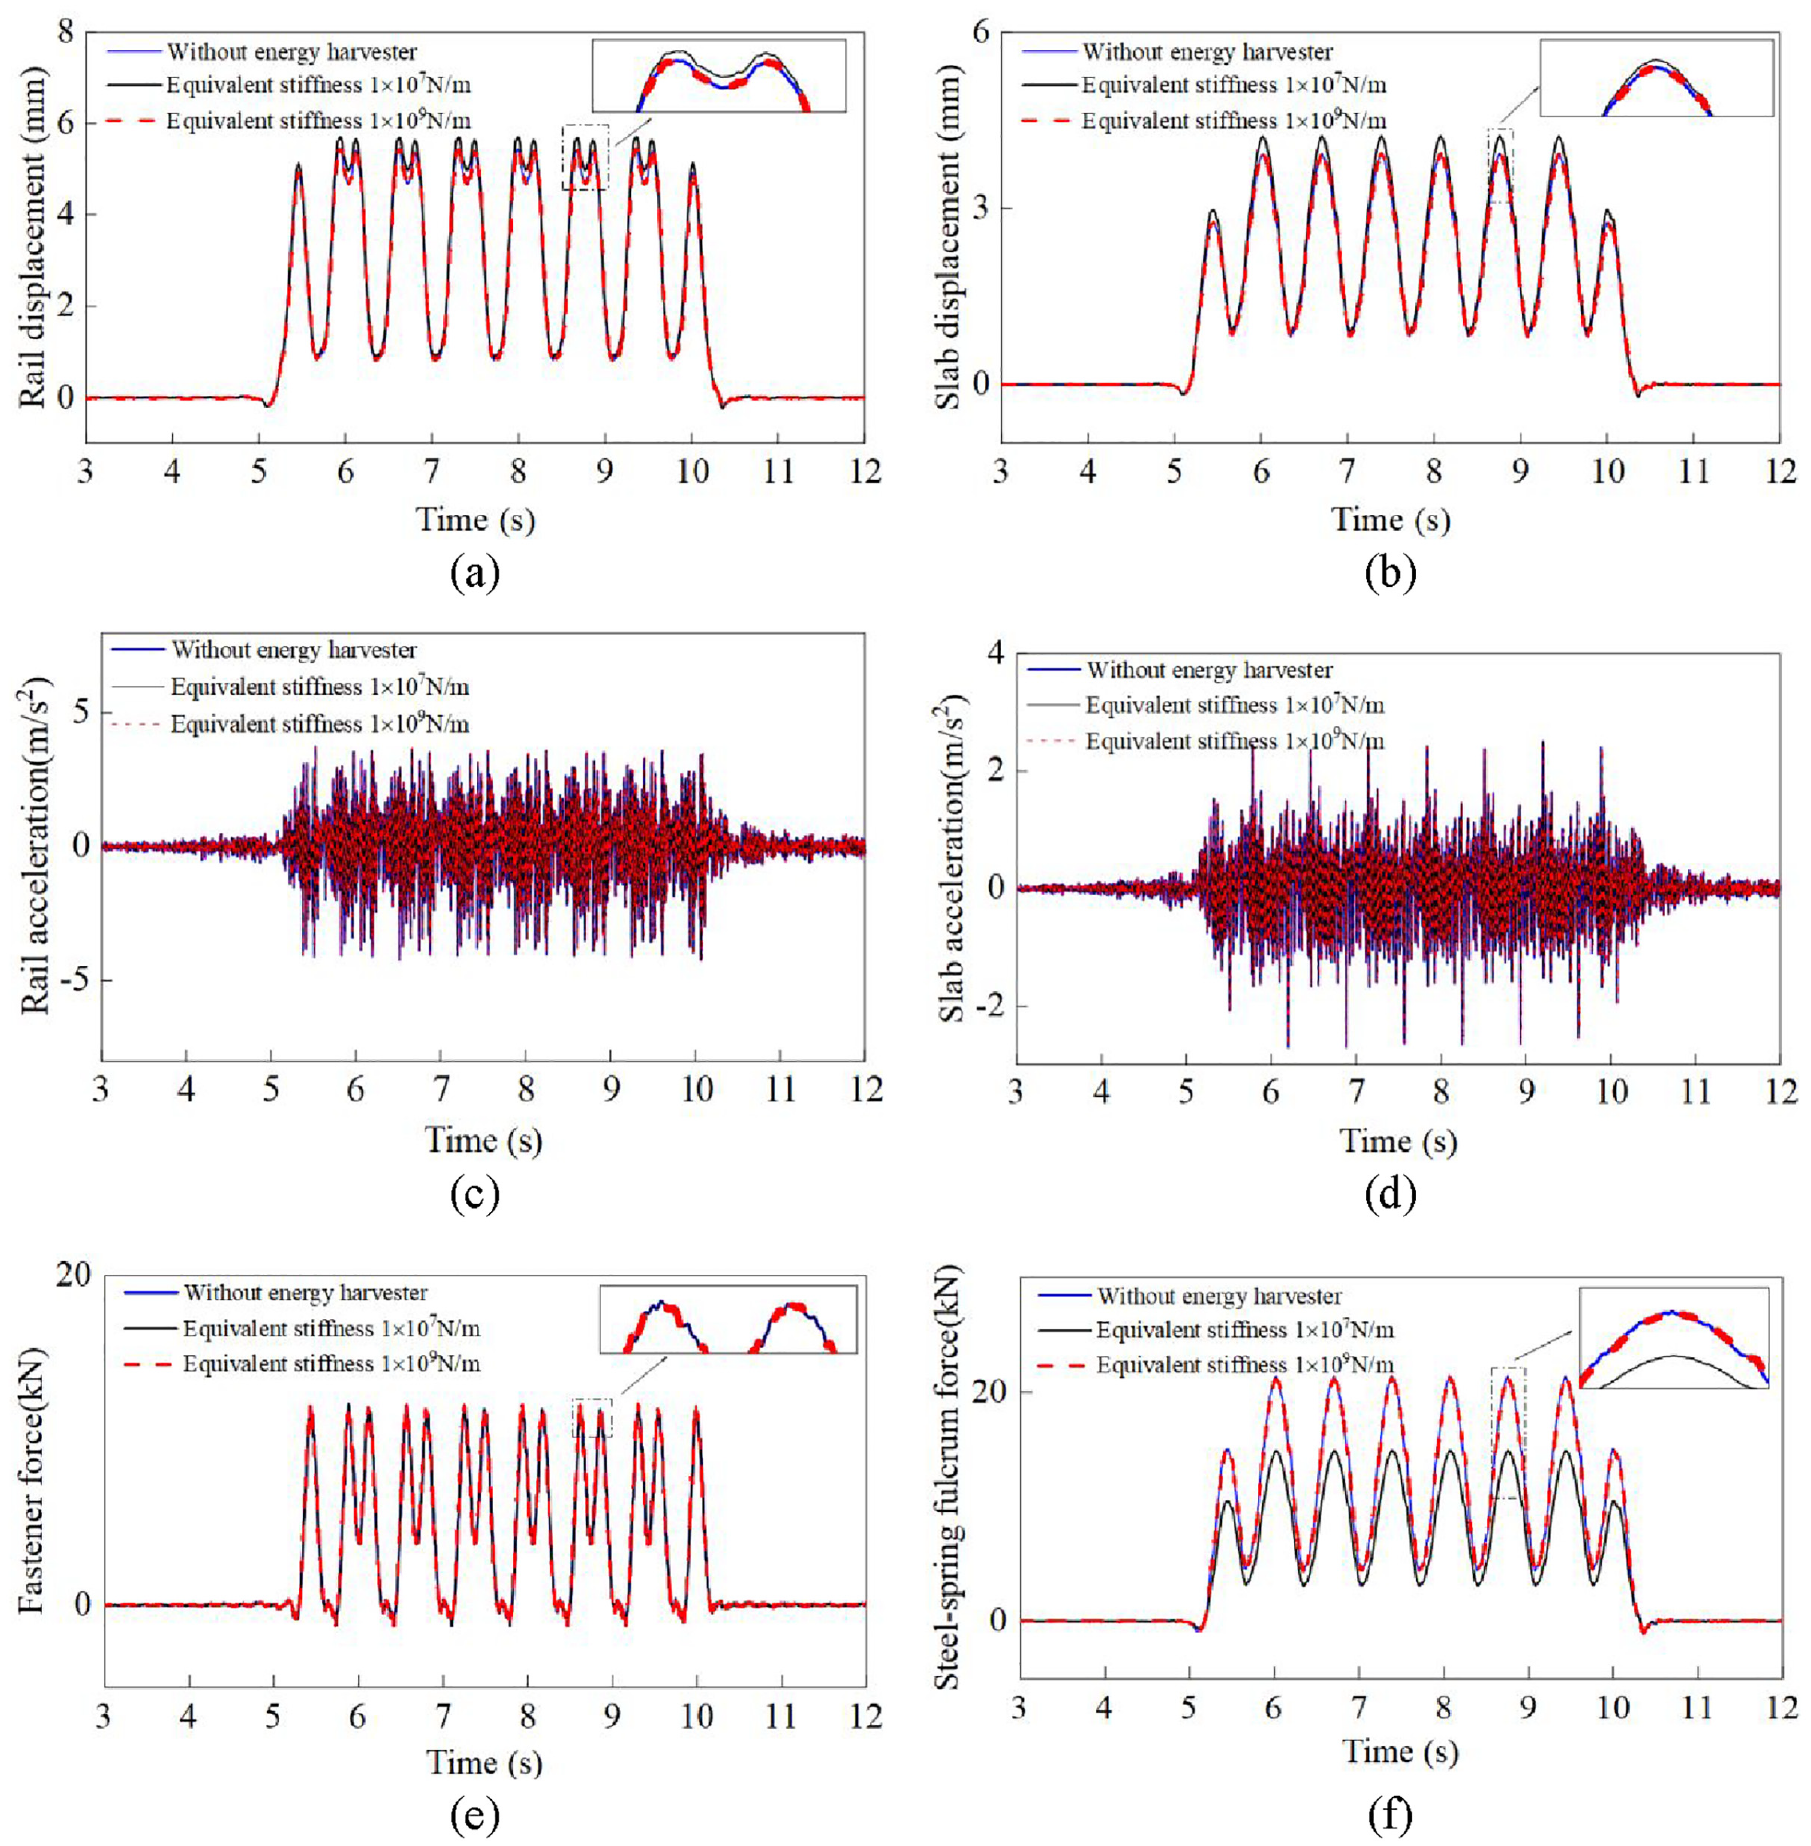
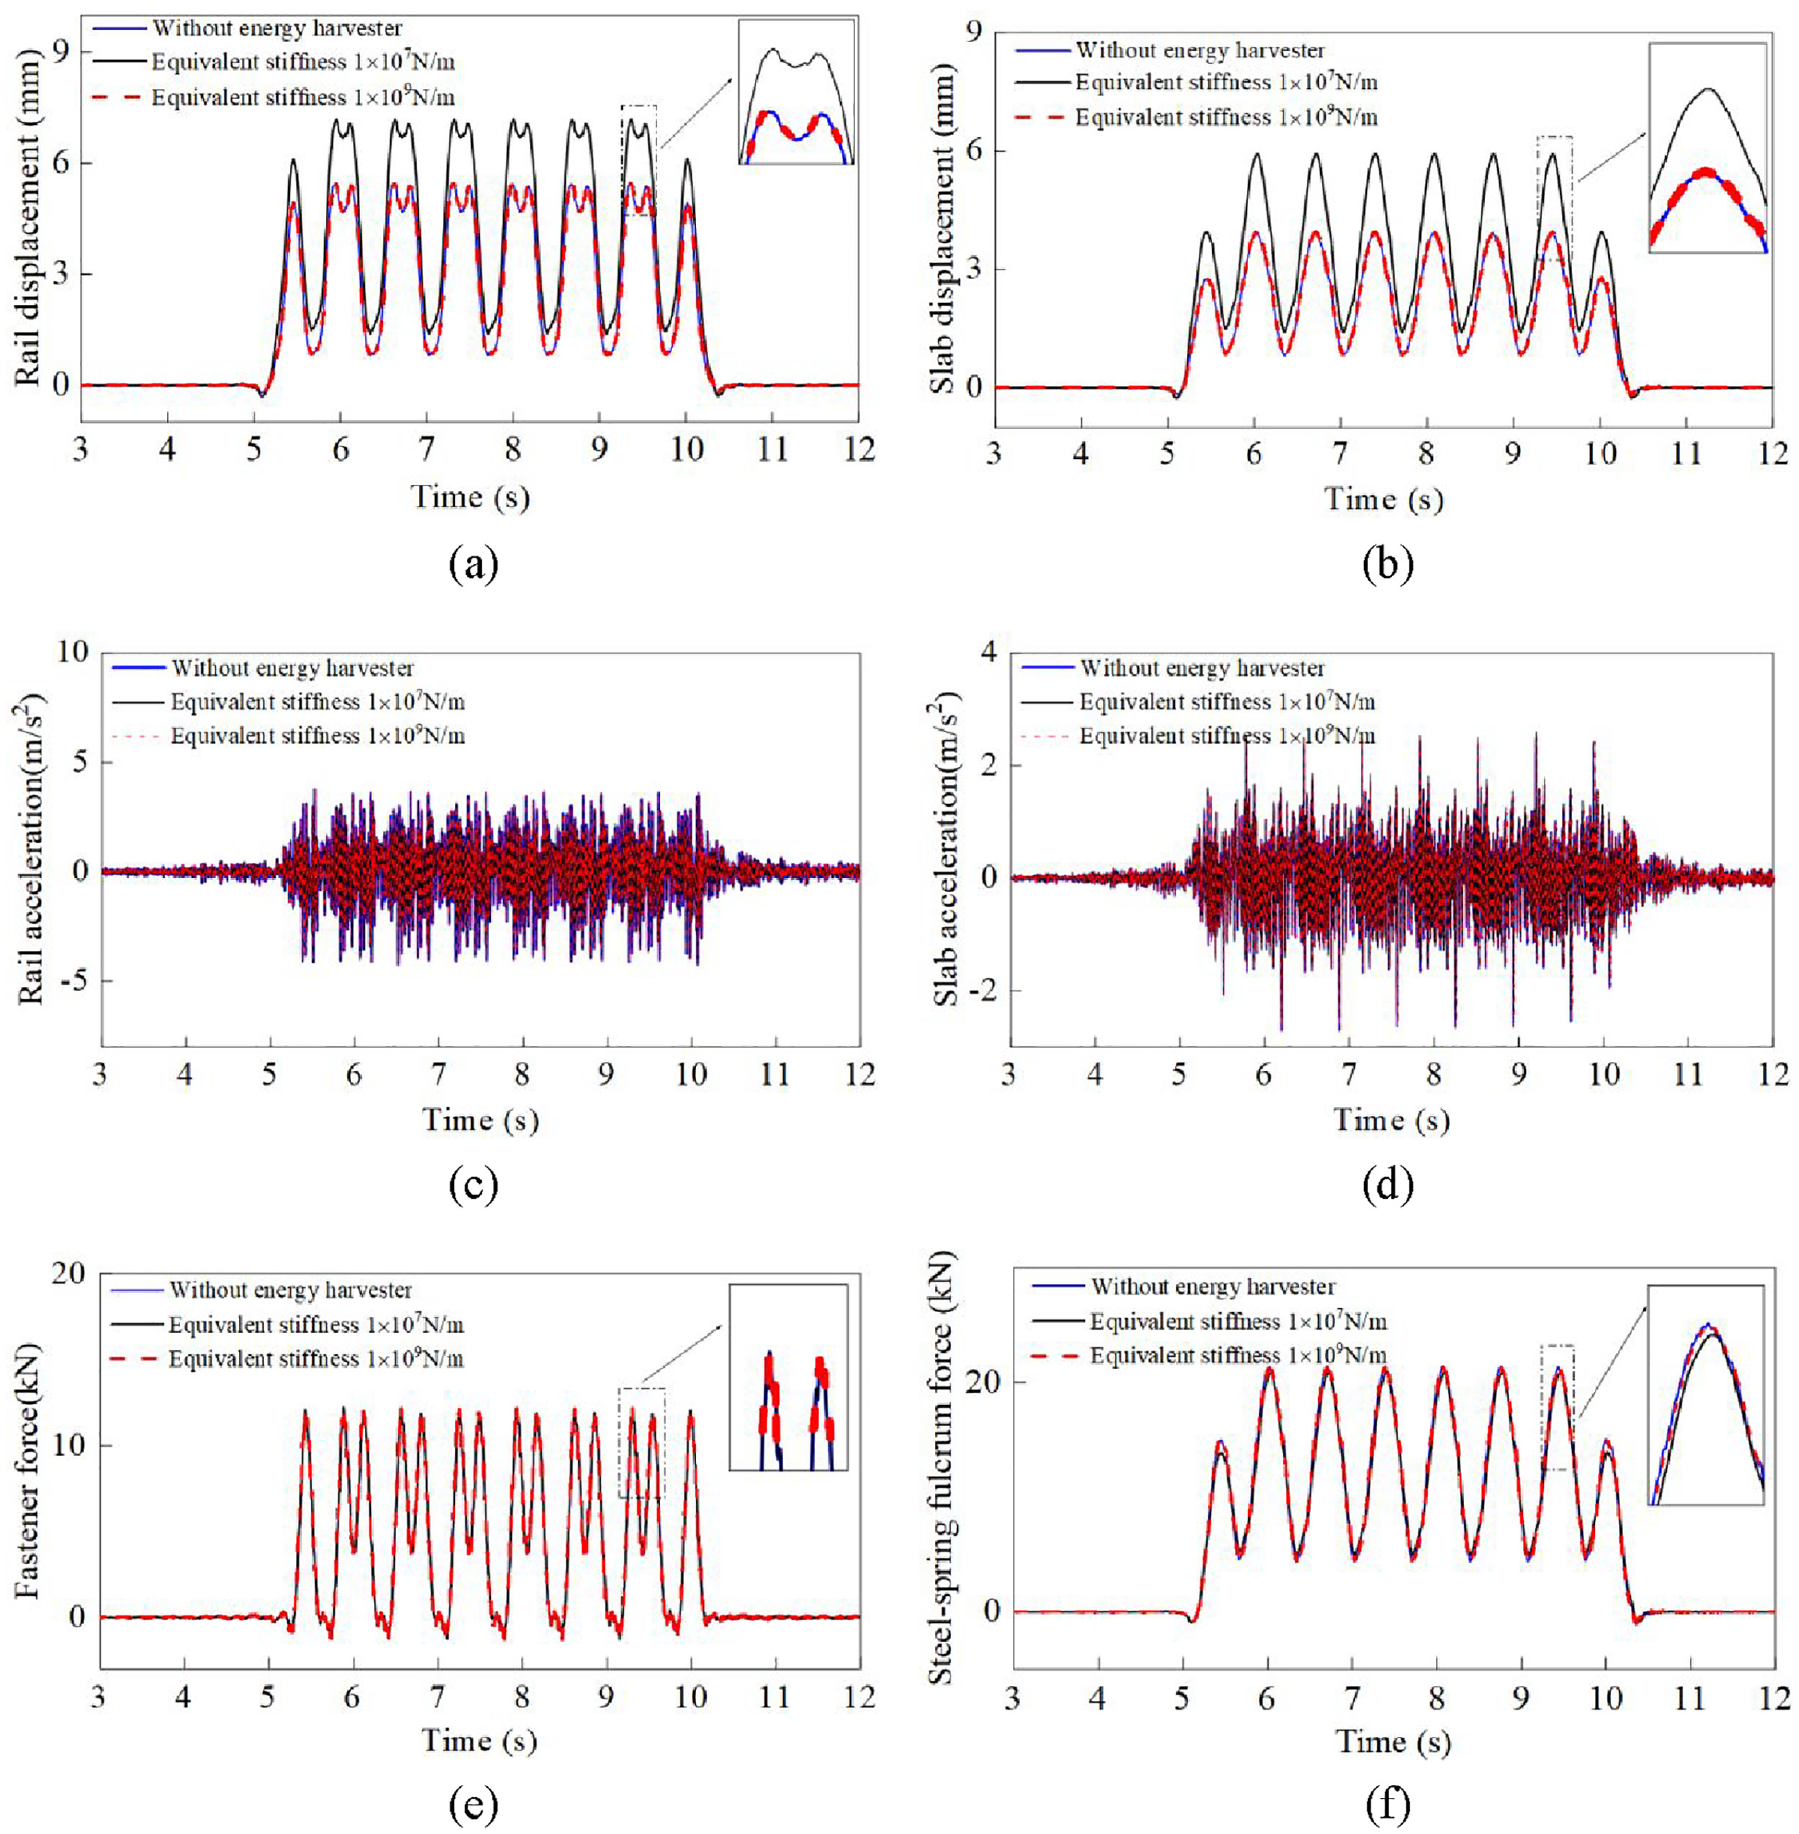
Figures 9 and 10 show the important parameters reflecting dynamic performance, including the rail displacement, slab displacement, rail acceleration, slab acceleration, steel-spring fulcrum force, and fastener force at the head of the slab with different equivalent stiffness when installation methods 1 and 3 are used, respectively. Figures 11 and 12 show these important parameters reflecting dynamic performance at the middle of the slab with different equivalent stiffness when installation methods 2 and 3 are adopted, respectively. Here, it should be pointed out that for the installation method 1, the data for the rail displacement, rail acceleration, slab displacement, slab acceleration and steel-spring fulcrum force are selected at the place where the harvester is installed (i.e., at the first steel-spring isolator position, x = 270.6 m), and the data for the fastener force is selected at the left fastener of this place (i.e. at the first fastener). For the installation method 2, the data for the rail displacement, rail acceleration, slab displacement, slab acceleration and steel-spring fulcrum force are selected at middle of the slab (x = 279 m), and the data for the fastener force is selected at the right fastener of this place (i.e. at the 15th fastener). For the installation method 3, these important parameters are selected at the locations corresponding to the two installation methods mentioned above, for comparison purposes. In addition, the data for the case without the energy harvester are also addressed to distinguish difference from the case with the energy harvester.
Dynamic performance at the head of the slab for different equivalent stiffness of the energy harvester (Installation method 1).
Dynamic performance at the head of the slab for different equivalent stiffness of the energy harvester (Installation method 3).
Dynamic performance at the middle of the slab with different equivalent stiffness (Installation method 2).
Dynamic performance of at the middle of the slab for different equivalent stiffness (Installation method 3).
From Figures 9 and 10, it can be observed that for both installation methods 1 and 3, variations in the equivalent stiffness of the energy harvester exert a notable influence on the rail displacement, slab displacement, fastener force and steel-spring fulcrum force at the head of slab. Furthermore, when compared to the installation method 1, the installation method 3 has a much more effect on rail displacement, slab displacement and fastener force, and a smaller effect on steel-spring fulcrum force. However, there is no significant effect on the rail acceleration and slab acceleration for different equivalent stiffness of the energy harvester.
Similarly, from Figures 11 and 12, it can be also found that for both installation methods 2 and 3, different equivalent stiffnesses of the energy harvester will have some influence on the rail displacement, slab displacement and steel-spring fulcrum force at the middle of slab. Besides, the installation method 3 has a much more effect on the rail displacement and slab displacement, and a smaller effect on steel-spring fulcrum force than the installation method 2. However, the effects of different equivalent stiffness of the energy harvester on rail acceleration, slab acceleration and fastener force are very small.
In a word, the installations of single energy harvester and multiple energy harvesters both affect the dynamic performance of the vehicle-floating slab track system. Compared to the installation of single energy harvester, the installation of multiple energy harvesters has a more obvious effect on rail displacement and slab displacement, and a smaller impact on steel-spring fulcrum force. However, both of them have small effect on rail acceleration, slab acceleration and fastener force.
Further, in order to intuitively understand the influence of equivalent stiffness and different installation methods of the energy harvester on the dynamic performance of the vehicle-floating slab track system, the maximum rail displacement, slab displacement, rail acceleration, slab acceleration, fastener force and steel-spring fulcrum force changing with the equivalent stiffness of the energy harvester for different installation methods are plotted in Figure 13. From Figure 13, it can be seen that when the equivalent stiffness of the energy harvester is increased, the maximum rail displacement and slab displacement decrease gradually, the steel-spring fulcrum force increases gradually, the rail acceleration experiences a slight increase but remains relatively stable, the slab acceleration in the middle of the slab increases for installation methods 2 and 3, the slab acceleration at the head of the slab decreases for installation methods 1 and 3, the fastener force in the middle of the slab remains almost the same for installation methods 2 and 3, and the fastener force at the head of the slab gradually increases for installation method 1 but decreases for installation method 3. The physical explanation for these results is as follows. At the energy harvester installation location, the equivalent stiffness of the energy harvester and the stiffness of the steel-spring isolator are connected in series. For the installation method 1 and the installation method 2, which both involve the installation of only one PSBR, when the equivalent stiffness is smaller, the total stiffness at the installation location is reduced compared to that of the original steel-spring isolator, while the stiffness of the remaining isolators remains unchanged. This situation is analogous to support failure (Zhai, 2018), leading to increased rail and slab displacement at the installation location. In addition, since the order of stiffness is significantly greater than that of slab displacement, even when the slab displacement is larger, the steel-spring fulcrum force remains smaller. For the installation method 3, which involves the installation of multiple PSBRs, when the equivalent stiffness is smaller, the overall stiffness of the track is reduced. This reduction also leads to a decrease in the steel-spring fulcrum force, as well as an increase in the rail displacement and the slab displacement. The fastener force is influenced by the difference in the displacement and velocity between the rail and slab, while the accelerations are dictated by the interplay of wheel-rail force, displacement and velocity. These values need be determined by actual calculations, hence the change rules do not exhibit a definitive trend.
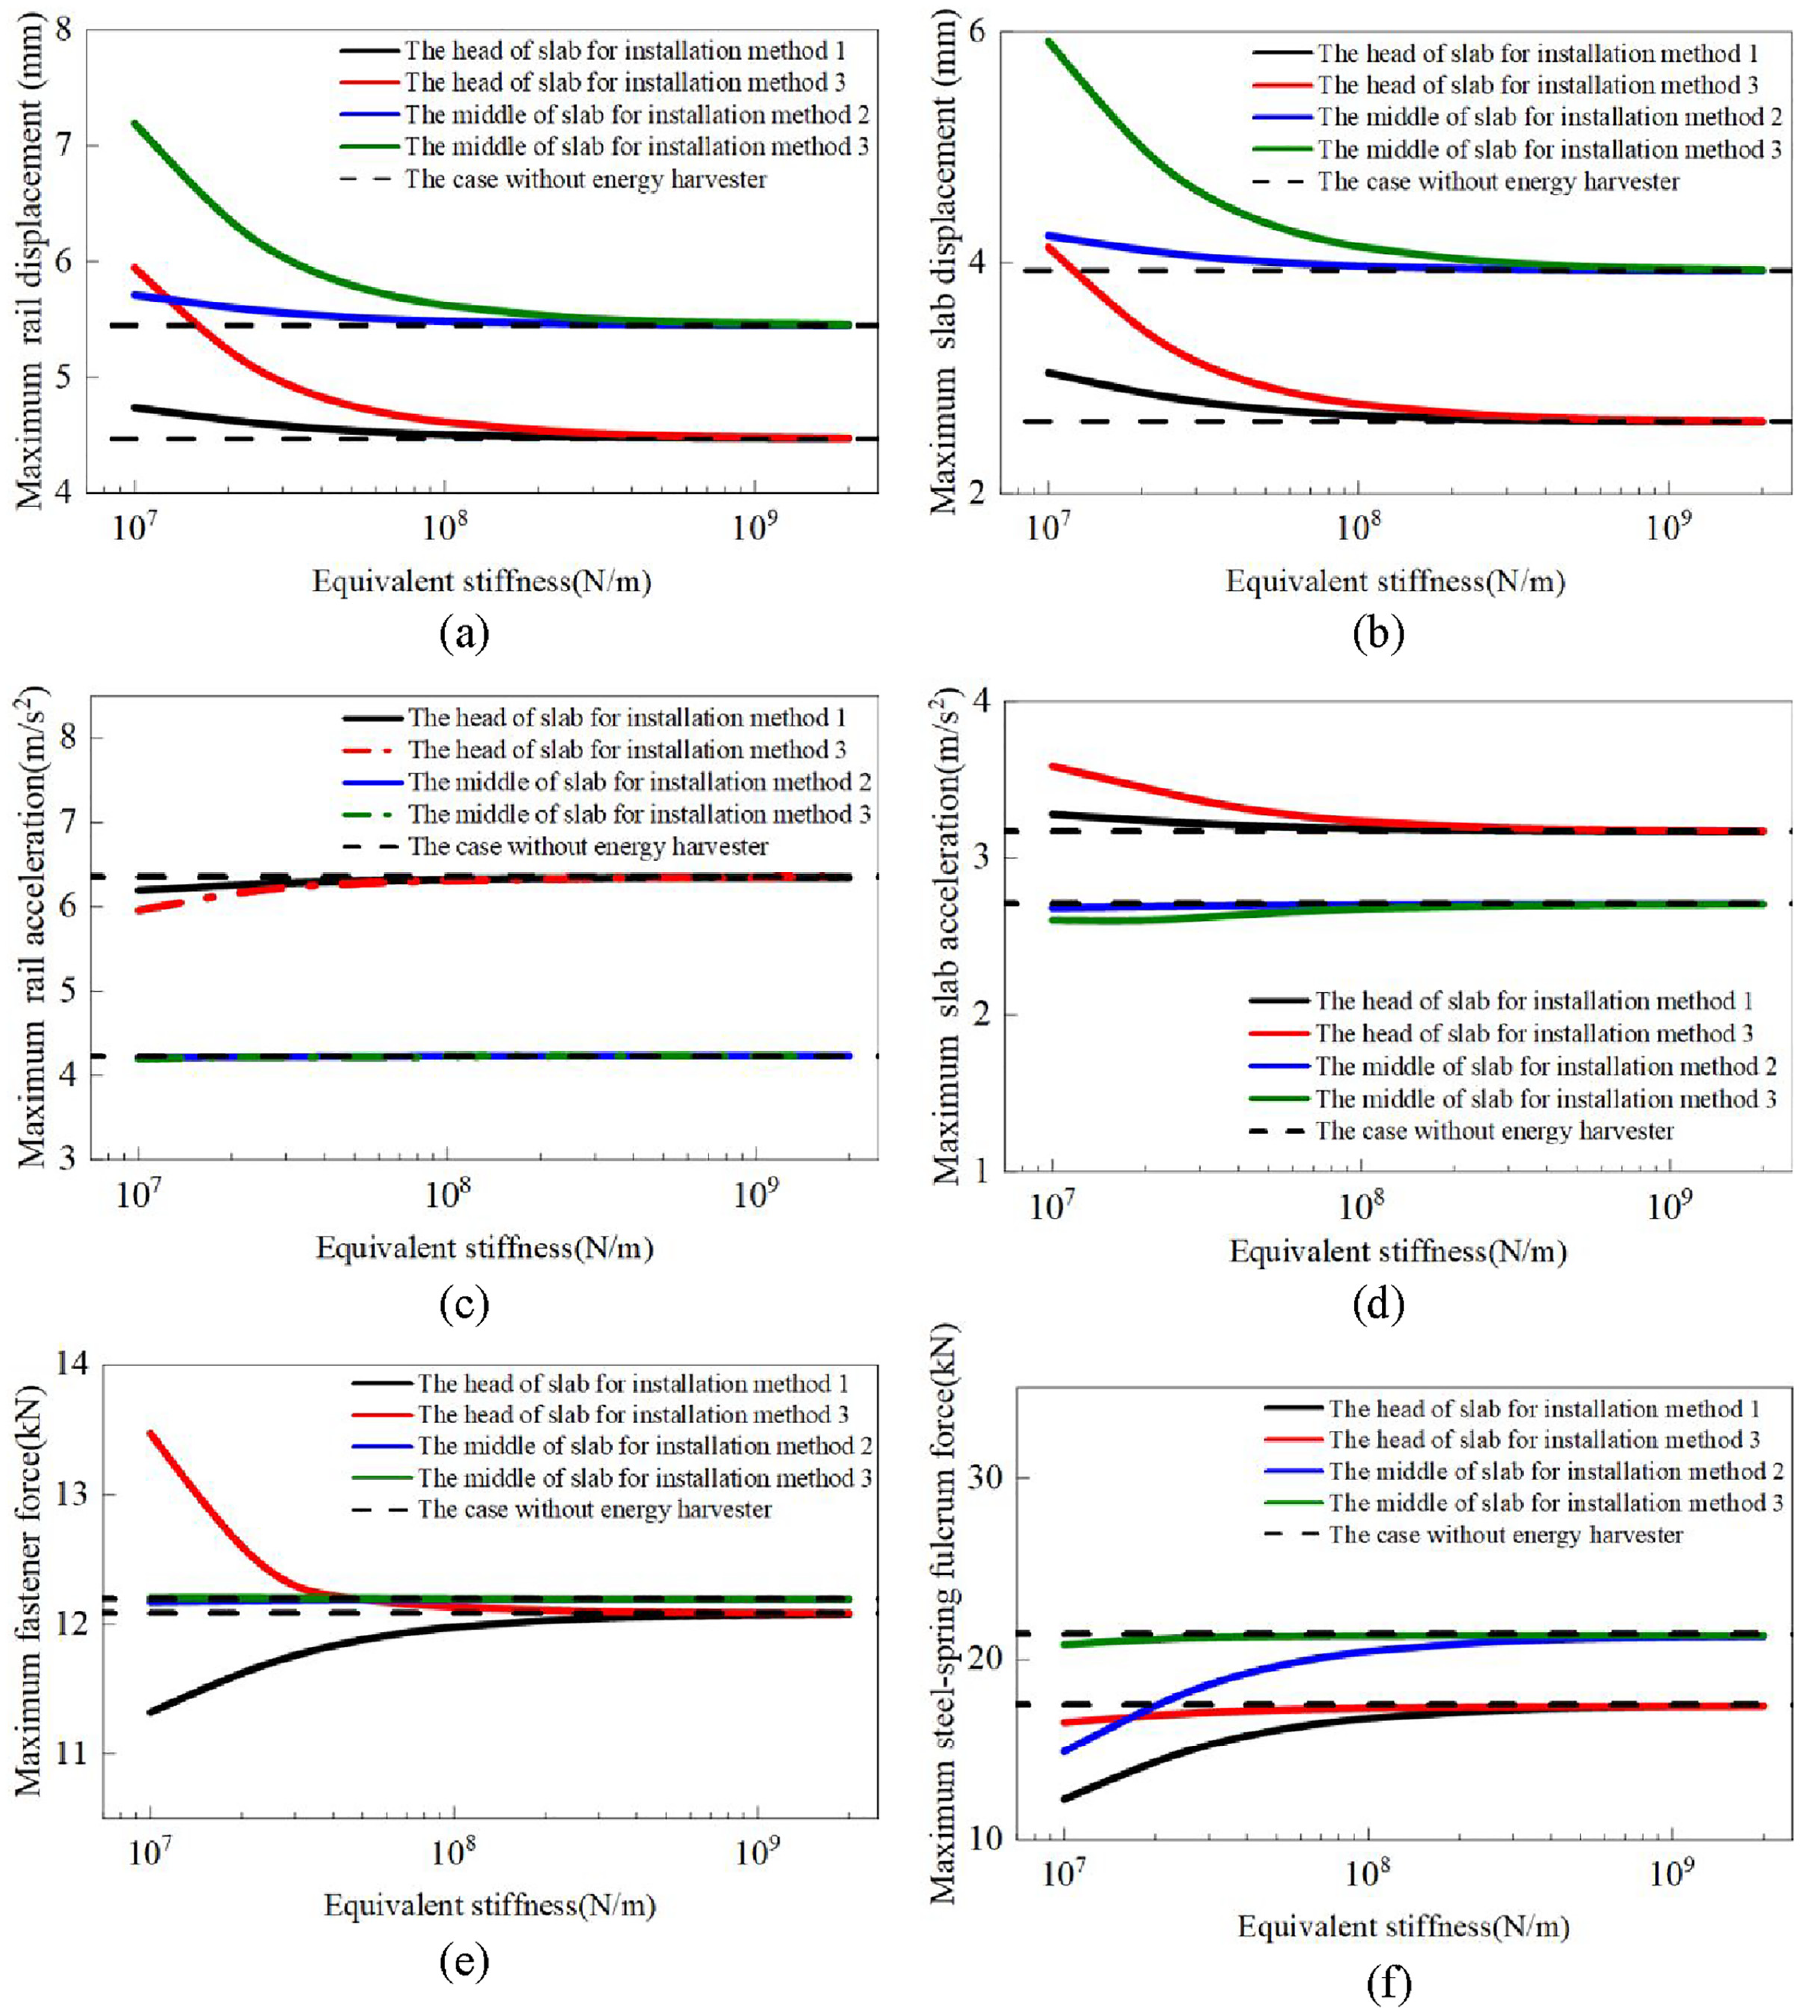
The important parameters reflecting dynamic performance changing with the equivalent stiffness of the energy harvester for different installation methods.
Furthermore, for different installation methods, when the equivalent stiffness reaches a specific value, the results at the same position will tend to be the same values, respectively. The same value corresponds to the result of the case without the energy harvester. In other words, for energy harvesters with relatively high equivalent stiffness, installing either a single or multiple energy harvesters under the floating slab has no impact on the dynamic performance of the vehicle-floating slab track system. The physical explanation for this phenomenon is that at the energy harvester installation location, the equivalent stiffness of the energy harvester and the stiffness of the steel-spring isolator are connected in series. When the equivalent stiffness of the energy harvester is very high, it dominates the total stiffness at the installation location, making it similar to the stiffness of the original steel-spring isolator. As a result, the cases with and without the energy harvester exhibit almost the same behavior and characteristics.
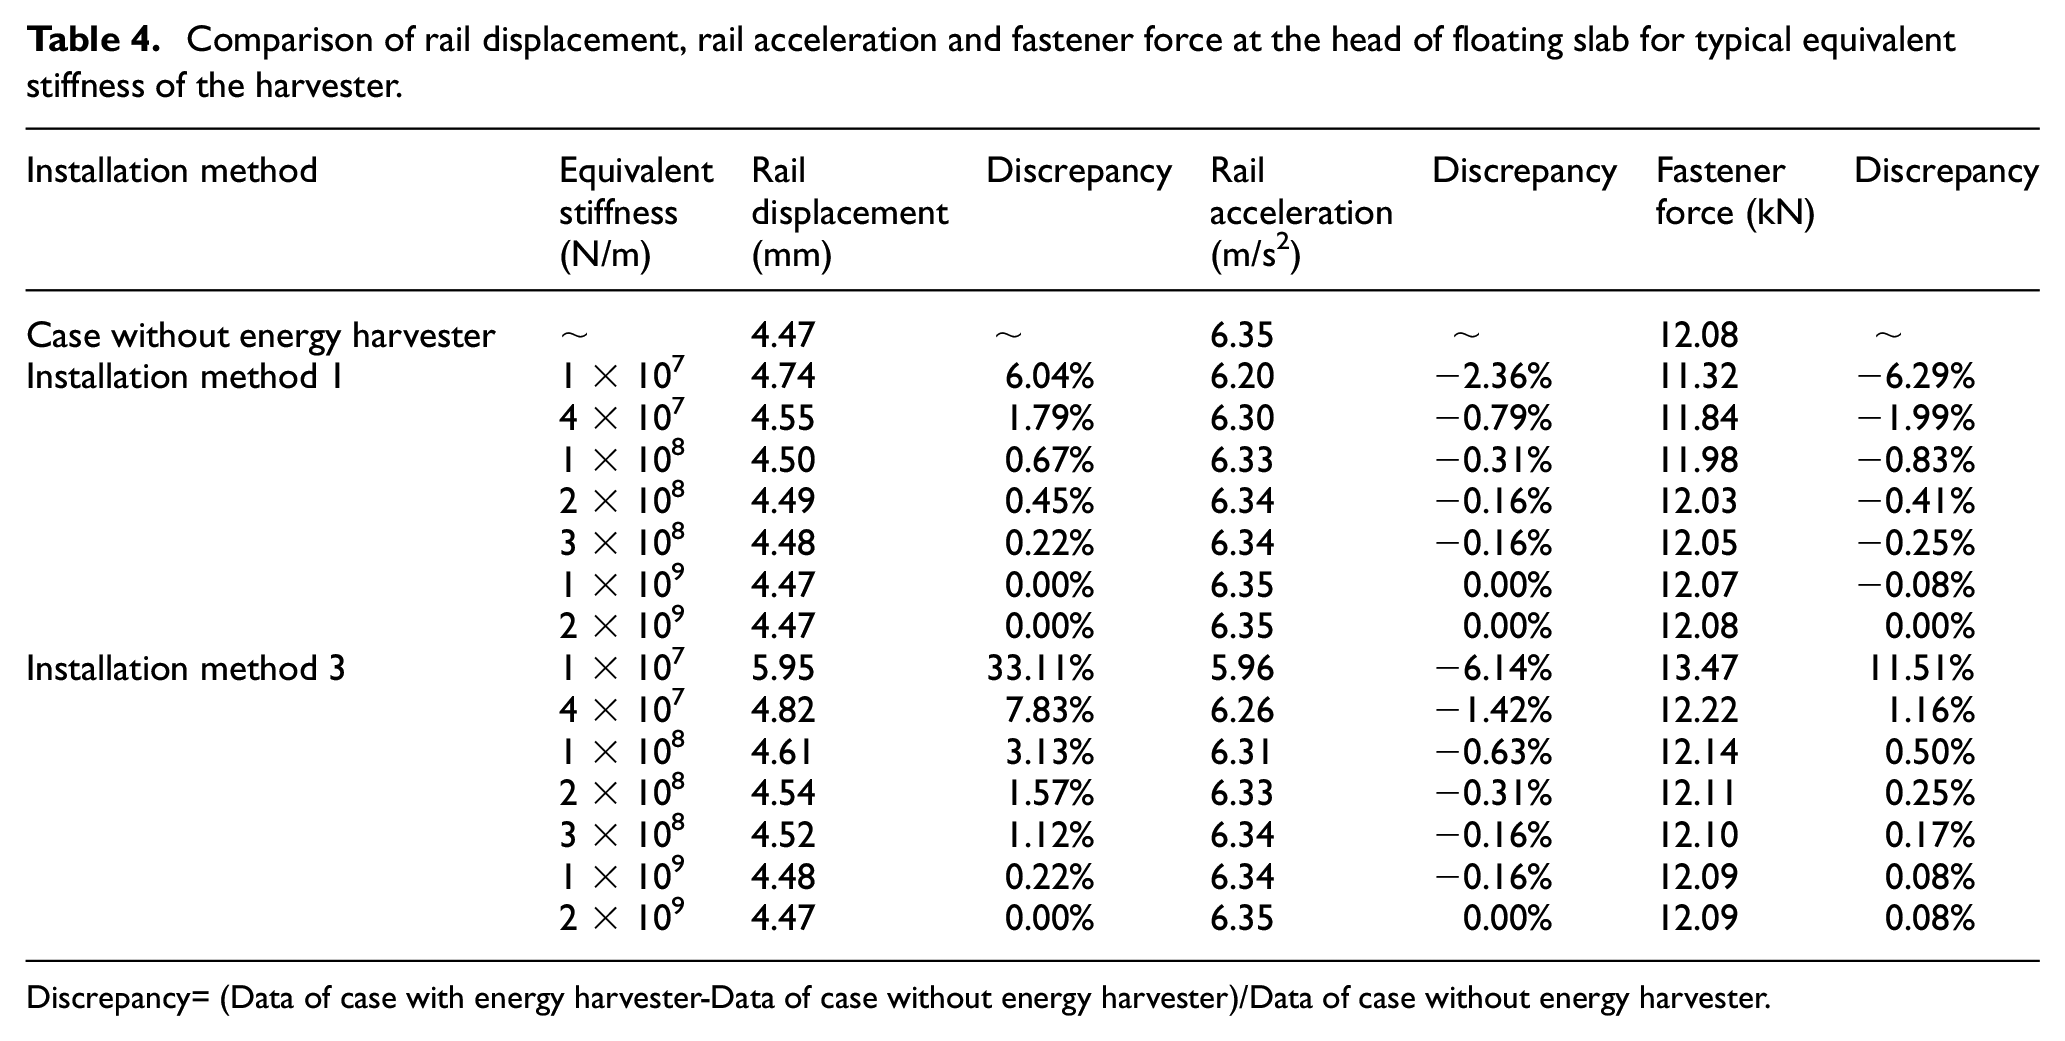
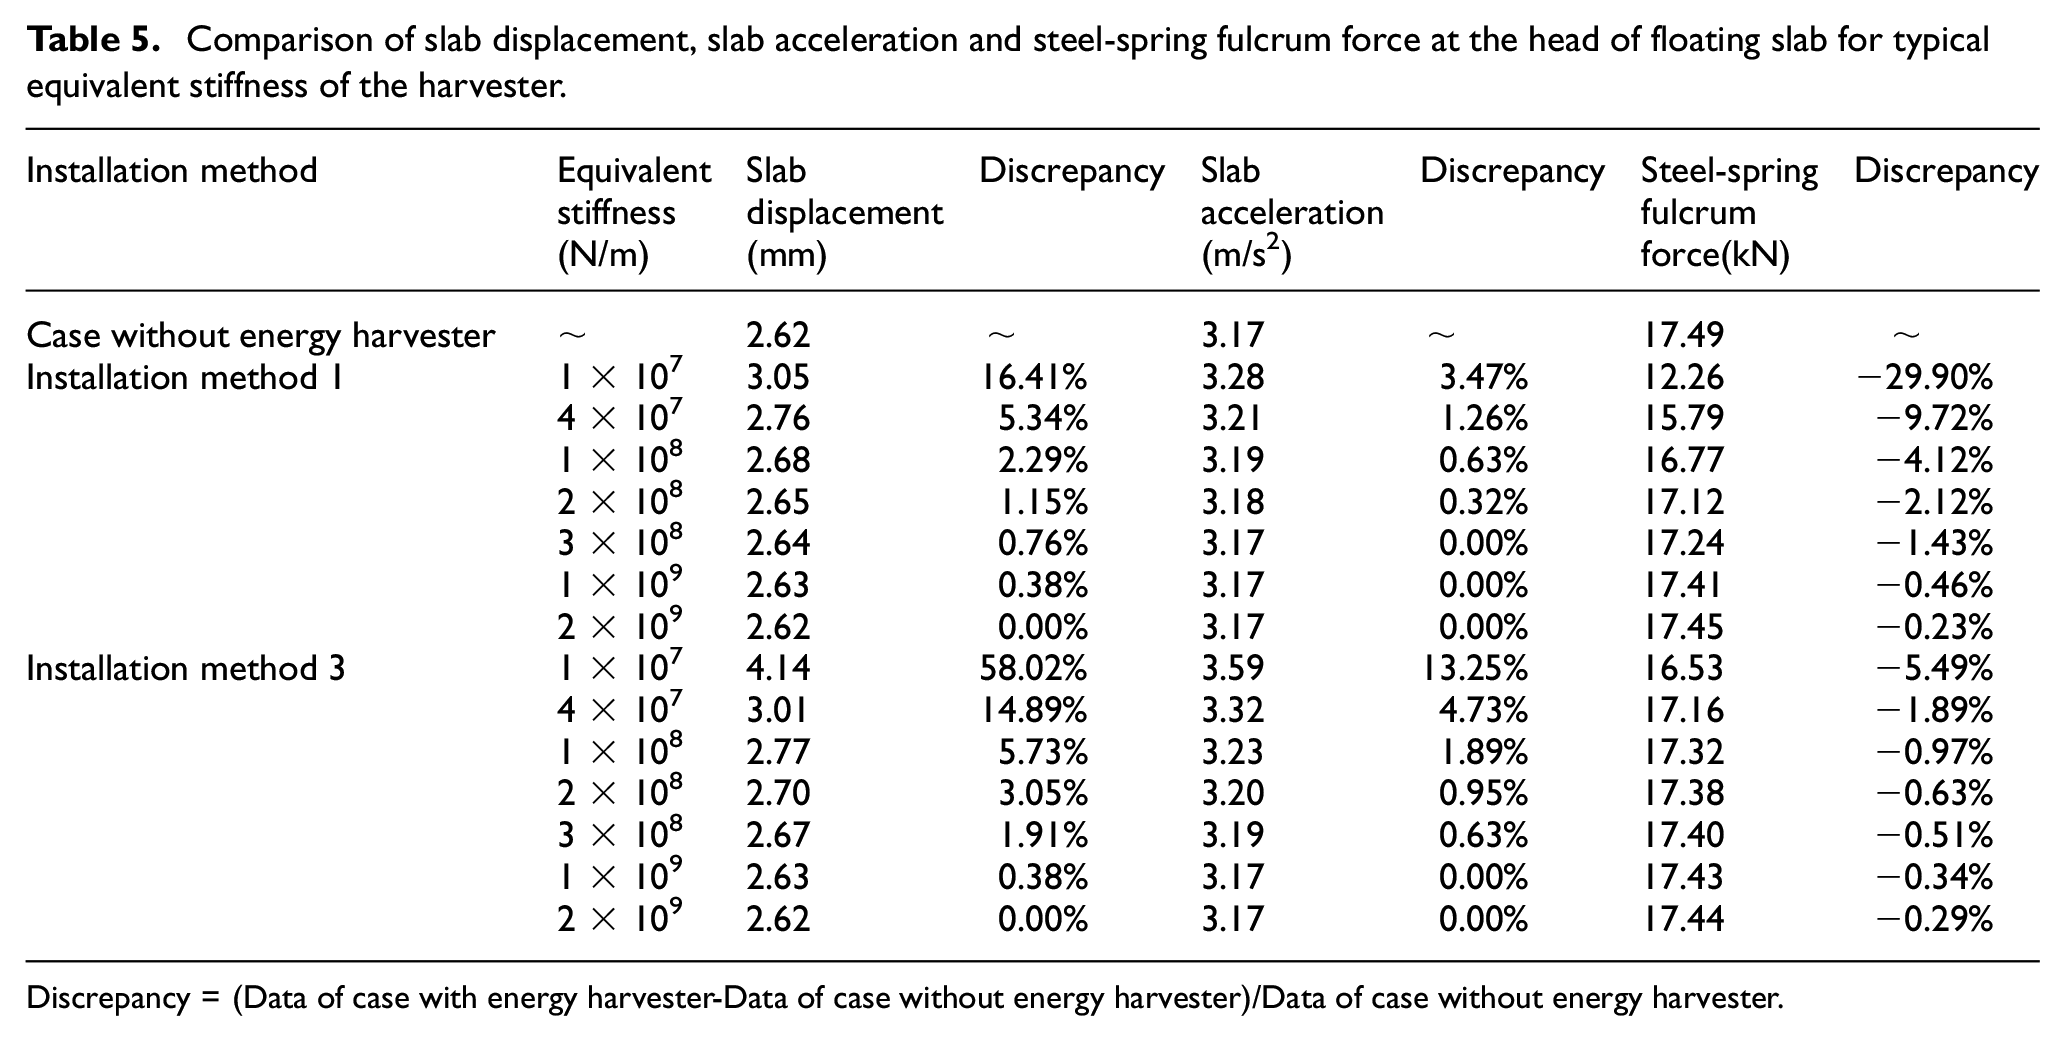
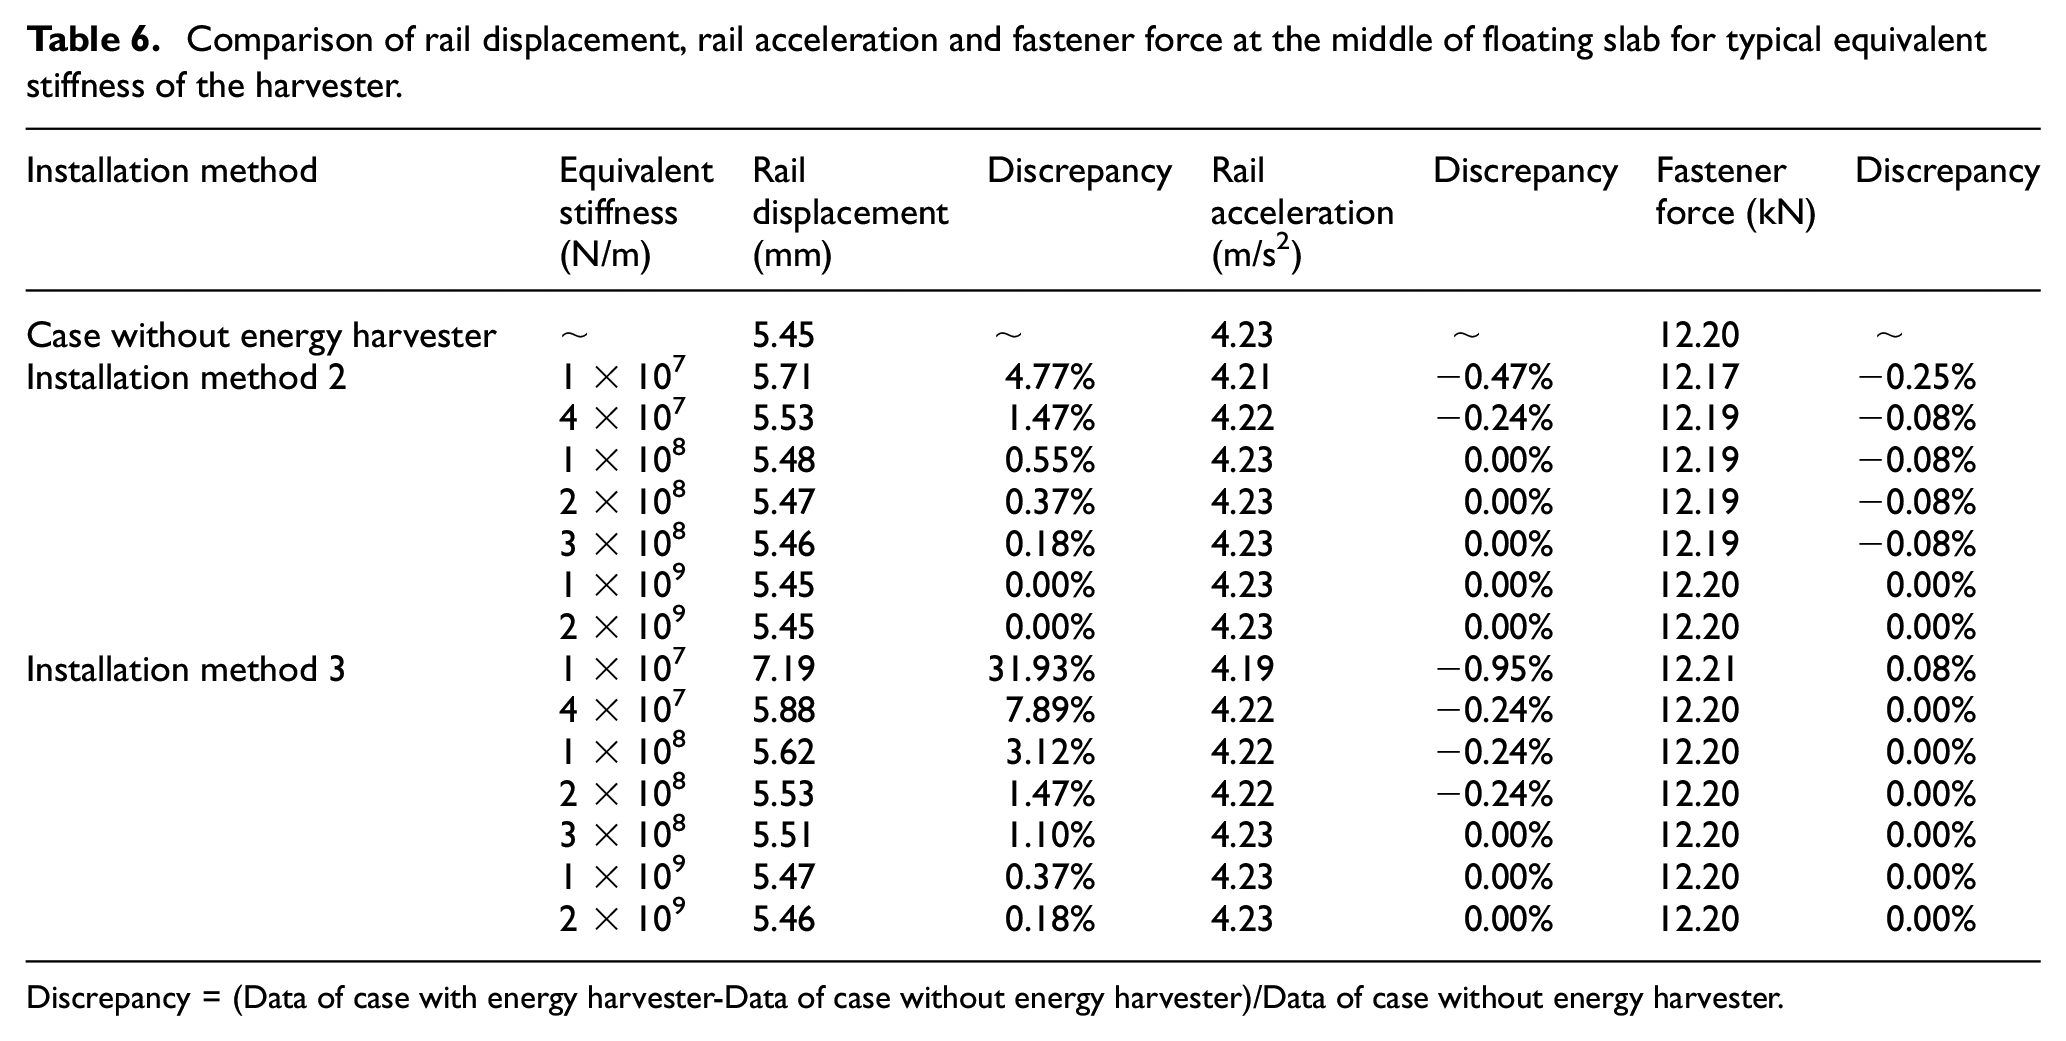
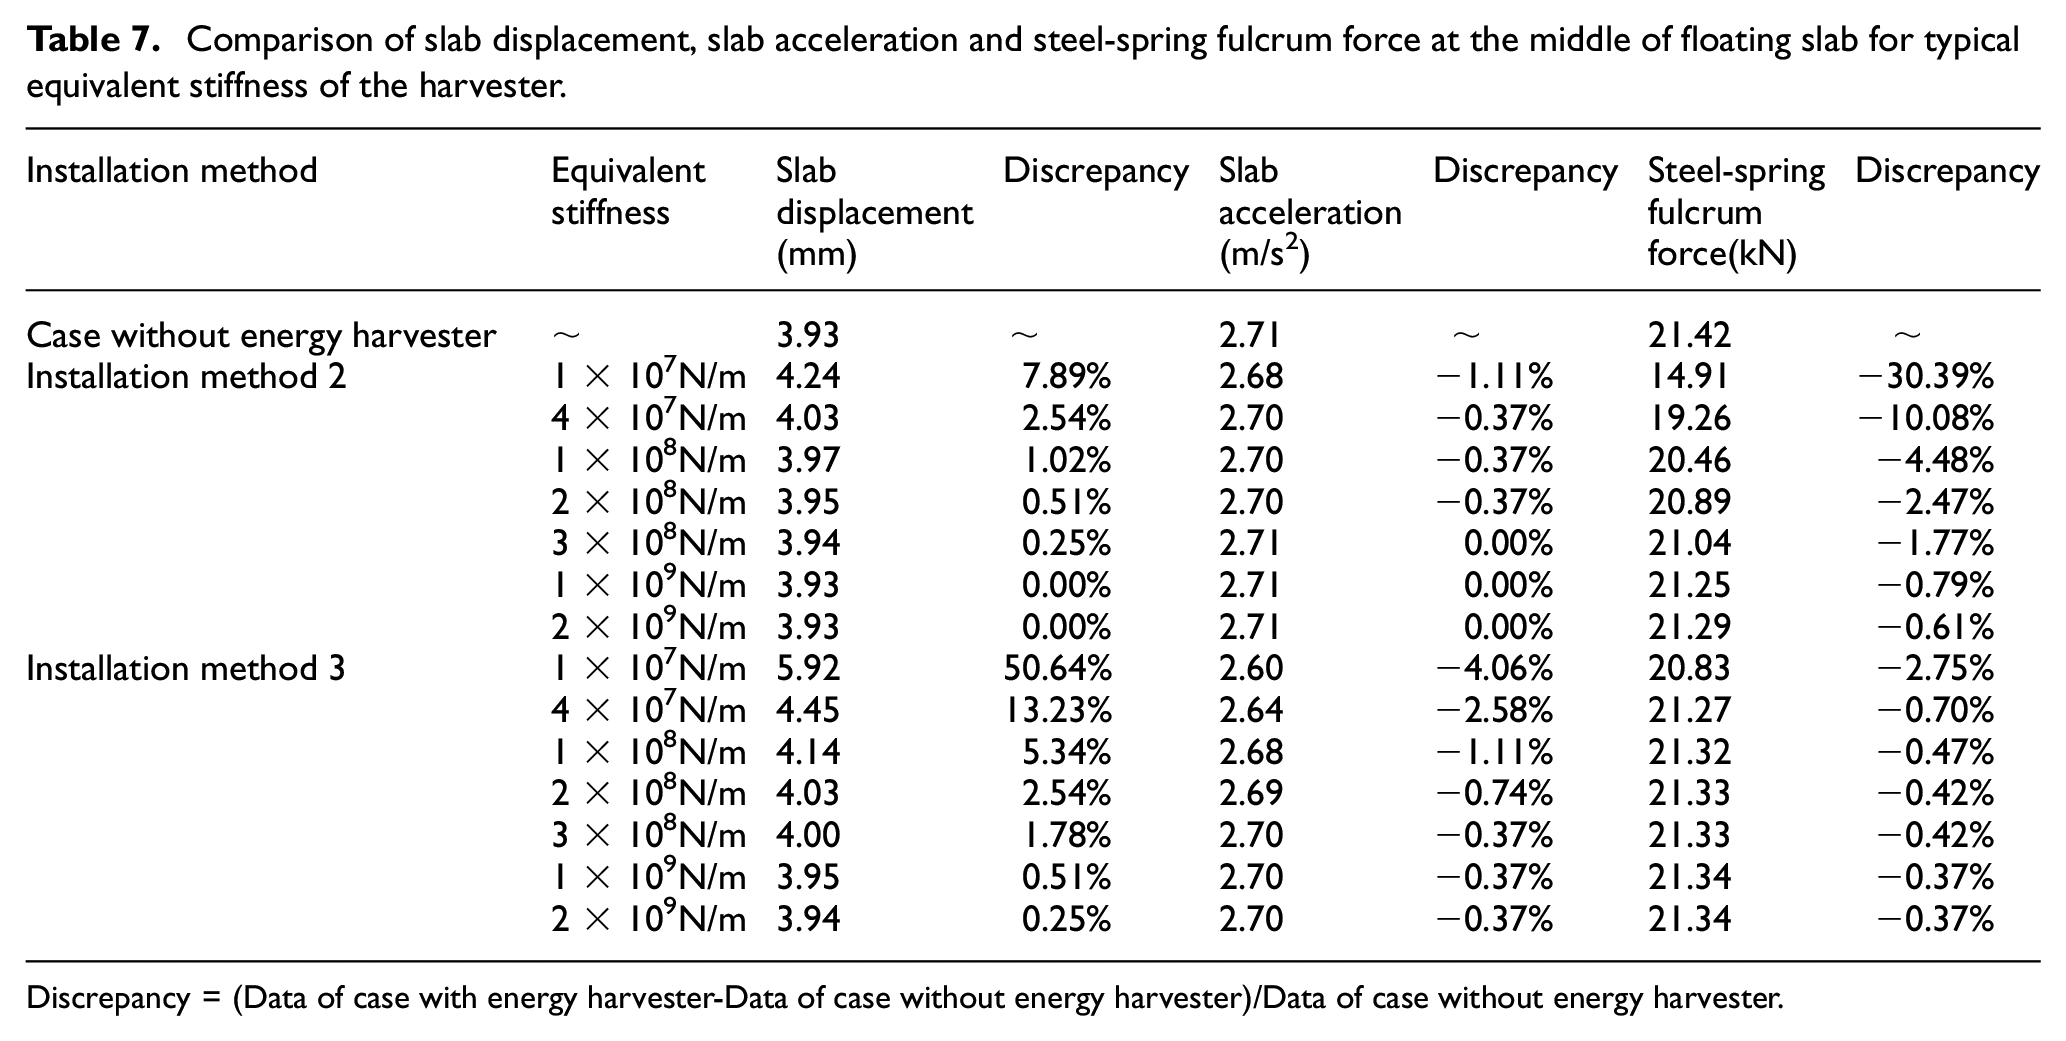
In practice, in order to ensure the safety of train operation, it is expected that the installation effect of the energy harvesters on the dynamic performance of the vehicle-floating slab track system should be very small, even negligible. Therefore, some typical parameters in the range of 1 × 10⁷N/m∼2 × 109N/m are selected for detailed comparison and analysis, as shown in Tables 4 to 7.
Comparison of rail displacement, rail acceleration and fastener force at the head of floating slab for typical equivalent stiffness of the harvester.
Discrepancy= (Data of case with energy harvester-Data of case without energy harvester)/Data of case without energy harvester.
Comparison of slab displacement, slab acceleration and steel-spring fulcrum force at the head of floating slab for typical equivalent stiffness of the harvester.
Discrepancy = (Data of case with energy harvester-Data of case without energy harvester)/Data of case without energy harvester.
Comparison of rail displacement, rail acceleration and fastener force at the middle of floating slab for typical equivalent stiffness of the harvester.
Discrepancy = (Data of case with energy harvester-Data of case without energy harvester)/Data of case without energy harvester.
Comparison of slab displacement, slab acceleration and steel-spring fulcrum force at the middle of floating slab for typical equivalent stiffness of the harvester.
Discrepancy = (Data of case with energy harvester-Data of case without energy harvester)/Data of case without energy harvester.
From Tables 4 to 7, it can be found that when the equivalent stiffness of the energy harvester increases from 1 × 10⁷ N/m to 2 × 10⁹ N/m, the discrepancies between the cases with and without energy harvester for all the important parameters will gradually diminish, and may even vanish. For the equivalent stiffness of 1 × 10⁷ N/m, the discrepancies for all the important parameters are largest. For the equivalent stiffness of 2 × 10⁹ N/m, the discrepancies are smallest.
For the installation method 1, the steel-spring fulcrum force has the maximum discrepancy, which increases from 12.26 to 17.45 kN, and the discrepancy decreases from 29.90% to 0.23%. The rail acceleration has the minimum discrepancy, which is increased from 6.20 to 6.35 m/s2, and the discrepancy is reduced from 2.36% to 0.00%. For the installation method 2, the steel-spring fulcrum force has the maximum discrepancy, which is increased from 14.91 to 21.29 kN, and the discrepancy is decreased from 30.39% to 0.61%. The rail acceleration has the minimum discrepancy, which remains almost unchanged. For the installation method 3, the slab displacement has the maximum discrepancy, which decreases from 4.14 to 2.62 mm, and the discrepancy decreases from 58.02% to 0.00%. The fastener force has the minimum discrepancy, which decreases from 12.21 to 12.20 kN, almost unchanged. The possible reasons for the discrepancies in the parameters could be as follows. The installation methods 1 and 2 are single installation types, which directly affect the total stiffness at the installation location related to the steel-spring fulcrum force. On the other hand, the installation method 3 is a multiple installation type, which directly affects the overall stiffness of the track related to the slab displacement. As a result, these parameters exhibit the maximum discrepancy.
In addition, for the installation methods 1 and 2, that is, the installation of single energy harvester, when the equivalent stiffness is 2 × 10⁸ N/m, the maximum discrepancies are not more than 4%. For the installation method 3, that is, the installation of multiple energy harvesters, when the equivalent stiffness is 2 × 10⁸ N/m, the maximum discrepancies are not more than 4%. When the equivalent stiffness is 1 × 10⁹ N/m, the maximum discrepancies are not more than 0.60%. In practical applications, based on different installation methods, the appropriate equivalent stiffness can be chosen for the design and optimize the energy harvester. Generally, when the equivalent stiffness exceeds 1 × 10⁹ N/m, the effect of different installation methods on the dynamic performance of the vehicle-floating slab track system can no longer be considered significant.
Furthermore, the rail acceleration and steel-spring fulcrum force after the PSBR installation should satisfy the following requirements. Firstly, for the rail acceleration, according to “Technical regulation for dynamic inspection acceptance of urban rail transit construction” (DB11/T1714-2020, 2020), the maximum value of rail acceleration cannot exceed 2000 m/s2. For the steel-spring fulcrum force, according to the requirements outlined in the “Technical code for floating slab track” (CJJ/T191-2012, 2012) for steel-spring isolator, the stiffness variation of steel-spring should not exceed 10%. That is to say, the steel-spring fulcrum force is better not exceed 10% after the PSBR installation. When the equivalent stiffness of PSBR is above 1 × 10⁹ N/m, the maximum value of rail acceleration is 6.35 m/s2 and the discrepancy of steel-spring fulcrum force is less than 0.5%, which are both within the acceptable standard values. Secondly, the PSBR is a type of force-driven energy harvester that is highly dependent on the steel-spring fulcrum force, yet independent of the rail acceleration. The higher the force level, the greater the output power. Therefore, making the larger steel-spring fulcrum force is beneficial for enhancing power output. Thirdly, to ensure vehicle operating safety, it is expected that the dynamic performance will remain unaffected after the installation of the PSBR. In other words, the performance of the system without the energy harvester should be nearly identical to that with the energy harvester. Therefore, the PSBR with the larger equivalent stiffness exceeding to 1×10⁹ N/m should be considered, which can ensure that the total stiffness at the installation location trends to that of the original steel-spring isolator. Thus, the steel-spring fulcrum force remains almost unchanged, and can maintain the larger force level to achieve the higher output power.
5. Improved designs and experimental setup
5.1 Improved designs
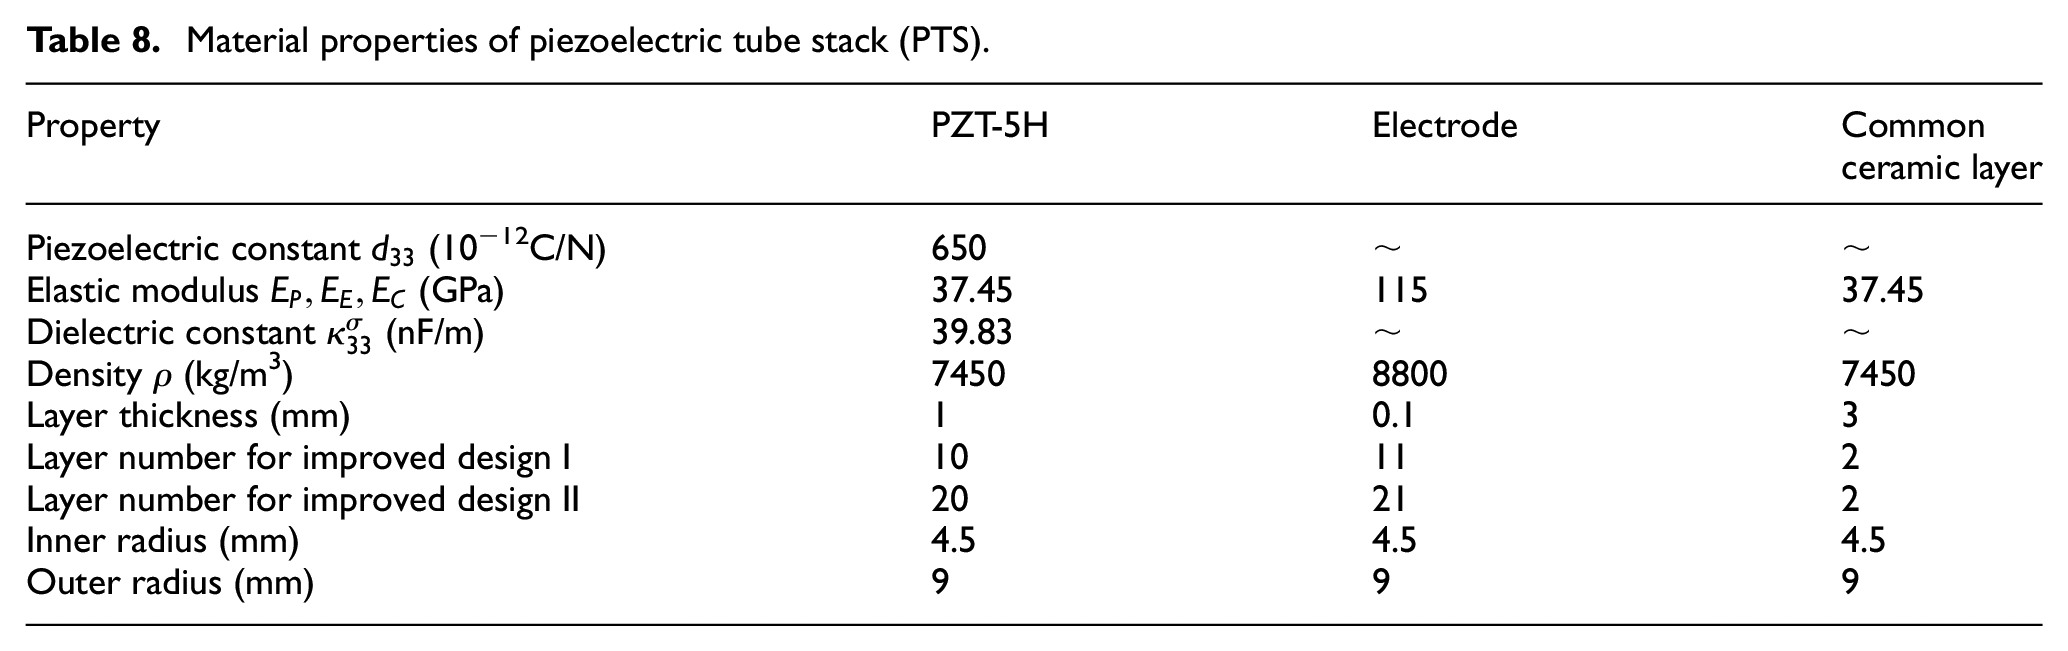
Figure 14 shows the schematic diagram of improved designs for the PSBR. The improved designs are also easy to integrate into the traditional steel-spring isolator, enabling the capturing of energy from the steel-spring fulcrum force. The improved principles mainly encompass three aspects. Firstly, the maximum average power (MAP) can be increased significantly by improving parameter design of piezoelectric stacks (PSs), such as by increasing the layer number of the PS, decreasing the PS radius (i.e. the cross-sectional area of PS) and the PS number, as predicted by the previous theoretical findings (Wang et al., 2022a). Secondly, it is preferable for the equivalent stiffness of the harvester to exceed 1 × 10⁹ N/m to ensure that the effect of different installation methods on the dynamic performance of the vehicle-floating slab track system can be neglected, which is an important finding of the present work. Thirdly, the geometric sizes should maintain the assembly stability of the harvester structure. Finally, compared to the previous design (Wang et al., 2022a), the improved designs I and II only replace twelve piezoelectric stacks (PSs) as six piezoelectric tube stacks (PTSs) of 10 piezoelectric layers and six PTSs of 20 piezoelectric layers, respectively. The aim of the improved design I is to decrease the cross-sectional area of PS and the PS number. The aim of improved design II is to further increase the layer number of the PS, building upon the foundation of the improved design I. For the improved design I, the inner diameter, outer diameter, and height are 76, 192, and 32 mm, respectively. Similarly, for the improved design II, the inner diameter, outer diameter, and height are 76, 192, and 43 mm, respectively. The material properties of the piezoelectric tube stack (PTS) are detailed in Table 8. Here, it should be pointed out that the use of PTSs not only decreases the cross-sectional area of piezoelectric stack, but also maintains the assembly stability of the harvester structure. In addition, by using the equation (1) and equation (2), the equivalent stiffness for improved design I is 1.41 × 10⁹ N/m, and the equivalent stiffness for improved design II is 1.06 × 10⁹ N/m. Indeed, the equivalent stiffness of PSBR exhibits a notable correlation with its energy harvesting performance. Previous research has demonstrated that under a specific force load, the maximum average power output of the PSBR can be enhanced through various strategies, including increasing the layer number and the layer thickness of the piezoelectric stack, or decreasing the piezoelectric stack radius and the piezoelectric stack number (Wang et al., 2022a). Collectively, these measures lead to a reduction in the equivalent stiffness of the PSBR. That is to say, the smaller the equivalent stiffness, the better the energy harvesting performance becomes.
Schematic diagram of improved designs for the PSBR.
Material properties of piezoelectric tube stack (PTS).
In a word, the idea of optimizing the design is as follows. The previous work has given the improving design rule of PSBR for performance enhancement, which is that the PSBR with the smaller equivalent stiffness will obtain the better energy harvesting performance. Nonetheless, the design parameters fall short of genuinely taking into account the practical application scenarios. Due to the lack of clear understanding regarding the installation effects of PSBRs, the fabricated prototype based on piezoelectric stacks adopted the larger equivalent stiffness to minimize the installation effect, which may lead to the lower performance. Furthermore, there exists ambiguity regarding the actual implementation of the prototype that aims to enhance performance. Therefore, two improved PSBR prototypes are fabricated using piezoelectric tube stacks, which integrate the proven design rule of reducing equivalent stiffness with a careful consideration of installation effects.
5.2 Experimental setup
As shown in Figure 15, the EHP test system of the improved designs is the same as that of the previous design (Wang et al., 2022a), which also includes an MTS landmark servohydraulic testing system, a computer, a resistance control box and a digital oscilloscope. To better compare the performance of different designs, the MTS system also applies two types of force signals that have been reported in previous work. One is the harmonic force, and different force frequencies and force amplitudes are considered. The other is the emulated steel-spring fulcrum force, as reported in the previous work (Hou et al., 2021). Ten cyclic signals are used to simulate that the train runs ten times at the speed of 100 km/h. For a more detailed description, please refer to our earlier work (Wang et al., 2022a).
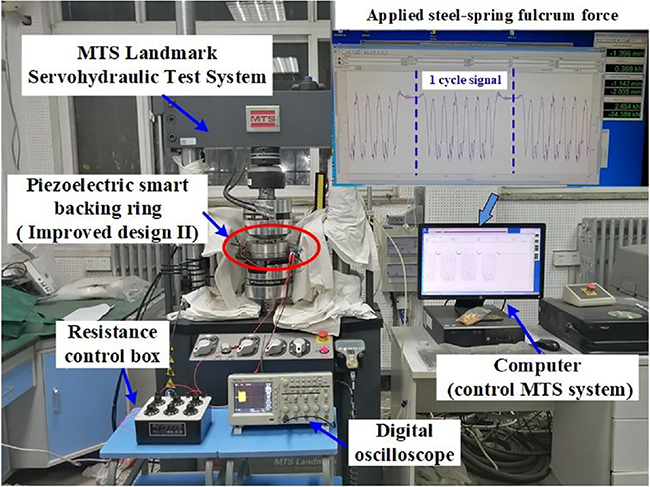
Experimental setup.
6. Comparison of EHP under harmonic force
In this section, the EHP of the improved designs under harmonic force is measured and then is compared to that of the previous design. Firstly, the relationships between the output voltage amplitude and average power of the improved designs I and II and load resistance R for different force amplitudes with f = 5 Hz are presented in Figures 16 and 17, respectively. It can be seen that for a given frequency, the larger force amplitude can generate larger voltage amplitude and average power. Besides, with the increase of the resistance, the output voltage amplitudes of two improved designs increase and trend respectively to the stable values, that is, the open circuit voltage amplitude (OCVA). For two improved designs, there are both a maximum average power (MAP) at the optimal resistance Ropt for each force amplitude, and the MAP increases with the increase of force amplitude.
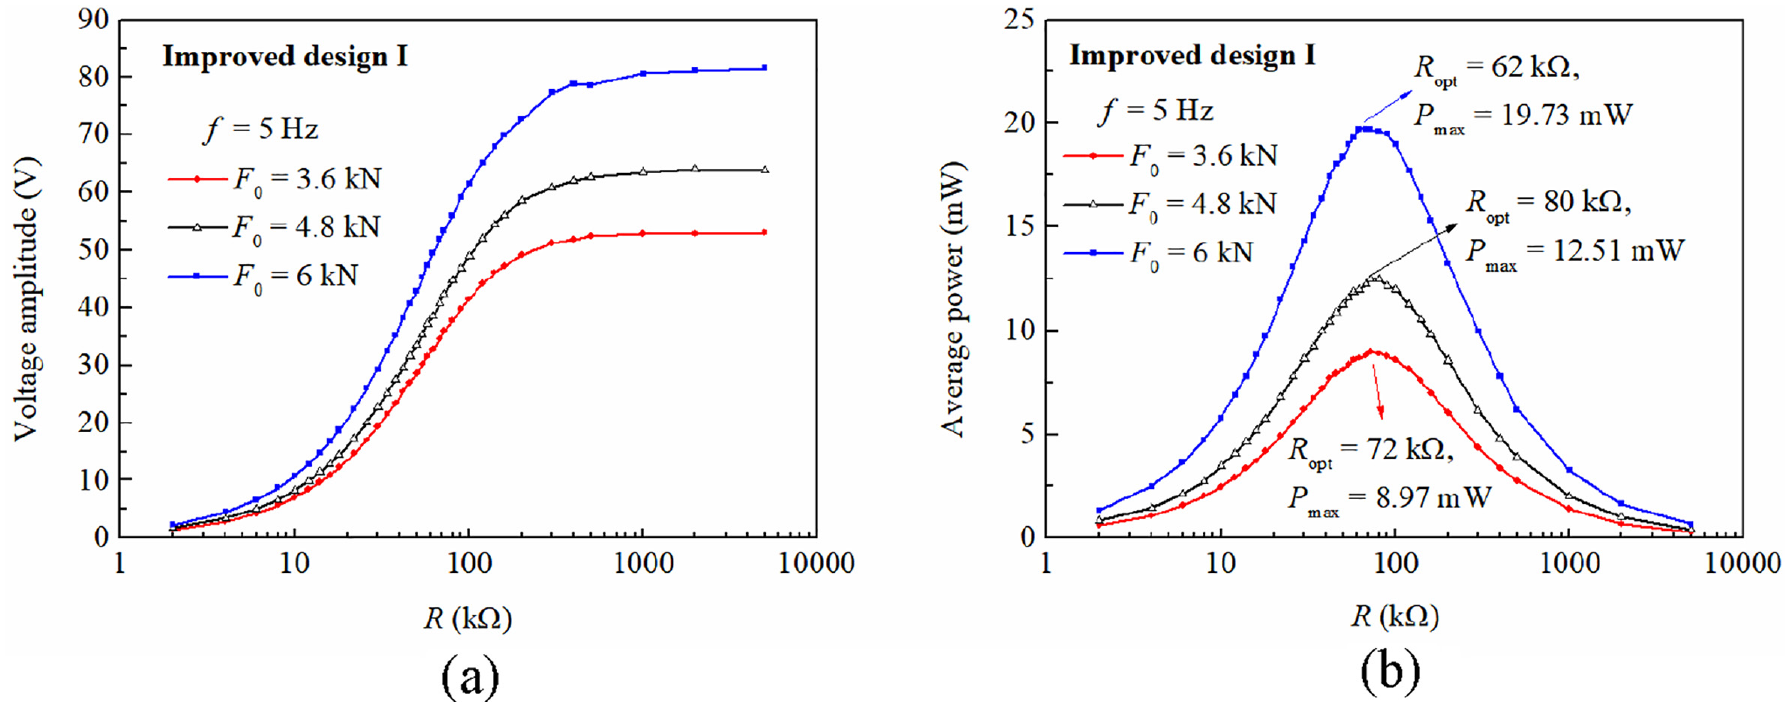
Electrical outputs of the improved design I versus load resistance for different force amplitudes with f = 5 Hz: (a) voltage amplitude, and (b) average power.
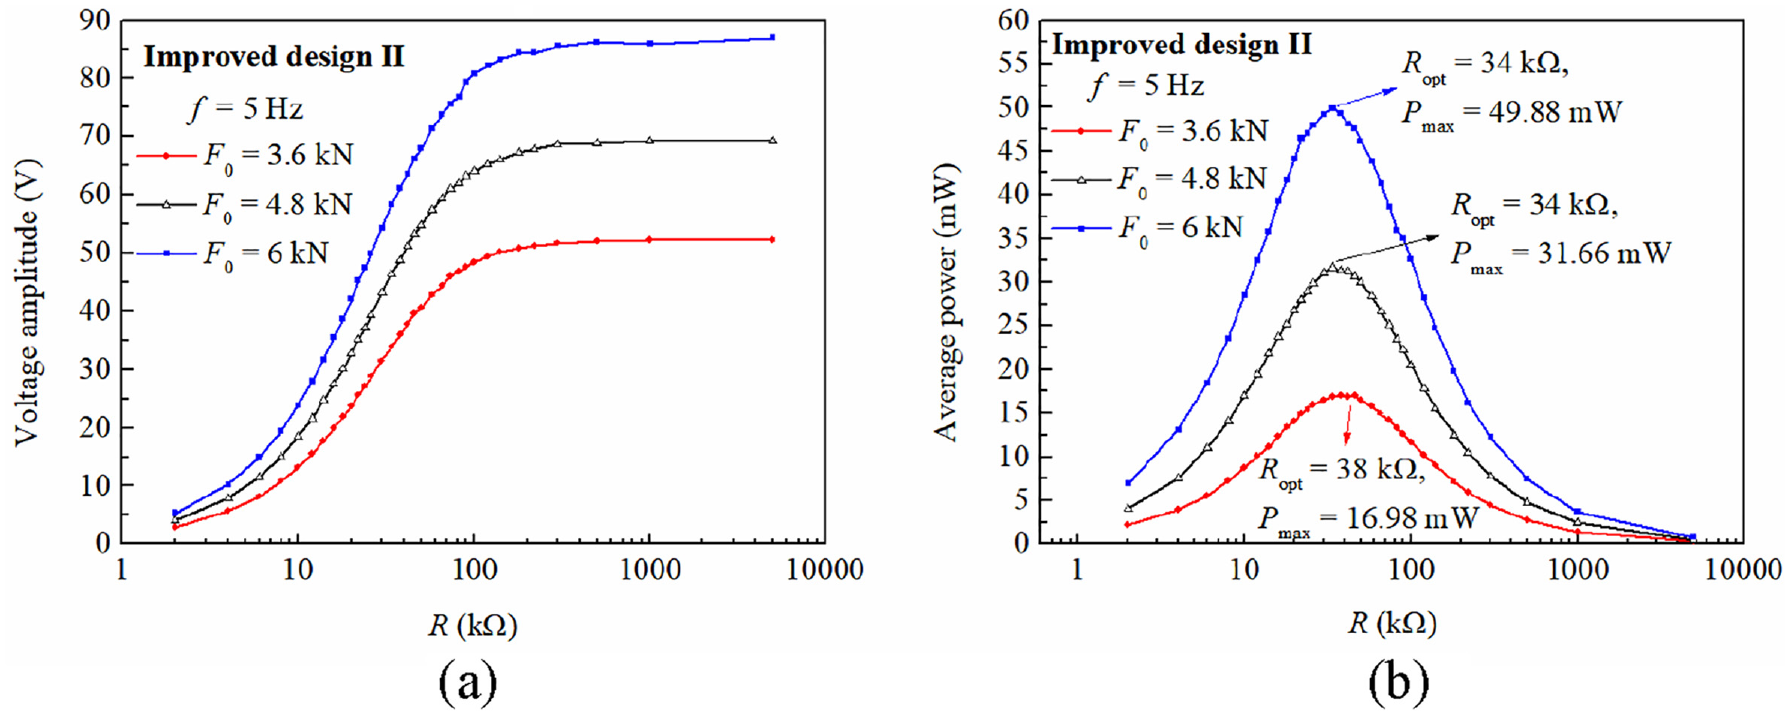
Electrical outputs of the improved design II versus load resistance for different force amplitudes with f = 5 Hz: (a) voltage amplitude, and (b) average power.
Further, the comparisons of MAP at the optimal resistance when F0 = 3.6 kN and f = 5 Hz are presented in Table 9. It can be seen that the MAPs of two improved designs are larger than those of the previous design. Compared with the previous design, the improved designs I and II can enhance the MAP by about 0.97 times and 2.72 times, respectively.
Comparisons of MAP at the optimal resistance when F0 = 3.6 kN and f = 5 Hz.
Enhancement times = (The improve design-The previous design)/The previous design.
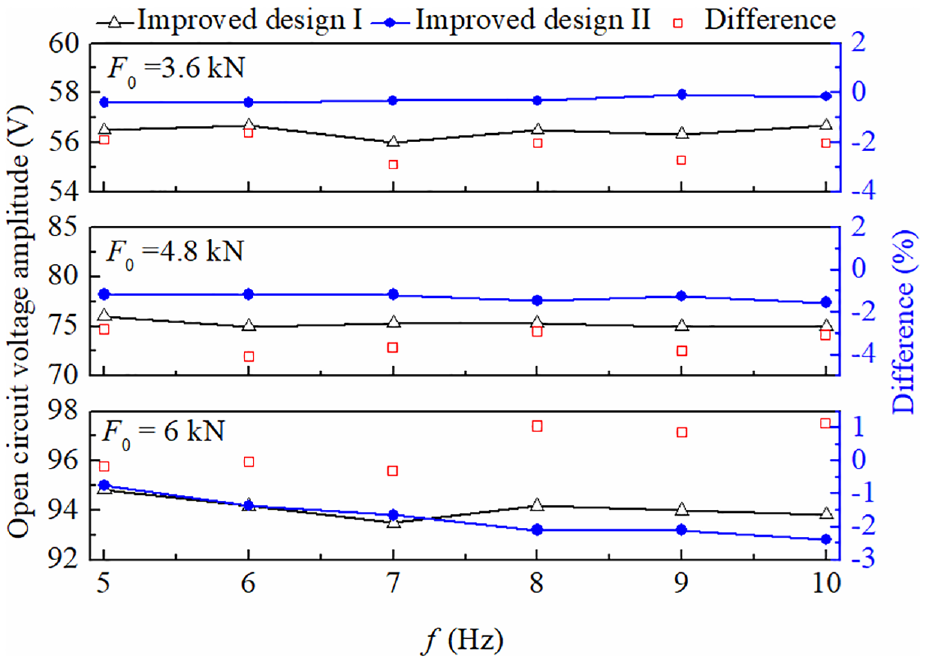
From Figures 16 and 17, it can also be seen that the output voltage amplitudes of two improved designs are very close, which corresponds with the theoretical results of the previous work (Wang et al., 2022a). To clearly present the relationship between the voltages of two improved designs, the curves of the OCVAs versus force amplitude and frequency are plotted in Figures 18 and 19, respectively. It can be observed that the OCVA increases with the increase of the force amplitude, and changes little for a lower frequency range from 5 to 10 Hz. In addition, the OCVAs of two improved designs are very close. The maximum differences (Difference = (The improve design I-The previous design II)/The improve design II) are 6.41% in Figure 18 and −4.09% in Figure 19, respectively. These rules correspond with the previous theoretical results (Wang et al., 2022a).
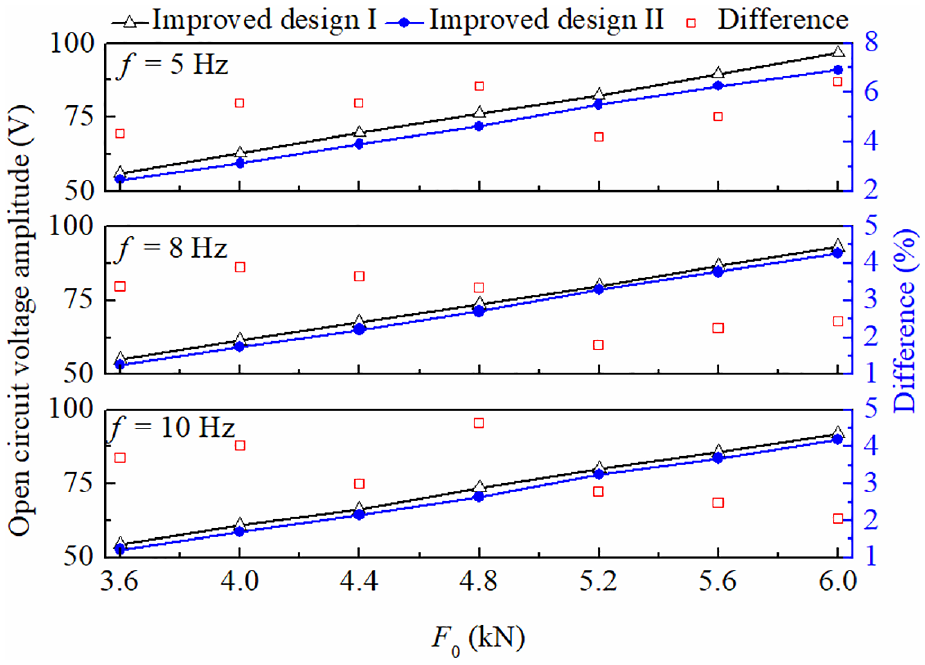
OCVA versus force amplitude for different force frequencies.
OCVA versus force frequency for different force amplitudes.
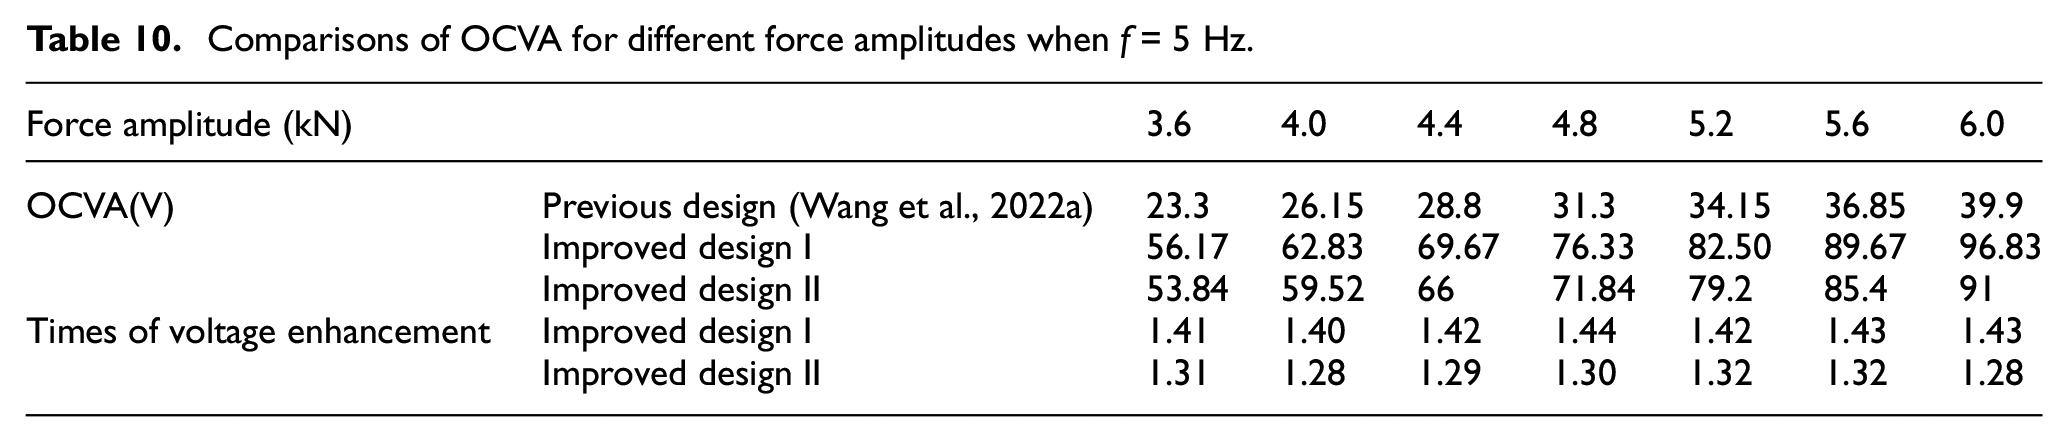
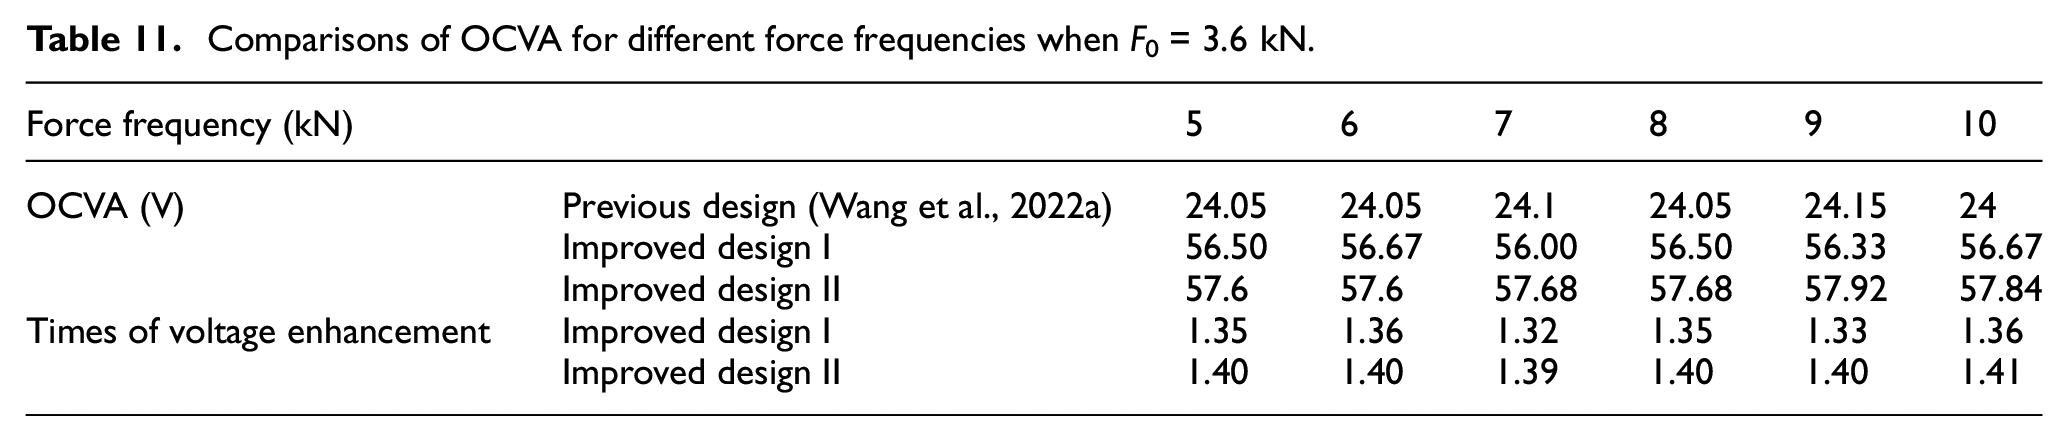
Further, the comparisons of OCVA for different force amplitudes when f = 5 Hz and for different force frequencies when F0 = 3.6 kN are addressed in Tables 10 and 11, respectively. It can be found that the OCVAs of two improved designs show greater improvement than that of the previous design. In Tables 10 and 11, the maximum enhancement times (Enhancement times = (The improved design-The previous design)/The previous design) are 1.44 times for the improved design I and 1.41 times for the improved design II, respectively. When F0 = 3.6 kN and f = 5 Hz, the improved design I and II can enhance the OCVA by 1.41 times and 1.31 times compared to those of the previous design in Table 10, respectively. While in Table 11, the improved design I and II can enhance the OCVA by 1.35 times and 1.4 times, respectively. There are some differences in the experimental results, which may be induced by measurement errors, but they are very small and reasonable. In a word, the above comparative results show that compared with the previous design, two improved designs can obtain improvement in the OCVA and the MAP under harmonic force.
Comparisons of OCVA for different force amplitudes when f = 5 Hz.
Comparisons of OCVA for different force frequencies when F0 = 3.6 kN.
7. Comparison of EHP under emulated steel-spring fulcrum force
In this section, the EHP of the improved designs under emulated steel-spring fulcrum force is measured and then compared to that of the previous design. Firstly, the voltage-time and power-time curves of the improved design I and II at different resistance for ten cyclic signals are plotted in Figures 20 and 21, respectively. Here, the symbols V(t) and P(t) define respectively the voltage and power outputs, and P(t) = V2(t)/R. It can be seen that for both of two improved designs, when the resistance is increased, the voltage output shows an increasing trend, and the power output firstly increases and then decreases. These results are consistent with the rule of the previous design (Wang et al., 2022a).
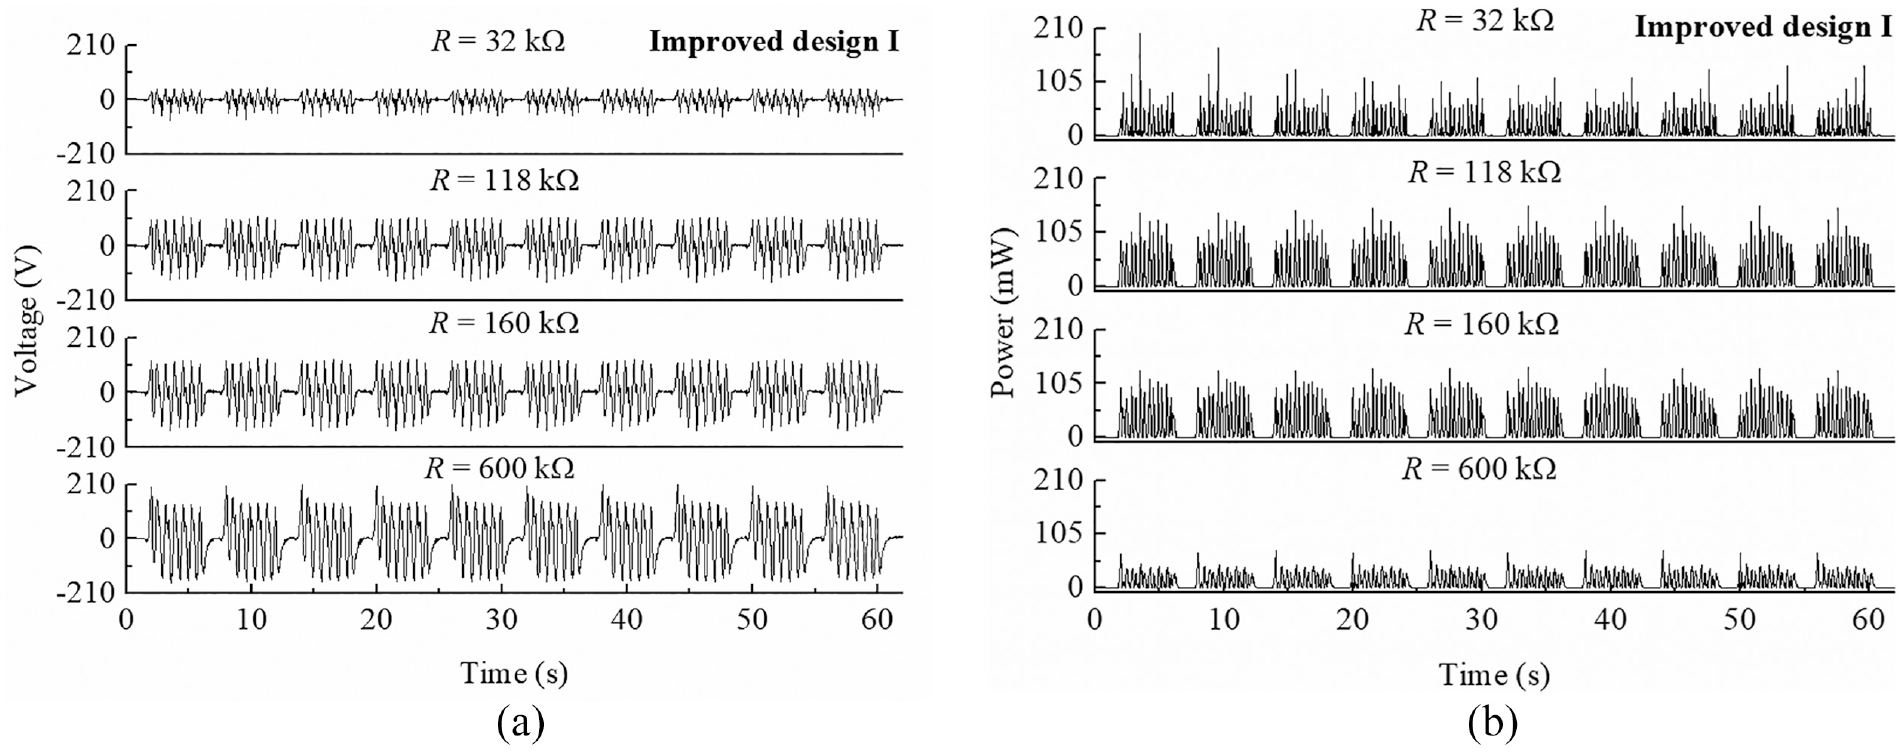
Voltage-time curve (a) and power-time curve (b) of the improved design I at different resistance for ten cyclic emulated steel-spring fulcrum forces.
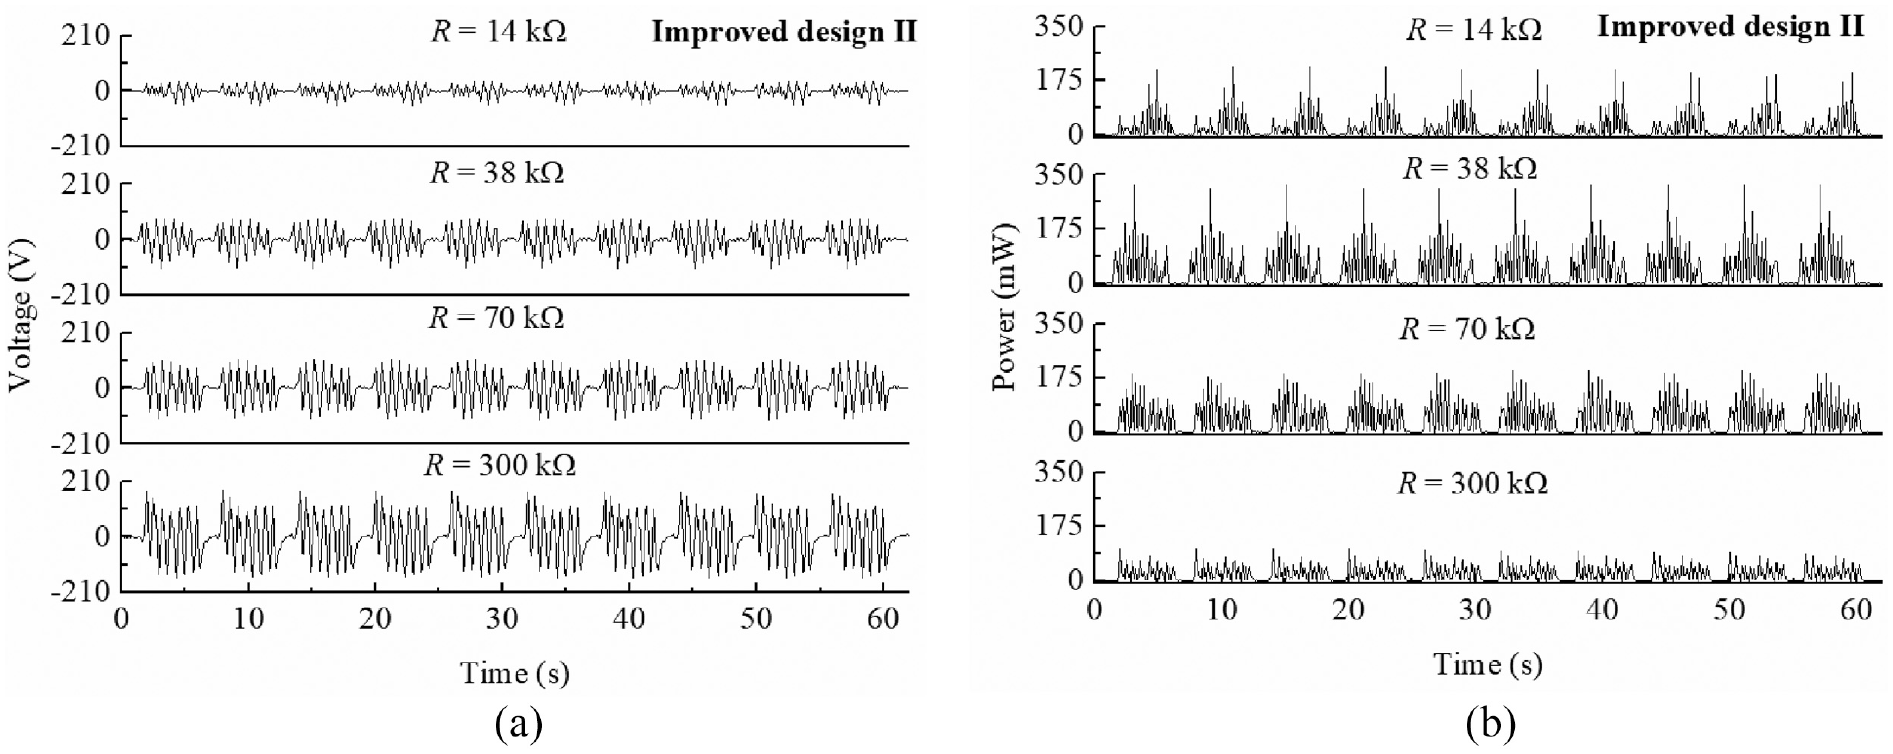
Voltage-time curve (a) and power-time curve (b) of the improved design II at different resistance for ten cyclic emulated steel-spring fulcrum forces.
Further, the total energy at different resistances of two improved designs for ten cyclic force signals are compared in Figure 22. The formula
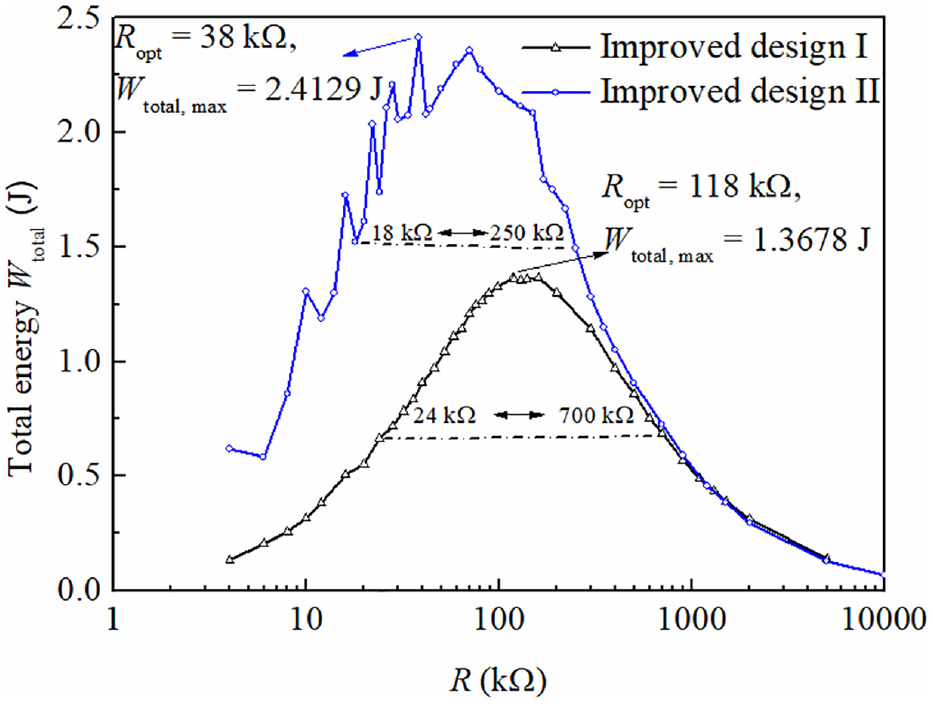
Total energy at different resistances of two improved designs for ten cyclic force signals.
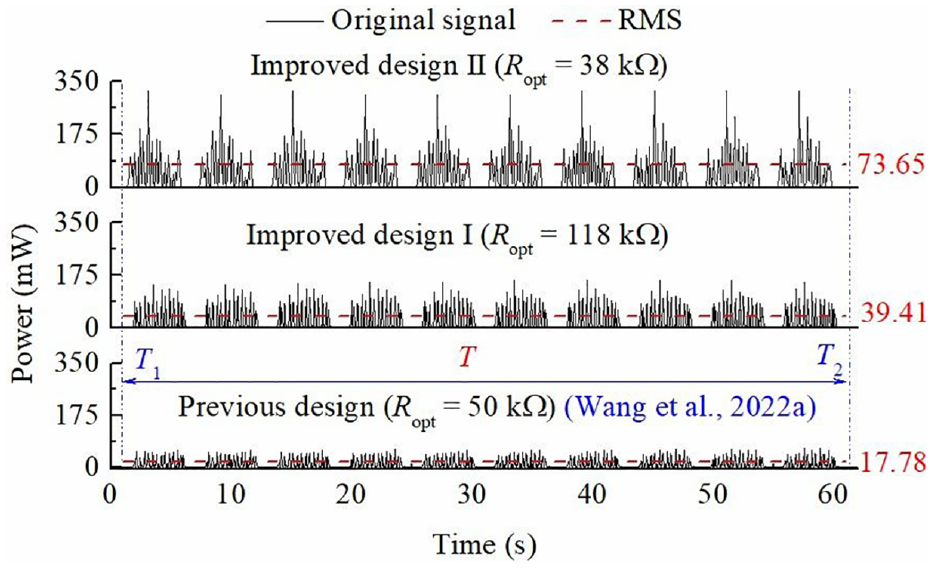
The root mean square (RMS) of the output power at the optimal resistance.
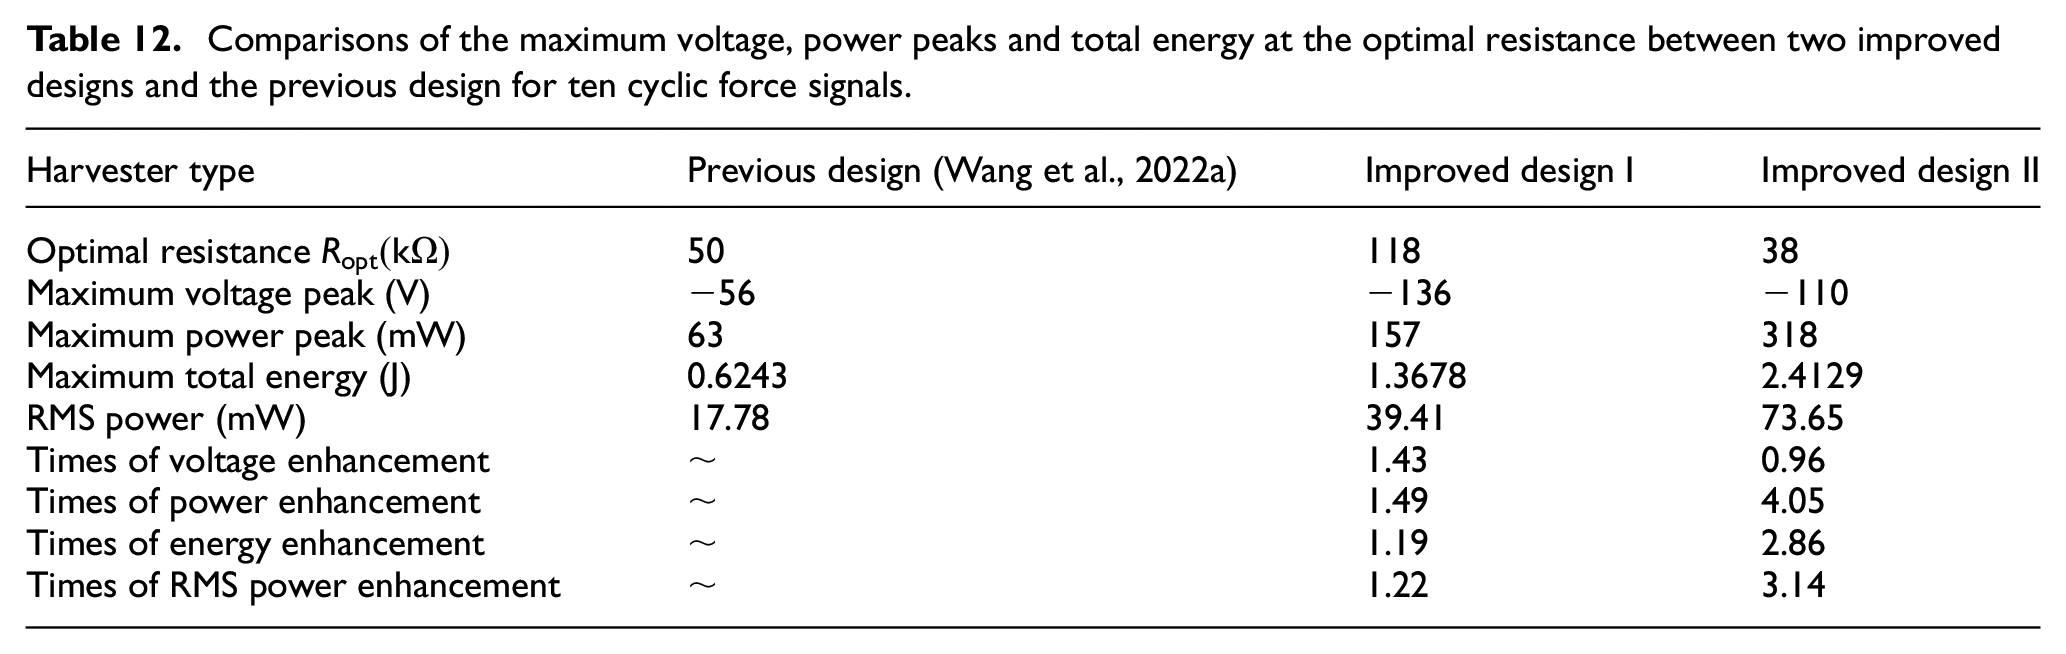
In addition, comparisons of the maximum voltage, power peaks, RMS power and total energy at the optimal resistance between two improved designs and the previous design for ten cyclic force signals are presented in Table 12. It can be found that compared to the previous design, the output voltage peak, power peak, RMS power and total energy of two improved designs at the optimal resistance have been greatly improved. For the previous design, the maximum voltage and power peaks, as well as the RMS power are about −56 V, 63 and 17.78 mW, respectively. For the improved design I, the maximum voltage and power peaks, as well as the RMS power are about −136 V, 157 and 39.41 mW, respectively. For the improved design II, the maximum voltage and power peaks, as well as the RMS power are about −110 V, 318 and 73.65 mW, respectively. Compared to the previous design, the maximum voltage peaks are enhanced by 1.43 times for the improved design I and 0.96 times for the improved design II, respectively. The maximum power peaks are enhanced by 1.49 times for the improved design I and 4.05 times for the improved design II, respectively. The RMS powers are enhanced by 1.22 times for the improved design I and 3.14 times for the improved design II, respectively. As mentioned above, the MTE numbers are 0.6243 J for the previous design, 1.3678 J for the improved design I and 2.4129 J for the improved design II, respectively. Compared to the previous design, the MTE is enhanced by 1.19 times for the improved design I and 2.86 times for the improved design II, respectively. In a word, the improved designs can output the larger voltage, power peaks, RMS power and total energy at the optimal resistance.
Comparisons of the maximum voltage, power peaks and total energy at the optimal resistance between two improved designs and the previous design for ten cyclic force signals.
Further, Table 13 compares the performance of recently reported high power output PEHs in the field of rail transport. It can be found that the improved designs have the considerable power peak. Especially, the power peak of the improved design II can reach up to about 318 mW, which covers the main power consumption range of the trackside wireless sensors from 10 to 200 mW (Gao et al., 2018; Qi et al., 2022). In the Table 13, the cymbal transducer (CT) based on piezoelectric stack array (PSA) (Hou et al., 2021) has the maximum power peak. A main reason is that the force amplification mechanism of CT has been introduced into the harvester design. However, the bearing capacity of most existing CTs is relatively small, below 100 N (Kim et al., 2006; Kim et al., 2005; Yuan et al., 2009, 2010). The cymbal frame, which possesses high bearing capacity and an excellent force amplifying mechanism, still needs to be further evaluated experimentally for better application in the steel-spring fulcrum forces with the larger force peaks (ranging from 20to 35 kN) (Hou et al., 2021; Wang et al., 2022a; Wei et al., 2019; Yang et al., 2020; Zhai et al., 2013). In the recent report (Min et al., 2023), a new type of arch beam piezoelectric stack energy harvester (PSEH) is proposed, which can output experimentally the power of 193 mW at a load of 21 kN with frequency of 3 Hz, providing a new strategy for designing the force amplify frame with the high bearing capacity. Compared with the CT based on PSA (Hou et al., 2021), the PSBR based on piezoelectric tube stack array (PTSA) exhibits a higher bearing capacity. The current experimental results demonstrate that the fabricated prototype for the improved designs can operate stably under the force level of about 40 kN, which is highly promising for practical applications.
Power peak of recently reported high power output PEHs in the field of rail transport.
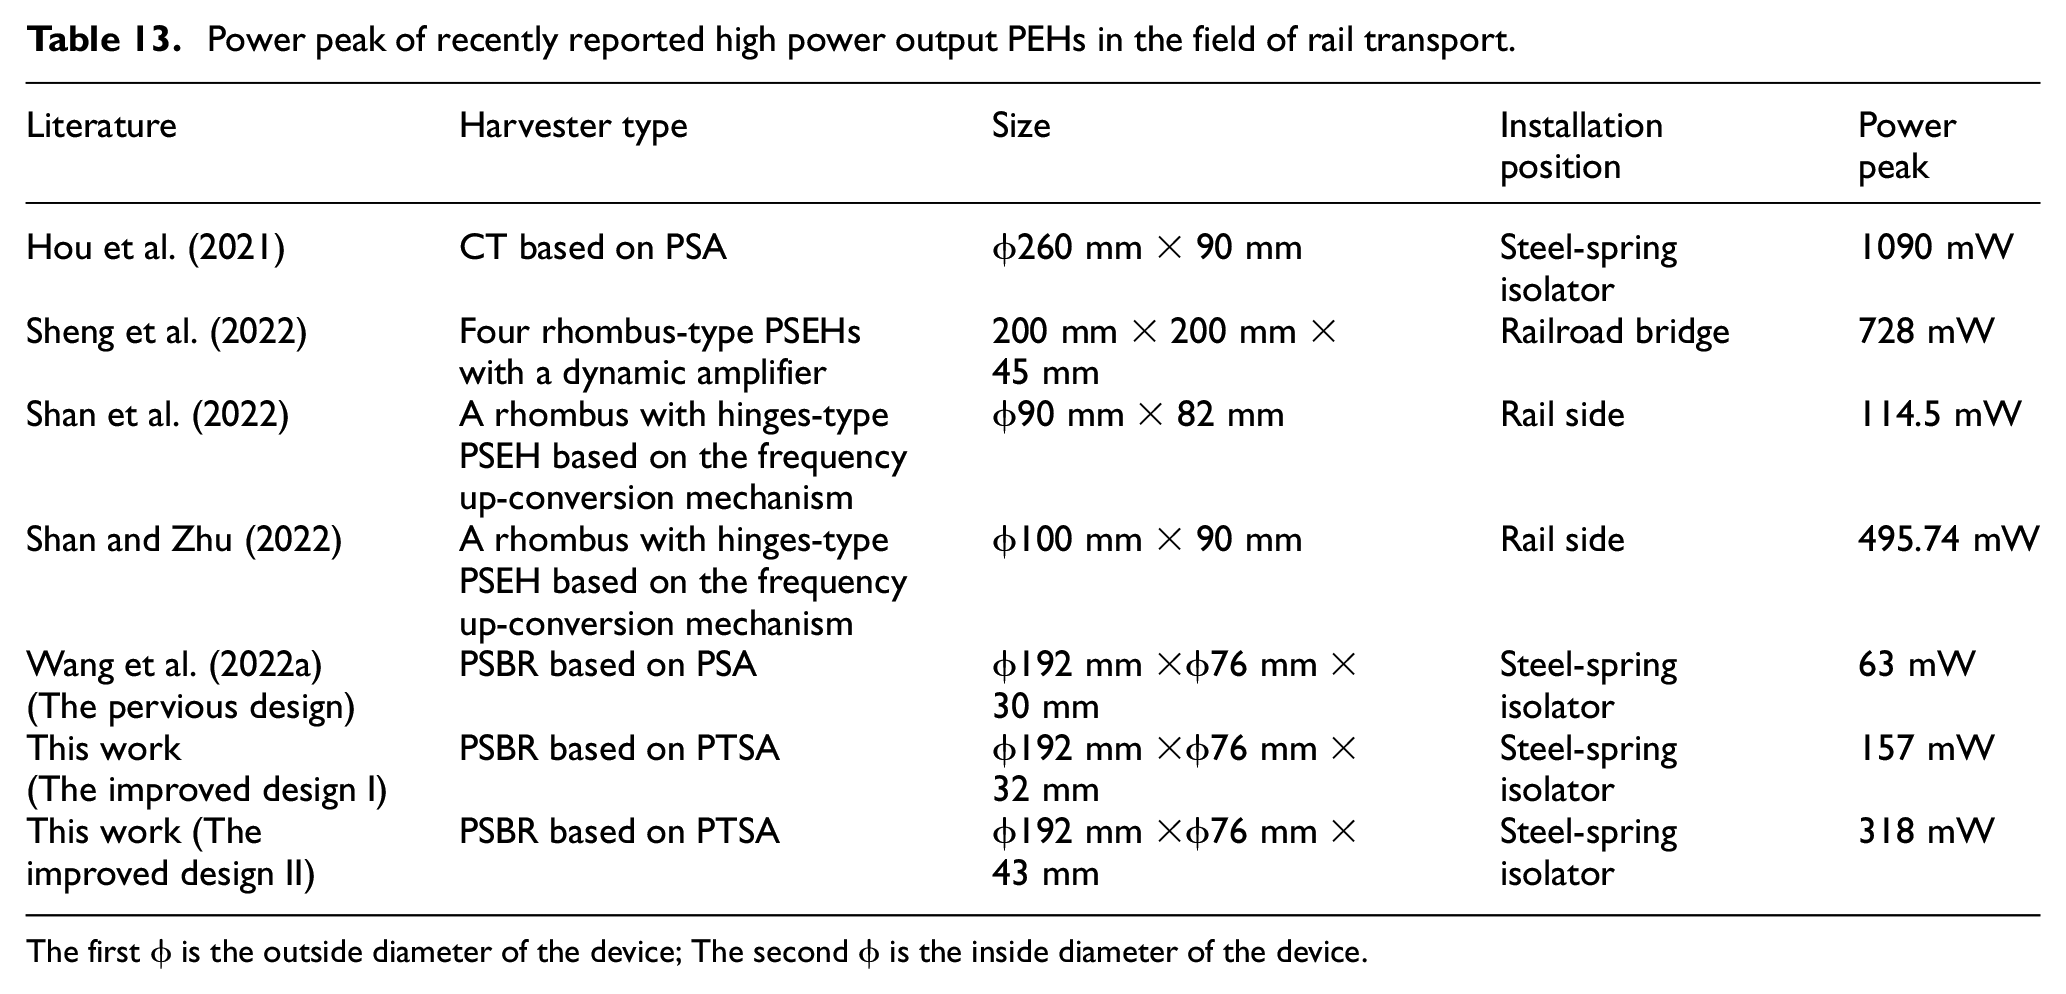
The first ϕ is the outside diameter of the device; The second ϕ is the inside diameter of the device.
8. Comparison of application
In this section, a comprehensive evaluation of the power supply capacity of the improved designs is conducted, with a focus on ensuring compatibility and efficiency with the ViPSN 2.0 Internet of Things (IoT) sensor node (Hu et al., 2022; Li et al., 2021; Wang et al., 2022a; Zhang et al., 2023). The experiment setup is similar to that of the previous design (Wang et al., 2022a), as shown in Figure 24, but the harvester is different. Similarly, ten cyclic steel-spring fulcrum force signals are adopted, and the total signal duration is 60 s. To ensure the repeatability and reliability of the test results, three repeated experiments are conducted. From Figure 24, it found that the harvested energy of the improved design I and the improved design II can activate the wireless node to send out about 42 and 62 wireless packets, respectively. Compared to the 60 wireless packets of the previous design (Wang et al., 2022a), the improved performance has not been observed. The main reason is that the whole system works cooperatively. The harvester will affect the performance of the electrical circuit, and vice versa. Only when they match each other, the whole system can achieve the excellent performance. For the circuit board of ViPSN 2.0, the electrical parameters are already determined, so it is difficult to directly match the determined parameters of the harvesters. Therefore, the current work efficiency of the system is not high. In the future, the collaborative optimization between the circuit and the harvester will be performed to improve efficiency.
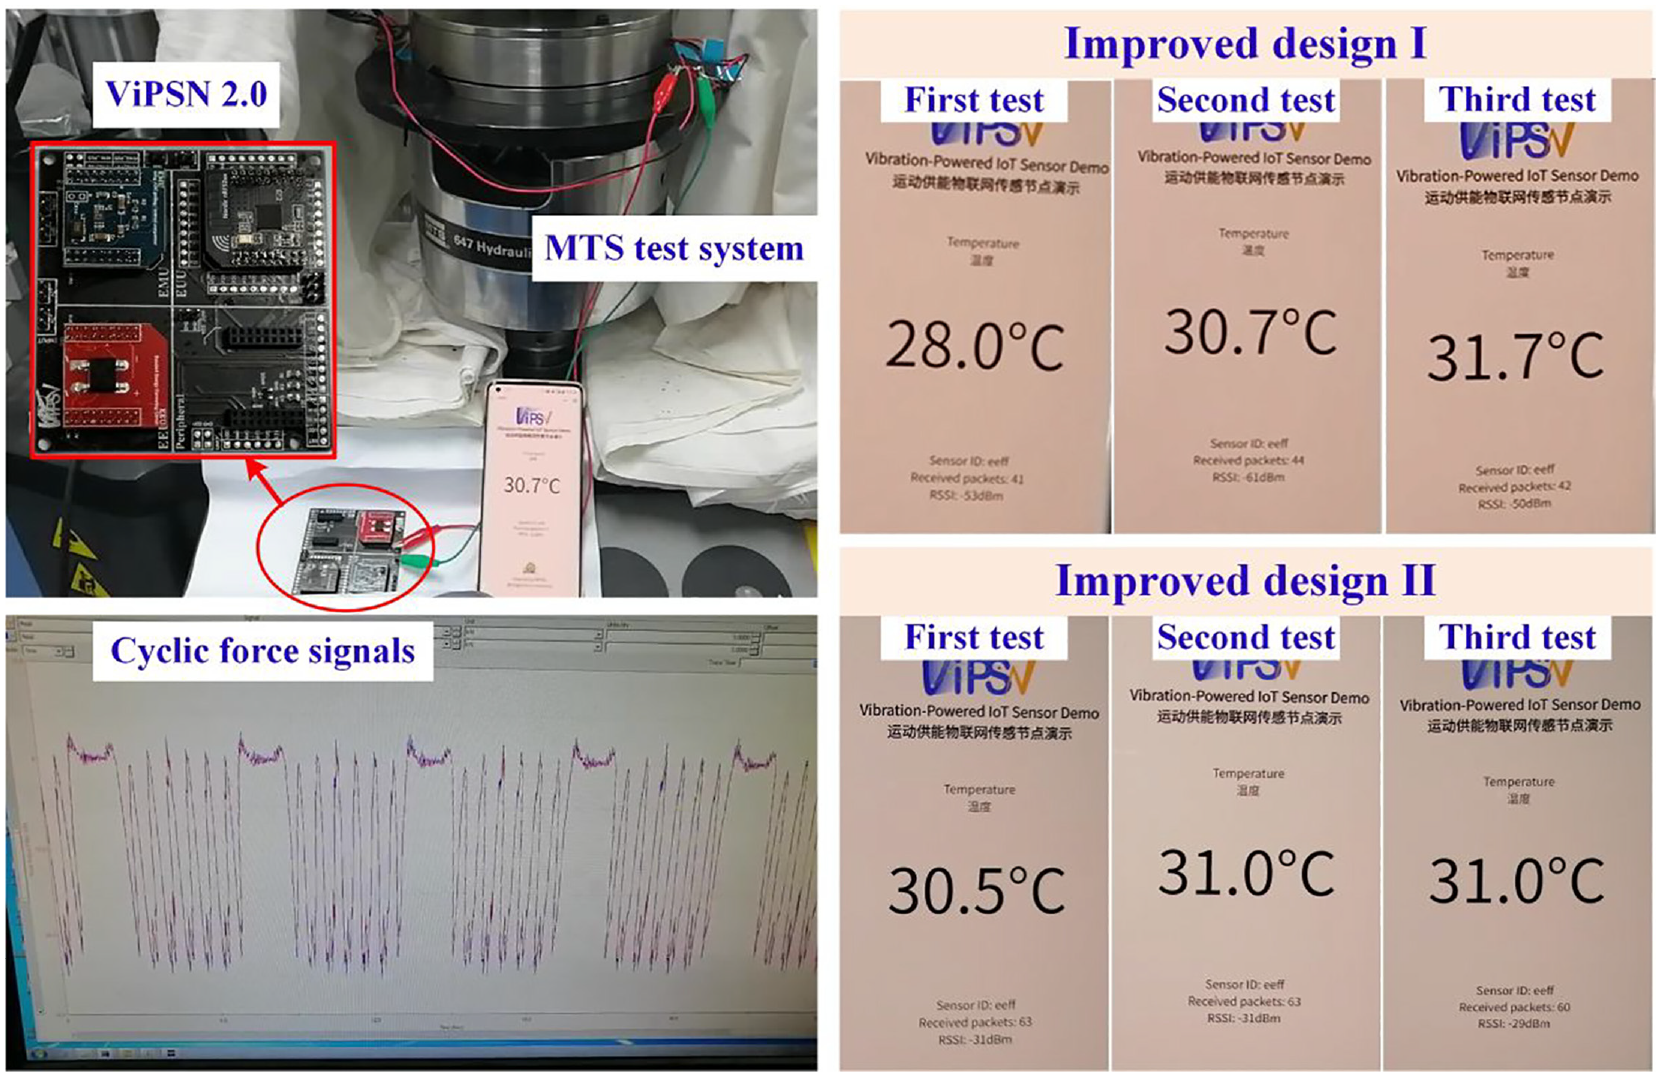
Power supply capacity of the improved designs for the ViPSN 2.0 IoT sensor node.
In practical situations, the proposed system, which is based on the improved designs and the previous design, has the same device encapsulating and assembly processes, as well as identical installation locations for the circuit board of ViPSN 2.0. However, the estimated costs of the proposed systems based on the improved designs, and the sizes of the corresponding harvesters vary. For the improved design I, six piezoelectric tube stacks (PTSs) of 10 layers cost approximately 288 USD (48 USD for each stack), a whole metal shell costs around 200 USD, a ViPSN 2.0 IoT sensor node costs about 285 USD, bringing the total system cost to roughly 773 USD. For the improved design II, six PTSs of 20 layers cost about 552 USD (92 USD for each stack), and a whole metal shell costs about 257 USD, resulting in a total system cost of approximately 1,094 USD. When compared to the estimated cost of 1,025 USD for the previous design, the improved design I offers a lower price, whereas the improved design II is more expensive.
In terms of the harvester size, the improved designs and the previous design have the same the inner diameter and outer diameter, but differ in height. Despite the limited vertical space in the steel-spring isolator, these heights fall within a reasonable assembly range. Since the distance range for track structure leveling is about from 30 mm to 40 mm, the PSBR can effectively utilize this range.
In general, the experiment results validate the excellent energy harvesting ability of two improved prototypes. However, the current designs are two improved designs, which only realize two distinct optimal scenarios. As long as the improving design rule, the smaller installation effect, the suitable device dimensions and the assembly stability of the harvester structure are satisfied, there lies ample opportunity to explore alternative structural configurations, including varying the layer number and layer thickness of the piezoelectric stack, experimenting with different inner and outer radii as well as the total number of the piezoelectric stack. Further effect will conduct a series of experiments to validate the feasibility of the alternative structural configuration, which is beneficial for promoting the development of high-performance PSBRs that are not only theoretically sound but also practically feasible.
9. Conclusions
In this paper, a dynamic model of vehicle-floating slab track-energy harvester coupled system is developed to investigate the effects of the installation of the PSBR on the dynamic performance of the vehicle-floating slab track system (such as rail displacement, slab displacement, rail acceleration, slab acceleration, fastener force and steel-spring fulcrum force). Additionally, two improved designs of the PSBR are proposed, and their energy harvesting performance is studied experimentally under both harmonic and steel-spring fulcrum forces. Comparisons with the EHP of the previous design are also presented. The main results can be summarized as follows.
(1) For both single energy harvester and multiple energy harvesters, when the equivalent stiffness of the energy harvester increases from 1 × 10⁷ N/m to 2 × 10⁹ N/m, the maximum rail displacement and slab displacement decrease gradually, while the steel-spring fulcrum force increases gradually. The rail acceleration slightly increases, but remains largely unchanged. The slab acceleration exhibits an increase in the middle of the slab and a decrease at the head of the slab. The fastener force at the head of the slab increases when only single energy harvester is installed, and decreases when mulitple energy harvesters are installed. However, the fastener force in the middle of the slab remains almost the same for both installation methods. In compared to the installation of single energy harvester, the installation of multiple energy harvesters has a more obvious effect on rail displacement and slab displacement, and a smaller effect on steel-spring fulcrum force.
(2) For both single energy harvester and multiple energy harvesters, when the equivalent stiffness of energy harvester exceeds 1 × 10⁹ N/m, the effect of different installation methods on the dynamic performance of the vehicle-floating slab track system can be neglected. In this case, the steel-spring fulcrum force obtained from the vehicle-floating slab track system can be directly used to design, analyze and test the energy harvester. When the equivalent stiffness of energy harvester is less than 1 × 10⁹ N/m, it is better to consider the interaction effect between the energy harvester and the vehicle-floating slab track system.
(3) For the harmonic force, the improved designs can generate the higher open circuit voltage amplitude (OCVA) and the greater maximum average power (MAP) at the optimal resistance. In particular, under a force amplitude of 3.6 kN and a frequency of 5 Hz, the improved design II can enhance the MAP and the OCVA by 1.4 times and 2.72 times, respectively, compared to those of the previous design.
(4) For ten cyclic emulated steel-spring fulcrum forces, the improved designs can output the larger voltage peak, power peak, RMS power and maximum total energy (MTE) at the optimal resistance. In particular, the improved design II exhibits the largest power peak and MTE, which are 318 mW and 2.4129 J, respectively. Compared to the previous design, these values are enhanced by approximately 4.05 times and 2.86 times, respectively.
(5) For ten cyclic emulated steel-spring fulcrum forces, the harvested energy of the improved design I and the improved design II is only sufficient to activate the ViPSN wireless sensor node approximately 42 times and 62 times, respectively. Compared with the 62 times of the previous design, the work efficiency of the current system is not high. In the future, the collaborative optimization between the circuit and the harvester needs to be performed to improve the efficiency.
Footnotes
Declaration of conflicting interests
The authors declared no potential conflicts of interest with respect to the research, authorship, and/or publication of this article.
Funding
The authors disclosed receipt of the following financial support for the research, authorship, and/or publication of this article: This work is supported by the National Natural Science Foundation of China (51708025, 52078028), and supported by a scholarship from the China Scholarship Council (No. 202206465025).
Data availability statement
All data that support the findings of this study are included within the article.