
Abstract
In terms of vibration and noise reduction for helicopter, Active Control Flap (ACF) rotor technology, leveraging smart materials, stands out as a promising and advantageous approach. This paper focuses on the design, modeling, and simulation of a novel structure integrated with trailing-edge flap and composite rotor blade driven by Macro Fiber Composite (MFC) actuators. A 3D model is employed to simulate the deformation response of the flap under different driving voltage levels. The results were validated by experimental data. Additionally, Fluid-Structure Interaction (FSI) analysis is applied to explore the deflections of the trailing-edge flap under various flight conditions and its corresponding aerodynamic characteristics. The findings reveal that the designed trailing-edge flap significantly influences the aerodynamic lift and pitch moment of the airfoil at operational speed and angle of attack of the helicopter blade. Finally, a Back Propagation (BP) Neural Network is introduced to establish a fast predictive model for the intricate nonlinear response characteristics of the ACF rotor. The network is trained and tested with appropriately chosen sample data, demonstrating high prediction accuracy and reliability. This model serves as a theoretical reference for subsequent application of ACF technology in vibration and noise reduction, providing valuable insights for further research and development.
Keywords
1. Introduction
Helicopters have been indispensable in aviation transportation across diverse sectors since their inception. However, the intricate and dynamic aerodynamic conditions of helicopter rotors have led to significant challenges in vibration and noise, adversely impacting structural components’ fatigue life, maintenance and operational costs, as well as the comfort of passengers and pilots. With a growing focus on addressing the vibration and noise associated with helicopters, in-depth research into rotor vibration and noise reduction technologies has become a pivotal area of study in helicopter technology.
Long-term research indicates that traditional passive vibration and noise control technologies (Edwards et al., 2002; Yung, 2000) have become increasingly insufficient to meet the modern requirements for vibration and noise levels. Consequently, a series of rotor active control technologies, including Higher Harmonic Control (HHC) (Hammond, 2021; Kessler, 2011b), Individual Blade Control (IBC) (Kessler, 2011a), Active Twist Rotor (ATR) (Monner et al., 2008, 2011), and Active Controlled Flap (ACF) (Sim et al., 2014), have been successively proposed and extensively studied. Among these, ACF technology involves the active deflection of small flaps installed at the outer edge of the rotor blade using actuating mechanisms. This dynamic adjustment alters the local flow characteristics of the blade to redistribute aerodynamic loads along the spanwise direction, aiming to suppress vibration and noise.
The rapid advancement of smart materials and structures across disciplines has introduced new dimensions to ACF technology. Intelligent actuating mechanisms based on piezoelectric materials (Krommer et al., 2012; Mukherjee and Ganguli, 2012), known for their compact structure, rapid response, lightweight nature, and wide control bandwidth, have found widespread application in theoretical and experimental research on vibration and noise reduction in helicopter rotors using trailing-edge flap technology (Ozgumus and Kaya, 2012; Roget and Chopra, 2008; Viswamurthy and Ganguli, 2005).
Currently, scholars have conducted extensive and in-depth research on ACF technology, yielding significant and promising results. In 2005, Onera collaborated with DLR (Crozier et al., 2006) to conduct wind tunnel tests on a Mach-scaled four-bladed rotor with trailing-edge flaps positioned at different radial locations in the transonic ONERA S1 Modane wind tunnel. The outcomes affirmed that ACF not only effectively reduces Blade-Vortex Interaction (BVI) noise and vibration but also enhances rotor performance. Additionally, the first flight test of rotors equipped with active trailing-edge flaps, driven by a pair of piezo-electric actuators, was conducted by DEL and Eurocopter (Dieterich et al., 2006; Roth et al., 2007) in 2005 using the BK117 as the test aircraft. This test demonstrated that the trailing-edge flaps could achieve vibration reduction at the gearbox and the left side of the cabin across the entire speed range under 4/rev control. Moreover, BVI noise was successfully suppressed under 2/rev control.
Traditional designs utilizing trailing-edge flaps often employ separate actuating mechanisms based on piezoelectric patches or stacks (Centolanza and Smith, 2000; Kang et al., 2015; Koratkar and Chopra, 2001; Natarajan et al., 2012; Straub et al., 2018; Visconti et al., 2016). However, these mechanisms add structural weight and complexity to manufacturing, assembly, and dynamic design (Shen et al., 2016). The evolution in composite materials technology (Wang et al., 2023) offers new solutions to these challenges. Macro Fiber Composite (MFC), as a piezoelectric actuator with excellent overall performance, brings advantages such as thinness, lightweight, flexibility, and high power output. These characteristics effectively address the limitations of traditional actuating methods, presenting promising prospects for extensive application in ACF technology for helicopter rotors. Boris A. Grohmann and his team proposed the concept of Active Trailing Edge (ATE) (Grohmann et al., 2006, 2008, 2011; Maucher et al., 2007), which includes two variations: one involves an Active Tab attached to the trailing edge of the helicopter rotor airfoil employing a bending actuator built from MFC patches, and the other integrates actuators within the airfoil. The advantage of ATE concept is the smooth deflection of airfoil contour in chordwise direction which can prevent the generation of parasitic drag and discrete wake vortices when ATE is deflected. In 2012, Jinwei Shen and his team at the Hampton National Institute of Aerospace in Virginia, USA, designed Continuous Trailing-Edge Flap (CTEF) (Ding and Shen, 2017; Shen et al., 2016; Thornburgh et al., 2014) actuated by MFC based on the VR-18 airfoil for flight control of helicopter main rotor. The CTEF concept utilizes an optimized tapered bimorph design with four layers of MFC actuators on each side of the trailing edge bimorph, which starts at half the chord length. Through CFD computational analysis, this structure was found to effectively transfer aerodynamic loads to rotor blades. In 2016, Thornburgh et al. (2016) and others conducted low-speed wind-tunnel tests on a rotor blade segment with an integrated CTEF, with an inflow velocity of 30 m/s. Under the excitation of static +750 V voltage, the lift coefficient increased by 0.2 and the pitching moment coefficient increased by 0.04. These results were generally consistent with the CFD simulation results. Such control effects demonstrated the potential application value of CTEF in helicopter rotor blade control.
This paper integrates MFC with rotor ACF technology, proposing a helicopter rotor blade design featuring MFC as the actuating mechanism. Utilizing the finite element method, a multi-physics coupling 3D model and a planar aerodynamic analysis model are established for experimental verification of the active deflection of the trailing-edge flap under MFC actuation and aerodynamic characteristics analysis of the airfoil with the trailing-edge flap under different working conditions, respectively. Additionally, a Back Propagation (BP) Neural Network model is developed to accurately predict the results of the planar aerodynamic analysis model of the airfoil with the trailing-edge flap.
2. Overview of MFC technology and modeling simplification
Macro Fiber Composite (MFC) represents an advancement rooted in NASA’s Active Fiber Composite (AFC)) (Hagood et al., 1993; Wilkie et al., 2000). Functioning as a cutting-edge smart material, MFC integrates sensing and actuating capabilities, exhibiting exceptional mechanical properties and reliability (refer to Figure 1).
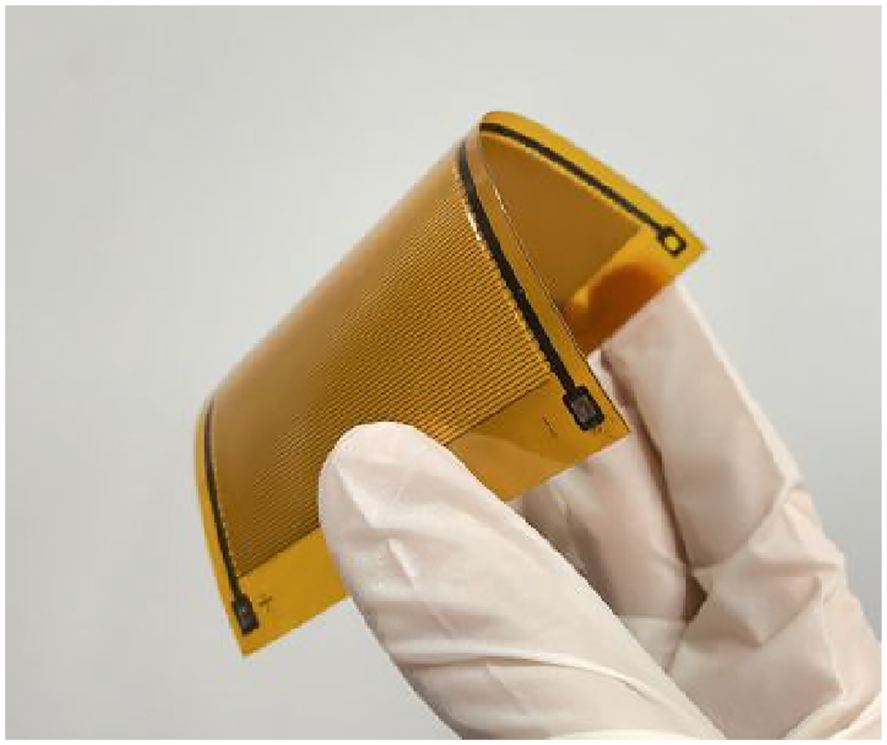
Macro fiber composite (MFC) actuator.
The structural composition of MFC is elucidated in Figure 2. Rectangular-section piezoelectric ceramic fibers are meticulously arranged in parallel within an epoxy resin matrix. This arrangement not only facilitates effective stress and strain conduction but also ensures the integrity of the piezoelectric ceramic fibers. Furthermore, Interdigitated Electrodes (IDEs) are strategically employed to encapsulate the piezoelectric composite layer, serving as both polarization and working electrodes. The rationale behind this design is to arrange the positive and negative branch electrodes alternately perpendicular to the piezoelectric fibers. This configuration introduces polarization and actuating electric fields parallel to the fiber direction. In practical applications, such a configuration optimally harnesses the d33 piezoelectric constant, generating actuating forces and strains consistent with the polarization direction within the plane.
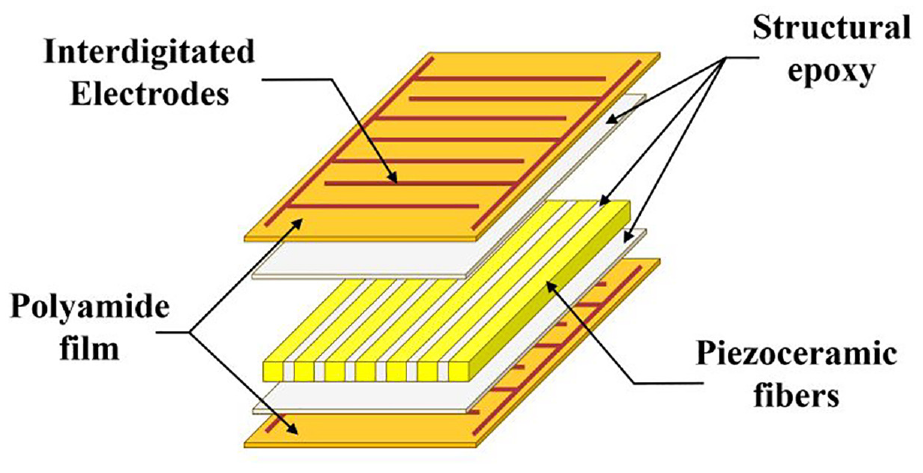
The structural composition of MFC.
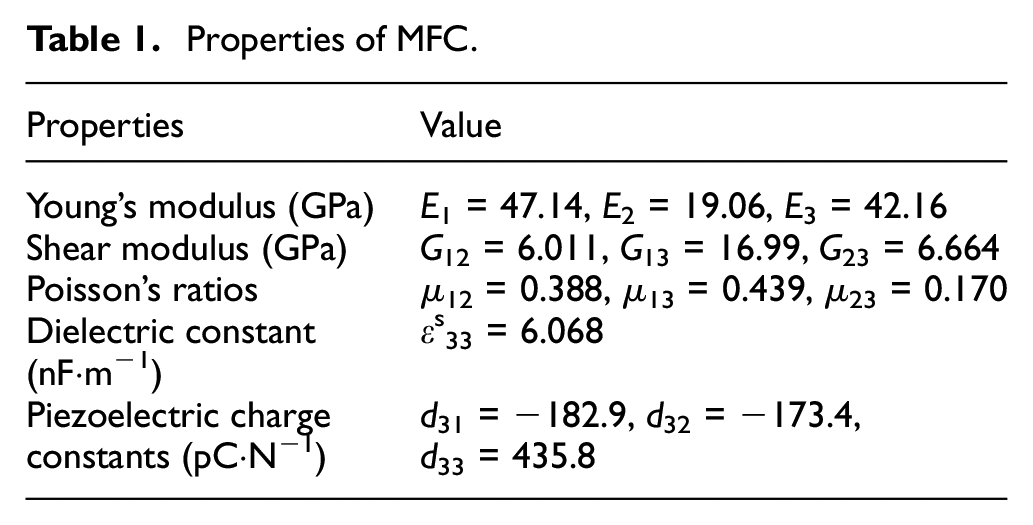
In light of the computational challenges associated with modeling the macroscopic MFC, characterized by high computational costs, a simplification approach is adopted. The MFC with non-uniform material properties is equivalently simplified as a piezoelectric block actuated by a pair of simple surface electrodes with homogeneous material characteristics. The equivalent material parameters for the homogenized model of MFC have been derived from the Ref. (Biscani et al., 2011), as detailed in Table 1 (where 3 and 1 represent directions parallel to and perpendicular to the piezoelectric fibers in the plane, respectively).
Properties of MFC.
3. Design, modeling and analysis methodology
3.1. Designing the structural cross-section of rotor blade with the trailing-edge flap under MFC actuation
The rationality of the geometric structural design of the rotor blade is paramount for the performance, stability, and safety of the helicopter rotor system. As the central component in the trailing-edge flap system, the layout of MFC must guarantee that the trailing-edge flap can generate sufficient effective deflection under influence of actuating forces and aerodynamic loads.
An integrated design was conducted based on the NACA23012 airfoil, encompassing the trailing-edge flap under MFC actuation and a composite material rotor blade. The structural cross-section and dimensions are depicted in Figure 3, with the airfoil chord length set at 121 mm. The rotor blade structure includes a C-shaped spar, foam core, balance weight, skin, and trailing edge. The C-shaped spar, constructed from Glass Fiber Reinforced Plastic (GFRP), has fibers oriented along the blade’s span to meet the design requirements for centrifugal and flapping loads. The skin primarily handles and transfers the torque of the rotor blade, consisting of two layers of 0.1 mm thick glass fabric symmetrically arranged at ±45° along the span for sufficient torsional stiffness. To adjust the chordwise center of gravity and dynamic characteristics, metallic lead balance weights are positioned at the blade’s leading edge. Foam cores are also inserted into the cavity enclosed by the C-shaped spar and skin to maintain the aerodynamic contour of the rotor blade.
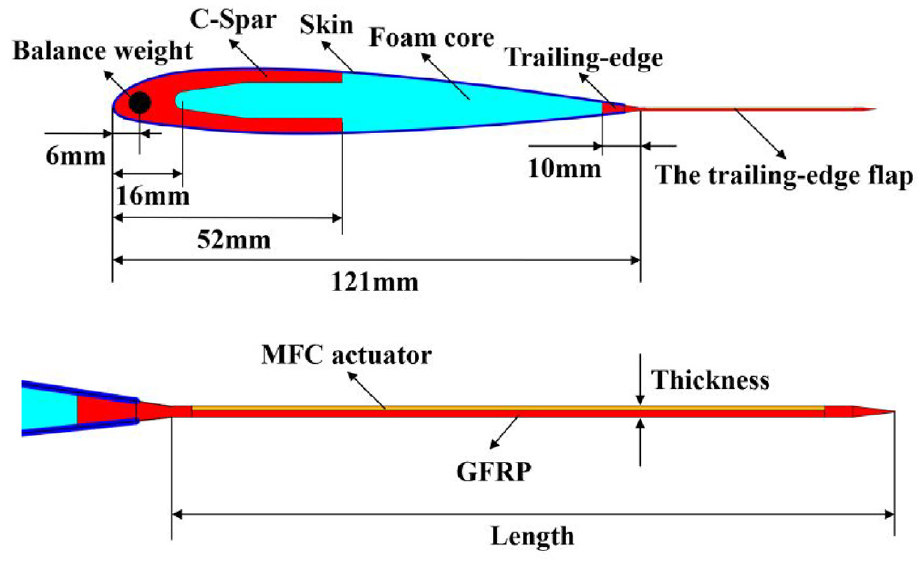
Structural cross-section of rotor blade with the trailing-edge flap.
Starting from the basic blade structure, a flexible trailing-edge flap made of glass fabric is affixed to the trailing edge. A MFC actuator is bonded to the upper surface of the flap, with the MFC fiber direction parallel to the blade’s chord for enhanced actuation performance. Additionally, ensuring a smooth transition between the trailing-edge flap and the airfoil section of the blade is imperative to minimize the impact on the overall aerodynamic shape and reduce additional drag.
The fundamental working principle of the trailing-edge flap under MFC actuation revolves around harnessing the inherent inverse piezoelectric effect within piezoelectric fiber materials. This effect generates in-plane longitudinal strain and actuating force in d33 working mode by applying excitation voltage along the chord direction of the blade, precisely between the IDEs of MFC. Subsequently, this effect is transmitted through the polymer matrix and adhesive to the main structure, thereby facilitating controlled active deformation. By applying a positive voltage to MFC, tensile stress is induced, leading to the downward deflection of the trailing-edge flap. Conversely, applying a negative voltage results in upward deflection. This mechanism allows for precise control over the orientation and magnitude of the deflection, offering a dynamic means of adjusting the aerodynamic characteristics of the rotor blade in response to changing operational conditions.
3.2. Modeling and setup for simulation and experiment of MFC-actuated trailing-edge flap
From the above structural cross-section design, a 3D finite element model of rotor blade with the trailing-edge flap is established with basic dimensions as shown in Figure 4. To ensure the optimal control of aerodynamic loads on the blade, the trailing-edge flap is installed in the region near the blade tip in the spanwise direction. Based on finite element model, a real physical prototype of rotor blade is manufactured with several different-sized trailing-edge flaps (Only one of the trailing-edge flaps is experimentally analyzed) (see Figure 5(a)). The connection mode is as follows: Multiple equally spaced holes are punched in the trailing-edge of rotor blade and the trailing-edge flap. Glass fibers are threaded through these holes and tied, and epoxy resin adhesive is used to secure them in place. A piece of MFC with dimensions of 85 × 57 × 0.35 mm was attached to the surface of the trailing-edge flap using epoxy resin adhesive for experiment involving active deflection of the trailing-edge flap under static voltage excitation. The geometric dimensions and established purpose of the 3D finite element model and the physical prototype are integrated, as shown in Table 2.
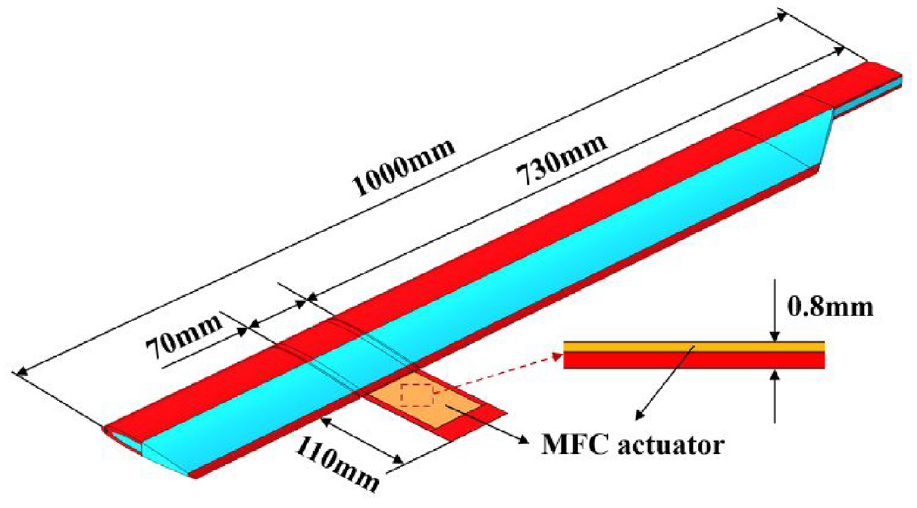
3D finite element model of rotor blade with the trailing-edge flap.
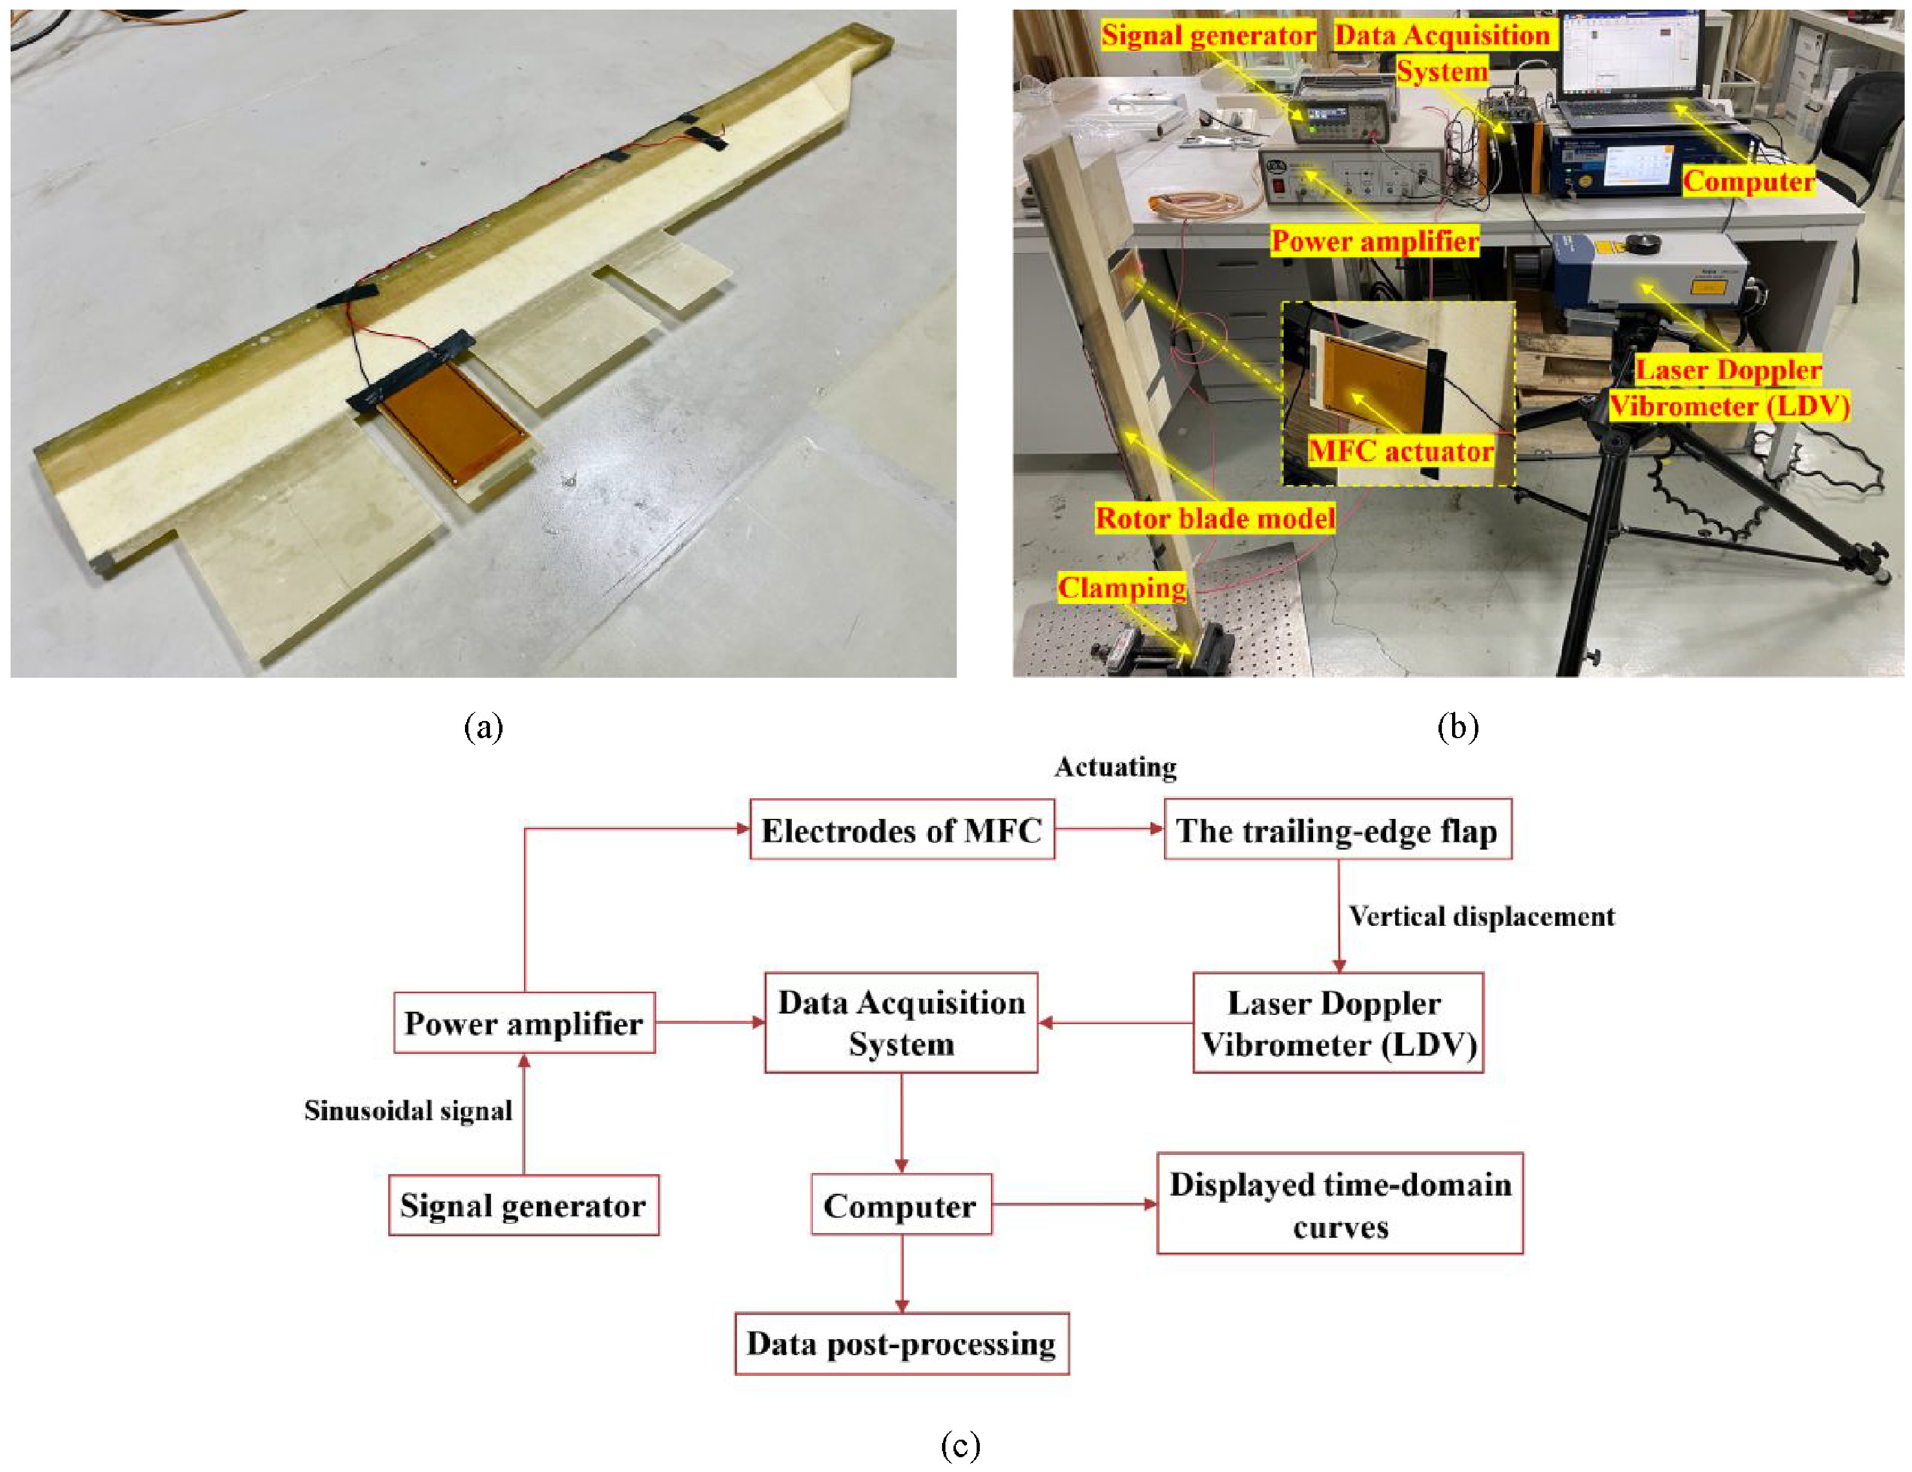
(a) The physical prototype of rotor blade used in the experiment, (b) test setup, (c) flow diagram of the experiment.
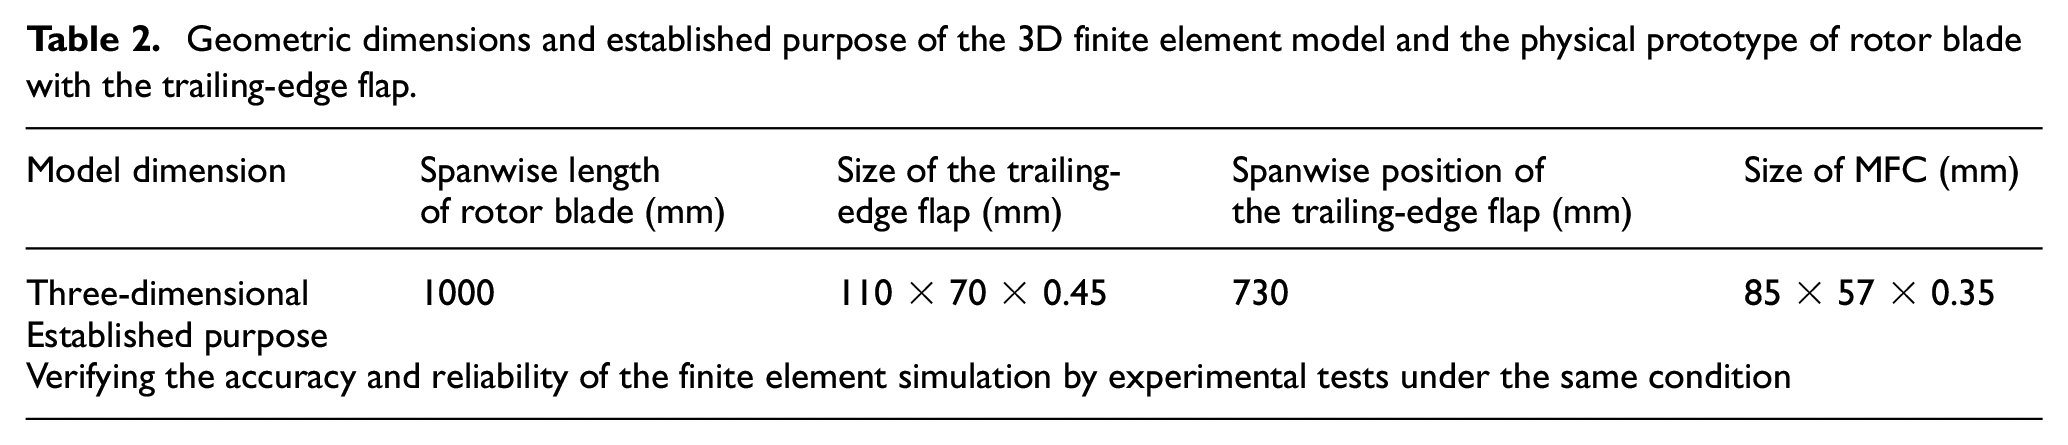
Geometric dimensions and established purpose of the 3D finite element model and the physical prototype of rotor blade with the trailing-edge flap.
The test setup and flow diagram are shown in Figure 5(b) and (c) respectively. The experimental procedure is as follows: A signal generator produces sinusoidal voltage signals of varying amplitudes and frequencies, which are then amplified 1000 times through a power amplifier. Eventually, these signals are outputted via wires to generate an excitation electric field between the positive and negative electrodes of MFC. A high-precision Laser Doppler Vibrometer (LDV, OFV-505/5000, Polytec) (Wu et al., 2022) is utilized to convert the vertical displacement changes at endpoint of the trailing-edge flap into analog voltage signals. Both sets of output signals are processed by a data acquisition system (DH5902N) and finally displayed on the computer screen in the form of time-domain curves. Throughout the experiment, the root of rotor blade is clamping to implement fixed constraints. Generally speaking, the allowable operating voltage range for MFC is −500 to 1500 V (Schönecker et al., 2006). However, the upper limit of the actual excitation voltage is limited at 1000 V to prevent the phenomenon of electrical breakdown caused by being too close to the polarized electric field. This does not affect the accuracy of comparison with simulation results because the output strain and displacement of MFC vary approximately linearly with the excitation voltage within the operating voltage range. Additionally, the voltage output frequency is set to 1 Hz to simulate the static actuation effect of MFC.
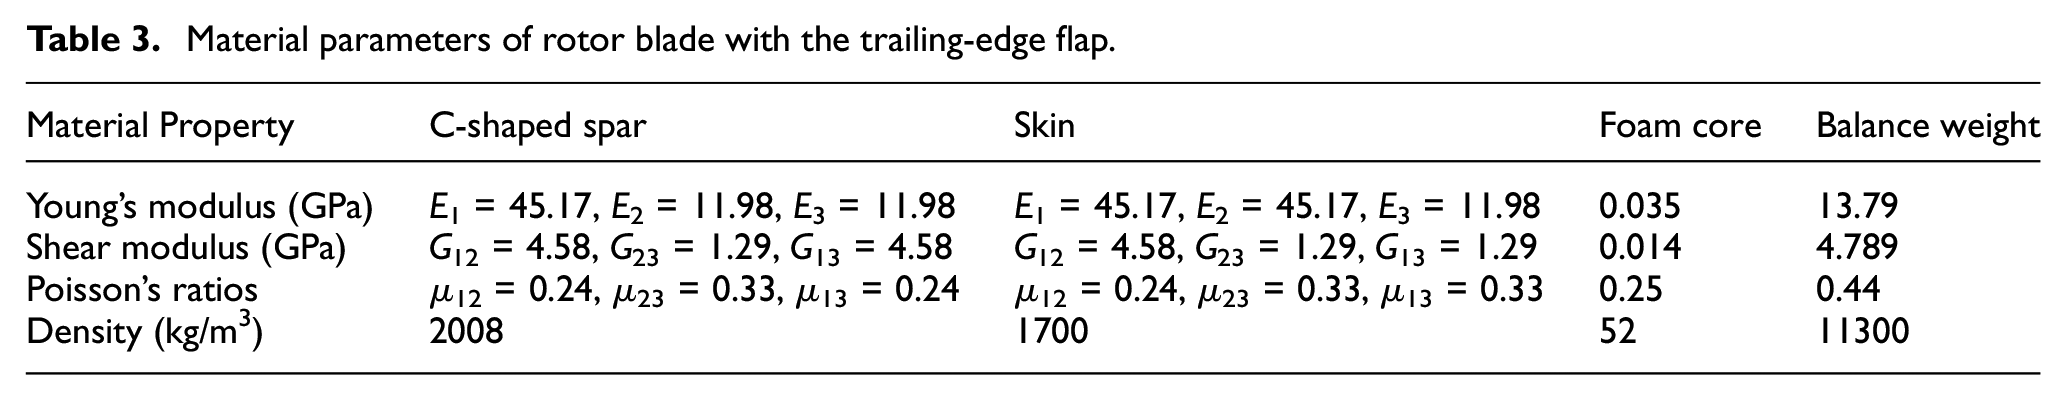
In order to facilitate further theoretical analysis of the established trailing-edge flap model, the simulation calculation is carried out by COMSOL Multiphysics and compared with the above experimental results under the same input conditions to verify the reliability of the simulation setup and process. In theory, it is necessary to apply −500 ∼ 1500 V DC excitation voltages with a step size of 250 V between the interdigital electrodes of MFC during the simulation process individually. However, since the MFC is equivalent to a uniform piezoelectric block with only one pair of surface electrodes, the actual voltage applied between the two electrodes along the chord direction of rotor blade should be V0·L/d during the simulation (where V0 is theoretical voltage between the interdigital electrodes, d is interdigital electrode spacing, and L is chordwise length of MFC). Triangular prism elements and rectangular elements are used to mesh the rotor blade body and the trailing-edge flap, respectively. To enhance the computational accuracy of the displacement results we are interested in, the mesh of the trailing-edge flap was refined while the number of elements in the other areas is appropriately reduced to decrease the computation time. The final mesh division of rotor blade with the trailing-edge flap is shown in Figure 6, which includes 59,725 triangular prism elements and 3,319 rectangular elements, totaling 41,629 mesh nodes. Thus, the deformation of the trailing-edge flap structure is computed based on converse piezoelectric effect by applying fixed constraints to the root region of rotor blade. The material parameters of each component of rotor blade with the trailing-edge flap in simulation are shown in Table 3 (where 1 and 2 directions represent the span and chord direction of the rotor blade respectively, and the material properties of skin need to be rotated by corresponding angles for calculation).
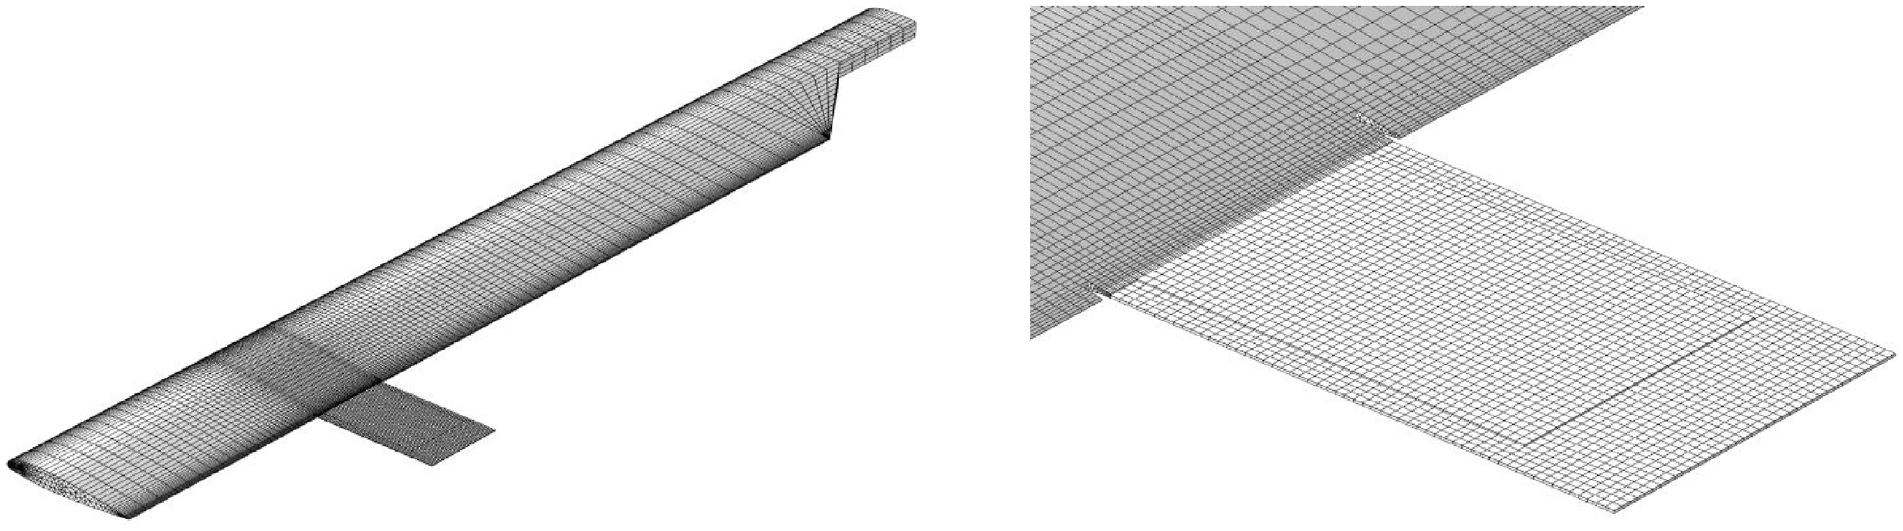
Mesh division diagram of rotor blade with the trailing-edge flap.
Material parameters of rotor blade with the trailing-edge flap.
The deflection angle β of the trailing-edge flap (defined as positive for downward deflection and negative for upward deflection) is calculated by the following formula:
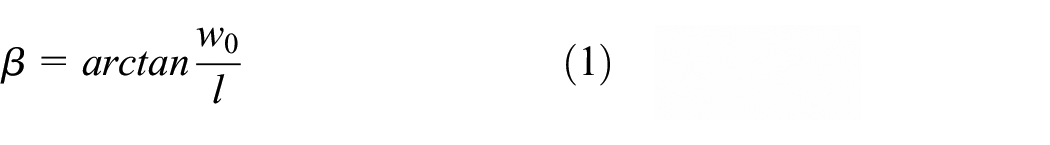
where w0 and l are the vertical displacement of end point and the chordwise length of the trailing-edge flap, respectively.
3.3. Modeling and methodology for analyzing aerodynamic characteristics on airfoil with the trailing-edge flap
3.3.1. Planar aerodynamic analysis model
Building upon the previously discussed design of the structural cross-section of rotor blade with the trailing-edge flap, a planar aerodynamic analysis model is formulated to examine the influence of active deflection of the trailing-edge flap actuated by MFC on the aerodynamic characteristics of the airfoil.
The planar aerodynamic analysis model of the airfoil with the trailing-edge flap is depicted in Figure 7. The chordwise length and thickness of the trailing-edge flap and MFC as a whole are preliminarily determined to be 50 and 0.6 mm respectively. The computational domain’s boundaries are positioned at a distance of 10 times the chord length of the analyzed structural cross-section, aiming to minimize the impact of boundary conditions on the flow field. Boundary conditions are established based on the physical characteristics of the flow field. Given the primary focus on low-speed and incompressible flow analysis in this study, the boundaries of the flow domain are designated as free-stream velocity inlet and pressure outlet, respectively. The upper and lower surfaces of the structural cross-section of the rotor blade with the trailing-edge flap are treated as no-slip wall boundary conditions.
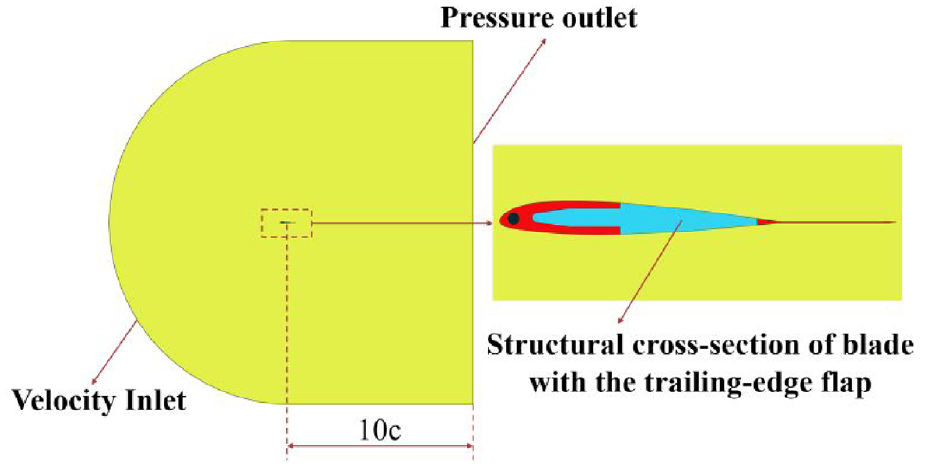
Planar aerodynamic analysis model of airfoil with the trailing-edge flap.
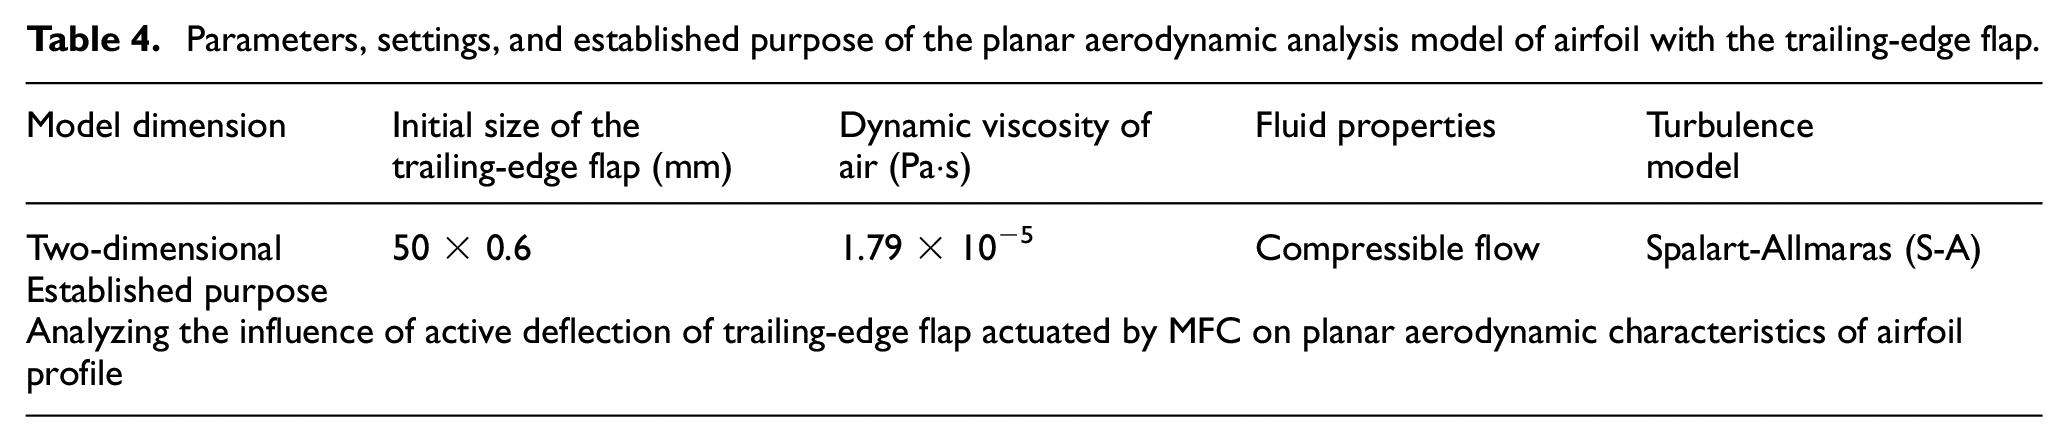
To accurately simulate the boundary layer flow around the airfoil with the trailing-edge flap and analyze its aerodynamic characteristics, the computational fluid dynamics (CFD) calculations in this study employ the Spalart-Allmaras (S-A) turbulence model to balance computational efficiency and cost considerations. Throughout the calculations, the deformation of the blade itself is disregarded through the application of fixed constraints, while the trailing-edge flap is treated as an elastic deformable region. In conclusion, the parameters, settings, and established purpose of the planar aerodynamic analysis model of airfoil with the trailing-edge flap are summarized in Table 4.
Parameters, settings, and established purpose of the planar aerodynamic analysis model of airfoil with the trailing-edge flap.
Considering the adaptability of computational mesh to the geometric profile of the trailing-edge flap section in this paper, unstructured mesh is employed for CFD mesh division and mesh refinement is implemented near the leading edge and the trailing-edge flap to enhance computational accuracy. Furthermore, when simulating viscous flow, there exists a significant velocity gradient near the wall. The velocity decreases from a relatively high value to zero within a very small wall-normal distance. Therefore, accurately calculating the flow field in this region typically requires ensuring that the non-dimensional wall distance y+ is close to 1 which directly affects the position of the first layer of mesh nodes (Carosio and Mendonça, 2013; Misaka et al., 2017; Salim et al., 2010). The height of the first layer mesh satisfying y+≈1 can be estimated to be 6·10−6 m approximately. The details of mesh division are shown in Figure 8 featuring the average mesh quality calculated in terms of cell skewness of 0.897.
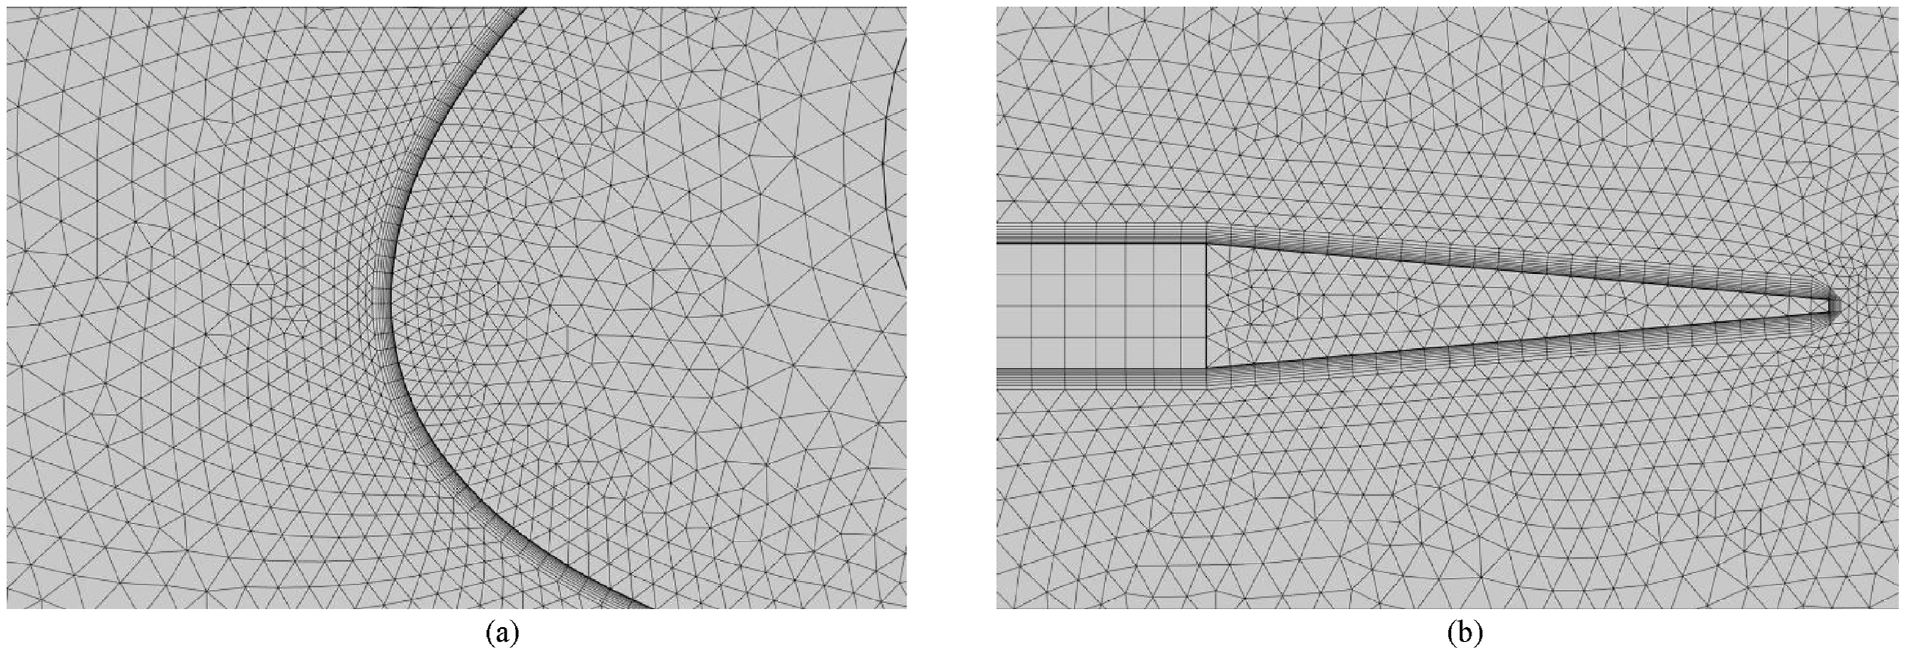
Local details of mesh division of the planar aerodynamic analysis model: (a) leading edge, (b) trailing-edge flap.
3.3.2. Static fluid and structure interaction method
To precisely analyze the aerodynamic characteristics of airfoil with the trailing-edge flap, a Fluid-Structure Interaction (FSI) computational method was implemented using COMSOL Multiphysics simulation software.
The Solid Mechanics module is initially utilized to solve for the deformation of the trailing-edge flap under MFC actuation. Subsequently, the Computational Fluid Dynamics (CFD) module is activated to calculate the surface flow field distribution on the deformed structure under the given operational conditions (Angle of Attack, Mach number, and Reynolds number). The aerodynamic loads are then applied to the structural model to compute the deformation of the trailing-edge flap under the combined effects of MFC actuation and aerodynamic loads. This process iterates continuously, with the difference between the results of adjacent iteration steps gradually diminishing until convergence is achieved. Ultimately, the corresponding result data is output.
Furthermore, throughout the computational process, the Arbitrary Lagrangian-Eulerian (ALE) (Hai and Bause, 2013a, 2013b) method is employed to manage the deformation of geometry and the movement of boundaries using dynamic mesh techniques, thereby facilitating grid updates in the fluid domain.
Utilizing the established planar aerodynamic analysis model of airfoil with the trailing-edge flap and FSI computational method, calculations are conducted to analyze the active deflection of the trailing-edge flap and lift, drag, and pitch moment coefficients of the airfoil. Additionally, the research investigates the variations in these results under different excitation voltages of MFC, inflow conditions and sizes of the trailing-edge flap. On one hand, this was done to verify that the designed trailing-edge flap has good adaptability and can effectively control the aerodynamic loads expected on the airfoil under different input conditions. On the other hand, this study is also to analyze the important influencing factors of the relevant structures, including the trailing-edge flap designed in this paper, so as to contribute to further design and research in the future.
3.4. Application of the BP neural network for predicting results of the planar aerodynamic analysis model
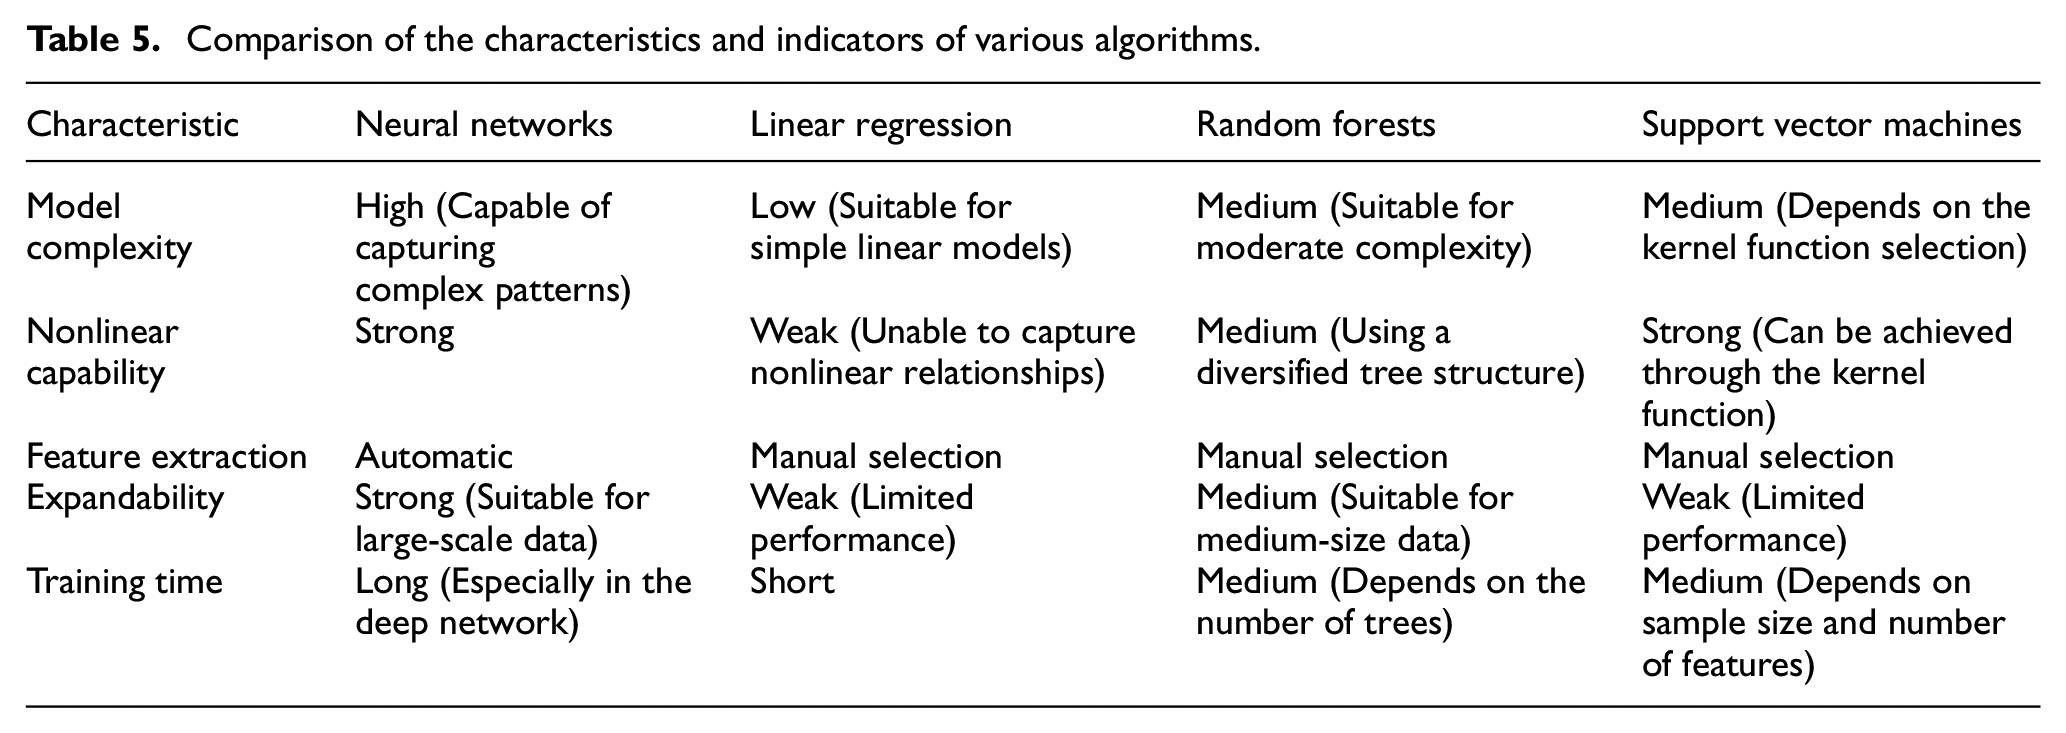
The analysis of the planar aerodynamic model of airfoil with the trailing-edge flap in the previous context reveals the complexity of factors influencing the deflection angle of the trailing-edge flap and the planar aerodynamic characteristics of the airfoil. Expressing the specific relationships between these factors and their outcomes using general expressions is challenging. With the development of artificial intelligence, machine learning has been increasingly applied in fields such as aerospace, which can analyze large amounts of data to make decisions or predictions without human intervention. Common machine learning algorithms include Linear Regression (Pak and Oh, 2010), Random Forests (Dogan, 2023, Mills et al., 2023), Support Vector Machines (Aurelia et al., 2021; Wang, 2005), Neural Networks (Dworakowski et al., 2017; Wang and Wang, 2021), etc. The comparison of their characteristics and indicators is shown in Table 5. Upon comprehensive comparison, it can be seen that Neural Networks can learn complex nonlinear relationships and have the ability for automatic feature extraction. Furthermore, as the amount of data increases, Neural Networks typically continue to improve their performance especially in processing image and text data. Therefore, Neural Networks have become a popular choice due to their superior performance in many applications such as data classification and result prediction (Fan et al., 2022; Hongkang et al., 2018). Among these, the BP Neural Network stands out as one of the most widely applied Neural Network models. It exhibits excellent adaptability and efficient learning capabilities, effectively capturing complex nonlinear relationships between input and output of the studied subject (Xu et al., 2021).
Comparison of the characteristics and indicators of various algorithms.
The purpose of this section is to achieve fast and accurate predictions based on a machine learning algorithm for the results of the trailing-edge flap model mentioned earlier, rather than to conduct a detailed theoretical analysis and performance comparison of various algorithms to determine the optimal choice. Therefore, this paper provides only a brief introduction and comparison of prediction errors for several other machine learning algorithms, while focusing on the computation and analysis of the BP Neural Network.
Hence, in the following text, the prediction method for the trailing-edge flap model is established using BP Neural Network aiming to accurately forecast the deflection angle of the trailing-edge flap and aerodynamic characteristics of the airfoil when input parameters are varied within a certain range. This endeavor serves as a theoretical reference for the application of active control of the trailing-edge flap in reducing vibration and noise in helicopter rotor systems.
The prediction of the above trailing-edge flap model through the BP Neural Network mainly involves four steps: constructing the BP Neural Network, selecting and preprocessing sample data, training the BP Neural Network, and making predictions and error analysis using the BP Neural Network. All of the above steps and processes are done through the PyTorch machine learning framework with the help of the Python programming language.
3.4.1. Construction of the BP neural network
The BP Neural Network is a multilayer feedforward Neural Network trained using the error backpropagation algorithm (Zhu et al., 2023). It comprises input layers, hidden layers, and output layers. The input vector undergoes successive weighted nonlinear transformations in each layer, ultimately generating the output vector.
In the context of the planar aerodynamic analysis model of the airfoil with the trailing-edge flap, a 4-layer BP Neural Network with double hidden layers is constructed for result prediction. The input variables, denoted as X = {x1, x2, x3, x4, x5}, include excitation voltage of MFC, velocity and angle of attack of inflow, length and thickness of trailing-edge flap. The output variables, denoted as Y = {y1, y2, y3, y4}, represent the lift coefficient Cl, drag coefficient Cd, pitching moment coefficient Cm, and deflection angle of the trailing-edge flap β. Based on experimental error analysis, it is determined that the first hidden layer has 16 neurons, and the second hidden layer has 8 neurons. The basic structure of the BP Neural Network is illustrated in Figure 9.
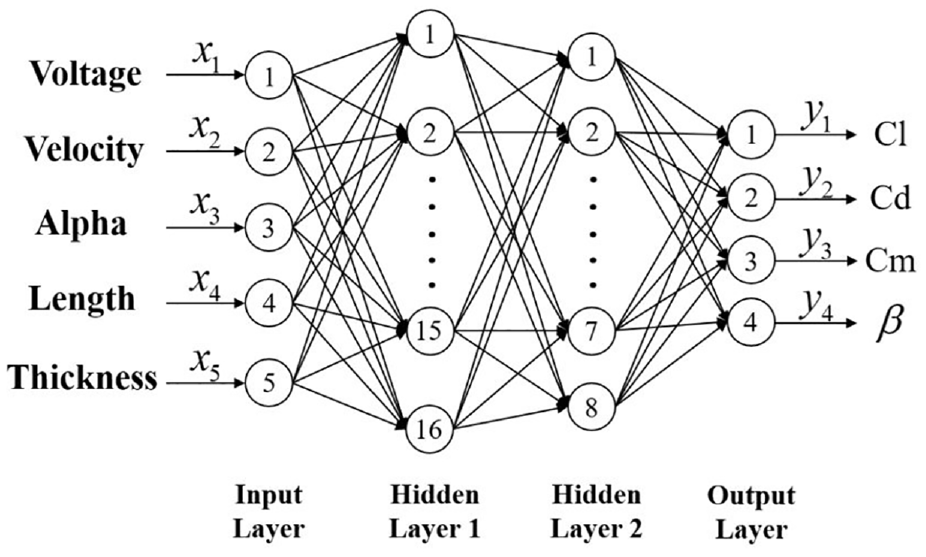
Model structure of the BP neural network.
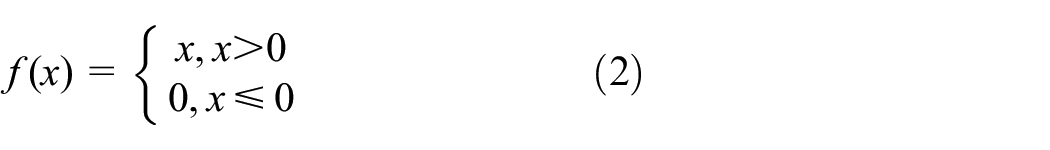
To enhance the capability of BP Neural Networks in solving nonlinear problems, the Rectified Linear Unit (ReLU) (Shin et al., 2016) activation function is introduced. It performs a nonlinear transformation on the output of the weighted sum for each node in the hidden layer. The definition of ReLU is as follows:
3.4.2. Sample data selection and preprocessing
To generate a sufficient amount of sample data for training and testing the BP Neural Network, a combined simulation using COMSOL Multiphysics with MATLAB was employed. This approach involved parametric modeling and batch computations for the planar aerodynamic analysis model of airfoil with the trailing-edge flap, significantly improving computational efficiency.
Within the MATLAB scripting for parametric modeling, varying input parameters were sequentially selected for parametric processing, while the remaining fixed input parameters were set statically, enabling automated parametric modeling and solving. Subsequently, the corresponding output data was extracted.
The range of settings for input parameters is shown in Table 6. Using the parametric modeling method, a total of 1445 sets of sample data were generated, each consisting of 5 input parameters and 4 output parameters. Among these, 1345 sets of data were randomly selected as training samples, while the remaining 100 sets were reserved for testing the trained Neural Network. The order of all sample data was shuffled after random extraction.
Range for input parameter settings.
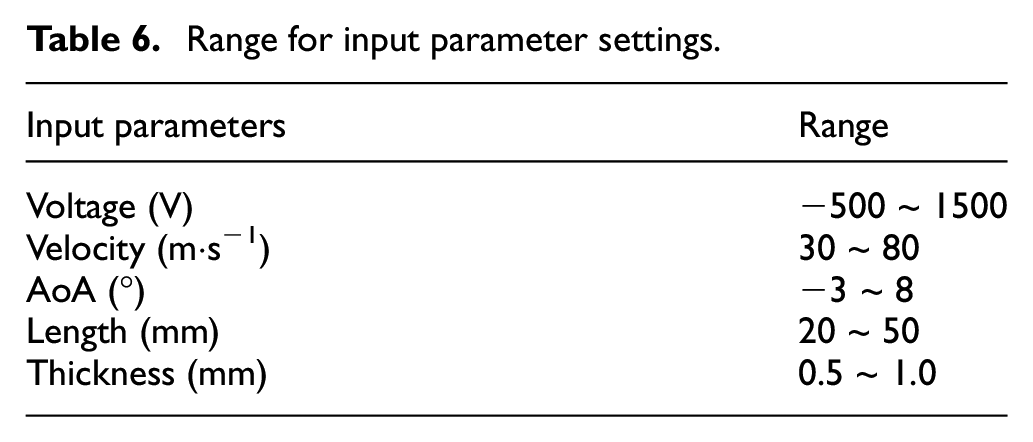
Given the significant differences in magnitudes among various input and output parameters in the sample data, the min-max normalization method (Ahmed et al., 2022; Om Kumar et al., 2023) was employed because the variation of input features has a corresponding specific range and the data distribution is roughly uniform with no significant outliers. This standardization approach aimed to expedite the Neural Network training speed and enhance convergence by transforming all input and output values in the sample data uniformly into the [0,1] interval (Zhang et al., 2015). The normalization functions used were as follows:
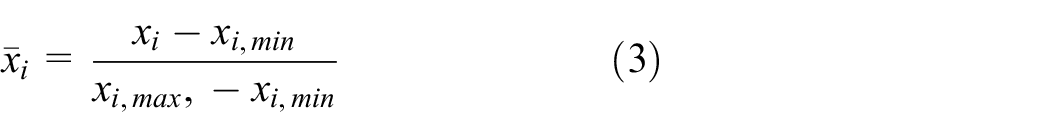
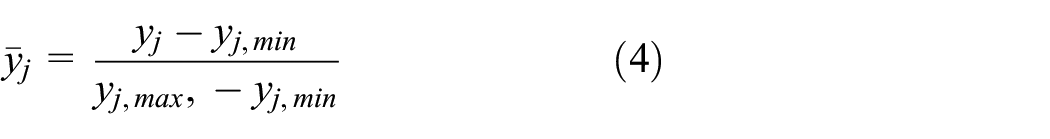
In the formulas, xi, max and yj, max represent the maximum values of the input variable xi and the output variable yj, respectively. Similarly, xi, min and yj, min represent the minimum values of xi and yj, where i = 1, 2, 3, 4, 5, and j = 1, 2, 3, 4.
3.4.3. BP neural network training
The training process of a BP Neural Network involves two main components: forward propagation of signals and backward propagation of errors (Xu et al., 2022). During forward propagation, input signals traverse hidden layers, layer by layer, until reaching the output layer, producing the final output (Wu et al., 2023). Simultaneously, error propagation moves backward from the output layer to the hidden layers and ultimately to the input layer. Throughout this process, network weights and biases are iteratively adjusted layer by layer, aiming to minimize errors (Amouei et al., 2024). This iterative process continues until reaching an error threshold or the maximum number of training iterations, allowing the BP Neural Network’s predicted output to gradually converge to the expected output (Shulin et al., 2021).
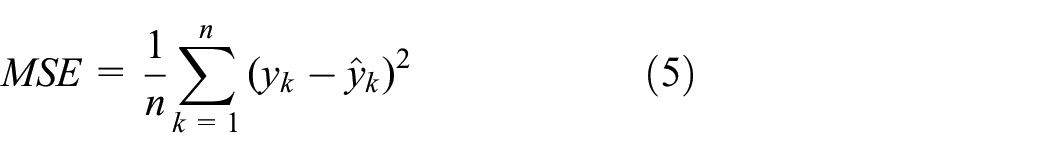
The loss function serves as a metric to measure the error magnitude between the BP Neural Network’s predicted values and the expected values. The Neural Network training process revolves around minimizing this loss function. Mean Squared Error (MSE) (Shulin et al., 2021; Xu et al., 2022) is employed as the loss function in this context, with its expression as follows:
Here,
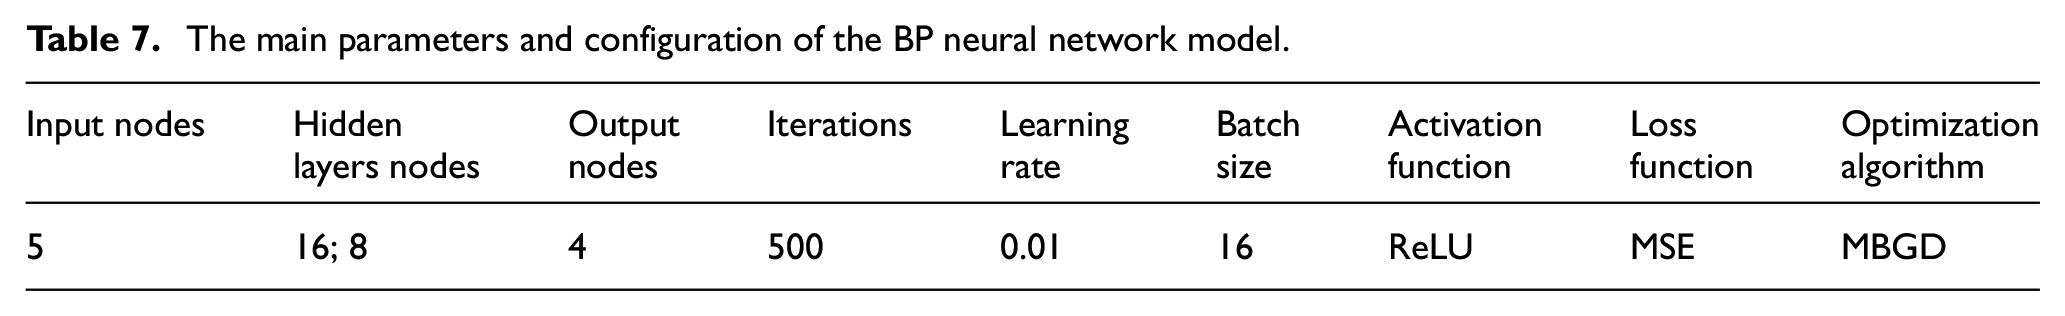
The training algorithm’s selection impacts the convergence speed, iteration count, and generalization ability of the BP Neural Network model. In this study, we employ the Mini-Batch Stochastic Gradient Descent (MBGD) (Du et al., 2019; Pal et al., 2021; Yamamori et al., 2018) optimization algorithm which combines Batch Gradient Descent (BGD) (Ming et al., 2023) and Stochastic Gradient Descent (SGD) (Zhou et al., 2021) to train the established BP Neural Network model. MBGD uses a small batch of samples in each iteration to compute gradients and update parameters, which can provide better training efficiency and stability, especially when dealing with large-scale datasets. The learning rate, as one of the important hyperparameters for training Neural Network (Takase et al., 2018), determines the step size of parameter updates in each iteration of the model. Therefore, to achieve optimal training results, the learning rate is set to 0.01 based on multiple experiments and empirical observations. Finally, the main parameters and configuration of the BP Neural Network model are shown in Table 7.
The main parameters and configuration of the BP neural network model.
3.4.4. Analysis of the BP neural network prediction results
For the trained BP Neural Network model, the prediction accuracy and generalization ability are validated using the test set sample data. This paper utilizes the percentage of absolute error for each output relative to the range of the output variable and their average for evaluating the error between the BP Neural Network predicted values and the expected values. The corresponding formula is as follows:
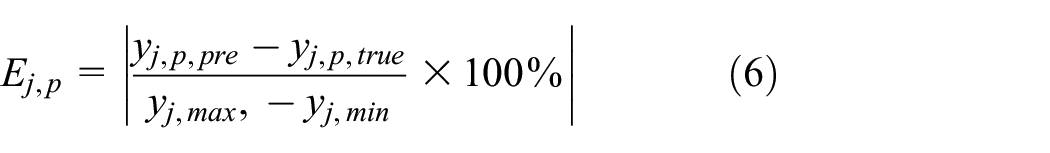
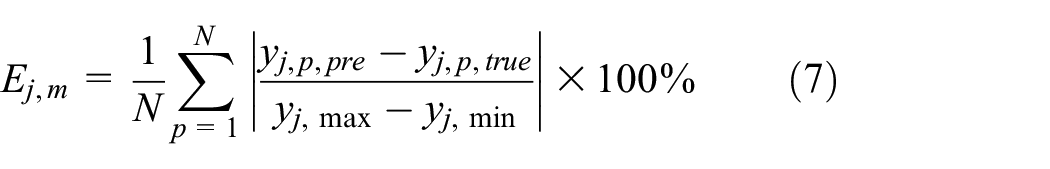
Where, y j, p, pre and y j, p, true are the j-th predicted and expected output values for the p-th test sample, and N is the number of test set samples selected.
4. Results and discussion
4.1. Analysis and comparison of experimental and simulation results
The comparison of peak-to-peak deflection angles (βp-p) of the trailing-edge flap obtained from experiment and simulation with varying applied voltages is shown in Figure 10. The two sets of data exhibit a good agreement. The results indicate that βp-p increases approximately proportionally with the increase in applied voltage. Under a peak-to-peak voltage of 2000 V, the simulation result can reach approximately βp-p = 5.5°. The deformation contour plot under different DC voltages excitation is illustrated in Figure 11. As seen from the contour plot, applying negative voltage to MFC on upper surface of the trailing-edge flap introduces compressive strain, causing the trailing-edge flap to deflect upward. Conversely, the positive voltage introduces tensile strain, resulting in downward deflection of the trailing-edge flap, which is consistent with the conclusion drawn from above theoretical analysis. Additionally, the greater the absolute value of the excitation voltage within its operating range, the more pronounced the deformation effect of the trailing-edge flap. In conclusion, both experiment and simulation confirm the effectiveness of MFC in actively actuating the trailing-edge flap, which lays the foundation for subsequent analyses of the aerodynamic load control effects of airfoil with the trailing-edge flap.
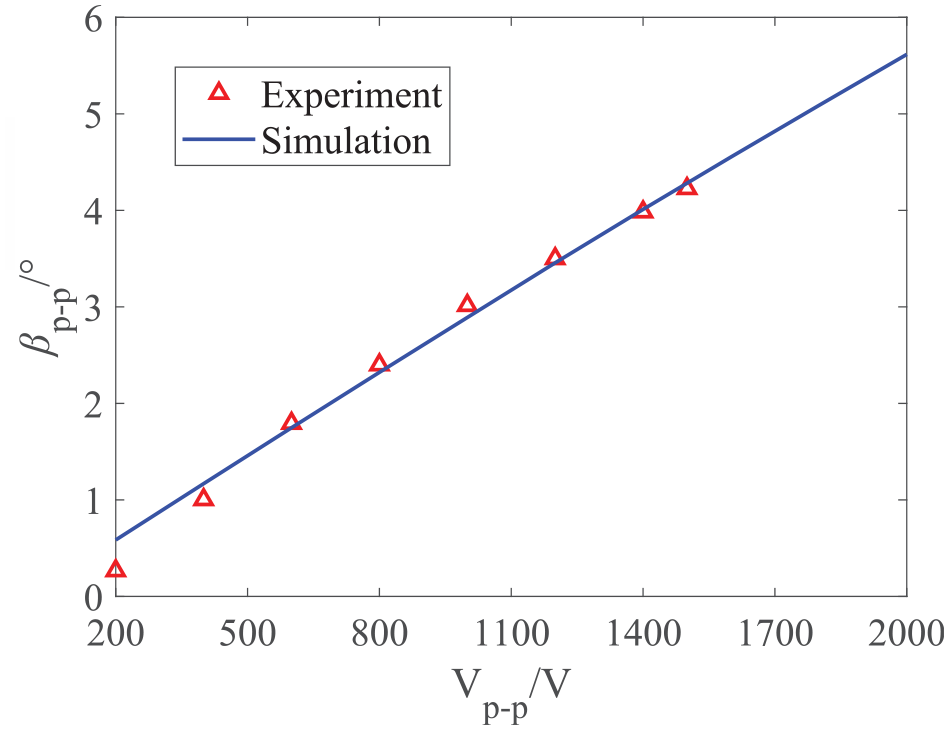
Comparison of βp-p between experiment and simulation.
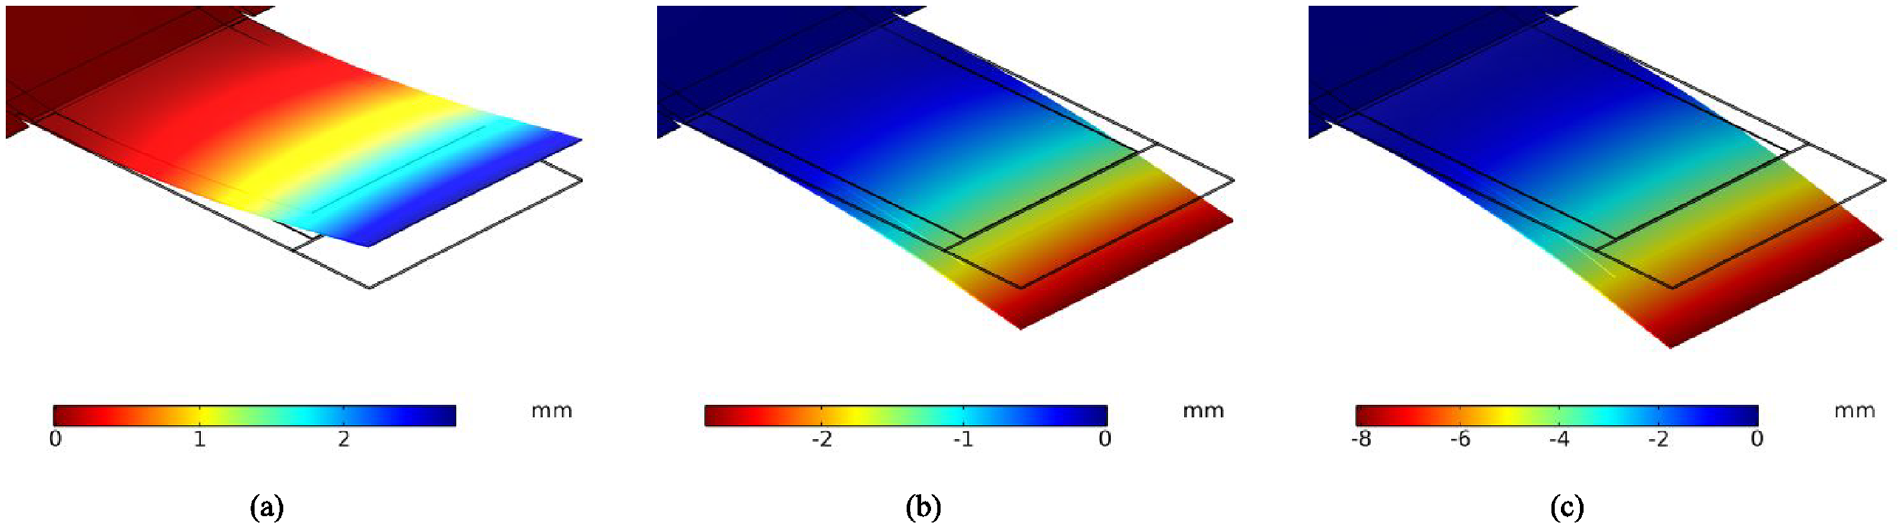
Displacement contour plot of the trailing-edge flap under different DC voltages excitation.
4.2. Analysis of the aerodynamic characteristics of the trailing-edge flap deflection
4.2.1. The influence of MFC excitation voltage magnitude
Considering a helicopter in a hovering state with a rotor rotational speed of 600 r/min and the predetermined installation position of the trailing-edge flap along the span of the rotor blade, the inflow velocity at that location is approximately 50 m/s (Mach number = 0.147). The analysis focuses on the aerodynamic characteristics of the airfoil with the trailing-edge flap under this specific condition.
At an Angle of Attack (AoA) of 0°, DC excitation voltages ranging from −500 to 1500 V (with a step size of 250 V) are applied to MFC. The simulation results, illustrated in Figure 12, depict the variation of deflection angle of the trailing-edge flap with the excitation voltage in the presence and absence of aerodynamic loads. It is observed that, under the same excitation voltage, the action of aerodynamic loads somewhat hinders the active deformation of the trailing-edge flap, with a difference in results of approximately 10%.
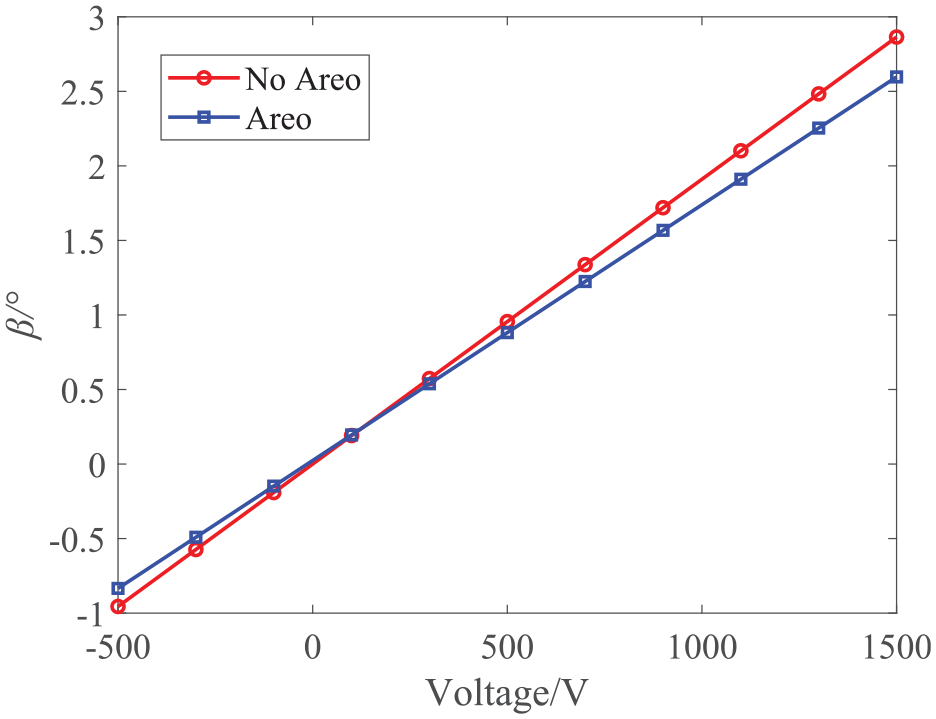
Variation of deflection angle of the trailing edge flap with or without aerodynamic loads.
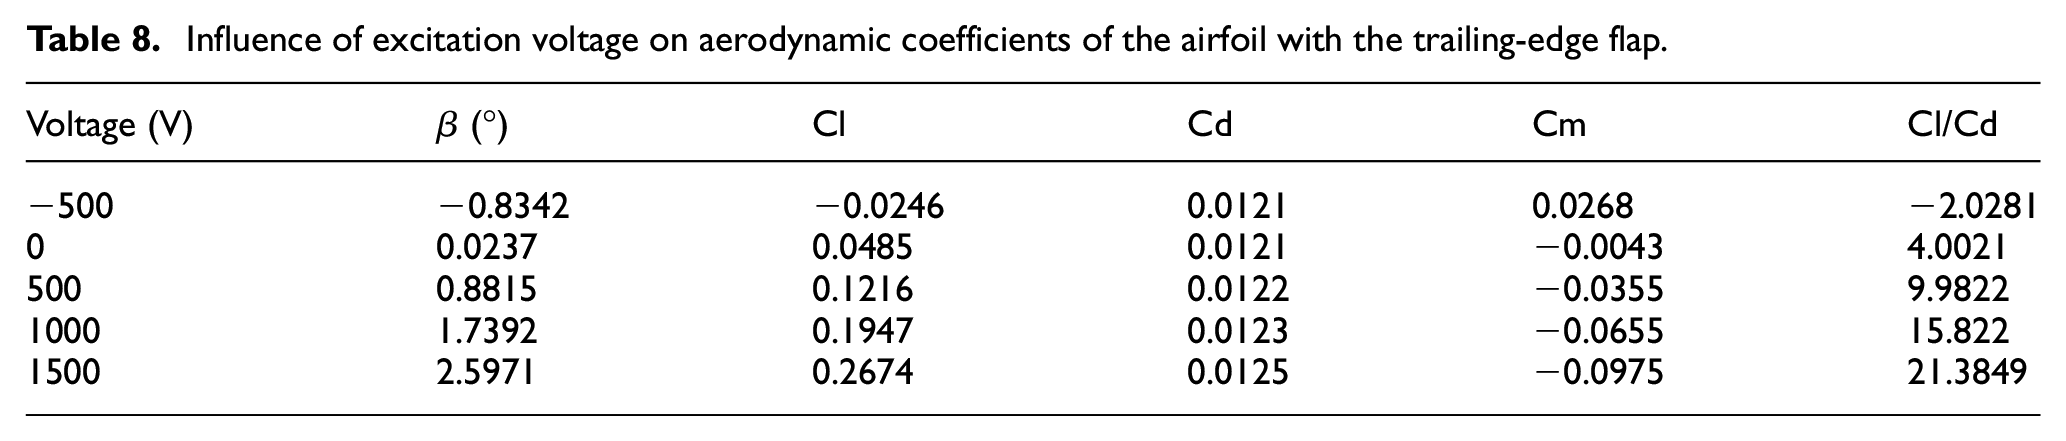
A subset of aerodynamic coefficients is presented in Table 8, indicating that slight deflections of the trailing-edge flap under MFC actuation significantly impact the lift coefficient (Cl) and pitching moment coefficient (Cm) of the airfoil, while the influence on the drag coefficient (Cd) is relatively small. In addition, Cl and Cm approximately increase in direct proportion to the deflection angle of the trailing-edge flap.
Influence of excitation voltage on aerodynamic coefficients of the airfoil with the trailing-edge flap.
The pressure contour of the airfoil with the trailing-edge flap at excitation voltages of −500, 500, and 1500 V (see Figure 13) reveals that the downward deflection of the trailing-edge flap enlarges the low-pressure region on the upper surface and the high-pressure region on the lower surface, resulting in an increased pressure difference across the airfoil; conversely, an upward deflection of the trailing-edge flap produces the opposite effect.
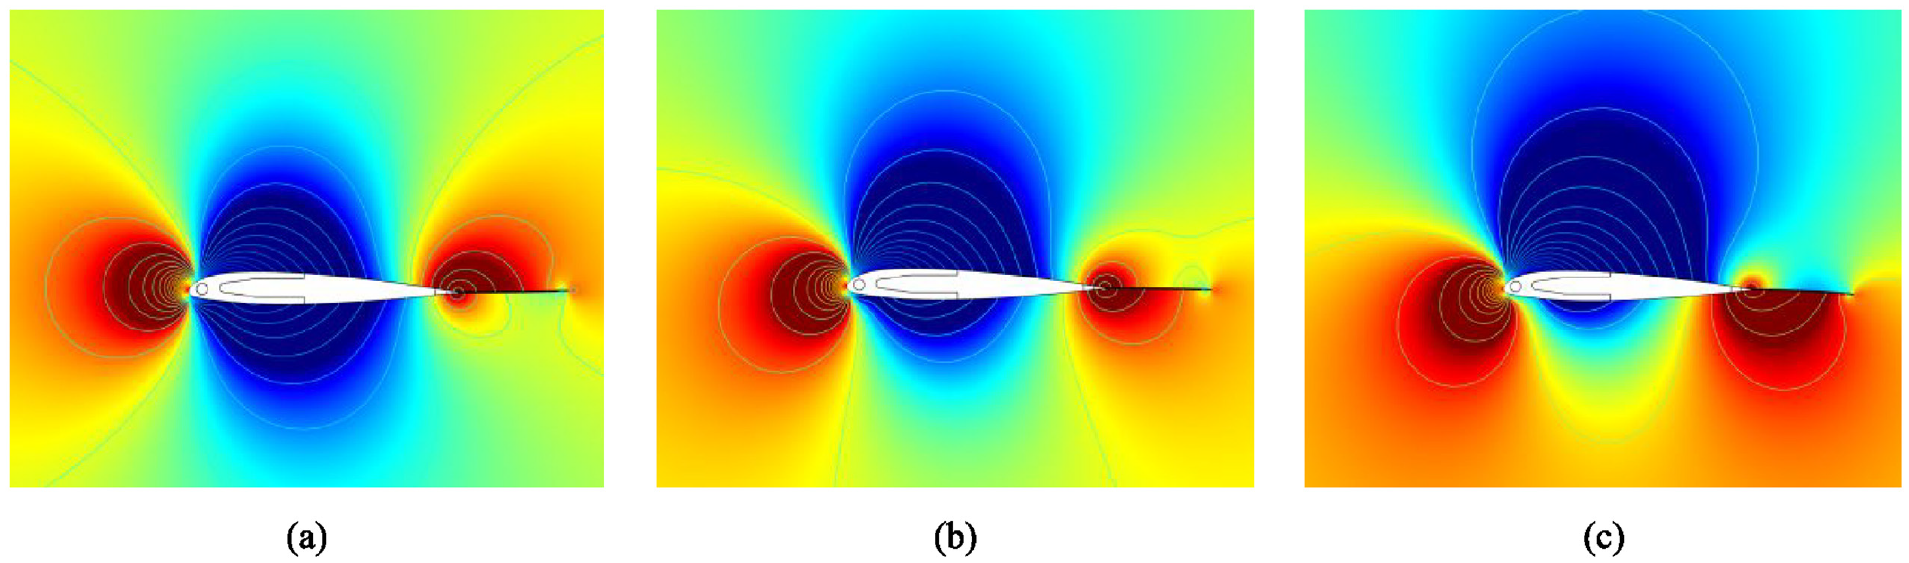
Pressure contour of the airfoil with the trailing-edge flap under different excitation voltages: (a) −500 V, (b) 500 V, (c) 1500 V.
4.2.2. The influence of velocity and AoA of inflow
Further analysis is undertaken to examine the deformation of the trailing-edge flap under different inflow conditions and its impact on the aerodynamic characteristics of the airfoil. At an AoA of 0°, the variation of the deflection angle of the trailing-edge flap with inflow velocity under different excitation voltages is depicted in Figure 14(a). Observations reveal that as the inflow velocity increases, the absolute value of the deflection angle of the trailing-edge flap under the same excitation voltage gradually decreases. The primary reason for this phenomenon is that the increase in velocity generates additional aerodynamic loads, which, to some extent, hinders the active deflection of the trailing-edge flap.
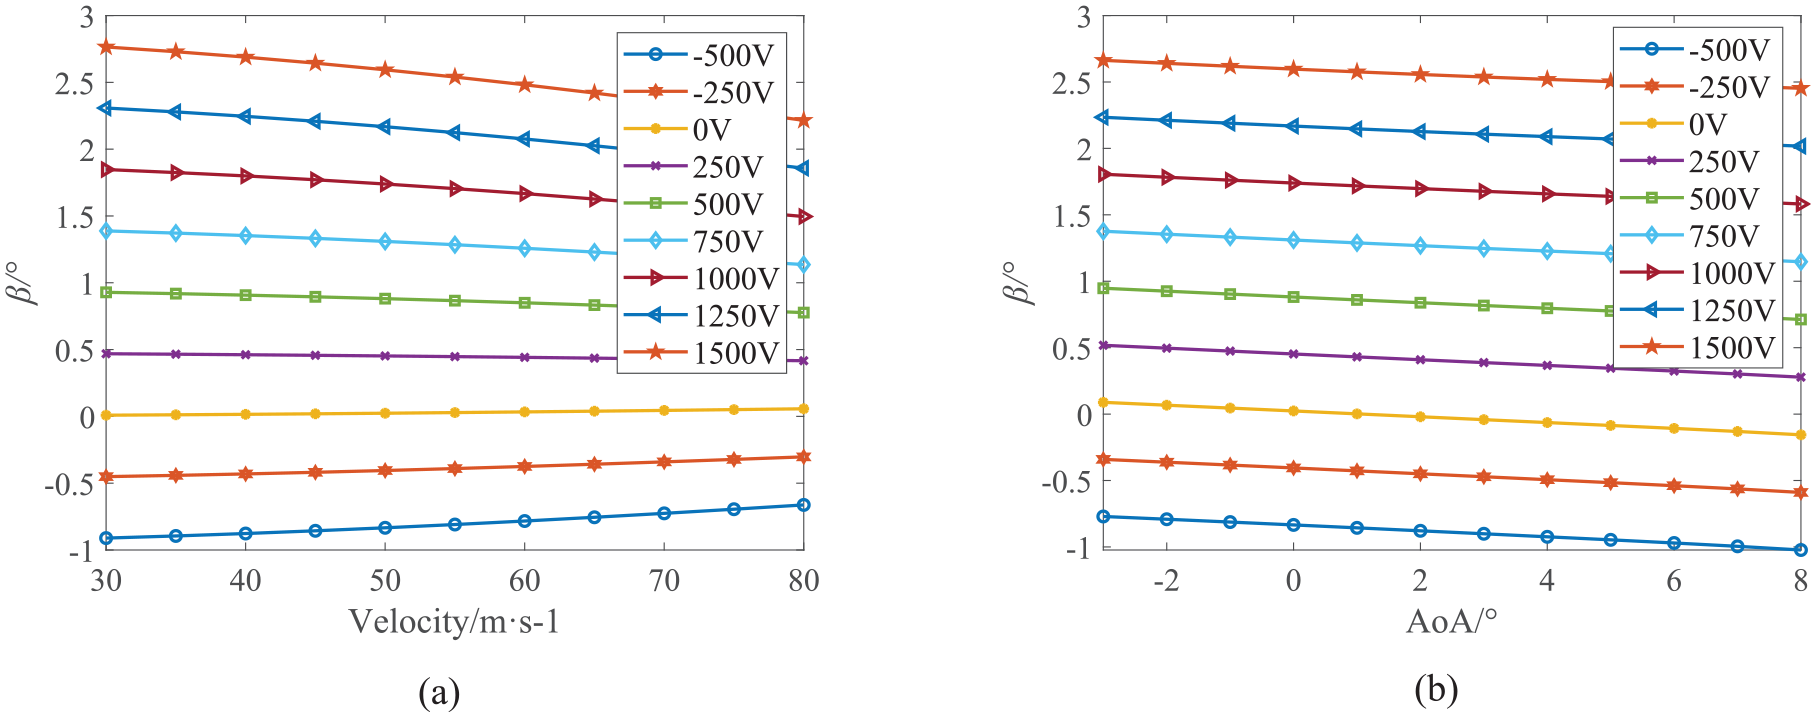
(a) Influence of excitation voltage and velocity on β at AoA = 0°, (b) influence of excitation voltage and AoA on β at Ma = 0.147.
Maintaining the inflow velocity at a constant 50 m/s, the variation of the deflection angle of the trailing-edge flap with AoA is illustrated in Figure 14(b). It is observed that as AoA increases, the overall trend of the curve remains consistent, indicating that the trailing-edge flap deflects upward under the same excitation voltage.
Under the condition of an inflow velocity of 50 m/s, the trends of aerodynamic coefficients for the airfoil with increasing AoA are illustrated in Figure 15. The results indicate that, at the same AoA, the maximum change in Cl for the airfoil with the trailing-edge flap under MFC actuation is approximately 0.3, and the maximum change in Cm is about 0.07. This suggests that within the operating range of rotor blade rotational speed and AoA, the trailing-edge flap exhibits effective control over Cl and Cm on the airfoil.
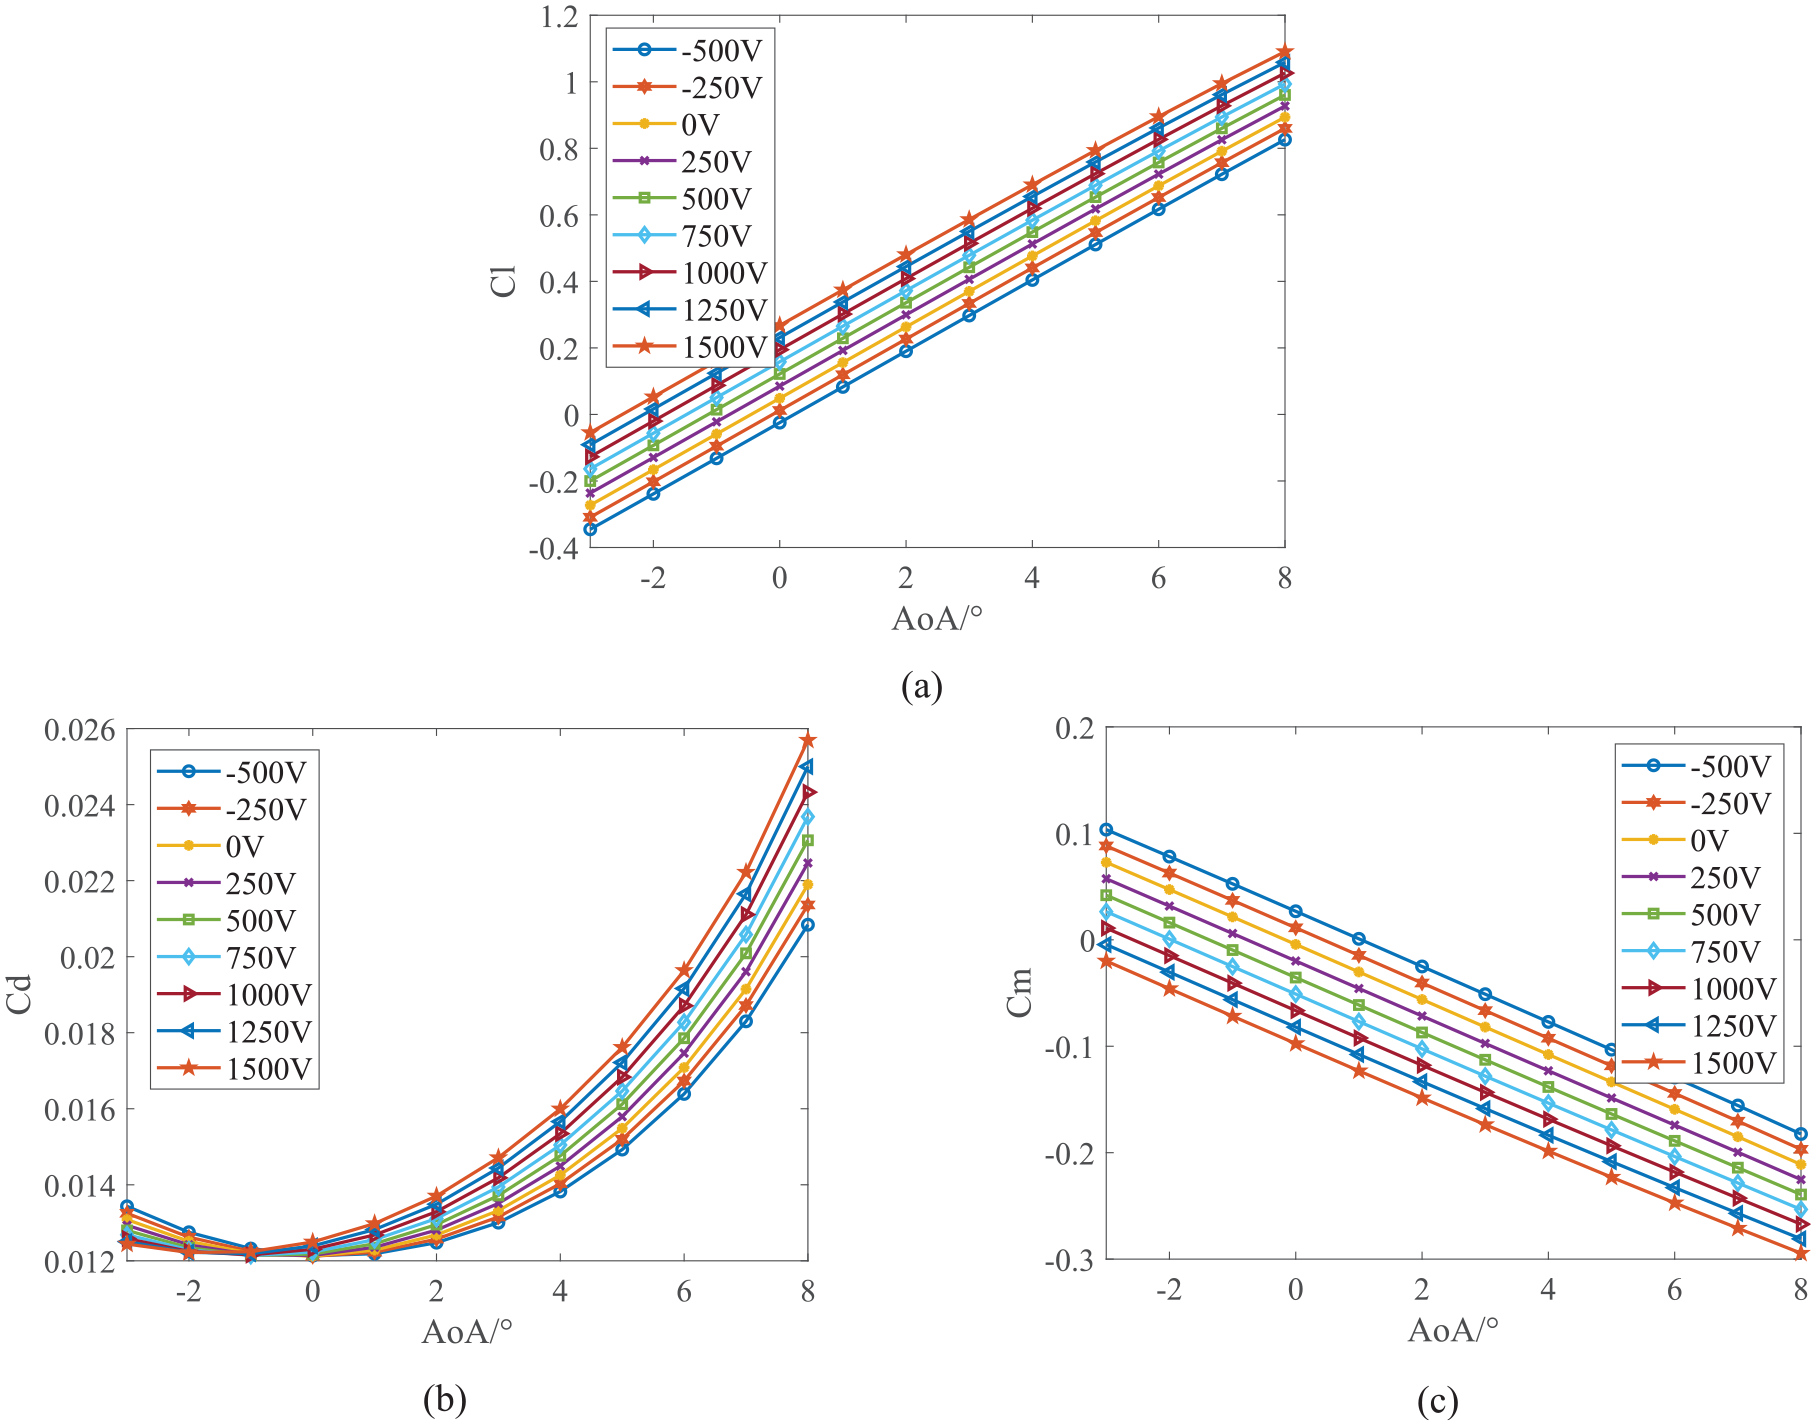
(a) Influence of excitation voltage and AoA on Cl at Ma = 0.147, (b) influence of excitation voltage and AoA on Cd at Ma = 0.147, (c) influence of excitation voltage and AoA on Cm at Ma = 0.147.
4.2.3. The influence of size of the trailing-edge flap
Commencing from the initial design dimensions, the study investigates the impact of changes in the chordwise length and thickness of the trailing-edge flap on the structural deformation and aerodynamic characteristics of the airfoil. With the inflow velocity set at 50 m/s and AoA at 0°, the chordwise length of the trailing-edge flap is varied from 20 to 50 mm (with intervals of 5 mm), and the thickness is varied from 0.5 to 1 mm (with intervals of 0.05 mm). After applying a DC excitation voltage of 1500 V to MFC, the influence of these dimensional parameters on the deflection angle of the trailing-edge flap is depicted in Figure 16.
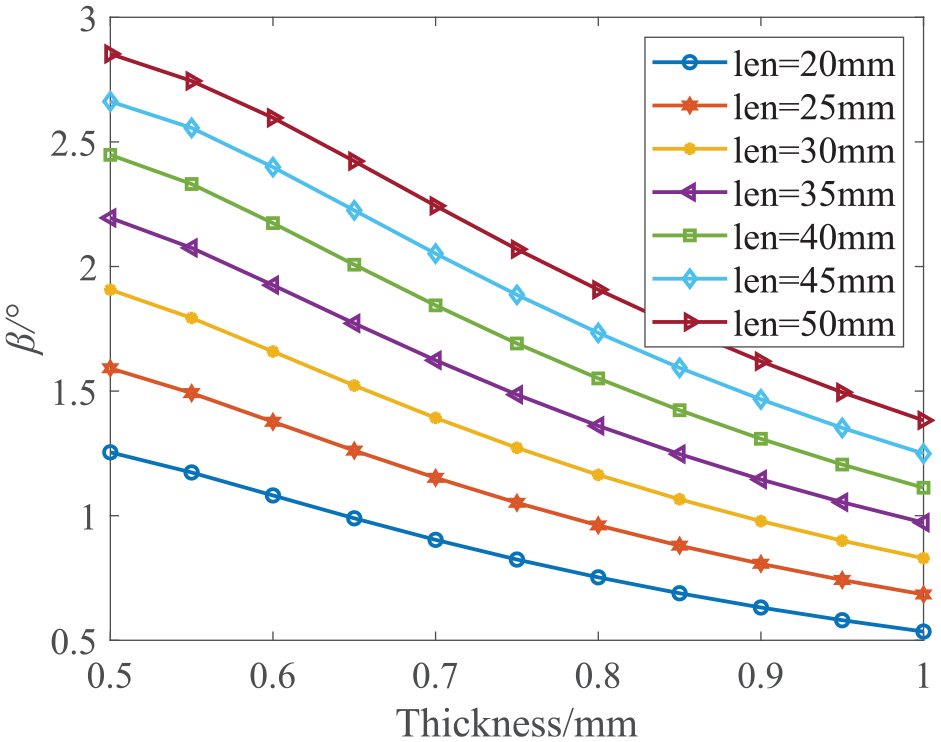
Influence of length and thickness of the trailing-edge flap on β at Ma = 0.147 and AoA = 0°.
Results indicate that, at a constant thickness, the deflection angle increases with an increase in the chordwise length of the trailing-edge flap. Conversely, when the length is held constant, an increase in the thickness of the trailing-edge flap leads to a decrease in the deflection angle. As previously analyzed, the aerodynamic coefficients of the airfoil will also undergo corresponding changes with variations in the deflection angle of the trailing-edge flap.
4.3. Result prediction and analysis of the planar aerodynamic analysis model of airfoil with the trailing-edge flap based on BP neural network
4.3.1. BP neural network training and comparison and analysis of prediction results
Configuring the BP Neural Network training with a maximum iteration count of 500 and each batch containing 16 data points, the processed sample data is fed into the established network model, resulting in the training outcomes depicted in Figure 17. As the training progresses, both the MSE loss values for the training and testing set sharply decrease initially, then tend to stabilize. In the early stages of training, it is normal for the MSE loss on testing set to be slightly higher than that on training set due to the different data distributions of the two sets. As training continues and the model converges, the gap between the two losses gradually shrinks to an acceptable level. Eventually, after 500 training iterations, the respective MSE loss for the training and testing set are 1.48 × 10⁻⁴ and 2.11 × 10⁻⁴, indicating sufficient precision and reliability. The whole training and convergence process lasts only 14.22 s.
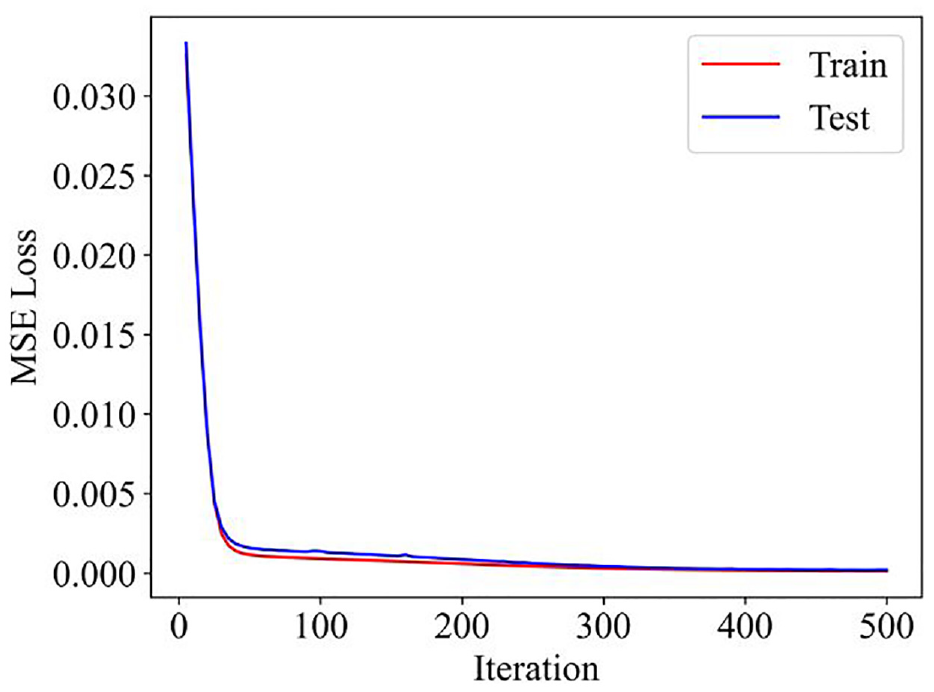
MSE loss for train and test of BP neural network.
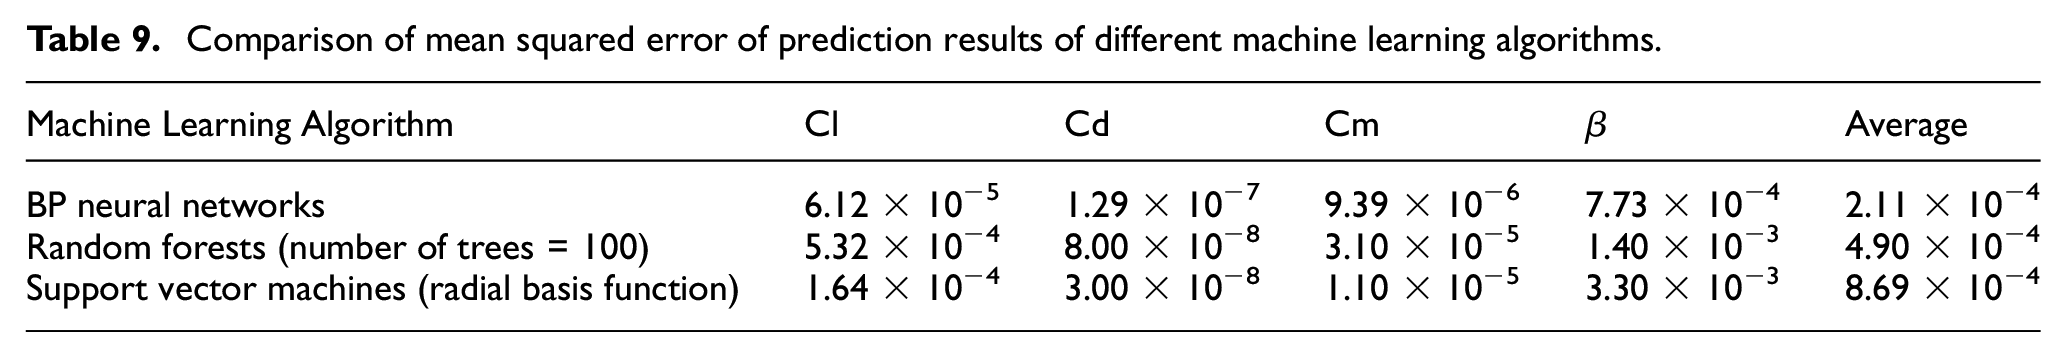
Additionally, based on the same sample data and data partitioning method, the comparison of the accuracy of three machine learning algorithms in predicting the results of trailing-edge flap model is conducted, using Mean Squared Error to measure the difference between predicted values and actual values, as shown in Table 9. From the error analysis, it can be seen that the BP Neural Network method has higher accuracy in predicting the output results of the trailing-edge flap model compared to the Random Forests and Support Vector Machines methods in general. Therefore, the following sections focus on visualization and further analysis of BP Neural Network prediction results.
Comparison of mean squared error of prediction results of different machine learning algorithms.
After calculating the input parameters of 100 data samples in the test set using the trained BP Neural Network model, the comparison of four different predicted outputs with the corresponding expected outputs is shown in Figure 18.
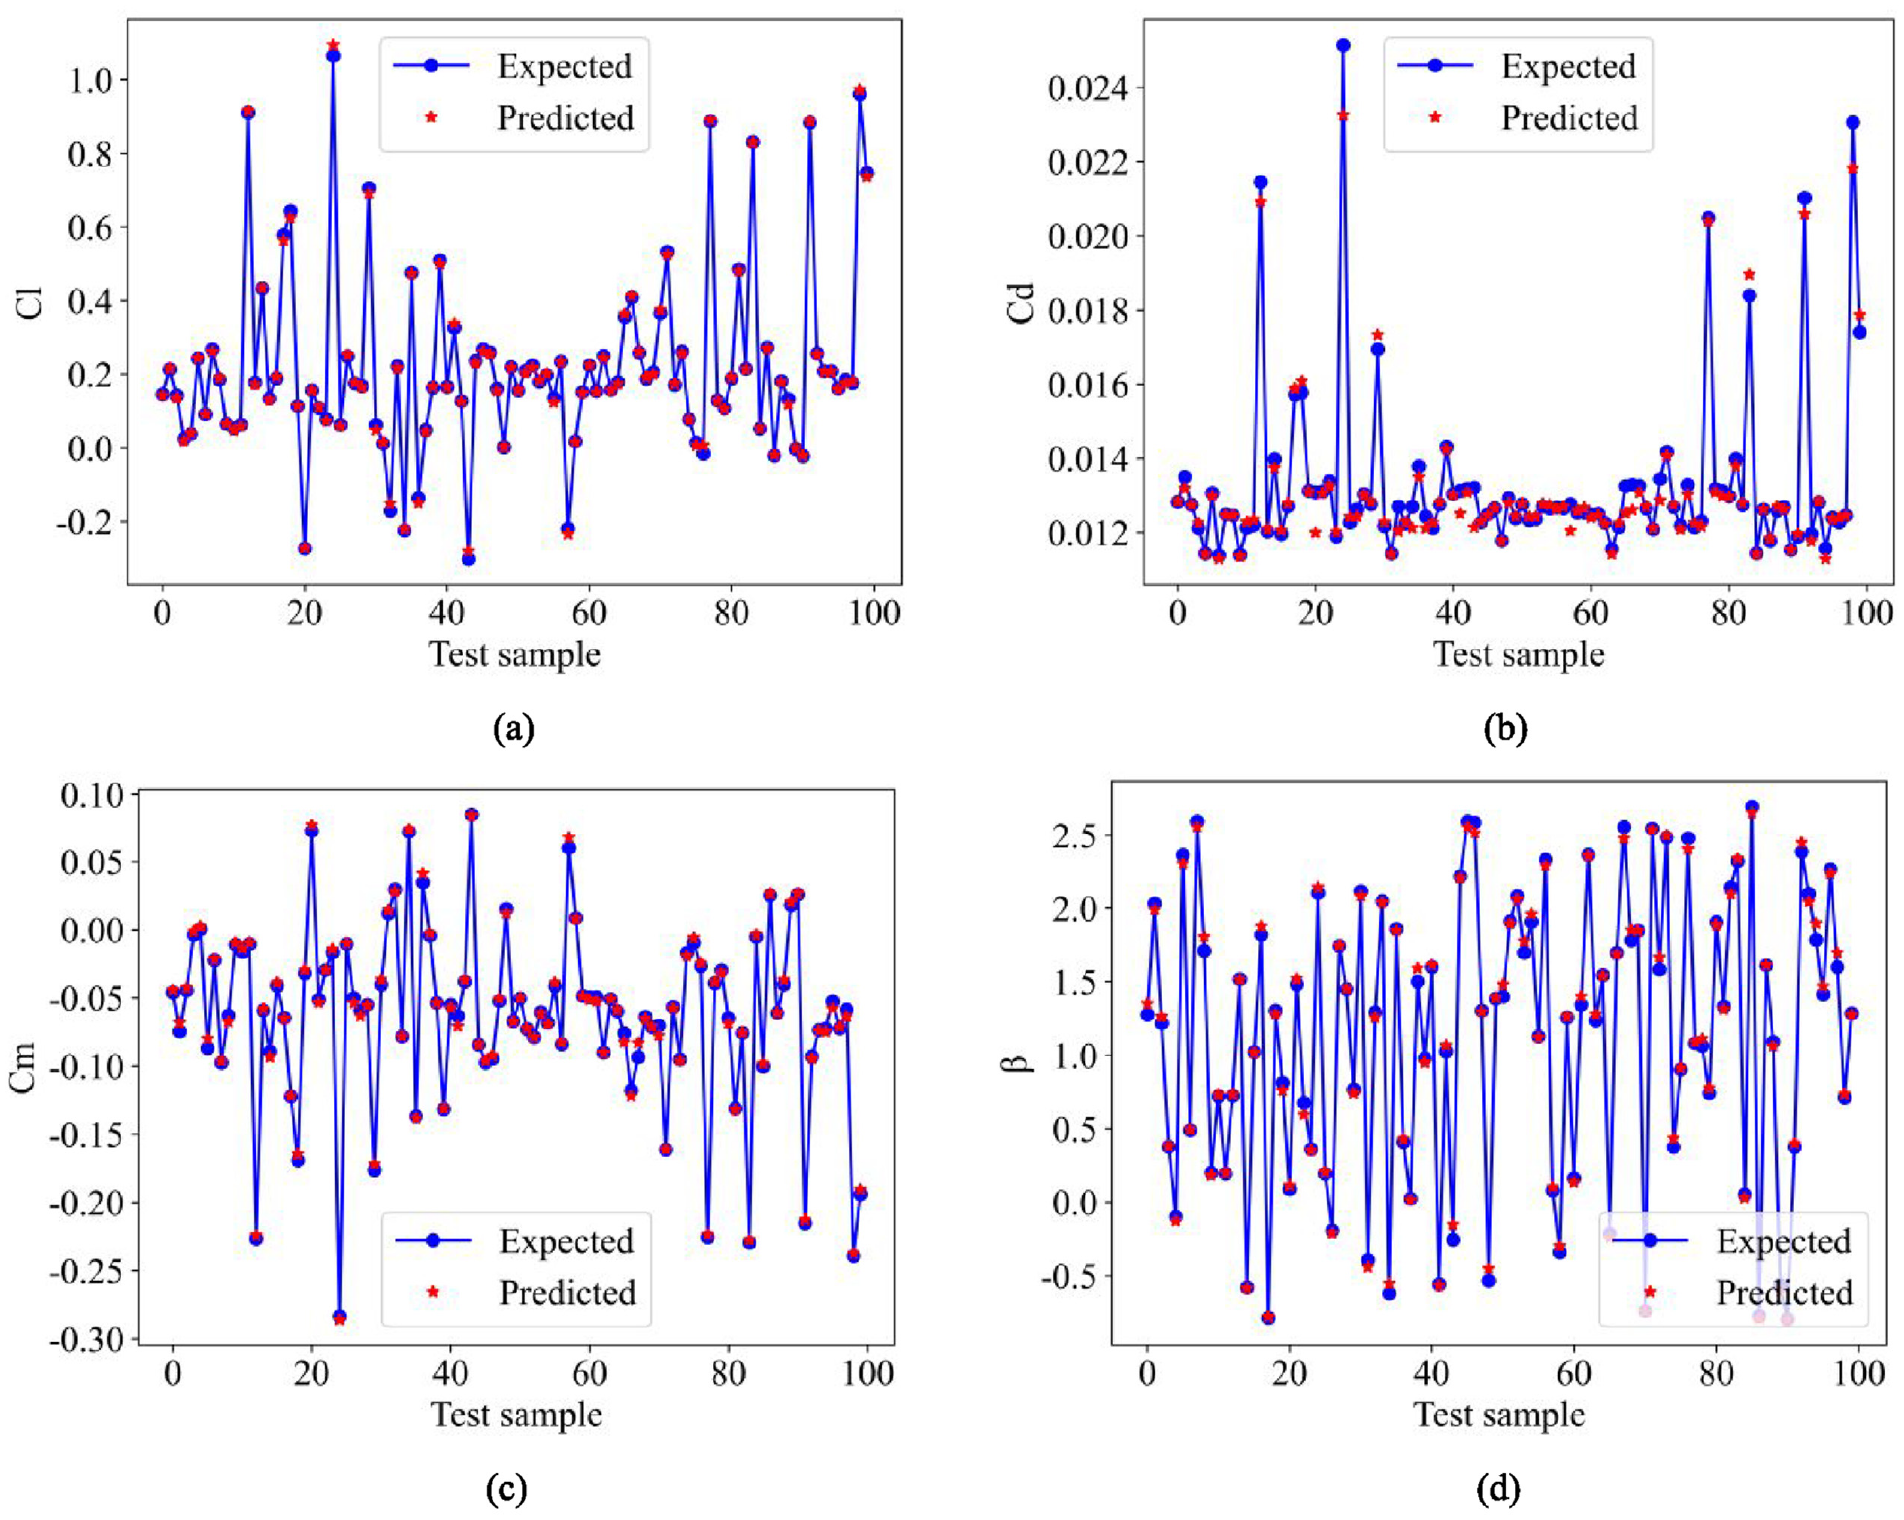
(a) Predicted and expected Cl, (b) predicted and expected Cd, (c) predicted and expected Cm, (d) predicted and expected β.
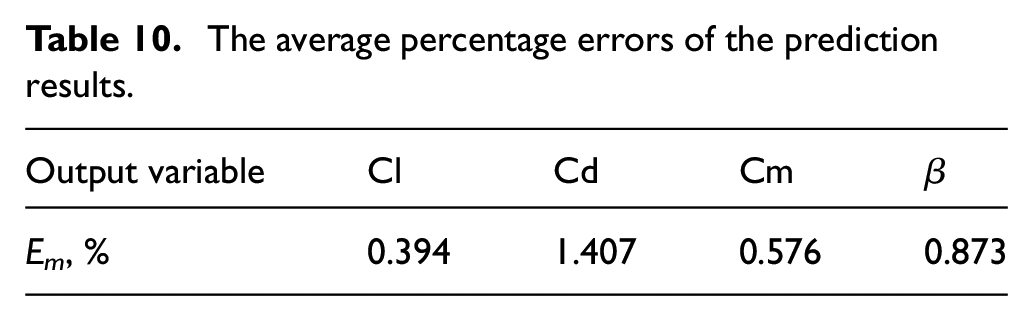
It can be observed that the predicted values for the 100 data samples are close to the expected values, achieving a good predictive effect. The percentage error E and its average value Em of the prediction results are shown in Figure 19 and Table 10, respectively. The overall test errors for each data sample are relatively stable, with most errors below 5%, and the average percentage errors for the four output variables are all within 2%. The prediction results are excellent. Therefore, it can be seen that the BP Neural Network model established in this paper has high accuracy and credibility in predicting the results of planar aerodynamic analysis model of airfoil with the trailing-edge flap.
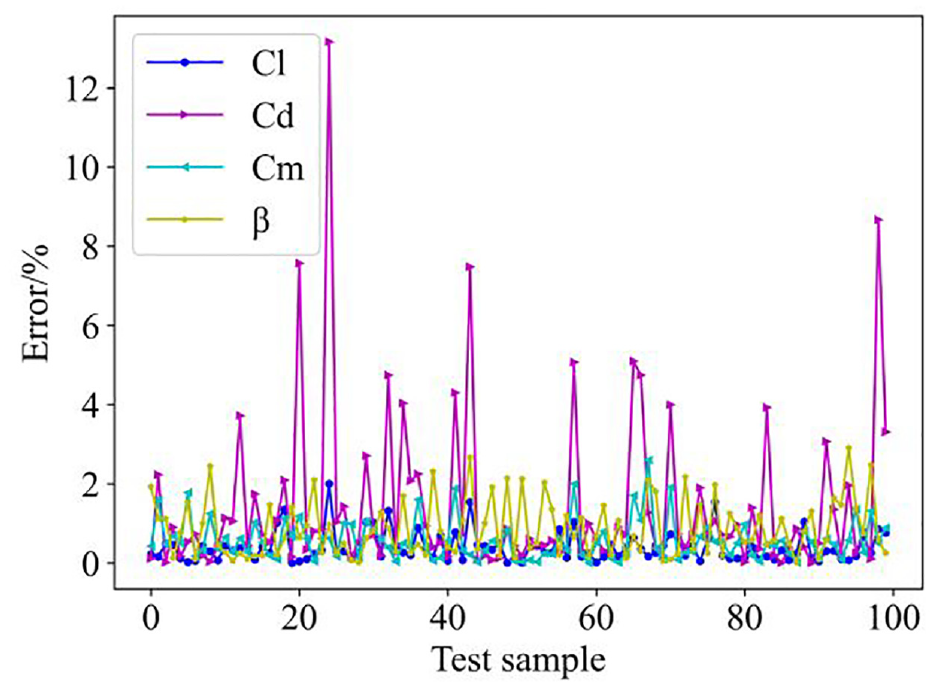
The percentage errors distribution of the prediction results.
The average percentage errors of the prediction results.
4.3.2. Feature importance analysis of BP neural network model
Feature importance analysis is an important step in Neural Network algorithms aiming to evaluate the contribution of individual feature to the prediction of model outcomes. Understanding feature importance can help improve the interpretability of model and provide basis for feature selection and model optimization (Liang et al., 2022; Zhang et al., 2022). The principle and process of feature importance analysis begin with calculating the baseline MSE of the BP Neural Network model on the original test dataset for each output variable. Then, each input feature’s values are randomly shuffled one by one and the corresponding MSE after shuffling is calculated. The importance of a feature is determined by the difference between the baseline MSE and the shuffled MSE. The larger the difference, the more pronounced the decline in predictive performance, indicating a greater influence of the feature.
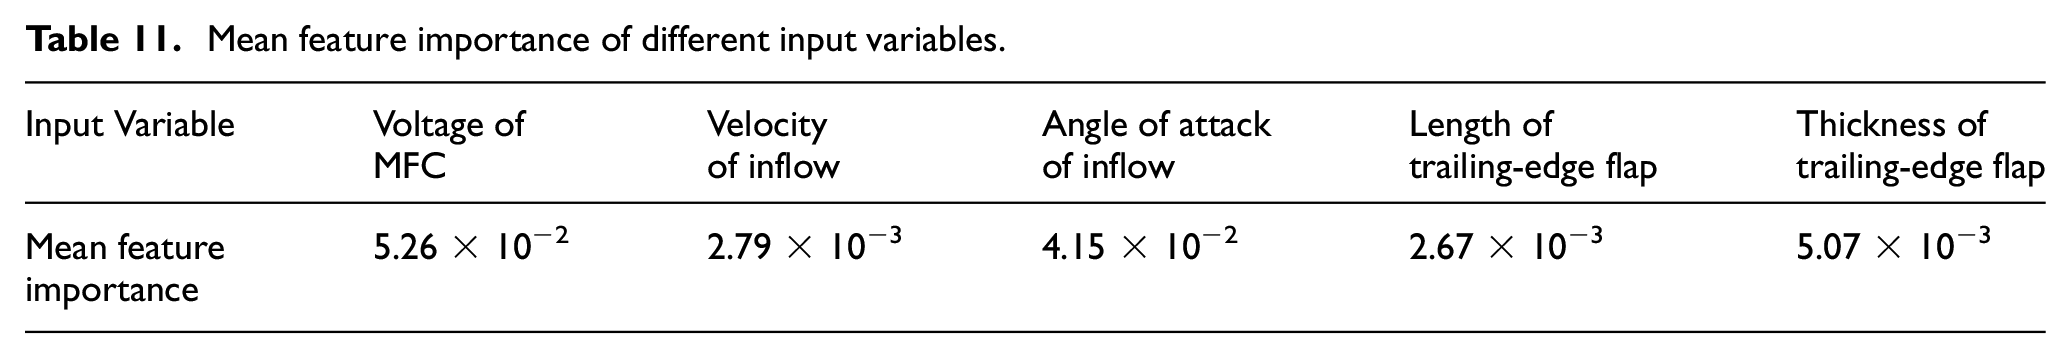
Based on the feature importance calculation of 100 normalized test samples above, the importance of five input features in the BP Neural Network model for different output variables and the mean importance are shown in Figure 20 and Table 11, respectively. The results show that among the five input features, the angle of attack of inflow has the greatest influence on the prediction results of Cl, Cd, and Cm, followed by the voltage of MFC. In contrast, for the output variable of deflection angle of the trailing-edge flap β, the importance of the MFC voltage far exceeds that of the other features. Additionally, the thickness and length of the trailing-edge flap have only a limited impact on β compared to other output variables, with the importance of thickness being slightly greater than that of length. After averaging the impact of each input feature on all output variables, the mean feature importance is obtained. Overall, the voltage of MFC and the angle of attack of inflow have a significant influence on the prediction results of the BP Neural Network model, each with its own primary area of impact.
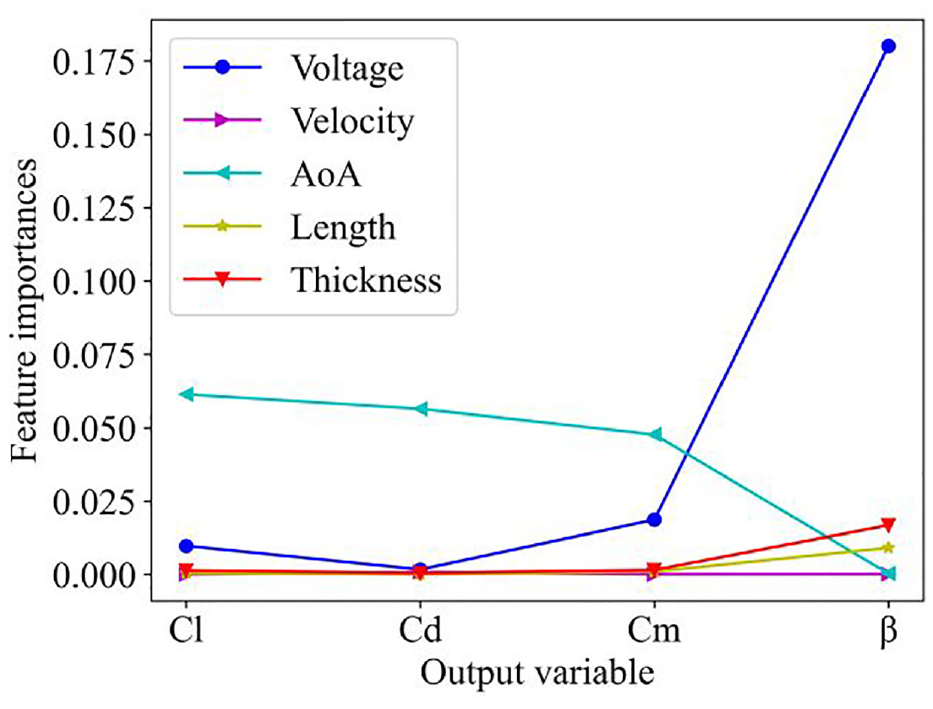
Feature importances of the BP neural network.
Mean feature importance of different input variables.
5. Conclusion
This paper applies MFC to the ACF technology of helicopter rotor blade. The geometry and structure of composite rotor blade with the trailing-edge flap is designed based on MFC. According to the established 3D finite element model, the real rotor blade is manufactured to test and validate the deflection deformation of the trailing-edge flap under different voltage excitations. For the planar aerodynamic analysis model, a fluid-structure coupling method is employed to calculate deflection displacement of the trailing-edge flap actuated by MFC under various operating conditions and its impact on the aerodynamic characteristics of the airfoil. Finally, a BP Neural Network model is established to predict and analyze the results of aforementioned planar aerodynamic model. The conclusions drawn are as follows:
The experiment and simulation results of rotor blade with the trailing-edge flap show good consistency and prove the capability of MFC to actively actuate the deflection deformation of the trailing-edge flap.
In the helicopter operating state, active deflection of the trailing-edge flap actuated by MFC can significantly alter the aerodynamic lift and pitching moment of the airfoil with minimal impact on drag. This indicates that the trailing-edge flap has great potential in adjusting the aerodynamic load distribution on rotor blade surface and achieving helicopter rotor vibration and noise suppression.
The training and testing results of the established BP Neural Network show that it has sufficient accuracy and reliability in predicting the results of planar aerodynamic model. The two input features of voltage of MFC and angle of attack of inflow have great influence on the prediction results of the BP Neural Network, which are obtained from the feature importance analysis. This prediction method can obtain deflection angles of the trailing-edge flap and aerodynamic coefficients of the airfoil under arbitrary conditions which provide theoretical guidance for the application of the trailing-edge flap in helicopter rotor vibration and noise reduction.
Footnotes
Appendix
Declaration of conflicting interests
The authors declared no potential conflicts of interest with respect to the research, authorship, and/or publication of this article.
Funding
The authors disclosed receipt of the following financial support for the research, authorship, and/or publication of this article: This research was supported by the National Key Research and Development Program of China (No. 2021YFB3400100).
Data Availability Statement
Data sharing not applicable to this article as no datasets were generated or analyzed during the current study.