
Abstract
Cyclic super elasticity in shape memory alloys (SMAs) is governed by complex transformation mechanisms that evolve under repeated loading, yet these stabilization effects remain insufficiently resolved at the full-field scale. This work presents an experimental investigation of the cyclic superelastic response of Nitinol subjected to 77 loading cycles, with particular emphasis on the progression of stress-induced martensitic transformation. High-resolution digital image correlation (DIC) was employed to capture in-situ strain localization and the corresponding evolution of transformation morphology. The full-field measurements reveal distinct changes in transformation band formation, propagation, and recovery as cyclic stabilization develops. Local strain evolution was further analyzed to elucidate micromechanical deformation pathways that influence functional fatigue behavior. The results provide new insight into the spatially heterogeneous deformation characteristics of Nitinol under cyclic superelastic loading, offering experimentally grounded evidence critical for advancing intelligent material systems and their reliability in repetitive actuation or structural applications.
Keywords
Introduction
Shape memory alloys (SMAs), particularly near-equiatomic NiTi (Nitinol), exhibit unique superelastic (SE) behavior arising from stress-induced martensitic transformation and full strain recovery upon unloading (Eggeler et al., 2004). This reversible phase transformation enables large recoverable strains and high energy dissipation, making SMAs attractive for applications in biomedical devices (Bouchareb et al., 2026), aerospace systems (Hartl and Lagoudas, 2007), and adaptive mechanical structures (Engeberg et al., 2015; Joula et al., 2022; Lin et al., 2020; Rodinò and Maletta, 2024), where components are frequently subjected to cyclic loading.
In many superelastic NiTi forms and geometries, the macroscopic stress plateau does not reflect homogeneous deformation; instead, the stress-induced martensitic transformation proceeds through localized transformation strain bands (also described as Lüders-like bands or mobile phase-transformation fronts) that nucleate and propagate across the gage section. Classic full-field experiments established that these fronts separate coexisting austenite and martensite domains and can be tracked kinematically during loading and unloading, with strong thermomechanical coupling due to latent heat release/absorption and rate sensitivity (Shaw and Kyriakides, 1995). More recent grain-resolved synchrotron measurements further show that the propagating front is accompanied by pronounced internal stress/strain gradients at the grain scale, implying that front locations are natural sites for damage accumulation and reliability concerns during repeated cycling (Sedmák et al., 2016).
Under repeated mechanical cycling, however, the superelastic response of SMAs evolves progressively. Experimental studies have reported stabilization of transformation stresses (Zhang et al., 2017), reduction in hysteresis (Xue et al., 2024), and the development of strain localization patterns (Xiao and Jiang, 2022). These macroscopic changes are associated with underlying microstructural mechanisms, including dislocation accumulation, retained martensite, and internal stress redistribution (Chen et al., 2025a). Such cyclic effects influence functional fatigue behavior and long-term performance, which are critical considerations in practical applications involving repeated actuation or loading (Nargatti and Ahankari, 2022; Sidharth et al., 2022; Song et al., 2025).
Critically, the transformation-band mechanism itself can evolve during cyclic superelastic loading. For example, pseudo elastic cycling has been reported to drive a transition from strongly localized Lüders-like transformation to more diffuse/homogeneous transformation, correlating this change with evolving defect structures such as dislocation density and changes in nucleation energetics (Lanba and Hamilton, 2015; Shariat et al., 2022). These observations motivate datasets that are simultaneously (i) long-horizon in cycle count, (ii) spatially resolved (full-field), and (iii) directly comparable to manufacturing and processing variables that alter defect density, texture, and surface integrity (Shuai and Xiao, 2020).
Although the monotonic superelastic response of Nitinol has been extensively characterized, detailed experimental investigations of its cyclic behavior, particularly with full-field strain measurements, remain comparatively limited (Li et al., 2024; Chen et al., 2025b). Recent studies have advanced the understanding of cyclic super elasticity in NiTi, particularly in nanocrystalline materials, by highlighting degradation mechanisms associated with retained martensite, plastic deformation, and evolving transformation patterns during repeated loading (Xiao et al., 2024; Zhao et al., 2023a, 2023b). Additionally, full-field techniques have provided valuable insight into the superelastic response of Nitinol, including cycle-resolved observations during repeated loading (Xiao and Jiang, 2020). The evolution of transformation-band patterns over extended cycling and their connection to the eventual fracture location remain of particular interest.
In this study, the cyclic superelastic response of Nitinol was experimentally investigated over 76 loading cycles, with the 77th leading to fracture. Digital image correlation (DIC) was employed to capture full-field strain evolution (Dilibal, 2013; Dilibal et al., 2017) and to characterize the morphology of stress-induced martensitic transformation during cycling. Local strain evolution was analyzed to provide insight into the micromechanical response and transformation band development under repeated loading. The results contribute to a more comprehensive understanding of the cyclic superelastic behavior of Nitinol and its implications for durability in applications involving repeated mechanical actuation.
Materials and methods
A commercially available superelastic Nitinol foil was used with a nominal thickness of 0.05 mm in the experimental study. It was purchased from Thermo Fisher with Ni content of 55.8 wt %. Dog-bone tensile specimens were fabricated from the foil via precision pulsed laser cutting. The specimen geometry was designed to promote uniform stress distribution within the gage section during tensile loading. The detailed dimensions are provided in Figure 1(a). Laser cutting enabled accurate dimensional control while minimizing edge distortion. Pulsed lasers reduce thermal effects and produce precise geometries, with the goal of not influencing the underlying transformation behavior (Lanba et al., 2025).
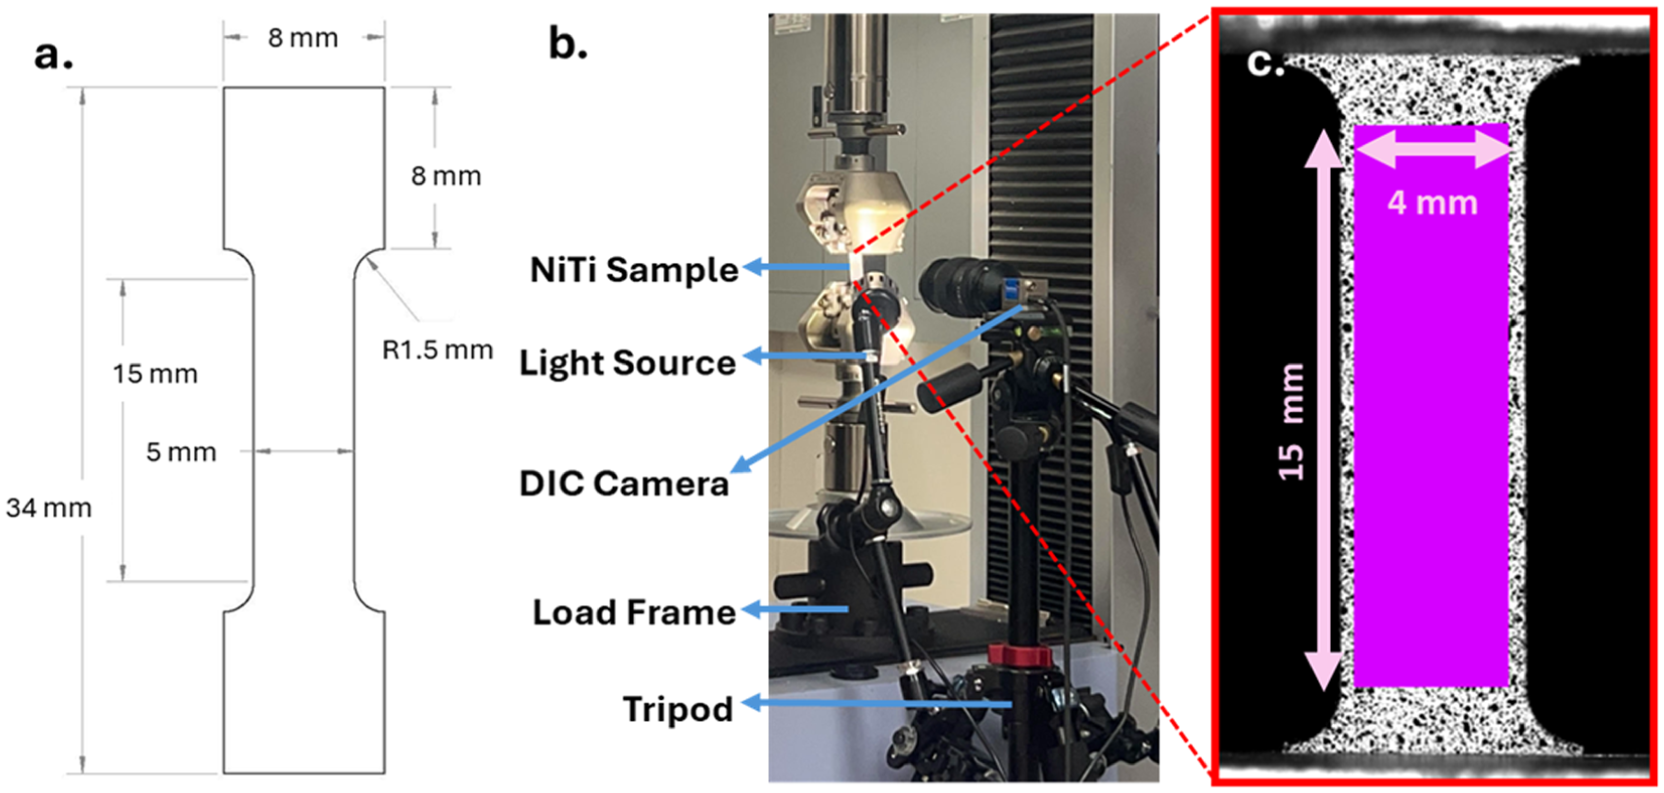
Dimensions of dog-bone tensile sample in (a) the samples were 0.05 mm thick. The experimental setup for the testing is shown in (b). The area-of-interest (AOI) dimensions for DIC are shown in (c).
The prepared specimens were subjected to cyclic uniaxial tensile loading under displacement control to characterize their superelastic response. All experiments were conducted in laboratory ambient conditions. To enable accurate digital image correlation measurements, a high-contrast speckle pattern was applied to the specimen surface. The pattern was created by airbrushing a thin white background layer, followed by randomly spraying black paint speckles to ensure optimal feature tracking in Vic-2D. The speckle size and distribution were optimized to balance spatial resolution and displacement tracking accuracy.
The cyclic superelastic response of the specimens was tested using a servo-hydraulic uniaxial tensile testing machine equipped with a 5 kN load cell. The tests were performed at room temperature to minimize temperature-induced variations in the material response. The loading and unloading were conducted in displacement control mode at a strain rate of 10−3 s−1 to ensure stable stress-induced martensitic transformation. The specimens were subjected to 77 loading cycles with a maximum applied strain of 6%, which is within the stable superelastic range of Nitinol.
A Vic-2D (Correlated Solutions, Inc.) system was used to capture full-field strain maps during the cyclic loading tests. The DIC system consisted of a high-resolution monochrome CCD camera (5 MP) and an LED illumination source to ensure uniform lighting and high contrast for image processing. The camera was mounted on a stable optical setup to minimize vibrations, and its position was adjusted to achieve an optimal field of view covering the gage length of the specimen. Figure 1(b) shows this experimental setup. Figure 1(c) shows the tensile sample loaded with the area-of-interest (AOI) dimensions.
Digital image correlation procedures for SMAs require particular care because deformation may localize strongly into narrow transformation bands, and because apparent residual strain can include both measurement noise and true non-recoverable strain mechanisms. Accordingly, we selected imaging and correlation parameters to resolve high gradients in the axial strain field while maintaining robust correlation through repeated cycling, consistent with prior SMA-focused DIC guidance and broader high-resolution DIC practice for strain localization (Reedlunn et al., 2013).
A 12.3 megapixel CCD camera equipped with a Sony IMX253 global shutter sensor (Pregius series, 3.4 µm × 3.4 µm pixel size, monochrome) was used for image acquisition. The frame rate for image capture was matched to the mechanical data acquisition rate at 4 Hz. Images were captured at 4112 × 3008 resolution and synchronized with mechanical and temperature data. The images were processed using Vic-2D software, where the subset size (51 pixels) and step size (7 pixels) were carefully selected to balance spatial resolution and computational efficiency. The strain fields were computed by tracking the deformation of the speckle pattern, and strain evolution was analyzed over multiple cycles to study the stabilization effects in Nitinol.
The extracted strain fields were post-processed to compare experimental and numerical results. The full-field strain maps were analyzed at different stages of loading cycles to investigate localized transformation and strain heterogeneity. The evolution of maximum principal strain, equivalent strain, and transformation band propagation were evaluated. Additionally, strain profiles along predefined cross-sections of the specimen were extracted to study strain localization effects over multiple cycles. During post-processing, the strain velocities were calculated within the Vic-2D software by correlating the exact time stamps of image acquisition to the processed strain fields.
Experimental results
The cyclic superelastic response of the Nitinol specimen was evaluated over 76 full loading–unloading cycles, with failure occurring at the onset of Cycle 77. The axial strain was extracted from a defined area of interest (AOI) within the gage section (area ≈ 60.59 mm2; 14.9 mm × 4.06 mm) using DIC. Representative stress–strain curves from selected cycles (1, 10, 20, 30, 40, 50, 60, 70, 76 and 77) are shown in Figure 2.
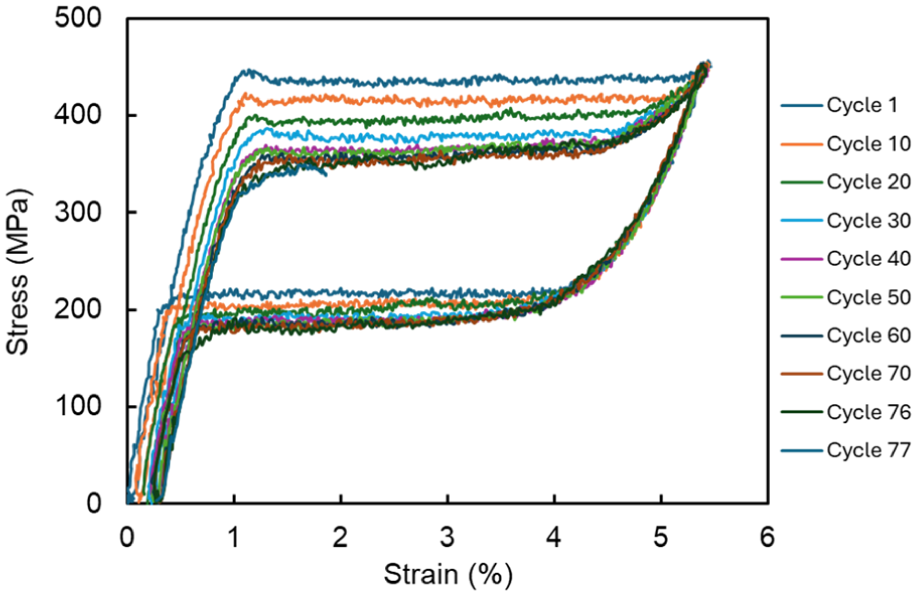
Evolution of the superelastic stress–strain response of NiTi during cyclic tensile testing.
Cycle 1 exhibited the characteristic superelastic response of Nitinol, consisting of an initial linear elastic region corresponding to austenite deformation, followed by a distinct forward transformation plateau associated with stress-induced martensitic transformation. Upon unloading, a lower reverse transformation plateau was observed, resulting in a pronounced hysteresis loop and near-complete strain recovery.
With increasing cycle number, a progressive evolution of the mechanical response was observed. The forward transformation plateau stress decreased significantly during the first several cycles and gradually approached a stabilized value by approximately Cycle 40–50. A similar reduction was observed in the reverse transformation stress. This reduction in transformation stresses is indicative of cyclic stabilization, commonly attributed to internal stress redistribution and microstructural changes such as dislocation accumulation and retained martensite.
In addition to the shift in plateau stress, the hysteresis loop area progressively decreased with cycling, reflecting reduced energy dissipation per cycle. After approximately Cycle 50, the stress–strain response showed minimal additional changes, suggesting that a stabilized cyclic regime had been reached.
Full-field DIC measurements revealed that deformation during the transformation plateau was highly localized within the gage section. The forward transformation occurred through the nucleation and propagation of diagonal transformation bands. With continued cycling, the spatial pattern of these bands became increasingly repeatable, consistent with the observed macroscopic stabilization. The specimen completed 76 full superelastic cycles before failure occurred at the beginning of Cycle 77. Failure initiated in the lower-left region of the gage section, where strain localization was most pronounced. The localized accumulation of transformation-induced strain likely contributed to damage evolution and eventual fracture. The inclined high-strain regions correspond to localized transformation strain bands associated with nucleation and propagation of an austenite→martensite front, consistent with classical front-propagation observations in NiTi. The emergence of repeatable band trajectories with increasing cycles is therefore interpreted as stabilization of front kinematics rather than simply “more repeatable strain maps.”
The experimental results clearly demonstrate that the macroscopic stress plateaus observed during both forward and reverse transformation are directly associated with the nucleation and propagation of localized martensitic transformation bands within the gage section. Full-field DIC measurements provide direct visualization of this localized behavior, revealing distinct diagonal transformation bands that initiate, propagate, and retract during loading and unloading. The repeatable morphology and propagation paths observed by cycle 50 indicate that the transformation process becomes spatially and mechanically stabilized under cyclic loading. These findings confirm that cyclic super elasticity in Nitinol is governed by highly localized phase transformation mechanisms whose evolution and stabilization control the macroscopic mechanical response.
Figure 3 shows the stress–strain response of the 1st, 10th, 40th, 70th, 76th and 77th loading cycle with corresponding DIC strain maps (E1–E9). These points were selected to correspond to comparable locations along the forward and reverse transformation plateaus in each cycle. The maps show that the macroscopic plateaus arise from localized diagonal transformation fronts rather than homogeneous deformation. In the early cycles the fronts are sharp and strongly localized, whereas by Cycles 40–76 the band trajectories become more repeatable but their boundaries become broader and more diffuse.
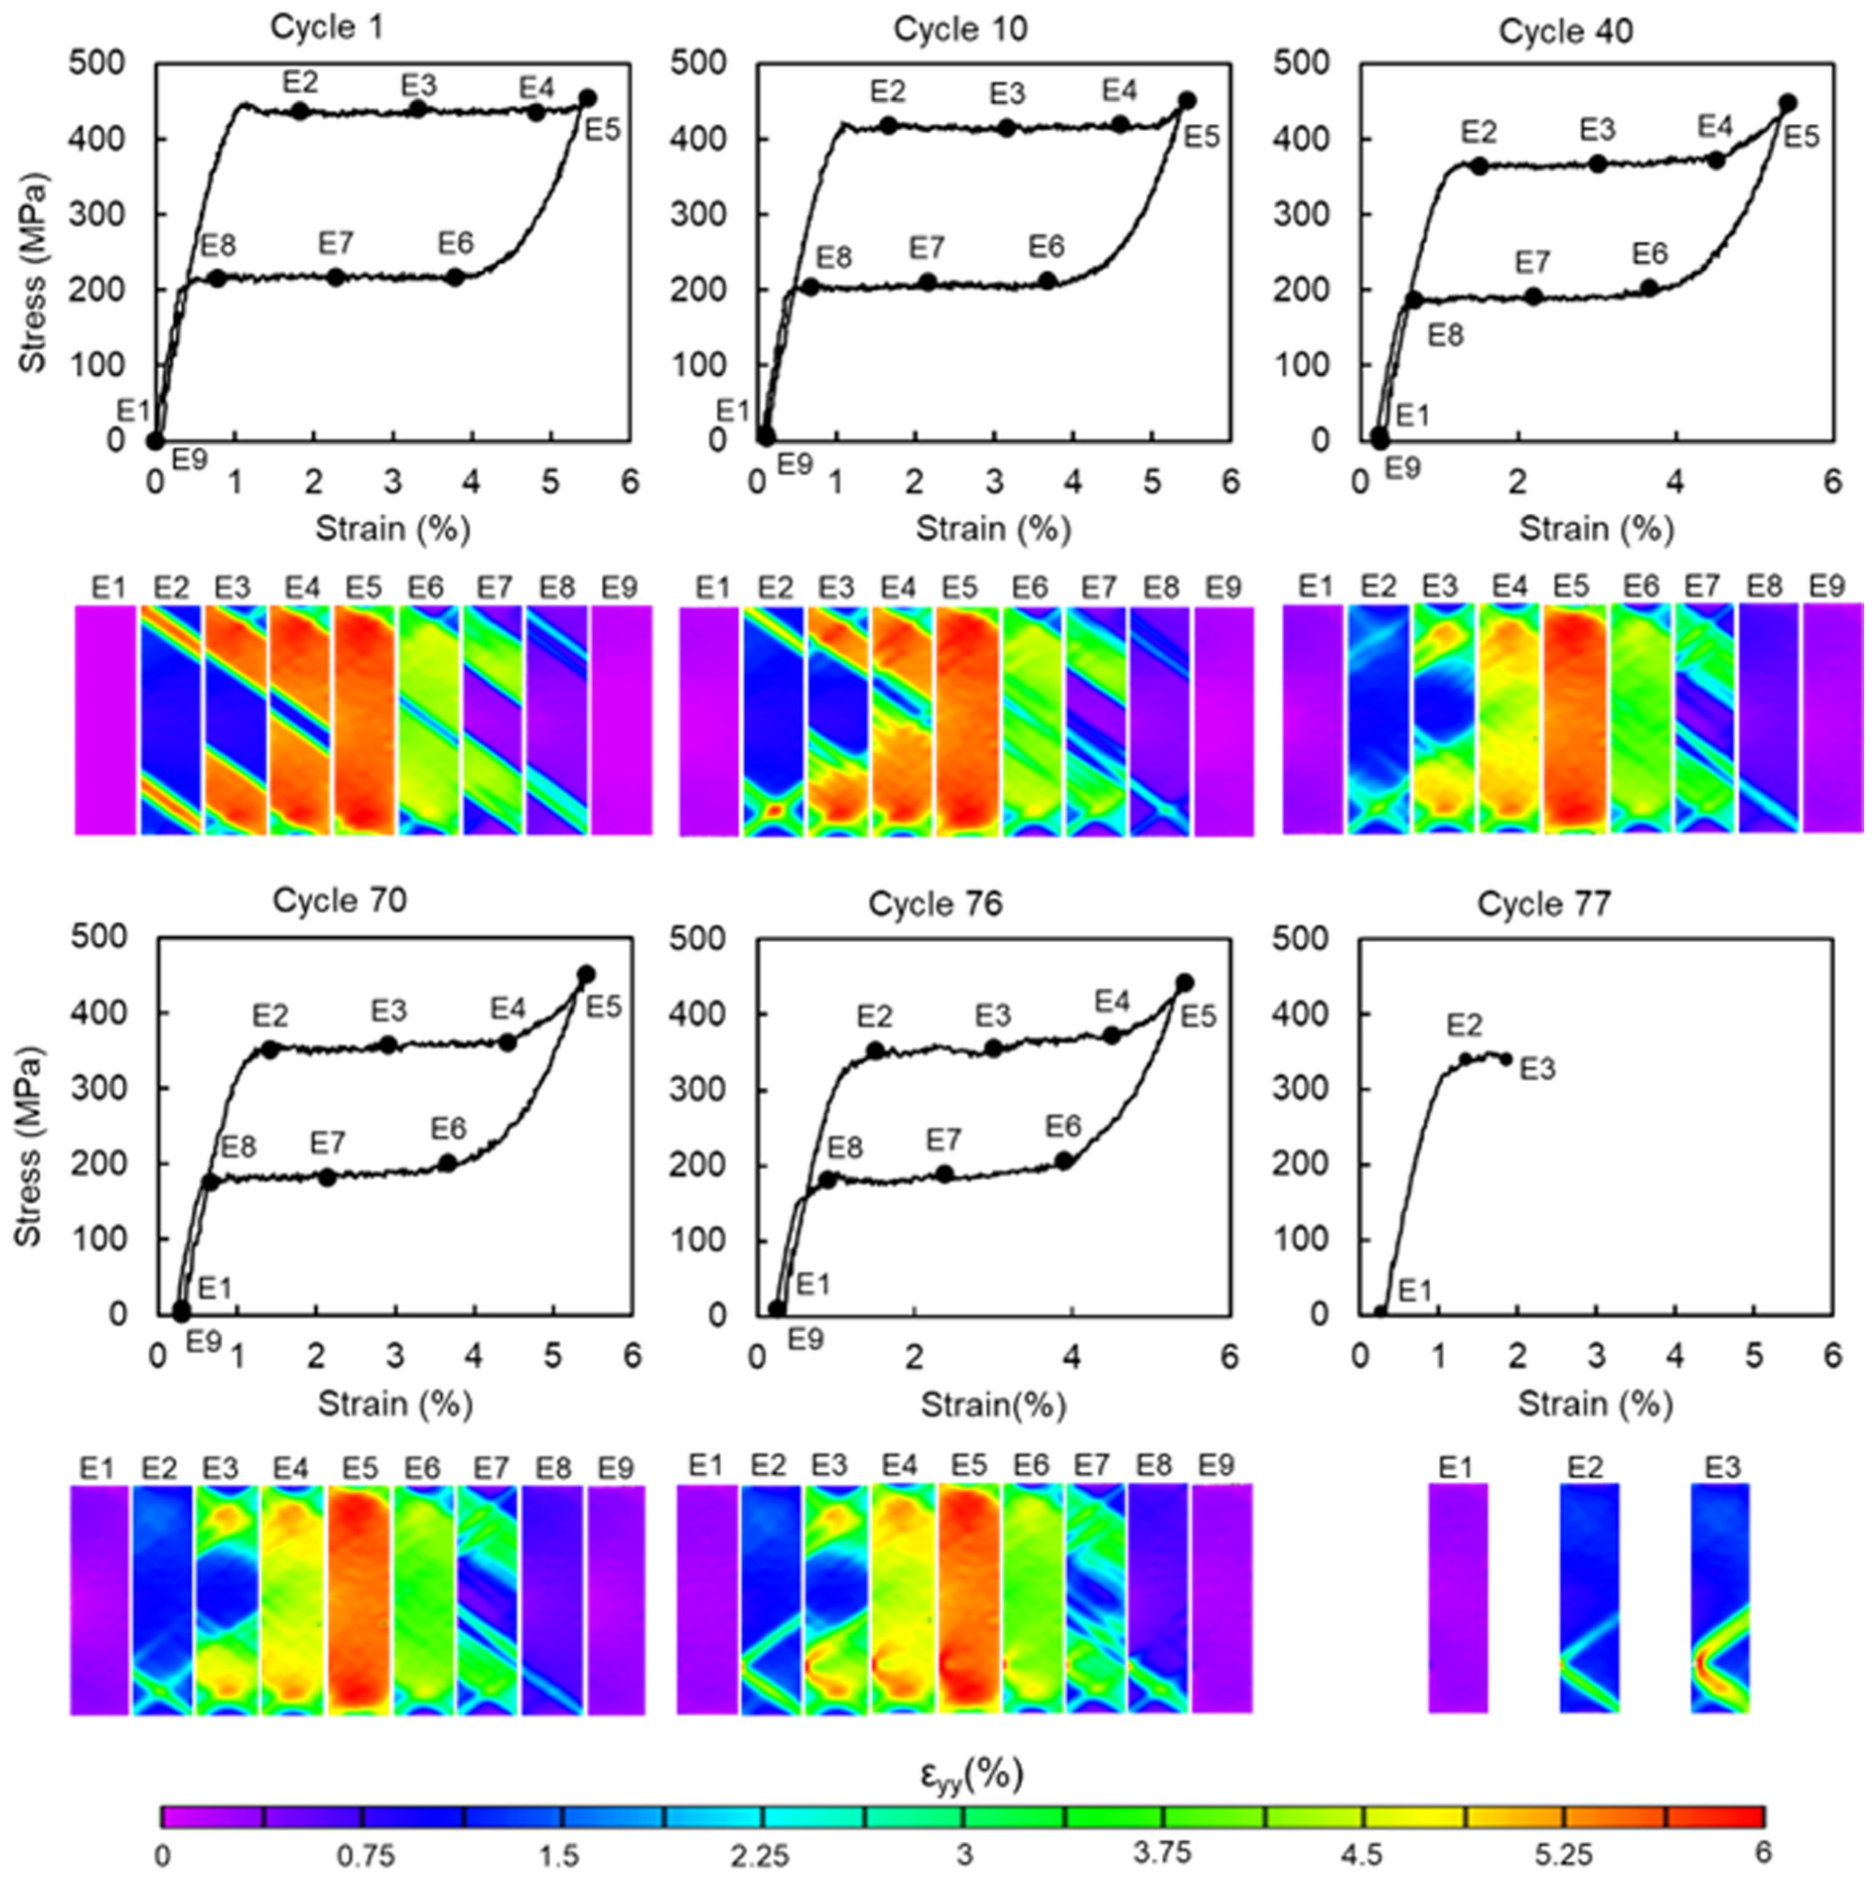
Stress–strain curve and corresponding DIC strain maps at selected points for the 1st, 10th, 40th, 70th, 76th, and 77th cycles.
Over the first several cycles, the material exhibited progressive cyclic evolution characterized by a reduction in forward and reverse transformation stresses and a gradual decrease in hysteresis. Looking at the strain fields, it is evident that there are more band off-shoots that begin to occur across the gage section, and the boundaries of the stress-induced transformation bands are beginning to become more diffuse.
The DIC axial strain (εyy) maps for the 40th and 70th cycles are, representative of the stabilized superelastic behavior reached after repeated loading. By approximately 40 cycles, the response had largely stabilized, and minimal additional changes were observed up to the 70th cycle. In the 70th cycle, the loading curve shows a well-defined forward transformation plateau at a nearly constant stress level, indicating stable stress-induced martensitic transformation. The DIC maps (E2–E4) reveal the nucleation and propagation of diagonal transformation bands across the gage section during this plateau. As loading progresses to E5, the strain distribution becomes nearly uniform (∼5.8%), consistent with a fully transformed martensitic state.
During unloading (E6–E8), the reverse transformation occurs at a lower, stabilized stress level. The strain maps demonstrate the retraction of the transformation bands and progressive reduction of localized strain. At E9, the strain field is again nearly uniform and close to zero, confirming substantial strain recovery. The 70th cycle illustrates that after extensive cycling, the superelastic response becomes mechanically and spatially stabilized. The transformation stresses, hysteresis width, and band morphology remain consistent, indicating that the cyclic superelastic behavior has reached a steady state prior to failure.
Figure 4 quantifies the strains across the stress-induced transformation bands by plotting the strain values across a 15 mm line that spans the length of the gage section in the middle for the 1st, 10th, 40th and 70th cycles. At the beginning of the forward transformation for point E2, there are two distinct and clearly defined strain bands that form at the top and bottom of the gage section for cycle 1, with peak values of 5.5% strain within the bands. As cyclic loading ensues, these peak values in the bands decrease as the transformation boundaries become diffuse. By the 70th cycle, the transformation band at the top of the gage section has not nucleated but has toward the bottom of the section. The peak strain value also decreases to just over 4%.
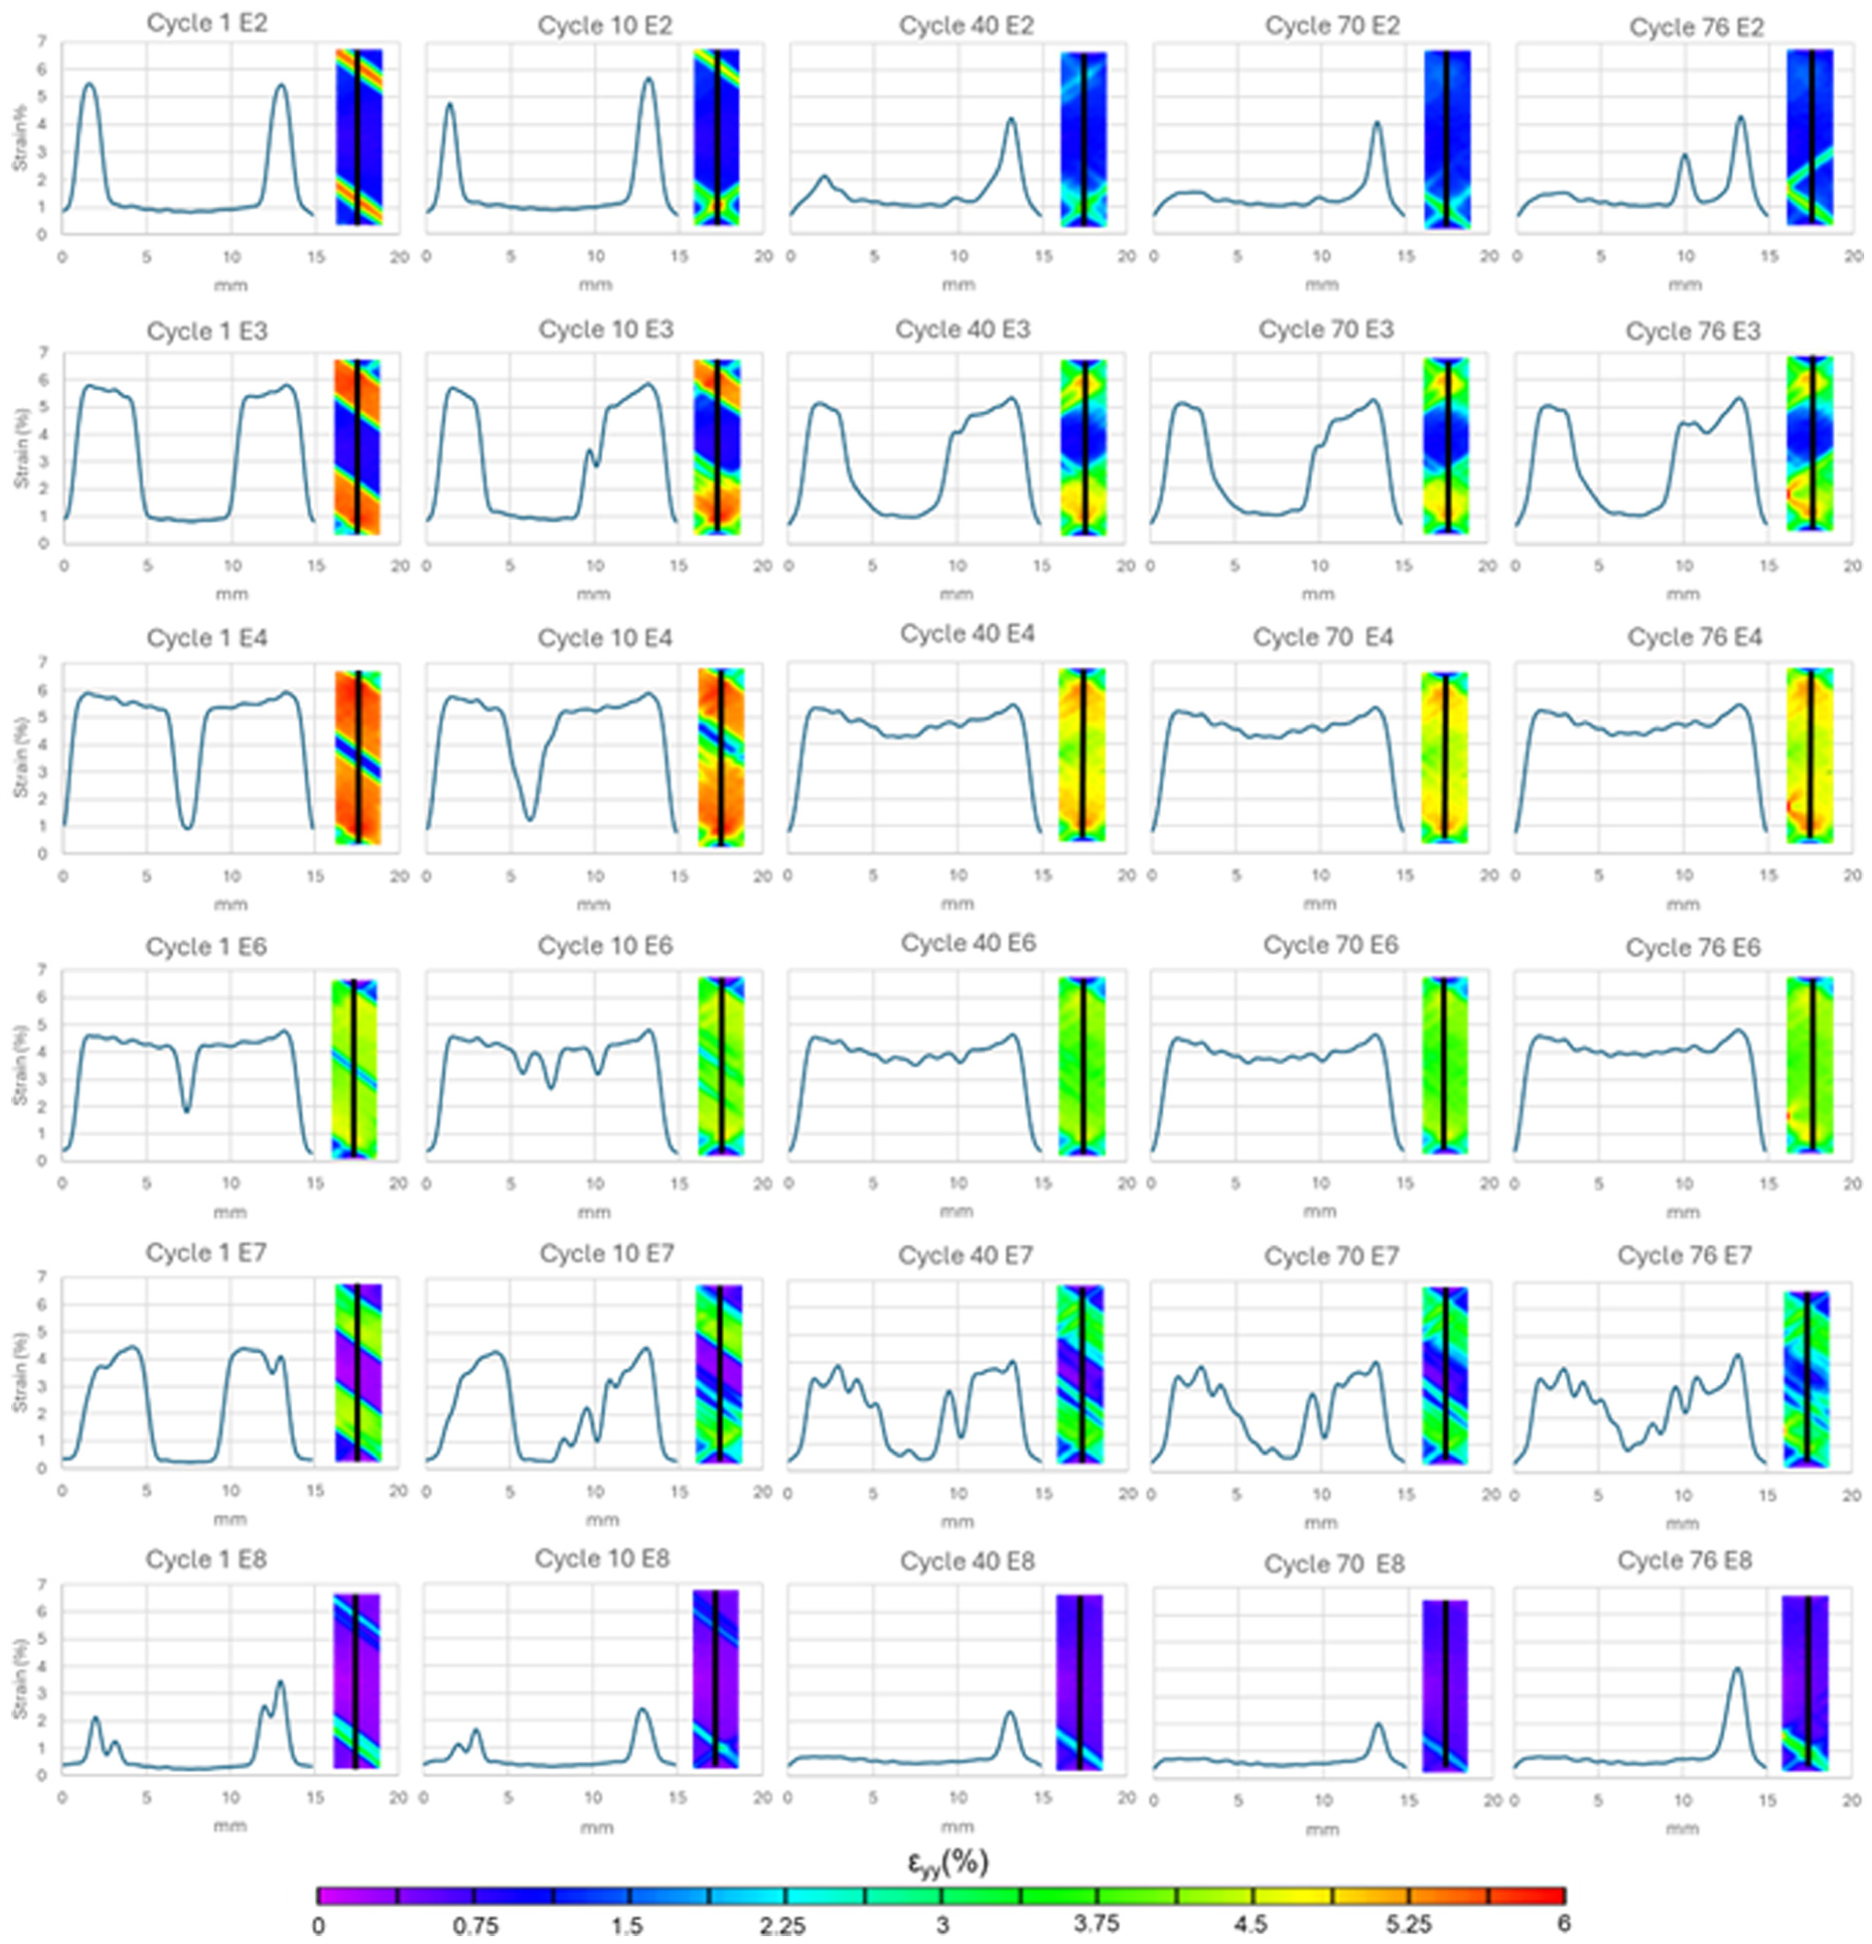
Quantification of strain along a vertical line in the middle of the gage section during the during the forward transformation (E2, E3 and E4 from Figure 3) and during the reverse transformation (E6, E7 and E8) from the 1st, 10th, 40th, 70th and 76th cycles.
At the middle of the forward plateau (E3), the Cycle 1 profile retains a strong two-level character, with highly transformed regions and comparatively low-strain regions separated by steep gradients; by Cycles 40–76, these gradients are reduced and the central low-strain region is partially filled in, indicating a more diffuse transformation front. E3 is a great image to quantify band heterogeneities with cycling, as two stress-induced transformation bands are consistently maintained during cycle. The bands become more diffuse, with both band boundaries in the gage section becoming more diffuse with non-linearly decreasing strains. This diffusing of the boundaries also results in ill-defined transformation band widths. What is clear is that untransformed elastically deformed austenite (blue areas or the sink in the strain-line graphs, maintain a strain of 1%, while the peak stress-induced detwinned martensite strains within the bands reduces from around 5.8% at Cycle 1 at a stable value of around 5.2% from around Cycle 40 onward.
Toward the end of the forward transformation (E4), the two sharp strain bands that formed during the first cycle have grown symmetrically, the large strain values within the bands slightly increased to 6% and maintaining sharp boundaries to untransformed material that has elastically deformed to approximately 1%. The initial cycling to cycle 10 shows that the boundaries for the transformed/untransformed material have grown to be a bit more diffuse while largely maintaining the peak strain values of the transformed material at around 6%. Upon further cycling, the diffuse nature of the transformation bands has increased while the peak transformation strains have decreased, indicating more homogeneous transformations taking place throughout the specimen.
At the beginning of the reverse transformation (E6), the strain along the virtual extensometer is still largely elevated (martensitic state), but the first cycle exhibits a distinct localized reduction in strain near the middle of the gage section: the profile is otherwise fairly uniform at roughly 4.5%–5%, but a sharp valley drops to approximately 2%, indicating an early, localized onset of reverse transformation. With continued cycling (Cycle 10), this single valley breaks into multiple smaller valleys, suggesting multiple reverse-transformation initiation sites along the line while maintaining similar peak strain levels. By Cycles 40 and 70, the strain profile becomes smoother and more broadly distributed, with the valley becoming shallower and the overall peak strain decreasing modestly (toward 4%–4.5%), consistent with a more diffuse, spatially distributed reverse transformation onset.
During the middle of the reverse transformation (E7), Cycle 1 displays a strongly heterogeneous profile characterized by two high-strain regions (approximately 4%–4.5%) separated by a near-zero/low-strain region through the middle of the gage section, indicating that a large portion of the specimen has already reverted while two localized martensitic regions persist. As cycling progresses (Cycle 10), the sharp transitions between high- and low-strain regions become less abrupt, and intermediate strain values appear across the central region, reflecting a more diffuse reverse transformation front. By Cycles 40 and 70, the peak strains in the remaining high-strain regions reduce (to roughly 3.5%–4%) and the central low-strain region increases slightly above zero, indicating that reverse transformation proceeds in a more homogenized manner with reduced localization intensity. Similar to E3, E7 is also a great point to compare reverse transformation strain bands.
Toward the end of the reverse transformation (E8) the strain along the line is largely recovered and close to zero across most of the gage section, but Cycle 1 still contains localized residual peaks; a smaller peak near the bottom portion of the line (on the order of 1%–2%) and a larger peak near the upper portion (reaching roughly 3.5%–4%), consistent with a “last-to-transform” region. With increasing cycles, these localized peaks decrease in magnitude and become more confined, and by Cycles 40 and 70 the profile is nearly flat at low strain with primarily a single remaining peak (dropping to roughly ∼2%–2.5% by Cycle 40 and ∼2% by Cycle 70). This trend indicates that late-stage reverse transformation becomes progressively less localized, and the remaining transformation strain concentrates into a smaller persistent region as the overall response stabilizes.
Figure 5 provides a statistical measure of strain heterogeneity within a persistent transformation region located in the lower portion of the gage section via a customized box-whisker plot, using the mean strain, mean ± standard error, and minimum-to-maximum strain range extracted from the boxed areas via Vic2D shown in the accompanying strain maps. The boxed area was picked because it consistently measures a stress-induced transformation strain band more closely. This figure directly quantifies the evolution of heterogeneity during both the middle of the forward transformation plateau (E3, blue) and the middle of the reverse transformation plateau (E7, red). During forward transformation, the mean local strain decreases from 5.3% in Cycle 1 to 4.47% in Cycle 76, a reduction of approximately 15%, indicating that the local transformation strain within this persistent hot-spot progressively weakens with cycling. At the same time, the minimum strain in the region increases from 1.57% to 2.38%, while the maximum strain remains near 5.3%–6.0%, showing that the local field evolves from a sharply partitioned transformed/untransformed state toward a more diffuse strain distribution. During the reverse transformation plateau, the mean local strain decreases from 3.5% in Cycle 1 to 3.2% in Cycle 76, a smaller reduction of approximately 8%, while the min-max span remains broad over the entire cycling history. This indicates that unloading also becomes less sharply localized but retains substantial spatial heterogeneity even near end-of-life. Importantly, the wide whisker range throughout the dataset shows that the transformation region never becomes homogeneous; instead, cyclic stabilization is accompanied by a redistribution of local strain contrast.
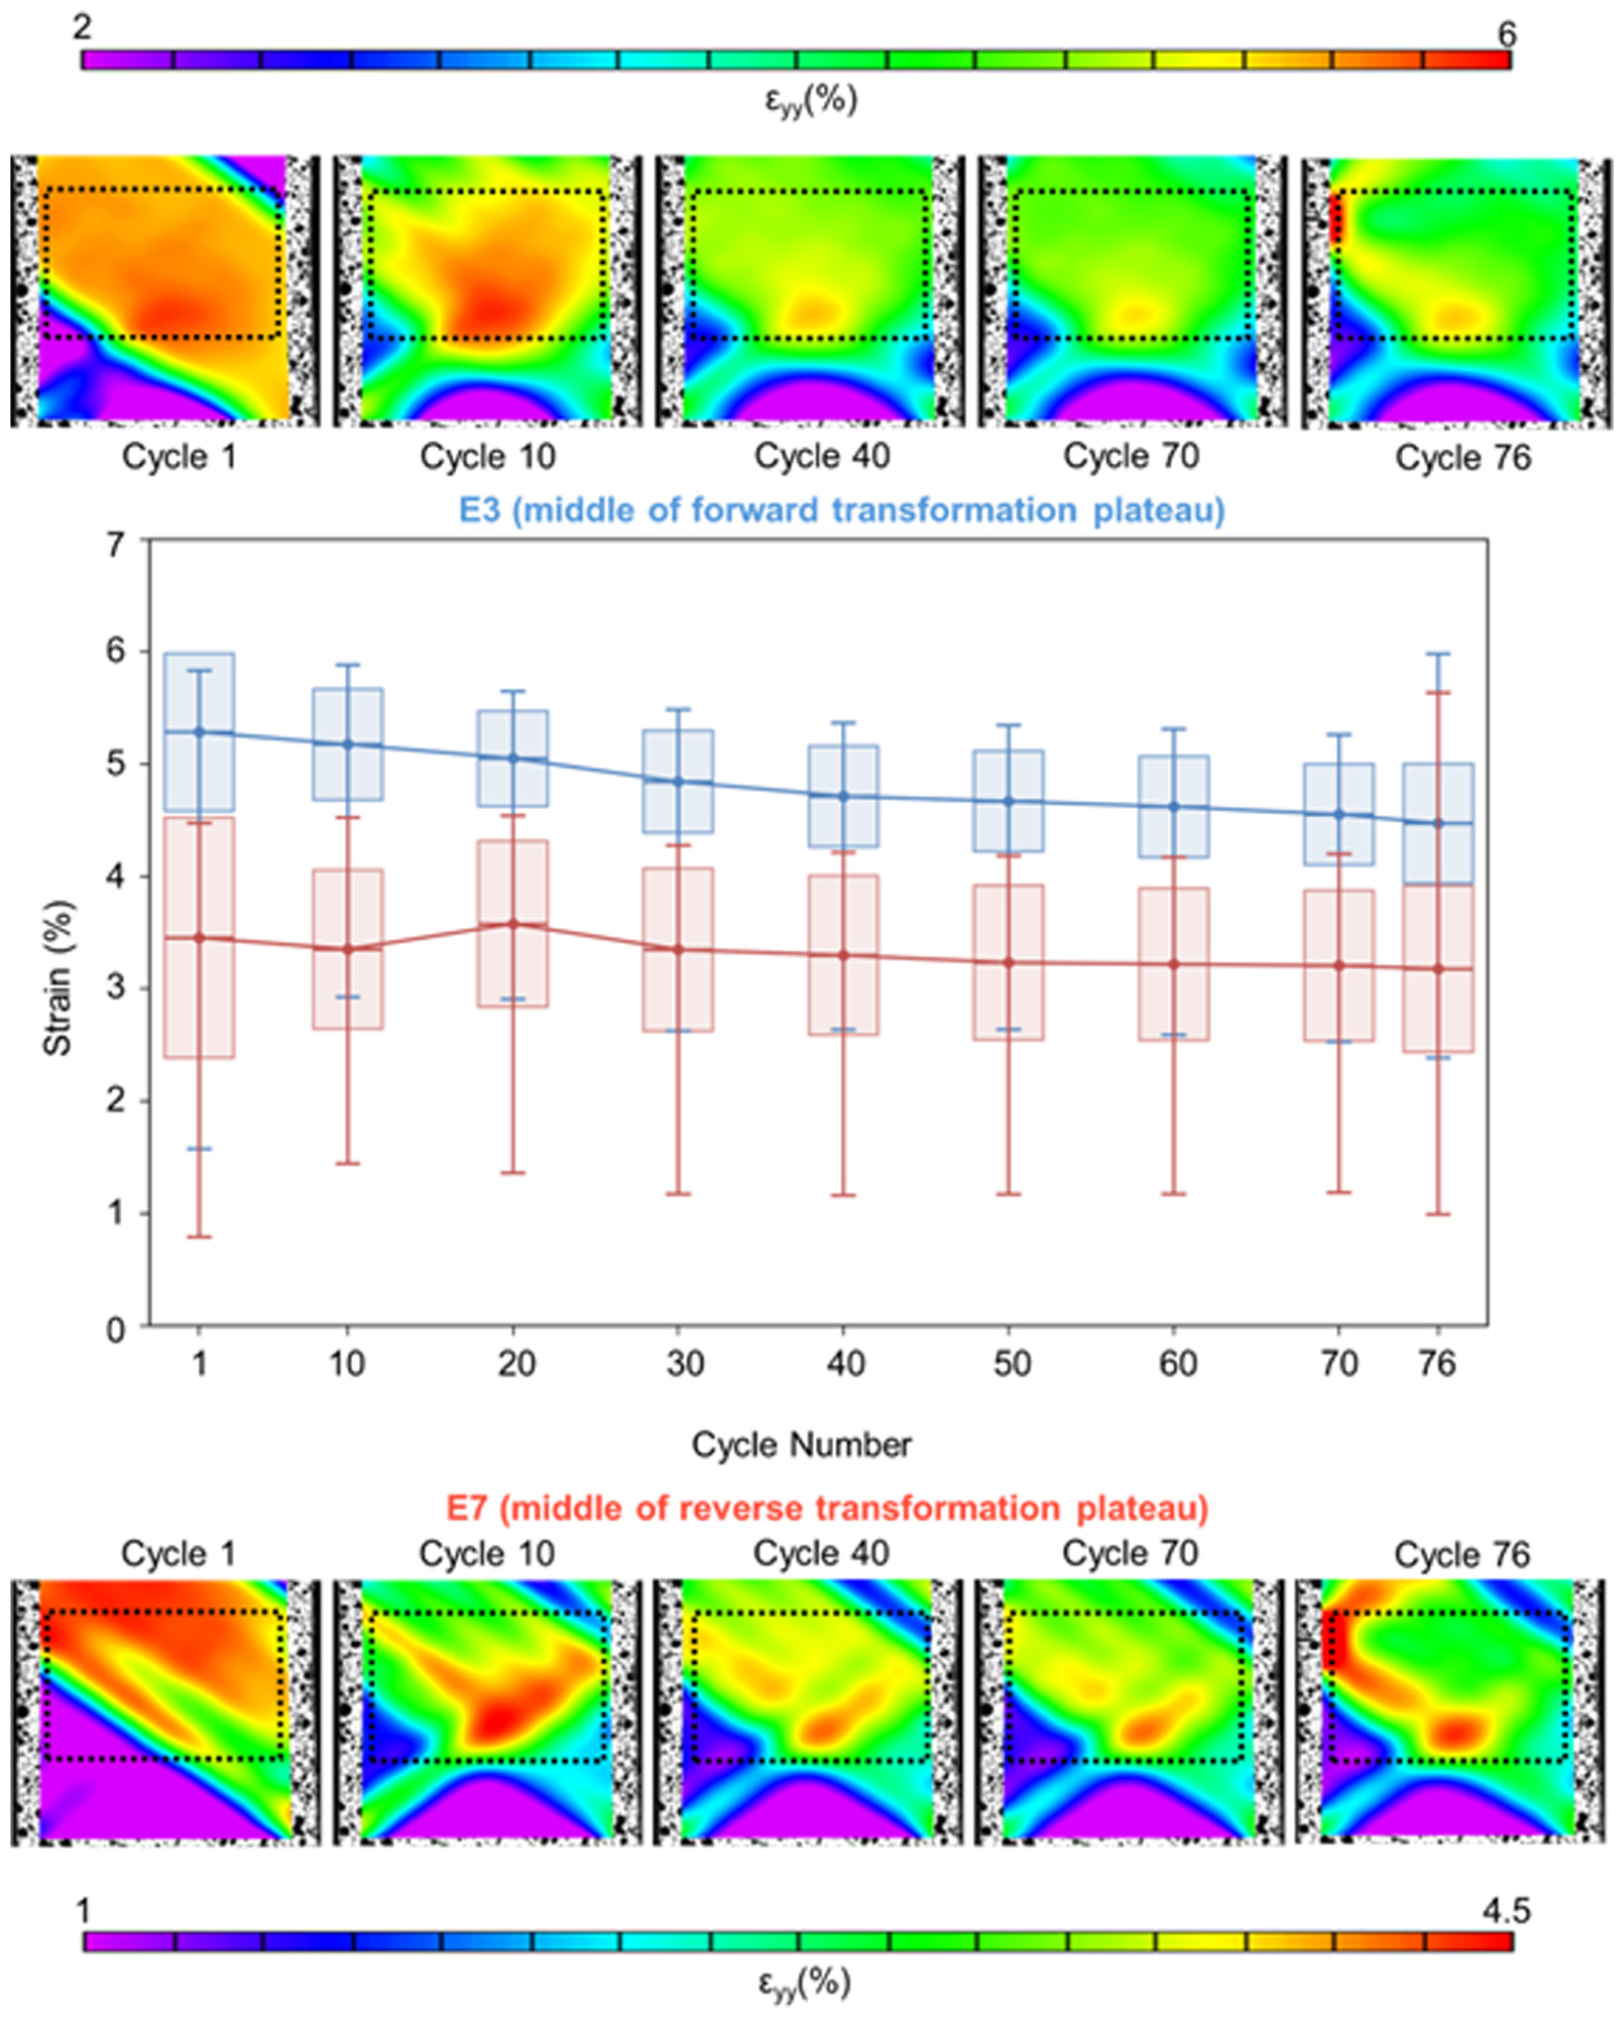
Modified box and whisker plot showing the statistical variation within an area encompassing a transformation region in the lower portion of the gage length during the middle of the forward transformation (E3) in blue and the middle of the reverse transformation (E7) in red.
Figure 6 adds kinematic information by showing the local axial strain-rate contours, dεyy/dt, together with the corresponding strain contours during the middle of the forward plateau (E3) and the middle of the reverse plateau (E7). During forward transformation, Cycle 1 shows narrow, intense positive strain-rate bands aligned with the inclined transformation fronts, indicating that front propagation is highly localized at the top band-boundaries for both the strain bands. The maximum values of the strain velocities starts off high at around ±0.6%/s for both the forward and reverse transformations with sharp movements, quickly dissipating and stabilizing around 0.25%/s as the strain bands become more diffuse, reaching a steady state by the 20th cycle. In later cycles, these strain-rate bands become broader and more spatially distributed, consistent with a reduction in front sharpness and a more diffuse propagation process. Thus, the strain-rate maps provide a kinematic complement to the strain maps and line profiles; that the transformation fronts remain active and organized throughout the cycling history, but the front motion becomes less sharply localized as cyclic stabilization develops.
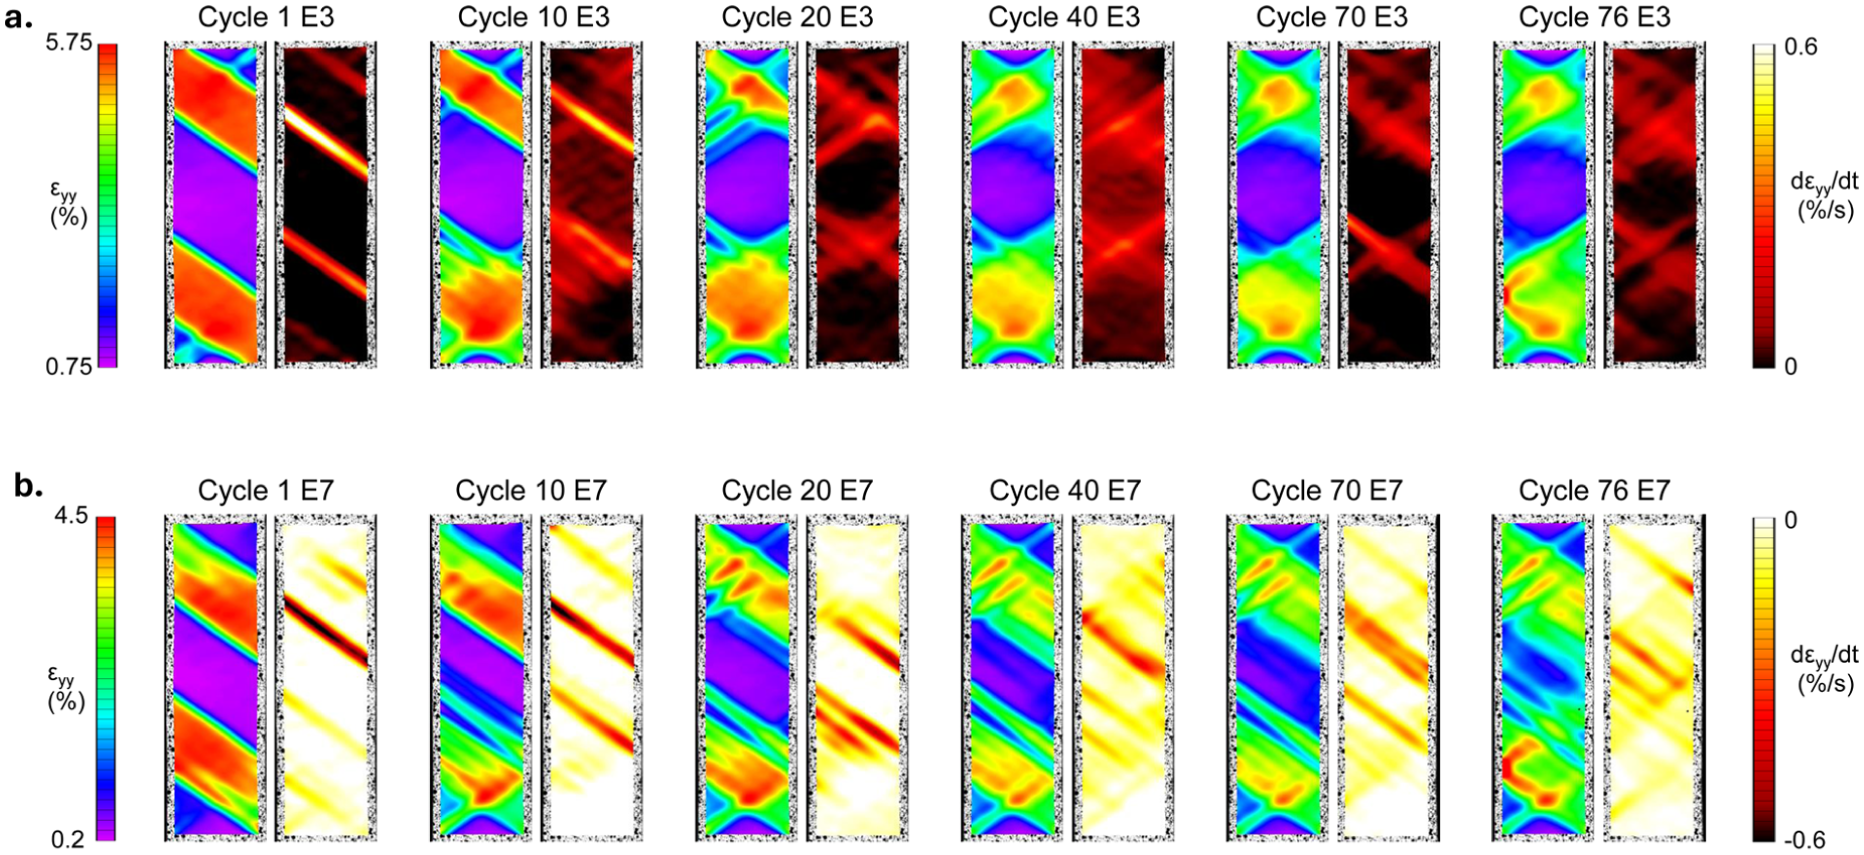
Propagating strain velocity contours shown with corresponding strain contours during the middle of the forward transformation plateau (E3) for selected cycles in (a), and during the middle of the reverse transformation plateau (E7) for selected cycles in (b).
Figure 7 links the evolving lower-gage strain localization pattern to the eventual crack-initiation site. At the beginning of the forward transformation (top row, E2), the lower portion of the gage section repeatedly exhibits a strong localized band, although its morphology evolves from a sharp diagonal band in Cycle 1 to a broader, more diffuse x-shaped localized region by Cycles 40–76. This x-shaped region initially develops a transformed hot-spot in its center. This hot-spot slowly dissipates during cycling, but the left-top to right-bottom strain band of this x shape, which is the first diagonal strain band that forms in Cycle 1, does result in crack formation at the left edge that leads to fracture. During the end of the reverse transformation (bottom row, E8), this same lower-gage region remains one of the last portions of the specimen to recover strain, indicating that it is persistently active during both forward and reverse transformation. The arrowed crack location in Cycle 77 coincides with this recurrent hot-spot region, providing direct spatial evidence that failure initiated where transformation-induced strain localization repeatedly persisted over the cycling history. These DIC observations establish a clear cycle-resolved spatial correlation between persistent strain localization and the eventual crack-initiation site.
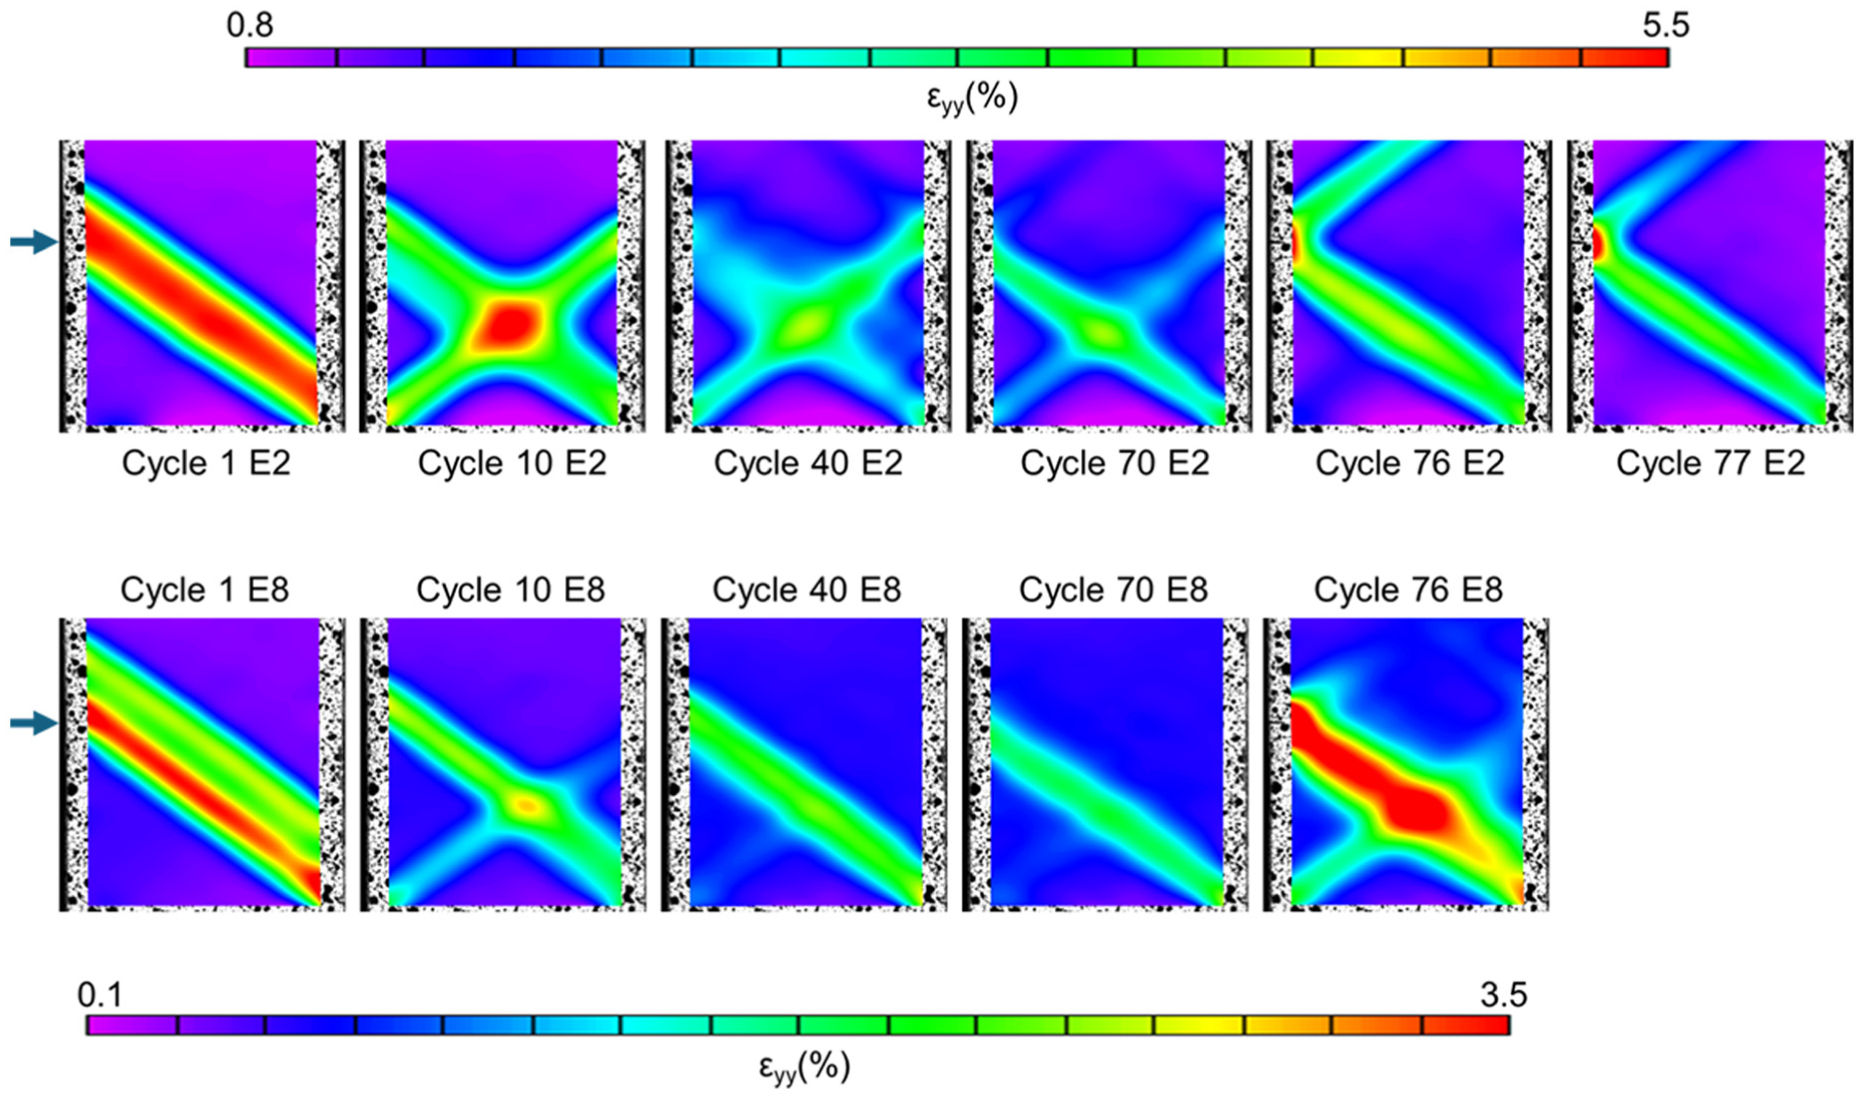
Evolution of strain banding in the lower end of the gage section during the beginning of the forward transformation at the top row (E2 from Figure 4) and the end of the reverse transformation at the bottom row (E8 from Figure 4), with the arrows showing the location of the crack that eventually forms leading to fracture.
Taken together, Figures 4 to 7 show that the transformation remains heterogeneous throughout the cycling history, but its heterogeneity evolves systematically. The line profiles show that the transformation fronts broaden and the strain gradients across the fronts decrease with cycling. Consistent with this trend, the local statistical analysis shows that the mean strain within a persistent forward-transformation hot-spot decreases from 5.28% in Cycle 1 to 4.47% in Cycle 76, while the corresponding reverse-transformation mean decreases from 3.45% to 3.22%. The strain-rate contours further show that front motion becomes more diffuse with increasing cycle number. Despite this redistribution, the lower-gage hot-spot remains active throughout cycling and coincides with the eventual crack-initiation location at Cycle 77. These observations show that cyclic stabilization in NiTi is not a transition to homogeneous transformation, but rather a transition from sharply localized early-cycle fronts to a stabilized yet still heterogeneous late-life transformation mode.
Discussion
The cyclic tensile results obtained in this study exhibit the characteristic evolution of superelastic NiTi reported widely in the literature: a progressive decrease in transformation stresses, a reduction in hysteresis (energy dissipation), and convergence toward a stabilized response after a finite number of cycles. Early work by Miyazaki and co-workers (Miyazaki et al., 1986) showed that the critical stress for inducing martensite and the hysteresis of the stress–strain loop decrease with increasing cycle number, with the magnitude of change depending strongly on the maximum applied stress/strain level. Our observations are consistent with this established trend, as the largest changes occur during the initial cycling, followed by a gradual approach to a steady-state cyclic response.
Our observation that transformation-band morphology becomes repeatable after a finite number of cycles aligns with the broader view that cyclic super elasticity “trains” the transformation response via evolving defects. Notably, some studies report that pseudo elastic cycling can reduce localization and promote a more homogeneous transformation mode as dislocation density increases (Zotov et al., 2017). In contrast, the present thin-foil specimen continues to exhibit distinct inclined banding even after macroscopic stabilization, suggesting that geometry, texture, and surface/manufacturing condition can preserve band-type transformation while still producing a stabilized macroscopic loop. This is an important consideration for manufactured functional structures where thin sections and constrained geometries are common (Shuai and Xiao, 2020).
A key outcome of the present measurements is the clear identification, through full-field DIC, of the microstructural origin of the macroscopic plateaus: the forward and reverse transformation plateaus correspond to the nucleation, propagation, and retraction of localized transformation fronts, rather than homogeneous deformation. This localization manifests as distinct diagonal strain bands in the gage section, which is a hallmark of tensile super elasticity in NiTi and has been documented using in-situ DIC approaches (Zhang et al., 2023). The evolution of the line-strain profiles further supports this interpretation: discrete strain peaks (band intersections) transition toward a more uniform distribution as transformation progresses and revert during unloading as reverse transformation proceeds. Similar band-driven transformation kinetics and pattern evolution have been reported in DIC-based studies on NiTi subjected to loading–unloading cycles (Bian et al., 2018).
The stabilization observed in the present work by approximately 50 cycles, with minimal additional change through the 77th cycle, aligns with the commonly reported “rapid early evolution + saturation” behavior of functional response under cyclic superelastic loading. Review-level assessments describe cyclic degradation/stabilization as involving declining transformation stresses, narrowing hysteresis loops, and stabilization after a sufficient number of cycles, depending on loading amplitude and thermomechanical conditions (Davarnia et al., 2025). Mechanistically, this evolution is generally attributed to the accumulation of defects and internal stress-fields produced during repeated transformation, including dislocation activity and retained martensite, which alter the driving force required for subsequent transformation and reduce the transformable fraction (Chen et al., 2025a). Recent study specifically highlights that retained martensite can lower the critical forward transformation stress during cycling, while dislocations and retained martensite together degrade transformation capacity over time (Chen et al., 2025b). These mechanisms provide a consistent explanation for the reduced transformation stresses and reduced hysteresis area observed as cycling progresses in the present experiments.
The DIC results also emphasize that, even after macroscopic stabilization, the transformation remains spatially heterogeneous. The repeatability of band morphology by the later cycles indicates spatial stabilization, similar band paths and strain patterns recurring cycle-to-cycle, which complements mechanical stabilization (nearly invariant plateau stresses and loop shape). This distinction is important because functional fatigue and eventual fracture are often governed by persistent localization: recurring high-strain regions can accumulate damage even when the global response appears stable. The specimen in this study completed 76 full cycles and fractured at the beginning of cycle 77, with failure initiating in a localized region-consistent with the broader understanding that cyclic superelastic deformation can promote localized damage accumulation and functional degradation prior to rupture (Song et al., 2025).
The agreement between the present findings and prior cyclic superelastic NiTi literature reinforces the following two significant points: (i) cyclic stabilization of transformation stresses and related hysteresis are intrinsic features of superelastic NiTi under repeated loading conditions, and (ii) the macroscopic stabilization characteristic is tightly linked to localized, band-mediated transformation processes that can remain heterogeneous even in the stabilized regime.
The applied strain rate can influence the response through self-heating and cooling associated with forward and reverse phase transformation since superelastic deformation in NiTi is strongly thermo-mechanically coupled. At the strain rate used here (10−3 s−1), such temperature changes may affect the strain localization behavior. Although the present experiments were performed under a consistent loading protocol, no direct temperature measurements were obtained; therefore, the possible contribution of thermal effects to the observed cyclic evolution cannot be quantified. Future work integrating full-field deformation measurement with thermal monitoring would help clarify these coupled effects.
From an advanced-manufacturing perspective, transformation strain bands provide a physically interpretable, spatially resolved “fingerprint” of superelastic stability that can complement conventional stress–strain metrics for qualifying functional NiTi components. Additively manufactured NiTi is well known to exhibit process-sensitive microstructure such as defects, texture, composition shifts, and therefore process-sensitive transformation response; scan strategy, post-processing heat treatment, and surface finishing have all been shown to measurably affect functional performance (Elahinia et al., 2016; Sabirov et al., 2026). Our approach; cycle-resolved full-field strain mapping and band hot-spot tracking; suggests a practical pathway for process–structure–property qualification: manufacturing routes that reduce persistent band hot-spots (or distribute transformation more uniformly) should delay localized damage accumulation and improve functional reliability in repeated actuation or structural damping applications (Sedmák et al., 2016).
The practical relevance of the present results extends to additive manufacturing and process qualification of superelastic NiTi components. In particular, full-field DIC enables extraction of quantitative descriptors of transformation behavior, such as band nucleation site, propagation path, inclination angle, band width, localized strain magnitude, and the degree of stabilization over repeated cycles. These metrics could complement conventional global mechanical measurements for the additively manufactured components by providing a basis for identifying abnormal transformation signatures associated with microstructural heterogeneity, residual stress, or process-induced defects. DIC-based band tracking could serve as a high-fidelity characterization tool to correlate local transformation signatures with manufacturing history and functional performance, and to define reference patterns for acceptable cyclic superelastic response in additively manufactured NiTi components.
Conclusion
This study experimentally investigated the cyclic superelastic behavior of Nitinol under repeated uniaxial tensile loading, with particular emphasis on stabilization phenomena and strain localization mechanisms. Full-field strain measurements obtained using digital image correlation (Vic-2D) enabled in-situ visualization of stress-induced martensitic transformation and its spatial evolution throughout the loading–unloading cycles.
The results demonstrated a progressive reduction in forward and reverse transformation stresses during the initial cycles, accompanied by a decrease in hysteresis area, indicating cyclic stabilization of the superelastic response. After approximately 50 cycles, the stress–strain behavior converged toward a stable regime, with minimal additional changes observed up to the 76th cycle. Full-field strain maps revealed that the macroscopic transformation plateaus correspond to the nucleation, propagation, and retraction of localized diagonal transformation bands. With continued cycling, the morphology and propagation paths of these bands became increasingly repeatable, confirming spatial stabilization of the transformation process.
The full-field DIC-based analysis showed that the transformation remains spatially heterogeneous throughout cycling, but that this heterogeneity evolves quantitatively. The transformation fronts broaden and become less sharply partitioned with cycle number, while the local mean strain within a persistent forward-transformation hot-spot decreases from 5.3% in Cycle 1 to 4.5% in Cycle 76. In the corresponding reverse-transformation region, the mean strain decreases from 3.5% to 3.2%, while a broad min-max range persists, indicating continued spatial variability. Strain-rate contours further show that the transformation-front motion becomes more diffuse as cyclic stabilization develops. Although the global stress-strain response stabilizes after approximately 50 cycles, the DIC results demonstrate that the transformation does not become homogeneous. Instead, the response transitions from sharply localized early-cycle fronts to a stabilized but still heterogeneous late-life mode. The persistent lower-gage localization region identified by DIC coincides with the eventual crack-initiation site at Cycle 77, linking recurrent strain localization to failure susceptibility. These findings further highlight the potential of full-field DIC as a valuable diagnostic tool for future NiTi component design, particularly in additively manufactured systems, where early detection of local anomalies may be critical for improving performance and durability.
Footnotes
Funding
The authors disclosed receipt of the following financial support for the research, authorship, and/or publication of this article: The work is supported by the Scientific and Technological Research Council of Türkiye grant 325N116, National Science Foundation (NSF) grants 2429662 and 2416920, the Maine Economic Improve Fund (MEIF), and the University of Southern Maine’s Undergraduate Research Opportunities (UROP) program.
Declaration of conflicting interests
The authors declared no potential conflicts of interest with respect to the research, authorship, and/or publication of this article.
Data availability statement
The data that support the findings of this study are available from the corresponding author upon reasonable request*.