
Abstract
Existing regulations seek to protect the public from exposure to polychlorinated biphenyls (PCBs) in food, water, and soil. Exposure to PCBs in ambient air has recently been given explicit consideration in the human health risk assessments that form the basis of risk management decisions at contaminated sites. The objective of this paper is to examine how ambient air exposure to PCBs is regulated and monitored at five contaminated sites in the United States. We reviewed online accessible materials (including Environmental Protection Agency-site specific websites, data repositories, and other agency websites). Results indicate that the five sites vary in regard to the measured PCB concentrations in air, the sampling and monitoring methodologies, and the established site-specific guidelines/standards and their basis. We conclude that current practices may not adequately protect those living or working near these sites from airborne PCB exposure and that regulations should include recognition of exposure to indoor sources.
Keywords
Introduction
Polychlorinated biphenyls (PCBs) are a group of 209 chemicals, referred to as congeners individually, that consist of chlorines attached to two benzene rings in different patterns. 1 While regulations exist to protect the public from hazardous exposure to PCBs in food, soil, and water, regulations to protect the public from ambient air exposure to PCBs are lacking at worst and inconsistent at best. 2 Mixtures of PCBs are ubiquitous in the environment with background air concentrations in urban areas of the United States ranging from 1 to 10 ng/m3. 3 Ambient concentrations near PCB-contaminated hazardous waste sites (“sites”) may be considerably higher than background, as the sites can serve as sources of PCBs in air. For example, PCB ambient air concentrations of 186 ng/m3 were recorded at the New Bedford Harbor Superfund site in October 2015. 4
Commercial mixtures of PCBs, also known by the trade name “Aroclor” in the United States, were manufactured until the late 1970s. 5 Under the Toxic Substances Control Act, the Environmental Protection Agency (EPA) promulgated a regulation in 1979 to ban PCB production based on evidence that the benefits of PCBs (primarily as insulating fluids in electrical equipment and large buildings) were outweighed by their toxicity and persistence in the environment. 6 People are exposed to PCBs today because PCBs have remained in the environment, continue to enter the environment from various products in which they were used, bioaccumulate in the food chain, and volatilize or aerosolize into the air. 7 Additionally, recognition of PCBs in building materials in schools in the United States and subsequent analyses of source materials have identified significant measured and modeled PCB concentrations in indoor air. The median indoor air total PCB concentration based on sixty-four measurements in six schools across the United States is reported as 318 ng/m3 with an interquartile range of 59 to 732 ng/m3. 8 Evaluations of indoor air concentrations of PCBs in six schools in the Midwest identified concentrations ranging from 0.5 to 194 ng/m3 (PCBs), 9 and in a non-cohort specific analysis, Lehmann et al. 10 found that airborne PCBs and dietary PCBs could each account for half of a child’s total PCB exposure.
Ingestion of PCBs was once considered to be the major route of exposure for the general public, 7 but more current estimates suggest an increasingly important role for inhalation of PCBs.10–14 Concurrently, cost-effective methodologies for measuring PCBs in air using passive samplers have evolved, allowing identification of lower concentrations with greater accuracy. 15 Monitoring programs conducted by researchers have successfully identified PCBs in air at locations and levels previously unknown.16,17 Given the state of the exposure science on inhalation of PCBs and the opportunities new methodologies may afford, our objectives are to (1) describe the health effects of PCBs, including the understudied effects of inhaled PCBs; (2) examine the basis of federal and state regulations of ambient air exposure to PCBs at five sites; (3) compare site-specific guidelines and standards, including the measurement and monitoring methods; and (4) consider whether risk-based regulations of airborne PCBs should include explicit recognition of indoor exposures in development of site-specific ambient air monitoring target levels.
Health Effects of PCBs
There is concern that people living near incinerators, hazardous waste sites contaminated with PCBs, and facilities that dispose of PCBs may have higher cumulative exposures to PCBs than the general population who may be exposed to PCBs from eating locally caught seafood, drinking contaminated water, breathing the air, or through skin contact with contaminated sediments. 7 Exposure to PCBs is of public health relevance because animal and human studies have demonstrated their cancer and non-cancer effects. Chronic exposure to PCBs at lower doses negatively impacts the nervous, immune, and reproductive systems, and human studies have shown effects on memory, learning, IQ, and motor function in children,18–21 fertility in adults,22,23 and immune system suppression in children and adults.24–26 Animal studies have demonstrated cancers of the liver, thyroid, and immune system,27–29 and occupational studies have found associations with liver and biliary tract cancers.30,31 The International Agency for Research on Cancer established PCBs as “known or certain human carcinogens” in 2013; however, the EPA still classifies PCBs as probable carcinogens.32,33
Exposure: Ingestion Versus Inhalation of PCBs
The toxicity of a specific PCB congener is dependent on the number and pattern of its chlorines. 1 The higher the individual PCB number, the more chlorinated it is (i.e., PCB 1 and PCB 209 are the least and most chlorinated, respectively). However, human exposure does not occur one congener at a time—everyone is exposed to a mixture of PCBs from their diet, from air, and from dust in indoor and outdoor environments. Therefore, current human health risk assessment preferentially utilizes toxicity data on the mixture of concern (e.g., complex mixtures of congeners resembling those found in our diet or in air) or on a “sufficiently similar” mixture (e.g., Aroclors) versus toxicity data on individual mixtures components (e.g., congeners) that may not account for interactions between the congeners. 34
PCB mixtures in foods (e.g., fish and mother’s milk) are made up of a higher proportion of the higher chlorinated PCBs that accumulate in adipose tissue, whereas lower chlorinated PCBs often make up a higher proportion of airborne congeners because they tend to volatize into the air more readily than higher chlorinated PCBs which favor binding to sediment. Historically, the main route of exposure to PCBs for the general population had been considered to be through the ingestion of foods such as fish, eggs, dairy, and animal meats in which PCBs bioaccumulate. However, levels of PCBs in the diet have decreased over time. 7 Recent studies have found that inhalation exposure accounts for 30% to 33% of the total exposure (inhalation and ingestion) to lower chlorinated PCBs.11,14 Another study found the proportion of exposure from PCBs in indoor air exceeded the proportion of exposure from PCBs in diet; for two- to three-year-olds and six- to twelve-year-olds, 61% and 51% of their total PCB exposure was inhaled versus 29% and 43% ingested, respectively. 10
Very little is known about the toxicity of the lower chlorinated airborne PCBs and the health consequences of exposure by inhalation in comparison to ingestion. 35 Rats exposed subchronically to air containing PCBs that resembled the PCB profile of urban air experienced adverse effects on the thyroid and increased oxidative stress. 12 Another recent animal study found hyperactivity in rats exposed to air blown over PCB-contaminated sediments from the St. Lawrence River. 36 Additionally, serum concentrations of lower chlorinated PCBs (and not higher chlorinated PCBs) among Akwesasne Native Americans were found to be significantly associated with having diabetes; although PCB concentrations were not measured in air, the researchers suggest that their findings are evidence that inhalation of PCBs is a major exposure route that increases diabetes risk. 37 More research is needed to address the uncertain health effects of inhalation exposure to PCBs, and particularly dose-response data, which are crucial for human health risk assessment. In the meantime, government agencies seek to protect public health based on currently available information.
Federal Standards and Guidelines Relevant to Ambient Air Exposure to PCBs
Standards are legally enforceable, whereas guidelines are recommendations that are not legally enforceable. While there is no federal standard for regulating ambient air PCB concentrations, there is a standard for regulating occupational exposures in air and several environmental and public health guidelines relevant to the inhalation exposure route and setting (Table 1). The Agency for Toxic Substances and Disease Registry (ATSDR) defines health guidelines as substance-specific concentrations derived for the inhalation exposure route using toxicological data if adequate dose-response data exist, and environmental guidelines as “media-specific substance concentrations derived from health guidelines using default exposure assumptions.” 38 In addition to the guidelines, regulatory agencies can also develop site-specific PCB ambient air action levels or trigger levels. These levels can be health risk based and are intended to indicate that actionable steps should be taken to decrease the concentrations of PCBs in the air.
Summary of Federal Standards and Guidelines for PCBs in Air.
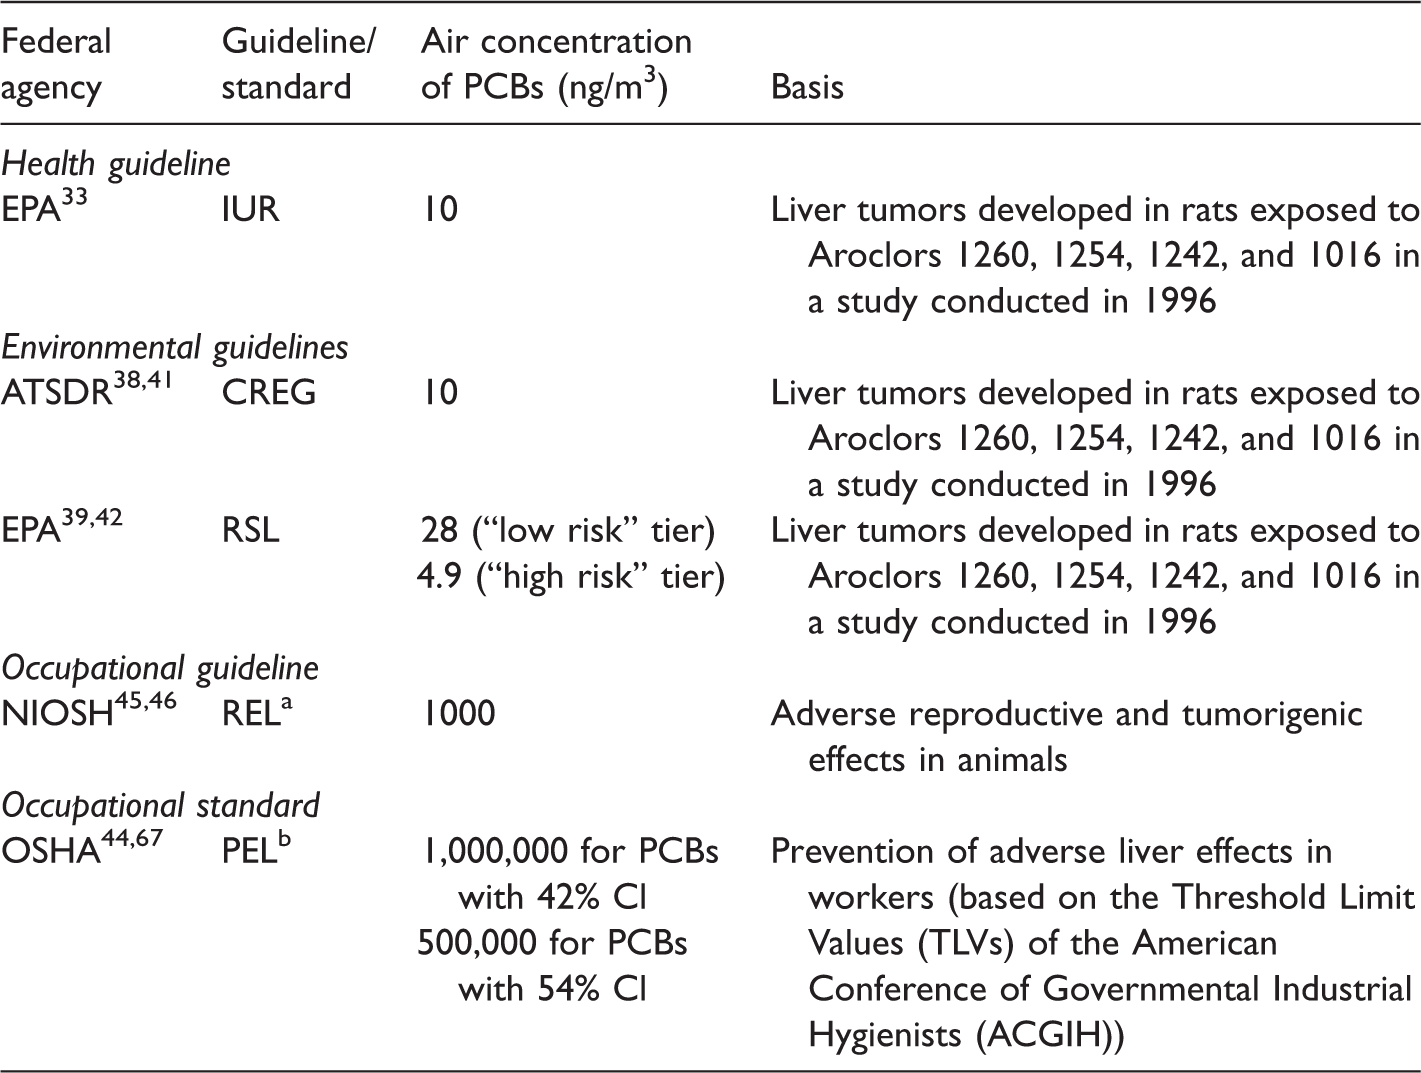
Note. PCB = polychlorinated biphenyls; EPA = Environmental Protection Agency; IUR: inhalation unit risk; ATSDR = Agency for Toxic Substances and Disease Registry; CREG = Cancer Risk Evaluation Guide; RSL = regional screening level; NIOSH = National Institute for Occupational Safety and Health; REL = recommended exposure limit; OSHA = Occupational Safety and Health Administration; PEL = permissible exposure limit.
Time-weighted average, 10-h day, 40-h week.
Time-weighted average, 8-h day, 40-h week.
The inhalation unit risk (IUR) developed by EPA is the upper-bound excess lifetime cancer risk estimated to result from continuous exposure to a stressor such as PCBs at a concentration of 1 µg/m3 in air and is considered a health guideline by ATSDR. 38 The IUR is intended to be compared to site-specific air concentrations for use in risk assessments.
As mentioned in the previous section, PCBs are assessed as mixtures. PCBs were originally introduced into the environment in the United States as Aroclors for which the typical congener compositions of each Aroclor are known. However, EPA recommends a tiered approach for PCB risk assessment recognizing that the PCBs to which people are exposed have undergone partitioning and transformation in the environment or were biologically metabolized or retained in the food chain, and thus no longer resemble the original Aroclor composition. 39 The three tiers established by EPA are high risk and persistence, low risk and persistence, and lowest risk and persistence. 39 EPA distinguishes between inhalation of evaporated congeners and inhalation of an aerosol or dust contaminated with PCBs.
To assess risk from the inhalation of evaporated congeners, the EPA guidance determined that the “low risk” tier is most appropriate (EPA recommends “high risk” for inhalation of an aerosol or dust contaminated with PCBs). 39 Both “low risk” and “high risk” may be applicable to contaminated waste sites, particularly to sites undergoing remediation that results in dust generation or disturbance of sediment. The “low risk” tier is based on dose-response data for Aroclor 1242; it is important to note that 90% of Aroclor 1242 is composed of lower chlorinated PCBs of interest to airborne exposure. 39
The IUR for PCBs (10 ng/m3 for a target cancer risk level of 1E10−6 meaning one excess case in one million people) published in EPA’s Integrated Risk Information System (IRIS) database is derived from the “low risk” slope factor. Although the EPA began a revised PCB IRIS assessment in 2015, intending to evaluate the non-cancer health effects associated with inhalation of PCBs, it has not been completed. 40 To date, the EPA has not published a Reference Concentration (RfC) based on the non-cancer effects (neurocognitive, thyroid, and immune system) of PCBs. The RfC is a concentration in air to which sensitive populations may be exposed over a lifetime without expectation of developing adverse health effects.
ATSDR and EPA have also developed environmental guidelines. Both guidelines are based on a target risk level of 10−6. ATSDR developed a Cancer Risk Evaluation Guide (CREG) of 10 ng/m3 for PCBs in air 41 and EPA developed a Regional Screening Level (RSL) in residential air of 28 ng/m3 for PCBs in the “low risk” tier (and 4.9 ng/m3 for the “high risk” tier). 42 A CREG is a media-specific concentration that is unlikely to produce an increase in cancer rates in a population and is derived from the IUR, a target risk level of 10−6 and default exposure assumptions for the substance. CREGs are intended to be used as a screening tool to evaluate the cancer risks of concentrations at a site. 38 The EPA RSLs for PCBs are intended to be used for chemical contaminants at Superfund sites in all of the EPA regions and are calculated based on the IUR, default exposure assumptions of twenty-six years (350 days/year) exposure duration, and a target risk of 10−6. 43 The RfC could form the basis of an RSL for non-cancer effects associated with inhalation of PCBs. Without the RfC, the environmental guidelines cannot protect people from the non-cancer effects associated with inhalation of PCBs.
Finally, a standard and a guideline have been developed for air exposure to PCBs in occupational settings. The only standard for PCBs in air that has been promulgated is the Permissible Exposure Limit (PEL) by the Occupational Safety and Health Administration. The PEL for PCBs with 42% chlorine is 1,000,000 ng/m3 and the PEL for PCBs with 54% chlorine is 500,000 ng/m3; the PEL is a time-weighted average concentration of PCBs to which workers may be exposed for an 8-h work day over a 40-h week and no adverse health effects would be expected. 44 The National Institute for Occupational Safety and Health (NIOSH) published a more protective guideline called the Recommended Exposure Limit (REL) which is the maximum recommended concentration for an 8- or 10-h time-weighted average exposure. For PCBs, the REL is 1000 ng/m3. 45
State Guidelines on Ambient Air Exposure to PCBs
We examined the regulations and procedures for monitoring PCBs at five contaminated sites located in Alabama, New York, Massachusetts, and Indiana. None of the states have standards for ambient air exposure to PCBs, and of the states examined, only Massachusetts and New York set ambient air guidelines for PCBs. However, in Massachusetts and New York, the state guidelines were not used for decision-making at the sites we examined; instead, less protective, site-specific guidelines were developed.
In 1990, the Massachusetts Department of Environmental Protection (MassDEP) established a 24-h average Threshold Effects Exposure Limit (TEL) and an annual average Allowable Ambient Limit (AAL) of 3 ng/m3 and 0.5 ng/m3 for PCBs, respectively. 46 To establish the TEL and AAL, MassDEP calculated the Non-Threshold Effects Exposure Limit (NTEL), which is the concentration of a substance associated with target cancer risk level of 10−6 over a lifetime of continuous exposure. The NTEL for PCBs is 0.5 ng/m3 and was based on an IUR of 22 ng/m3 determined by EPA’s Carcinogen Assessment Group for continuous exposure over a lifetime; the source and basis of the 22 ng/m3 value are not publicly available. The MassDEP TEL is calculated based on non-cancer health effects and is the concentration of a substance intended to protect the most sensitive of the general population over a lifetime of continuous exposure, and for PCBs, the TEL was an adjustment of the NIOSH REL. 47 The AAL is then established to be the NTEL or TEL, whichever is lower and more protective. 46 Thus, in the case of PCBs, the AAL of 0.5 ng/m3 is based on the NTEL. Practitioners generally consider these guidelines outdated.
In 2016, the New York State Department of Environmental Conservation established long-term guidelines for PCBs in air that are four and twenty times higher than the guidelines in Massachusetts, as shown in Table 2. The Annual Guideline Concentration (AGC) established for PCBs is associated with a target cancer risk level of 10−6 and based upon EPA’s guidelines and risk assessment published in IRIS. 48 The AGC of 10 ng/m3 was derived for Aroclors 1016, 1221, 1232, and 1242, which corresponds to the EPA’s tier of “low risk”; this AGC is as protective as ATSDR’s CREG and EPA’s IUR and more protective than the corresponding “low risk” EPA RSL of 28 ng/m3. The second AGC of 2 ng/m3 was derived for Aroclors 1248, 1254, 1260, 1262, and 1268, which corresponds to the EPA’s tier of “high risk”; this AGC is appropriate for inhalation of dust and aerosols and more protective than the corresponding “high risk” EPA RSL of 4.9 ng/m3. 48
Summary of State Guidelines for PCBs in Air.
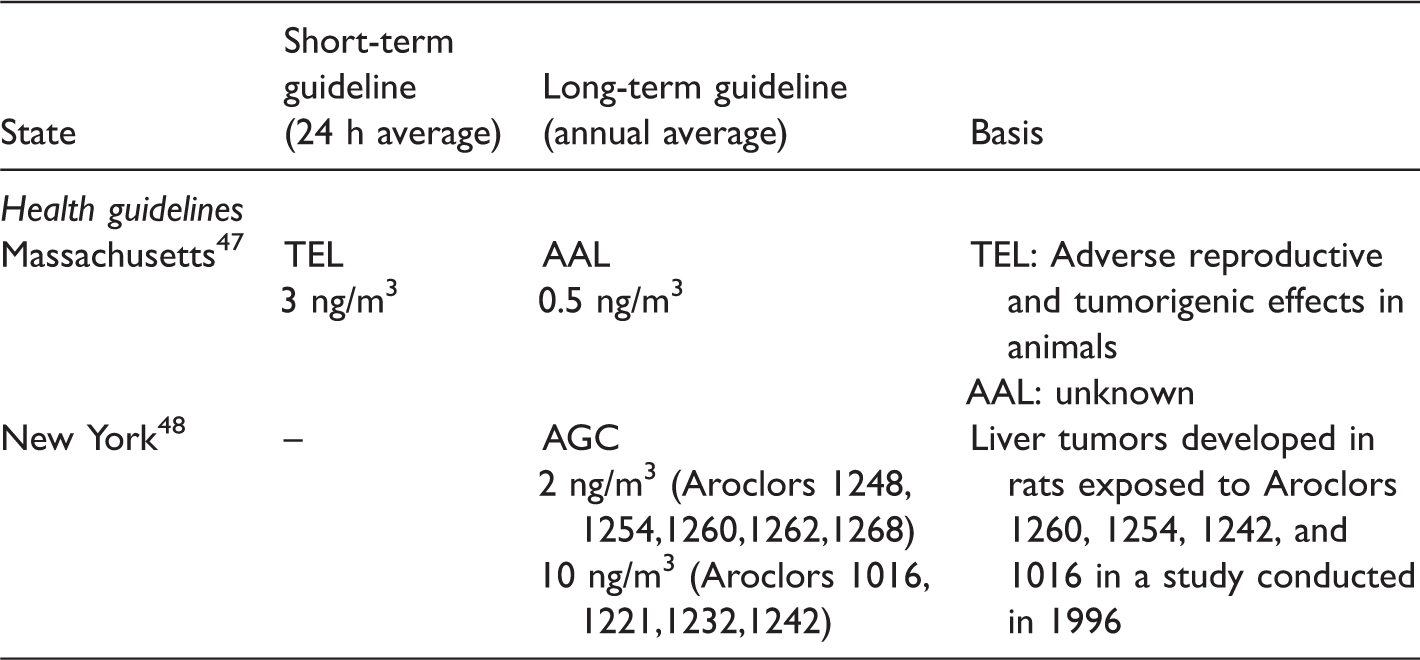
Note. PCB = polychlorinated biphenyls; TEL = threshold effects exposure limit; AAL = allowable ambient limit; AGC = annual guideline concentration.
It is worth noting the differences in cancer risk goals of each guideline. For example, the National Oil and Hazardous Substances Pollution Contingency Plan known simply as the National Contingency Plan and the Comprehensive Environmental Response, Compensation, and Liability Act of 1980, which governs clean-up of Superfund sites, identify a cancer risk range of 10−4 to 10−6 as acceptable. 49 In the Commonwealth of Massachusetts, the Massachusetts Contingency Plan requires a cancer risk level for clean-ups of 10−5 or 1 excess cancer case in one hundred thousand. 50 Also of note is that none of the federal or state risk goals or guidelines for PCBs recognize that indoor air exposures may contribute significantly to exposures experienced by workers and residents, and particularly to adults and children who spend the better part of 8 h each day for 180 days each year in schools that contain PCBs in building materials. 9
Case Studies
We examined five sites contaminated with PCBs in EPA Regions 1, 2, 4, and 5 that underwent or are undergoing environmental clean-up. It was a convenience sample of sites that met the following criteria: Contamination at the site was such that the site was classified or met criteria to be classified, as a Superfund site, and air monitoring for PCBs was conducted at the site.
Anniston, Alabama. A manufacturing plant operated by Monsanto Corporation in Anniston, Alabama, produced PCBs from 1929 until 1971, during which time hazardous waste was disposed of in landfills adjacent to the property and PCBs were discharged in wastewater. Today, the plant is fenced off, produces different chemicals, and is operated by Solutia Incorporated. The plant is approximately 70 acres in size and is located about 1 mile from downtown Anniston. 51 It is not listed as a Superfund site; however, it is being cleaned-up by EPA through the Superfund Alternative Approach, which means the same processes and standards apply to this site as to Superfund sites. 51 At the request of EPA to address community concerns and questions, ATSDR has conducted periodic health consultations at the site since 2003, comparing air monitoring data for PCBs to the CREG. 52
Hudson River, New York. From 1947 until 1977, two General Electric plants in Fort Edward and Hudson Falls, New York, discharged PCBs into the Hudson River. 53 As a result, the EPA designated 200 miles of the river between Hudson Falls and the Battery in New York City as a Superfund site in 1984. A Record of Decision was issued in 2002, which indicated that the upper 40 miles of the river needed to be dredged to remedy the contamination. Dredging of the river occurred from 2009 until 2015. 54 Prior to dredging and in response to community concerns regarding remedial action, the EPA developed enforceable quality-of-life performance standards for traffic, noise, construction lighting, air quality, odor, aesthetics, and recreation (Table 3). 55 To develop the daily standards for air, EPA used the IRIS reference dose for oral exposure for non-cancer effects for Aroclor 1016 (CASRN 12674–11-2) as opposed to the IRIS profile for PCBs (CASRN 1336–36-3) because of the volatility of Aroclor 1016 and since sediment and water samples were typical of this Aroclor. 55
Summary of Guidelines/Standards for PCBs in Air at Contaminated Sites.
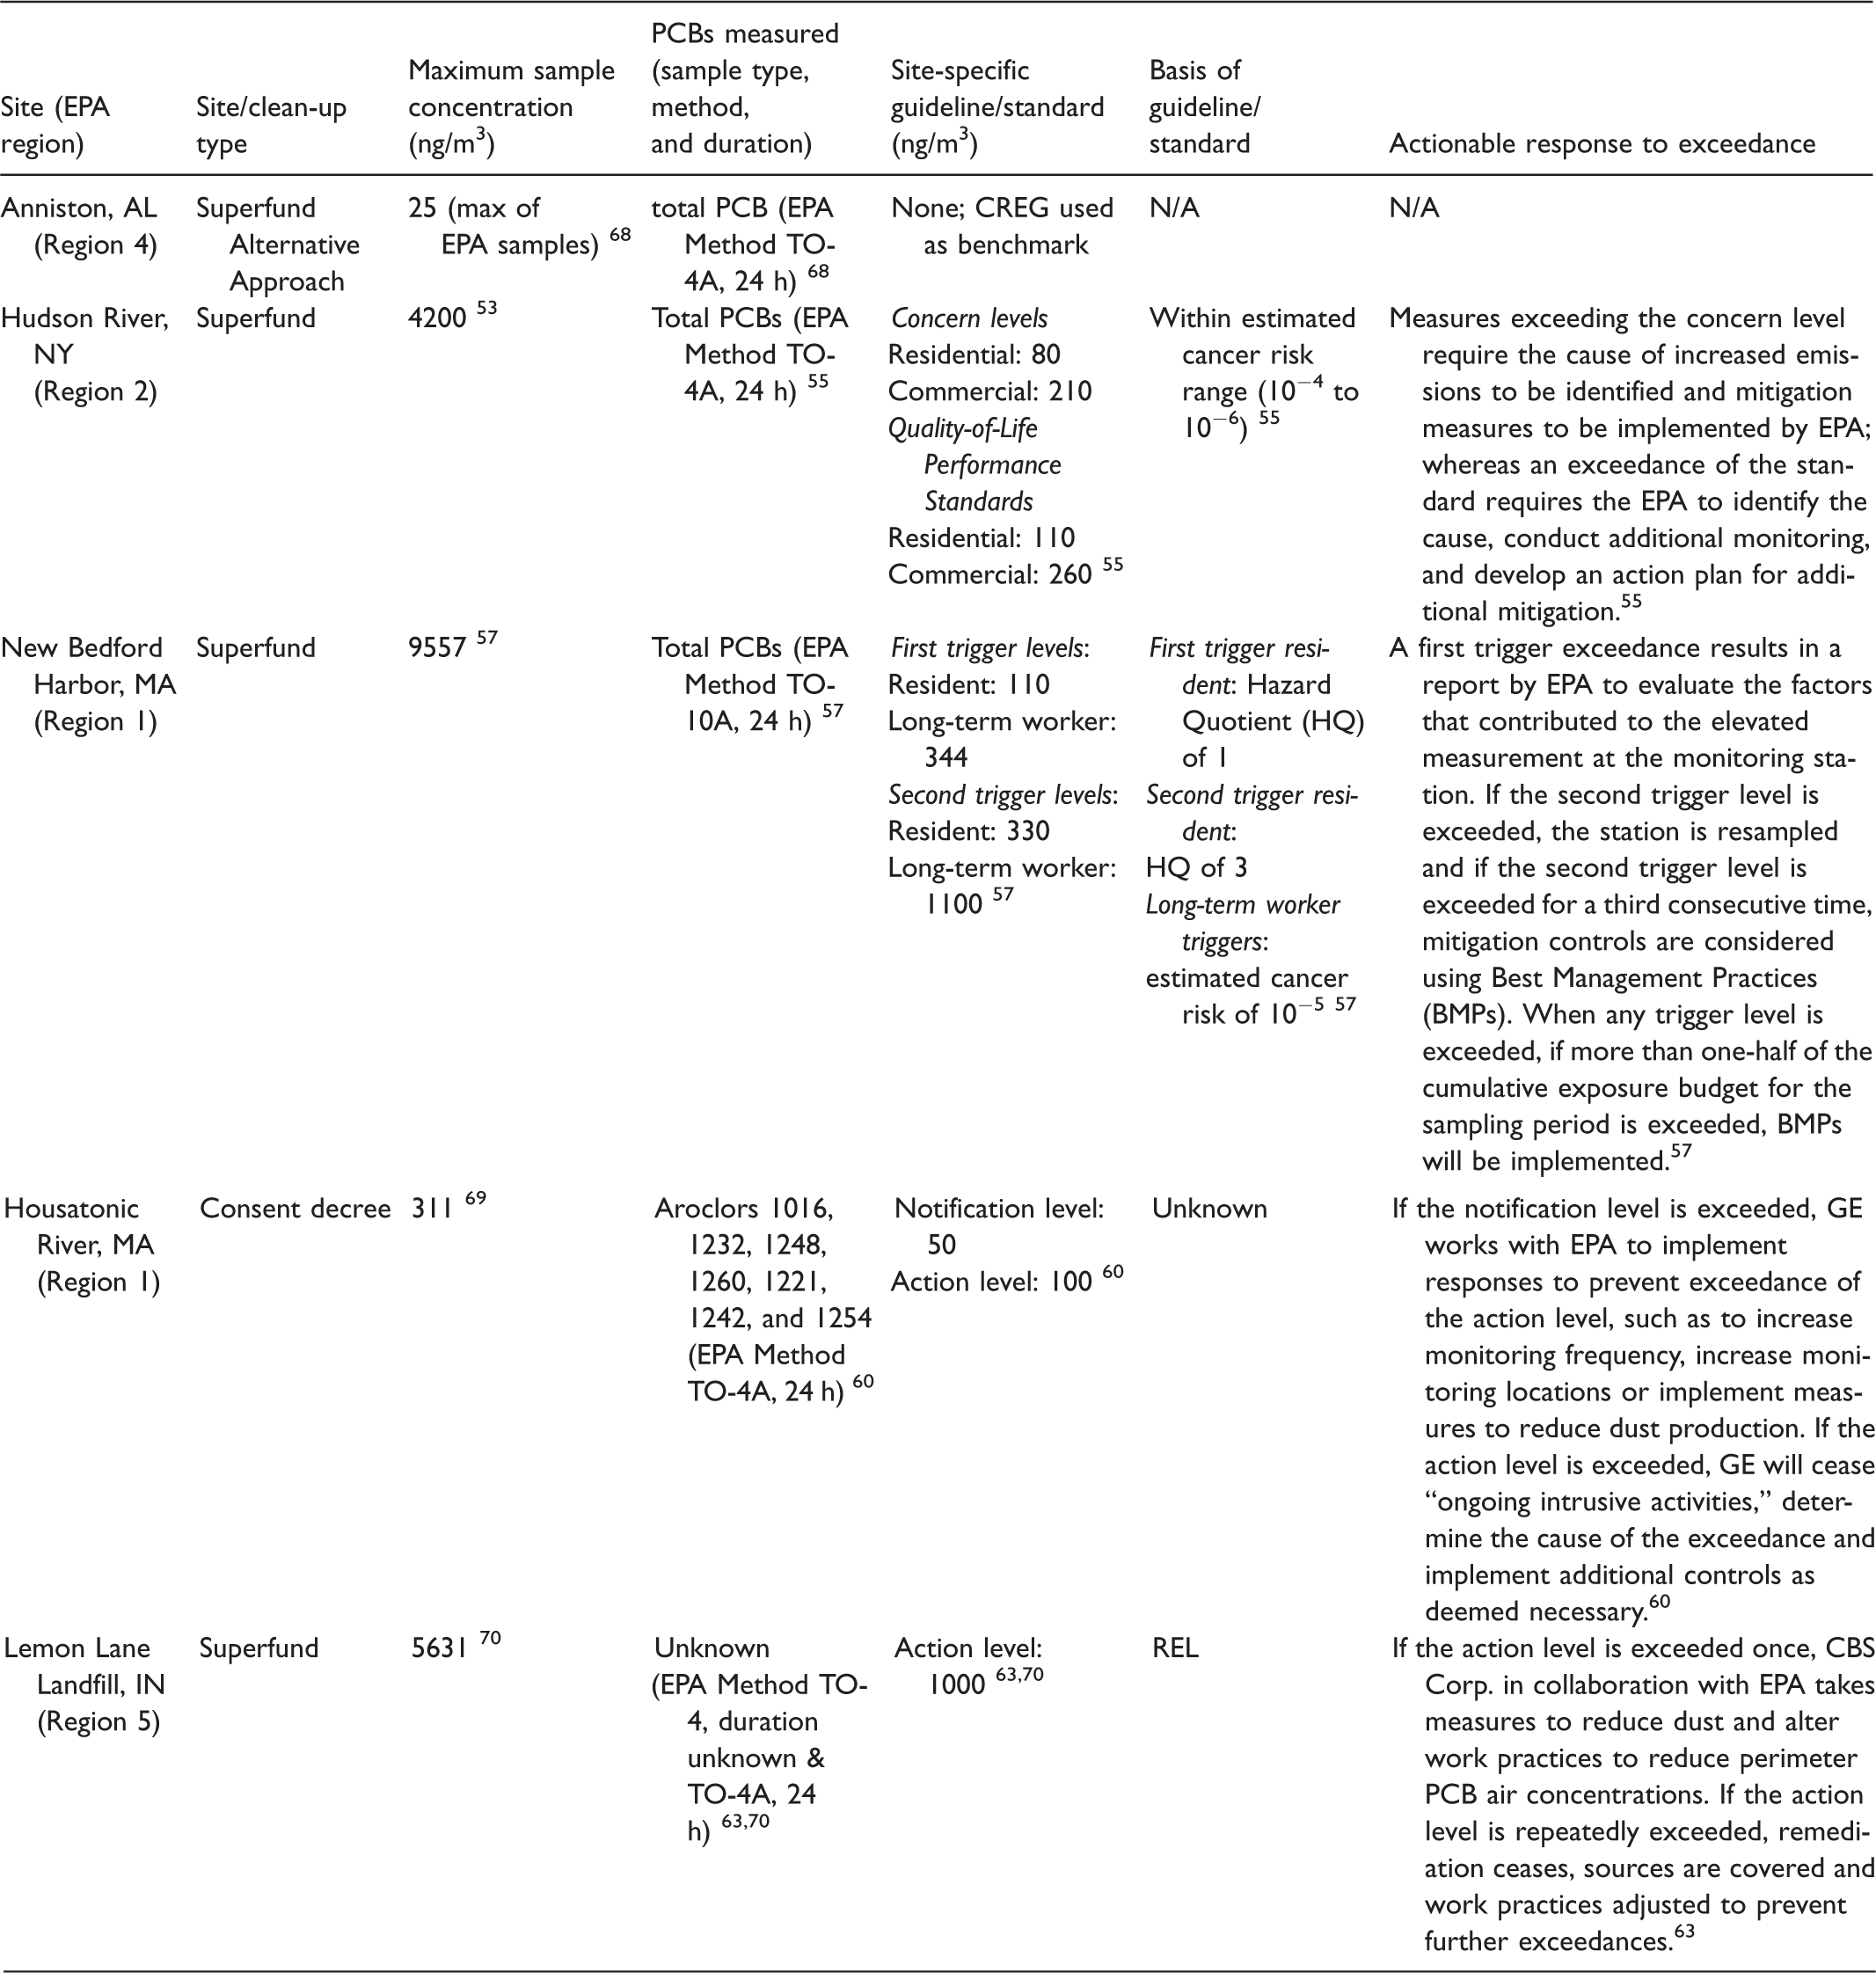
Note. GE = General Electric; EPA = Environmental Protection Agency; CREG = Cancer Risk Evaluation Guide; PCB = polychlorinated biphenyls; REL = Recommended Exposure Limit.
New Bedford Harbor, Massachusetts. Due to extensive PCB contamination, New Bedford Harbor was designated a Superfund site in 1982. The 18,000 acre New Bedford Harbor marine site is one of the nation’s largest contaminated sites. From 1940 until 1978, Aerovox Corporation and Cornell Dublier Electronics had factories on the New Bedford waterfront and discharged waste contaminated with high concentrations of PCBs directly into the harbor or into the sewer system which drained into the harbor. 56 A record of decision was issued in 1998 for New Bedford Harbor, which identified dredging as the solution to the contamination. In 2015, EPA updated its air monitoring plan. Risk-based goals for PCBs in ambient air were set, and the first trigger level for residents was derived from the quality-of-life performance standard developed for the Hudson River Superfund Site (Table 3). 57
Pittsfield/Housatonic River, Massachusetts. From 1932 to 1977, General Electric (GE) manufactured electrical transformers containing PCBs in Pittsfield, MA. GE’s disposal of PCBs led to contamination in Pittsfield and of the entirety of the 150-mile Housatonic River into Connecticut. 58 In 1999, the EPA, the U.S. Department of Justice, MassDEP, the State of Connecticut Department of Environmental Protection, the U.S. Department of the Interior, the National Oceanic and Atmospheric Administration, the City of Pittsfield, the Pittsfield Economic Development Authority, and GE entered into a consent decree to clean-up the area instead of listing it as a Superfund site. 59 The site requires clean-up of twenty contaminated areas outside the river, five groundwater areas, and three segments of the river. 58 The basis of the notification and action levels for PCBs in air at this site are not known and could not be traced to previous site documents; only one report explained “these are the same levels established by EPA for other remediation activities at the GE Pittsfield/Housatonic River Site” (Table 3). 60
Lemon Lane Landfill, Indiana. From 1933 until 1964, Lemon Lane Landfill in the city of Bloomington, IN, was filled with municipal and industrial waste. From 1958 until 1964, many Westinghouse Electric Corporation’s (now CBS Corp.) electrical capacitors were disposed of at Lemon Lane and during this time frame, PCBs leaked from the capacitors as metal scavengers broke them open to reclaim valuable parts. The 10-acre landfill was unlined and runoff was not contained. 61 The landfill was designated a Superfund site in 1983. 62 Remedies to treat the PCB sources were completed in 2000 and included removal of contaminated soil, capacitor parts, capping the landfill, and fencing and monitoring of the landfill cap. 61 Additional remedial action was carried out in 2010 and the same action level established in 2000 for PCBs in air was used in 2010. 63
Evaluation of Risk Management Approaches Utilized at Contaminated Sites
The five sites vary considerably in regard to the PCB concentrations measured, the site-specific guidelines/standards (and the populations to which they apply), as well as the basis of these guidelines/standards (Table 3). The types of PCBs measured, the methods used for PCB monitoring, and the response to exceedances of standards/guidelines were comparatively less variable by site (Table 3). It is the measured concentrations that are compared to the guidelines/standards at the sites; however, maximum concentrations are presented in Table 3 to aid in characterizing and comparing the magnitude of measured concentrations at the five sites. Additionally, the location (and timing) of maximum measurements in relation to the site may have varied across sites. Overall, maximum ambient air concentrations of PCBs and response actions to exceedances of site-specific standards/guidelines were different at the five sites.
Risks are assessed and managed for PCBs in air released from the sites (or from remedial actions) at all five contaminated sites. The complexities of PCB-contaminated air and sediment at each site are similar. In 2001, Congress and the EPA requested that the National Research Council (NRC) develop “a consistent and clear process for assessing the risk from PCB-contaminated sediments and the risks that might be posed by the various technologies that may be used to manage them.” 64 However, the NRC committee was unable to provide a prescriptive process uniformly applicable to contaminated sites across the country. Instead, the committee concluded that the most important consideration should be the management of overall risks to humans and the ecology, and therefore, the risk assessment and management of a site needs to be site-specific. 64 As displayed in Table 3, a range of standards and guidelines (and the basis for them) were implemented at the five contaminated sites to assess ambient air exposure to PCBs, which could be argued to reflect the site-specific nature of risk assessment and management suggested by the NRC.
Nonetheless, these differences are likely driven by a variety of factors that include scientific, technological, economic, as well as political forces. For example, New Bedford Harbor, Hudson River, and Lemon Lane sites all have federal Superfund status and PCB concentrations have been measured in the 1000’s of ng/m3. However, the Lemon Lane action level is much higher than the action levels at the New Bedford Harbor and Hudson River sites. Similarly, among the unofficial Superfund status sites with much lower PCB concentrations measured, the Anniston site has no actionable standard or guideline and the concern and action levels at the Pittsfield/Housatonic River site are more protective (lower) than at the official Superfund sites (Table 3). Interestingly, the higher the measured ambient air PCB concentrations at a site, the less protective the guidelines/standards (Table 3). Risk assessors/managers at sites in Massachusetts and New York, states in which state-level guidelines exist, did not use their state-level guidelines at their sites, deferring instead to the oversight by EPA, likely because of the sites’ federal Superfund designation.
The different guidelines/standards that exist at these five sites result in different levels of health protection of workers and residents nearby. The ambient air concentration guidelines/standards at the Anniston and Lemon Lane sites are less protective than those at the New Bedford Harbor, Housatonic River, or Hudson River sites. While the CREG value used at the Anniston site is based on a protective target risk level of 10−6, no evidence of an actionable plan to correct a concerning air concentration was found. The Lemon Lane site’s guideline is also not protective for nearby residents because the guideline is equal to the NIOSH guideline for occupational exposures to PCBs; an inappropriate application of the guideline because residential (adult and child) exposure frequency and duration are greater than occupational exposures and NIOSH acceptable risk limits are higher than those used by EPA.
The remaining three sites (Hudson River, Housatonic, and New Bedford Harbor) are on the more protective end of the spectrum of air guidelines/standards because of the two sets of actionable levels backed up by response plans (Table 3). The Hudson River performance standards were determined to be within EPA’s acceptable risk range and then 80% of the standard was calculated to determine the concern levels at which protective measures would be taken. 55 The first and second triggers at New Bedford Harbor appear to be analogous to the Hudson River’s concern level and standard, respectively; however, the second trigger for residents at New Bedford Harbor is associated with a hazard quotient of “3” rather than the hazard quotient of “1” which is used as a benchmark when no adverse health effects would be expected. The Hudson River response plan is also more protective than the New Bedford Harbor plan because action is taken upon the first exceedance of the concern level at the Hudson River site, whereas actions to mitigate are not taken until the second trigger is exceeded twice at New Bedford Harbor (Table 3).
Despite the differences across the sites, we observed some commonalities. Four of the five sites (Table 3) have actionable plans in place to respond to exceedances of standards/guidelines. Four out of five sites also monitored for total PCBs and used the same EPA method to obtain PCB air samples (Table 3). And at all sites, there is a lack of consideration of non-site PCB air exposures in the standards/guideline. In the early days of environmental site investigations, little may have been known about the presence of PCBs in building materials and inhalation of associated PCBs in the residential or school indoor environment. However, recent investigations demonstrate and characterize these PCBs in schools and scientists have estimated that they may make up a considerable portion of a community’s exposure to airborne PCBs. 10 If this is in fact the case, then the current guidelines and standards set for PCBs at the five sites do not adequately protect communities because the risk levels are set such that all exposure to PCBs in air comes from the hazardous waste site. If the contribution of PCBs to people’s total exposure is both from indoor and outdoor sources, then the guidelines should be lower to account for this, consistent with aggregate exposure and cumulative risk principles. 65
Recommendations and Conclusions
Among the five sites presented, the nature of the contamination, the remediation, the settings, and the affected communities are diverse. Similarly, the main conclusion that we draw from information in Table 3 and the discussion above is that there are more differences than commonalities in air monitoring and risk management at the five sites. In an ideal world, the protection of public health is not place-based. In reality, Comprehensive Environmental Response, Compensation, and Liability Act currently allows a range of human health risk (10−4 to 10−6) to exist at Superfund sites, which implicitly permits inequities in public health protection across the country. While this status quo remains, the following recommendations are offered to help us progress towards a more health protective nation.
National regulations for monitoring and data sharing can promote more equitable protection of public health, leverage knowledge among risk managers across the country, and optimize the limited environmental public health resources. The case studies presented in this article measured PCBs for 24 h of active sampling with EPA Methods TO-4A and TO-10A, and in regard to monitoring for total PCBs, only at the Housatonic River site were total PCBs not measured. If total PCBs (or whatever measurement of PCBs is most appropriate after a comprehensive analysis for these purposes) are measured across all sites using the same methodology (i.e., what is sampled, samplers used, duration, and protocol), national cross site comparisons can be made with confidence. Additionally, monitoring of PCBs in air at sites relies solely on active samplers. Passive sampling has remained in the research sphere and is not yet adopted by federal and state decision makers. Consideration of incorporating advancements in cost-effective passive sampling methodologies for measuring PCBs in air 15 should be considered in the monitoring methodology. Side by side comparisons of methods should be evaluated and passive monitoring methods should be validated.
Once monitoring methods and associated data are consistent across sites, data-sharing would enable risk assessors/managers at resource-limited sites to learn from and take advantage of knowledge gained at other potentially less resource-limited sites similar to their own (e.g., New Bedford Harbor incorporated information from Hudson River guidelines into theirs). Ideally, the creation of a national database of ambient air PCB concentrations could increase communication, collaboration, and sharing of lessons learned between risk assessors/managers to protect the health of those working or living near PCB-contaminated sites across the nation.
While monitoring and data-sharing can provide human health risk assessors with the tools to determine if exposure via inhalation to workers and residents near their site is significant, health-protective risk assessments cannot be conducted without dose-response values derived for non-cancer health outcomes. To better evaluate the human health risk posed to these individuals and protect public health consistently across sites, and to develop science-based non-cancer guidelines, risk assessors need EPA to publish an RfC for PCBs. Finally, current guidelines for PCBs in air reflect the notion that the hazardous waste site is the single source of daily exposure to airborne PCBs. These guidelines do not consider the contribution of indoor air to PCB exposure, and thus from a cumulative risk perspective, these may not be protective of public health.
Footnotes
Acknowledgments
The contents are solely the responsibility of the grantee and do not necessarily represent the official views of NIEHS.
Declaration of Conflicting Interests
The author(s) declared no potential conflicts of interest with respect to the research, authorship, and/or publication of this article.
Funding
The author(s) disclosed receipt of the following financial support for the research, authorship, and/or publication of this article: This research was supported by the National Institute of Environmental Health Sciences (NIEHS) training grant T32 ES014562 and the Boston University Superfund Research Program Grant P42ES007381–19S.